african development fund special purpose financial
TRANSCRIPT

African Development FundSpecial Purpose Financial Statements and
Report of the Independent Auditor Year ended December 31, 2011
Statement of Net Development Resources 146Statement of Income and Expenses and Other Changes in Development Resources 147
Statement of Comprehensive Income 148Statement of Cash Flows 149
Notes to the Special Purpose Financial Statements 150Report of the Independent Auditor 166
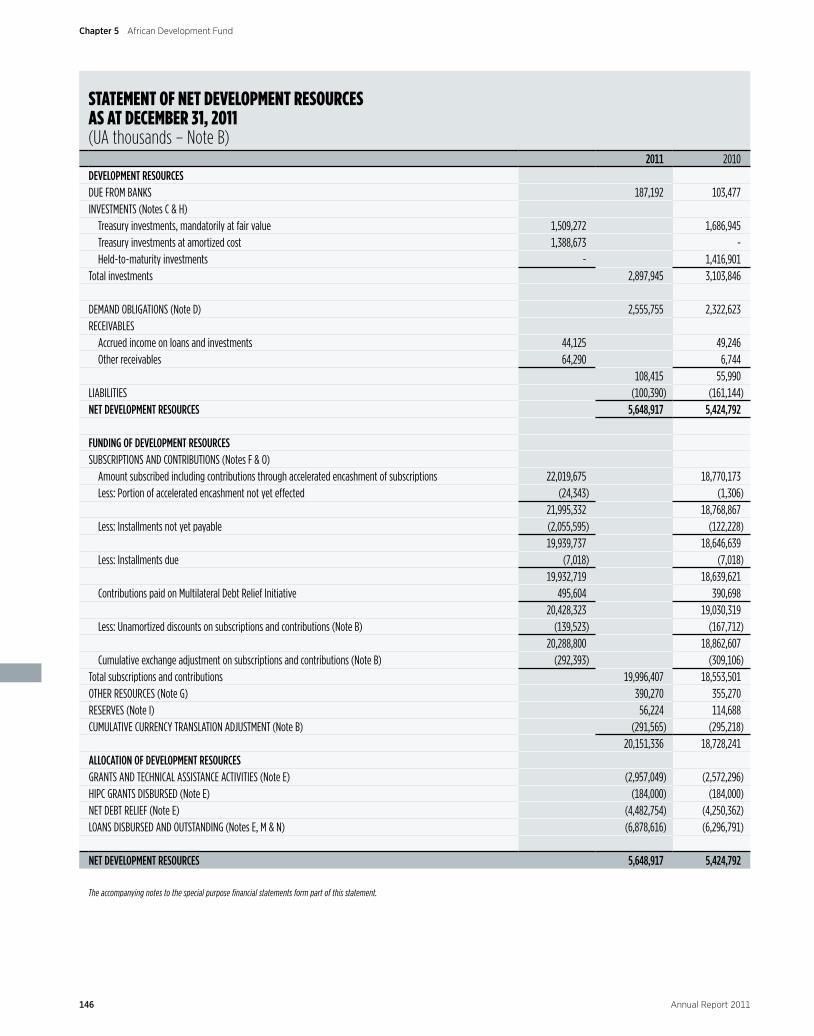
STATEmENT OF NET DEVELOPmENT rESOUrCES AS AT DECEmBEr 31, 2011(UA thousands – Note B)
2011 2010DEVELOPMENT RESOURCES DUE FROM BANKS 187,192 103,477INVESTMENTS (Notes C & H)
Treasury investments, mandatorily at fair value 1,509,272 1,686,945Treasury investments at amortized cost 1,388,673 -Held-to-maturity investments - 1,416,901
Total investments 2,897,945 3,103,846
DEMAND OBLIGATIONS (Note D) 2,555,755 2,322,623RECEIVABLES
Accrued income on loans and investments 44,125 49,246Other receivables 64,290 6,744
108,415 55,990LIABILITIES (100,390) (161,144)NET DEVELOPMENT RESOURCES 5,648,917 5,424,792
FUNDING OF DEVELOPMENT RESOURCESSUBSCRIPTIONS AND CONTRIBUTIONS (Notes F & O)
Amount subscribed including contributions through accelerated encashment of subscriptions 22,019,675 18,770,173Less: Portion of accelerated encashment not yet effected (24,343) (1,306)
21,995,332 18,768,867Less: Installments not yet payable (2,055,595) (122,228)
19,939,737 18,646,639Less: Installments due (7,018) (7,018)
19,932,719 18,639,621Contributions paid on Multilateral Debt Relief Initiative 495,604 390,698
20,428,323 19,030,319Less: Unamortized discounts on subscriptions and contributions (Note B) (139,523) (167,712)
20,288,800 18,862,607Cumulative exchange adjustment on subscriptions and contributions (Note B) (292,393) (309,106)
Total subscriptions and contributions 19,996,407 18,553,501OTHER RESOURCES (Note G) 390,270 355,270RESERVES (Note I) 56,224 114,688CUMULATIVE CURRENCY TRANSLATION ADJUSTMENT (Note B) (291,565) (295,218)
20,151,336 18,728,241ALLOCATION OF DEVELOPMENT RESOURCESGRANTS AND TECHNICAL ASSISTANCE ACTIVITIES (Note E) (2,957,049) (2,572,296)HIPC GRANTS DISBURSED (Note E) (184,000) (184,000)NET DEBT RELIEF (Note E) (4,482,754) (4,250,362)LOANS DISBURSED AND OUTSTANDING (Notes E, M & N) (6,878,616) (6,296,791)
NET DEVELOPMENT RESOURCES 5,648,917 5,424,792
The accompanying notes to the special purpose financial statements form part of this statement.
146 Annual Report 2011
Chapter 5 African Development Fund
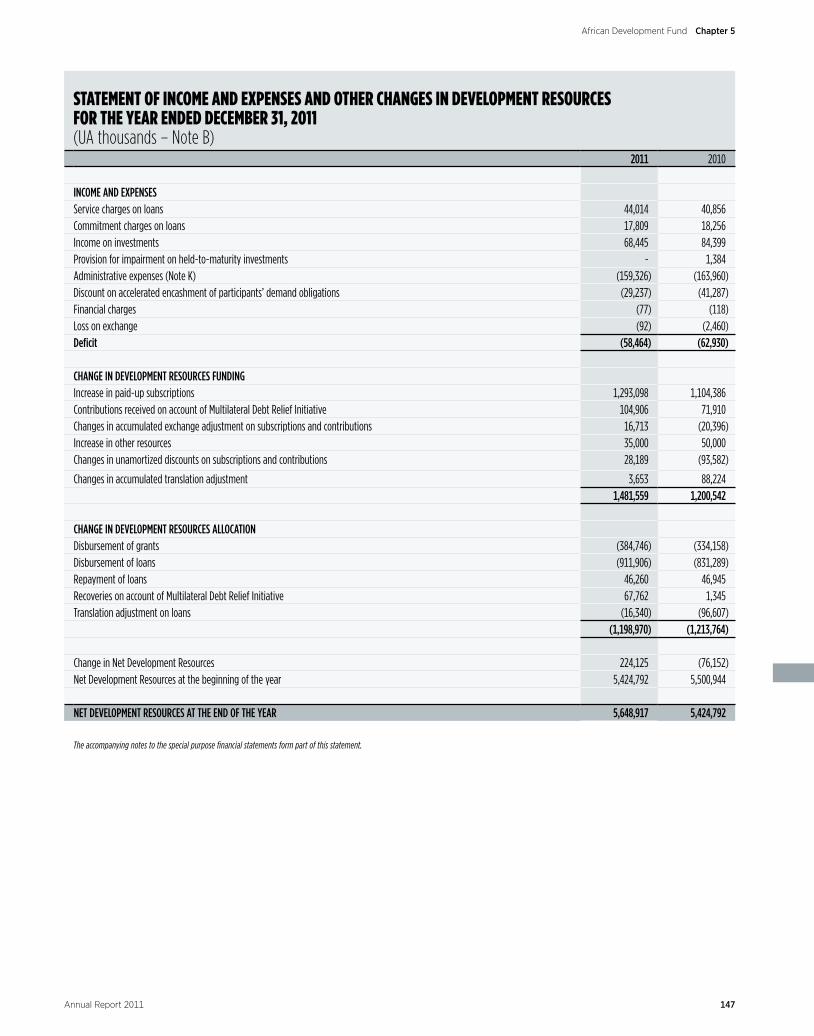
STATEmENT OF INCOmE AND EXPENSES AND OTHEr CHANGES IN DEVELOPmENT rESOUrCES FOr THE YEAr ENDED DECEmBEr 31, 2011(UA thousands – Note B)
2011 2010
INCOME AND EXPENSES Service charges on loans 44,014 40,856Commitment charges on loans 17,809 18,256Income on investments 68,445 84,399Provision for impairment on held-to-maturity investments - 1,384Administrative expenses (Note K) (159,326) (163,960)Discount on accelerated encashment of participants’ demand obligations (29,237) (41,287)Financial charges (77) (118)Loss on exchange (92) (2,460)Deficit (58,464) (62,930)
CHANGE IN DEVELOPMENT RESOURCES FUNDINGIncrease in paid-up subscriptions 1,293,098 1,104,386Contributions received on account of Multilateral Debt Relief Initiative 104,906 71,910Changes in accumulated exchange adjustment on subscriptions and contributions 16,713 (20,396)Increase in other resources 35,000 50,000Changes in unamortized discounts on subscriptions and contributions 28,189 (93,582)
Changes in accumulated translation adjustment 3,653 88,224 1,481,559 1,200,542 CHANGE IN DEVELOPMENT RESOURCES ALLOCATIONDisbursement of grants (384,746) (334,158)Disbursement of loans (911,906) (831,289)Repayment of loans 46,260 46,945Recoveries on account of Multilateral Debt Relief Initiative 67,762 1,345Translation adjustment on loans (16,340) (96,607)
(1,198,970) (1,213,764) Change in Net Development Resources 224,125 (76,152)Net Development Resources at the beginning of the year 5,424,792 5,500,944
NET DEVELOPMENT RESOURCES AT THE END OF THE YEAR 5,648,917 5,424,792
The accompanying notes to the special purpose financial statements form part of this statement.
147Annual Report 2011
Chapter 5African Development Fund
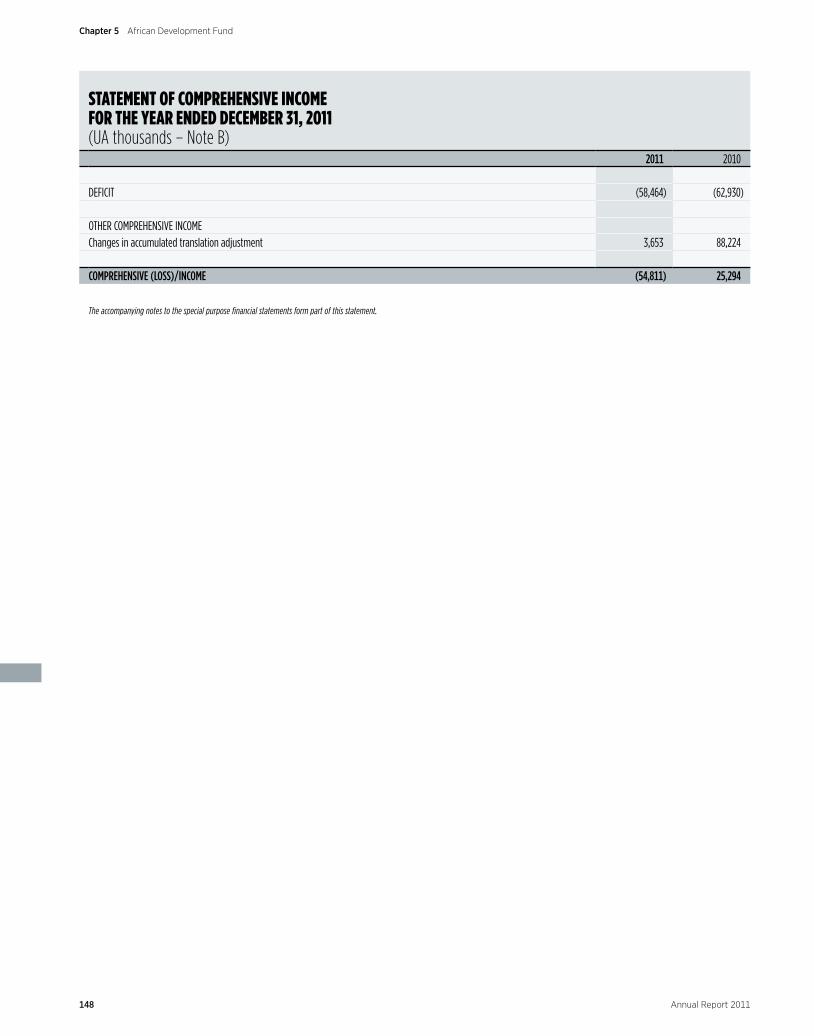
STATEmENT OF COmPrEHENSIVE INCOmE FOr THE YEAr ENDED DECEmBEr 31, 2011(UA thousands – Note B)
2011 2010
DEFICIT (58,464) (62,930)
OTHER COMPREHENSIVE INCOMEChanges in accumulated translation adjustment 3,653 88,224
COMPREHENSIVE (LOSS)/INCOME (54,811) 25,294
The accompanying notes to the special purpose financial statements form part of this statement.
148 Annual Report 2011
Chapter 5 African Development Fund
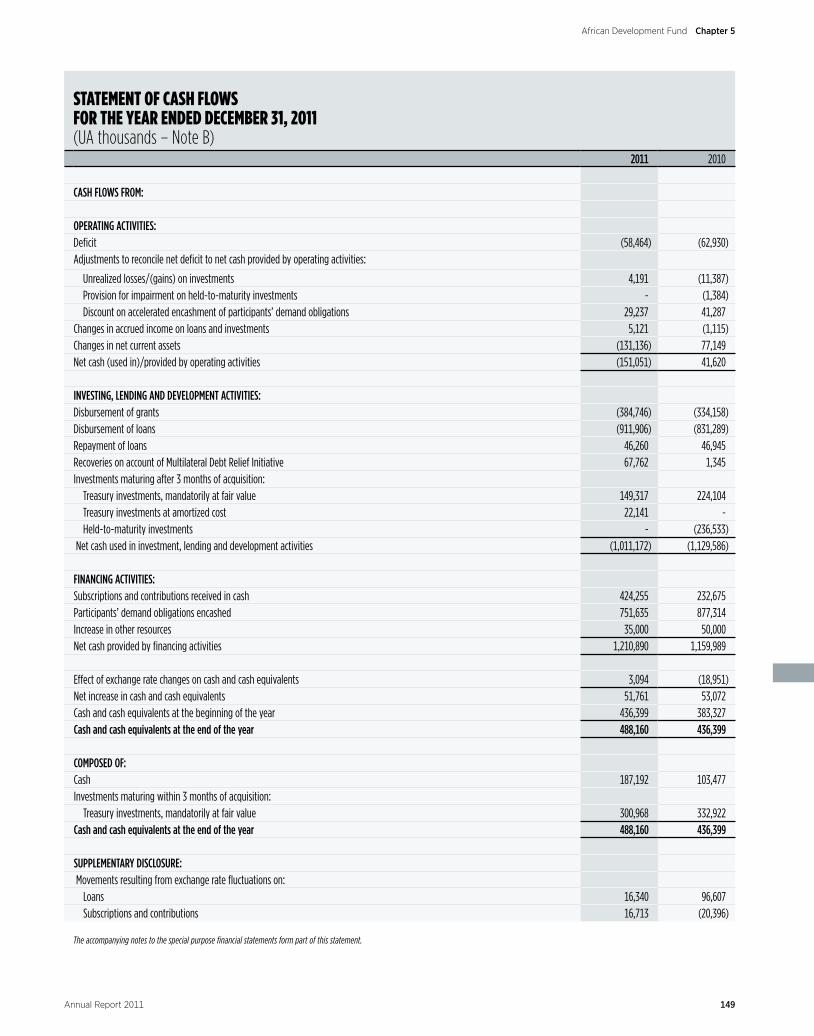
STATEmENT OF CASH FLOWS FOr THE YEAr ENDED DECEmBEr 31, 2011(UA thousands – Note B)
2011 2010
CASH FLOWS FROM:
OPERATING ACTIVITIES: Deficit (58,464) (62,930)Adjustments to reconcile net deficit to net cash provided by operating activities:
Unrealized losses/(gains) on investments 4,191 (11,387)Provision for impairment on held-to-maturity investments - (1,384)Discount on accelerated encashment of participants’ demand obligations 29,237 41,287
Changes in accrued income on loans and investments 5,121 (1,115)Changes in net current assets (131,136) 77,149Net cash (used in)/provided by operating activities (151,051) 41,620
INVESTING, LENDING AND DEVELOPMENT ACTIVITIES:Disbursement of grants (384,746) (334,158)Disbursement of loans (911,906) (831,289)Repayment of loans 46,260 46,945Recoveries on account of Multilateral Debt Relief Initiative 67,762 1,345Investments maturing after 3 months of acquisition:
Treasury investments, mandatorily at fair value 149,317 224,104Treasury investments at amortized cost 22,141 -Held-to-maturity investments - (236,533)
Net cash used in investment, lending and development activities (1,011,172) (1,129,586)
FINANCING ACTIVITIES:Subscriptions and contributions received in cash 424,255 232,675Participants’ demand obligations encashed 751,635 877,314Increase in other resources 35,000 50,000Net cash provided by financing activities 1,210,890 1,159,989
Effect of exchange rate changes on cash and cash equivalents 3,094 (18,951)Net increase in cash and cash equivalents 51,761 53,072Cash and cash equivalents at the beginning of the year 436,399 383,327Cash and cash equivalents at the end of the year 488,160 436,399
COMPOSED OF:Cash 187,192 103,477Investments maturing within 3 months of acquisition:
Treasury investments, mandatorily at fair value 300,968 332,922Cash and cash equivalents at the end of the year 488,160 436,399
SUPPLEMENTARY DISCLOSURE: Movements resulting from exchange rate fluctuations on:
Loans 16,340 96,607Subscriptions and contributions 16,713 (20,396)
The accompanying notes to the special purpose financial statements form part of this statement.
149Annual Report 2011
Chapter 5African Development Fund
NOTES TO THE SPECIAL PUrPOSE FINANCIAL STATEmENTS YEAr ENDED DECEmBEr 31, 2011
NOTE A – PURPOSE, ORGANIZATION AND RESOURCES
Purpose and OrganizationThe African Development Fund (ADF or the Fund) was established in 1972 as an international institution to assist the African Development Bank (ADB or the Bank) in contributing to the economic and social development of the Bank’s regional members, promote cooperation and increased international trade particularly among the Bank’s members, and to provide financing on concessional terms for such purposes.
By its resolution F/BG/2010/03 of May 27, 2010, the Board of Governors increased the membership of the Board of Directors of ADF from twelve (12) to fourteen (14), made up of seven (7) members selected by the Bank and seven (7) members selected by State Participants. The Board of Directors reports to the Board of Governors, which is made up of representatives of the State Participants and the ADB. The ADB exercises fifty percent (50%) of the voting powers in the ADF and the President of the Bank is the ex-officio President of the Fund.
The ADB, the Nigeria Trust Fund (NTF), which is a special fund administered by the ADB, and the ADF are collectively referred to as the Bank Group. The principal purpose of the ADB is to promote economic and social development in its regional member countries. The ADB finances development projects and programs in its regional member states. The ADB also participates in the selection, study and preparation of projects contributing to the development of its member countries and where necessary pro-vides technical assistance. The NTF was established under an agreement between the Bank and the Federal Republic of Nigeria to further support the development efforts of ADB regional member countries, particularly the lesser-developed countries. The assets and liabilities of the ADB and of the NTF are separate and independent of those of the ADF. Furthermore, the ADF is not liable for their respective obligations. Transactions with these affiliates, where there are, are disclosed in the notes that follow.
ResourcesThe resources of the Fund consist of subscriptions by the Bank, subscriptions and contributions by State Participants, other resources received by the Fund and funds derived from operations or otherwise accruing to the Fund. The initial resources of the Fund consisted of subscriptions by the Bank and the original State Participants to the Agreement Establishing the Fund (the Agreement). Thereafter, the resources have been replenished through Special and General increases of subscriptions and contributions.
NOTE B – BASIS OF PREPARATION AND SIGNIFICANT ACCOUNTING POLICIES
Due to its nature and organization, the Fund presents its financial statements on a special purpose basis. The Special Purpose Financial Statements are prepared for the specific purpose of reflecting the net development resources of the Fund and are not intended to be a presentation in accordance with International Financial Reporting Standards. Net development resources represent resources available to fund loan and grant commitments and comprise primarily cash, marketable investments and demand obligations of State Participants. These special purpose financial statements have been prepared to comply with Article 35(1) of the Agreement establishing the Fund, which requires that the Fund circulates, at appropriate intervals, a summary of its financial position and income and expenditure statement showing the results of its operations.
The significant accounting policies used in the preparation of the Fund’s special purpose financial statements are as follows:
Monetary Basis of the Special Purpose Financial StatementsThe special purpose financial statements are expressed in Units of Account (UA). Article 1 of the Agreement defined a Unit of Account as having a value of 0.81851265 grams of fine gold.
150 Annual Report 2011
Chapter 5 African Development Fund
On April 1, 1978, when the second amendment to the Articles of the Agreement of the International Monetary Fund (IMF) came into effect, gold was abolished as a common denominator of the international monetary system. Computations relating to the currencies of IMF members were thereafter made on the basis of the Special Drawing Right (SDR) for purposes of applying the provisions of the Articles of the IMF. The Fund’s Unit of Account was therefore based on its relationship to the SDR at the time of establishment of the Fund. This was 1 Unit of Account equal to SDR 0.921052.
Subsequently, on November 16, 1992, the Board of Governors decided by Resolution F/BG/92/10 to redefine the Fund’s Unit of Account to be equivalent to the UA of the ADB, which is defined as equivalent to the Special Drawing Right of the IMF. In compli-ance with this Resolution, the Board of Directors, on June 22, 1993, adopted January 1, 1993, as the date for the entry into effect of the Resolution, and the Fund’s UA has since then been defined as equal to the Bank’s UA.
The Fund conducts its operations in the currencies of its State Participants. Income and expenses are converted into UA at the rate prevailing on the date of the transaction. Assets and liabilities are translated into UA at rates prevailing at the date of the Statement of Net Development Resources. Translation differences are debited or credited to the Cumulative Currency Translation Adjustment. Translation gains and losses on subscriptions received are credited or debited to the Cumulative Exchange Adjustment on Subscriptions and contributions. Where currencies are converted into any other currency, the resulting gains or losses are included in income.
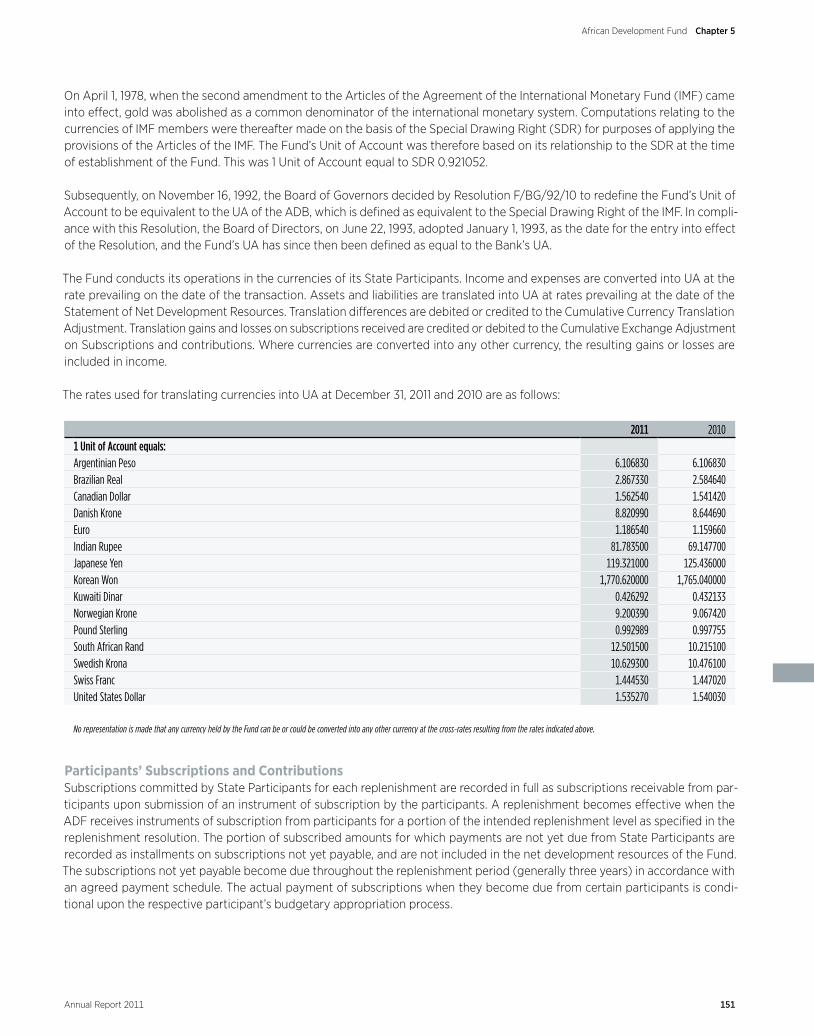
The rates used for translating currencies into UA at December 31, 2011 and 2010 are as follows:
2011 20101 Unit of Account equals:Argentinian Peso 6.106830 6.106830Brazilian Real 2.867330 2.584640Canadian Dollar 1.562540 1.541420Danish Krone 8.820990 8.644690Euro 1.186540 1.159660Indian Rupee 81.783500 69.147700Japanese Yen 119.321000 125.436000Korean Won 1,770.620000 1,765.040000Kuwaiti Dinar 0.426292 0.432133Norwegian Krone 9.200390 9.067420Pound Sterling 0.992989 0.997755South African Rand 12.501500 10.215100Swedish Krona 10.629300 10.476100Swiss Franc 1.444530 1.447020United States Dollar 1.535270 1.540030
No representation is made that any currency held by the Fund can be or could be converted into any other currency at the cross-rates resulting from the rates indicated above.
Participants’ Subscriptions and ContributionsSubscriptions committed by State Participants for each replenishment are recorded in full as subscriptions receivable from par-ticipants upon submission of an instrument of subscription by the participants. A replenishment becomes effective when the ADF receives instruments of subscription from participants for a portion of the intended replenishment level as specified in the replenishment resolution. The portion of subscribed amounts for which payments are not yet due from State Participants are recorded as installments on subscriptions not yet payable, and are not included in the net development resources of the Fund. The subscriptions not yet payable become due throughout the replenishment period (generally three years) in accordance with an agreed payment schedule. The actual payment of subscriptions when they become due from certain participants is condi-tional upon the respective participant’s budgetary appropriation process.
151Annual Report 2011
Chapter 5African Development Fund
The subscriptions receivable are settled through payment of cash or deposit of non-negotiable, non-interest bearing demand notes. The notes are encashed by the Fund as provided in an encashment program agreed to at the time of the replenishment.
Starting with the ADF-9 replenishment, participants were given the option of an early payment of cash in an amount equivalent to the net present value of their entire subscriptions and contributions. Upon receipt of such cash payments, participants are credited with the full face value of their entire subscriptions, and in agreement with the Fund, such cash amounts received are invested and the income generated thereon is retained by the Fund. A discount, calculated as the difference between the face value of the subscriptions and the cash amount received, is initially recorded to represent the interest expected to be earned on the cash received from State Participants who opted for the accelerated encashment program. Such discount is amortized over the projected encashment period, to recognize the effective contributions to equity by the relevant participant over and above the initial cash advanced.
By its resolutions F/BG/2006/12 and F/BG/2006/13 of May 18, 2006 and August 31, 2006 respectively, the Board of Governors of the Fund authorized the Board of Directors to approve the participation of the ADF in the Multilateral Debt Relief Initiative (MDRI) and in that regard the Board of Governors also authorized an increase in the resources of the ADF to provide full and timely compensation for the debt cancelation under the MDRI subject to the attainment of the following effectiveness thresholds:
1) Receipt of Instruments of Commitment from donors covering an aggregate amount equivalent to at least seventy percent (70%) of the total cost of debt relief for the first group of 14 post-completion point Heavily Indebted Poor Countries (HIPCs); and
2) Receipt of unqualified Instruments of Commitments from donors for an amount not less than the equivalent of at least sev-enty five percent (75%) of the total cost of debt relief incurred during the remainder of ADF-10 period.
Upon satisfaction of the above two thresholds, the Board of Directors of the Fund approved the effectiveness of the MDRI with effect from September 1, 2006. To ensure full compensation for foregone reflows as a result of the upfront debt cancelation, the ADF governing bodies endorsed Management’s proposal for a compensation scheme over the 50-year period of the Initiative. Donors will contribute additional resources to ADF, equivalent to the foregone debt service (service charges and principal) for each replenishment period, by submitting pledges over the life of the initiative. The compensatory financing arrangements will take the form of a general increase in the contribution of State Participants pursuant to Article 7 of the Agreement Establishing ADF. The contributions received from State Participants under the compensatory financing arrangements shall not be counted as part of the burden share for the replenishment period in which such resources are received, but shall carry voting rights in the same manner as normal subscriptions. Such contributions are separately disclosed within the total of subscriptions and contri-butions in the Statement of Net Development Resources.
Maintenance of Value of Currency HoldingsPrior to the second general replenishment, subscriptions were denominated in UA and were subject to Article 13 of the Agreement which provided that, whenever the par value in the IMF of the currency of a State Participant is reduced in terms of the UA or its foreign exchange value has, in the opinion of the Fund, depreciated to a significant extent within that participant’s territory, that participant shall pay to the Fund within a reasonable time an amount of its currency required to maintain the value, as of the time of subscription, of the amount of such currency paid into the Fund by that participant and which has not been disbursed or exchanged for another currency.
Conversely, if the currency of a State Participant has increased in par value or appreciated in its foreign exchange value within that participant’s territory, the Fund shall return to that participant an amount of such currency equal to the increase in the value of the Fund’s holding of that currency which was received by it in payment of subscriptions, to the extent that these amounts have not been disbursed or exchanged for another currency.
In accordance with Board of Governors’ successive Resolutions governing the second through to the twelfth general replenish-ments of the Fund, which stipulated that Article 13 shall not apply to these general replenishments, subscribers to these replen-ishments fixed the amount of their subscriptions payable in national currencies in terms of agreed parities ruling at the date these replenishments came into force. Gains or losses arising on translating these subscriptions, when received, into UA are applied against subscriptions, with the offsetting debits or credits recorded as Cumulative Exchange Adjustment on Subscriptions (CEAS).
152 Annual Report 2011
Chapter 5 African Development Fund

Financial Assets Effective January 1, 2011, the Fund revised the classification of its financial assets into the following two categories: financial assets at amortized cost and financial assets at fair value through profit or loss (FVTPL). These classifications are determined based on the Fund’s business model. In accordance with the Fund’s business model, financial assets are held either for the stabilization of income through the management of net interest margin or for liquidity management. Management determines the classification of its financial assets at initial recognition.
i) Financial Assets at Amortized costA financial asset is classified at ’amortized cost’ only if the asset meets the objective of the Fund’s business model to hold the asset to collect the contractual cash flows; and the contractual terms give rise on specified dates to cash flows that are solely payments of principal and interest on the principal outstanding. The nature of any derivatives embedded in financial assets are considered in determining whether the cash flows of the investment are solely payment of principal and interest on the principal outstanding and are not accounted for separately.
If either of the two criteria above is not met, the financial asset is classified at "fair value through profit or loss".
Financial assets at amortized cost include loans and receivables on amounts advanced to borrowers and certain investments that meet the criteria of financial assets at amortized cost. Loans and receivables comprise demand obligations, accrued income and receivables from loans and investments and other sundry amounts as receivables. Loans and receivables are non-derivative financial assets with fixed or determinable payments that are not quoted in an active market. They arise when the Fund provides money, goods or services directly to a debtor with no intention of trading the receivable. Loans and receivables are carried at amortized cost using the effective interest method.
ii) Financial Assets at Fair Value through Profit or Loss (FVTPL)Financial assets that do not meet the amortized cost criteria as described above are measured at FVTPL. This category includes all treasury assets held for resale to realize short-term fair value changes. Gains and losses on these financial assets are report-ed in the income statement in the period in which they arise. Derivatives are also categorized as financial assets at fair value through profit or loss.
In addition, financial assets that meet amortized cost criteria can be designated and measured at FVTPL. A financial asset may be designated as at FVTPL upon initial recognition if such designation eliminates or significantly reduces a measurement or recognition inconsistency that would arise from measuring assets or liabilities or recognizing the gains and losses on them on different bases.
Cash and cash equivalents include amounts due from banks, demand deposits and other short-term, highly liquid investments that are readily convertible to a known amount of cash, are subject to an insignificant risk of changes in value and have a time to maturity upon acquisition of three months or less.
Purchases and sales of financial assets are recognized on a trade-date basis, which is the date the Fund commits to purchase or sell the asset. Loans are recognized when cash is advanced to the borrowers. Income on investments includes interest earned and unrealized gains and losses on financial assets at FVTPL.
Financial assets are derecognized when the rights to receive cash flows from the financial assets have expired or where the Fund has transferred substantially all risks and rewards of ownership.
InvestmentsThe Fund’s investment securities are classified either as financial assets at amortized cost or as at fair value. Investments classi-fied as financial assets at amortized cost include non-derivative financial assets with fixed or determinable payments and fixed maturities. These investments are carried and subsequently measured at amortized cost using the effective interest method. All other investment securities are classified as investments at fair value through profit or loss and measured at market value.
153Annual Report 2011
Chapter 5African Development Fund

Income on investments includes interest earned and unrealized gains and losses on the portfolio held at fair value through profit or loss. Purchases and sales of investments are recognized on a trade-date basis, which is the date at which the Fund commits to purchase or sell the investments.
Prior to January 1, 2011, the Fund’s investment securities were classified based on the Fund’s intention on the date of purchase. Securities which the Fund had the intent and ability to hold until maturity were classified as held-to-maturity and reported at amortized cost. Held-to-maturity investments are non-derivative financial assets with fixed or determinable payments and fixed maturities that the Fund’s management had the positive intention and ability to hold to maturity. The Fund’s investments not classified as held to maturity were classified as held-for-trading portfolio.
LoansThe Fund provides concessional funding for development purposes to the least-developed countries in Africa. Country eligibil-ity is determined by assessing gross national income per capita, creditworthiness and performance. Annual Debt Sustainability Analysis is used to determine the risk of debt distress of each beneficiary country and set appropriate financing terms.
The following categories of countries are eligible for ADF loans:• Category A countries are those not deemed creditworthy for non-concessional financing and whose income levels are below
the operational cut-off;• Category A countries are those not deemed creditworthy for non-concessional financing but whose income levels are above
the operational cut-off (gap countries);• Category B countries are those deemed creditworthy for non-concessional financing but whose income levels are below the
operational cut-off with access to a blend of ADB and ADF resources (blend countries).
Graduating countries are those that are graduating from the category of ADF borrowing countries to the category of ADB bor-rowing countries and the graduating policies are determined for each new ADF replenishment.
Disbursed and outstanding loans are not included in Net Development Resources. Accordingly, no provision for possible loan losses is required. The Fund places all loans to a borrower country in non-accrual status if the principal installments or service charges on any of the loans to such member country are overdue by 6 months or more, unless the Fund’s management determines that the overdue amount will be collected in the immediate future. Further, management may place a loan in non-accrual status even if it is not yet overdue by 6 months, if the specific facts and circumstances, including consideration of events occurring subsequent to the balance sheet date, warrant such action. On the date a borrower’s loans are placed in non-accrual status, unpaid charges that had previously been accrued on loans to the borrower are deducted from income on loans for that period. Charges on loans in non-accrual status are included in income only to the extent that payment of such charges has been received by the Fund.
GrantsIn addition to loans, the Fund is authorized to provide development financing in the form of grants. Prior to the ninth replenish-ment of the resources of the Fund, grant funds were granted for technical assistance activities only. With effect from the ninth replenishment, grants may be used for technical assistance as well as project financing. Grants, like loans, represent allocations of development resources and are accordingly treated as such in the Statement of Net Development Resources of the Fund.
The Fund participates in a Multilateral Debt Relief Initiative for addressing the debt problems of countries identified as heavily indebted poor countries (HIPCs) to help ensure that their reform efforts are not compromised by unsustainable external debt burdens. Under this initiative, creditors provide debt relief for those countries that demonstrate good policy performance over an extended period to bring their debt burdens to sustainable levels. As a part of this process, the HIPC Debt Initiative Trust Fund, (the Trust Fund) constituted by funds from donors, including the Bank Group, was established to help beneficiaries reduce their overall debt, including those debts owing to the Fund.
Under the original framework of the debt relief initiative, upon signature of a HIPC Debt Relief Agreement by the Fund, the ben-eficiary country and the Trust Fund, loans or repayment installments identified for sale to the Trust Fund are written down to their estimated net present value. On the settlement date, the estimated write-down is adjusted to reflect the actual difference between the cash received and the carrying value of the loans sold.
154 Annual Report 2011
Chapter 5 African Development Fund
Under the enhanced HIPC framework, the implementation mechanism comprises a partial payment of ADF debt service as it falls due with funds received from the Trust Fund.
Under the Multilateral Debt Relief Initiative (MDRI), loans due from eligible HIPCs are canceled when the countries attain the completion point under the HIPC framework. The Fund is expected to be fully compensated for loans canceled under MDRI by additional contributions to be made by donors over the previously scheduled repayment periods of the canceled loans. When MDRI becomes effective for a country, certain amounts previously disbursed to that country as loans are no longer repayable by the country and effectively take on the character of grants made by the Fund. Accordingly, loans canceled under the MDRI are included in “Net Debt Relief” and reported in the Statement of Net Development Resources as allocation of development resources, with a corresponding offset to loans outstanding.
Financial LiabilitiesFinancial liabilities include accounts payable and are subsequently measured at amortized cost. Financial liabilities are derecog-nized upon discharge, cancelation or expiration.
Impairment of Financial AssetsThe Fund assesses at each balance sheet date whether there is objective evidence that a financial asset or group of financial assets is impaired. A financial asset or a group of financial assets is impaired and impairment losses are incurred if, and only if, there is objective evidence of impairment as a result of one or more events that occurred after the initial recognition of the asset (a ’loss event’) and that loss event (or events) has an impact on the estimated future cash flows of the financial asset or group of financial assets that can be reliably estimated.
If the Fund determines that there is objective evidence that an impairment loss has been incurred on a loan, receivable or treasury investments at amortized cost (described in prior years as held-to-maturity investment), the amount of the loss is measured as the difference between the asset’s carrying amount and the present value of its estimated future cash flows (excluding future credit losses that have not been incurred), discounted at the financial asset’s original effective interest rate. The estimated impair-ment loss may arise from delays that may be experienced in receiving amounts due, and the impairment calculations reflect management’s best estimate of the effect of such delays.
The impairment loss is reported as a reduction to the carrying amount of the asset through the use of an allowance account and recognized in the income statement. If a loan or treasury investment at amortized cost has a variable interest rate, the discount rate for measuring any impairment loss is the current effective interest rate determined under the contract. Interest and charges are accrued on all loans, including those in arrears.
Fair Value DisclosureFair values for investment securities are based on quoted market prices where available using the bid prices. If quoted market prices are not available, fair values are based on quoted market prices of comparable instruments. Government and agency obli-gations include marketable bonds or notes and other government obligations issued or unconditionally guaranteed by govern-ments of member countries or other official entities with a minimum credit rating of AA-. For asset-backed securities, the Fund may only invest in securities with an AAA credit rating. Money market instruments include time deposits, certificates of deposit and other obligations with a maturity period of less than 1 year, issued or unconditionally guaranteed by banks and other finan-cial institutions with a minimum rating of A.
Events after the Balance Sheet DateThe financial statements are adjusted to reflect events that occurred between the date of Statement of Net Development Resources and the date when the financial statements are authorized for issue, provided they give evidence of conditions that existed at the date of Statement of Net Development Resources.
Events that are indicative of conditions that arose after the date of Statement of Net Development resources are disclosed, but do not result in an adjustment of the financial statements themselves.
155Annual Report 2011
Chapter 5African Development Fund
ReclassificationCertain reclassifications of prior year’s amounts have been made to conform to the presentation in the current year. These reclas-sifications did not affect the prior year’s reported result. However, the prior period’s amounts were not restated to reflect the effect of the changes in the classification of financial assets as described above.
NOTE C – INVESTMENTS
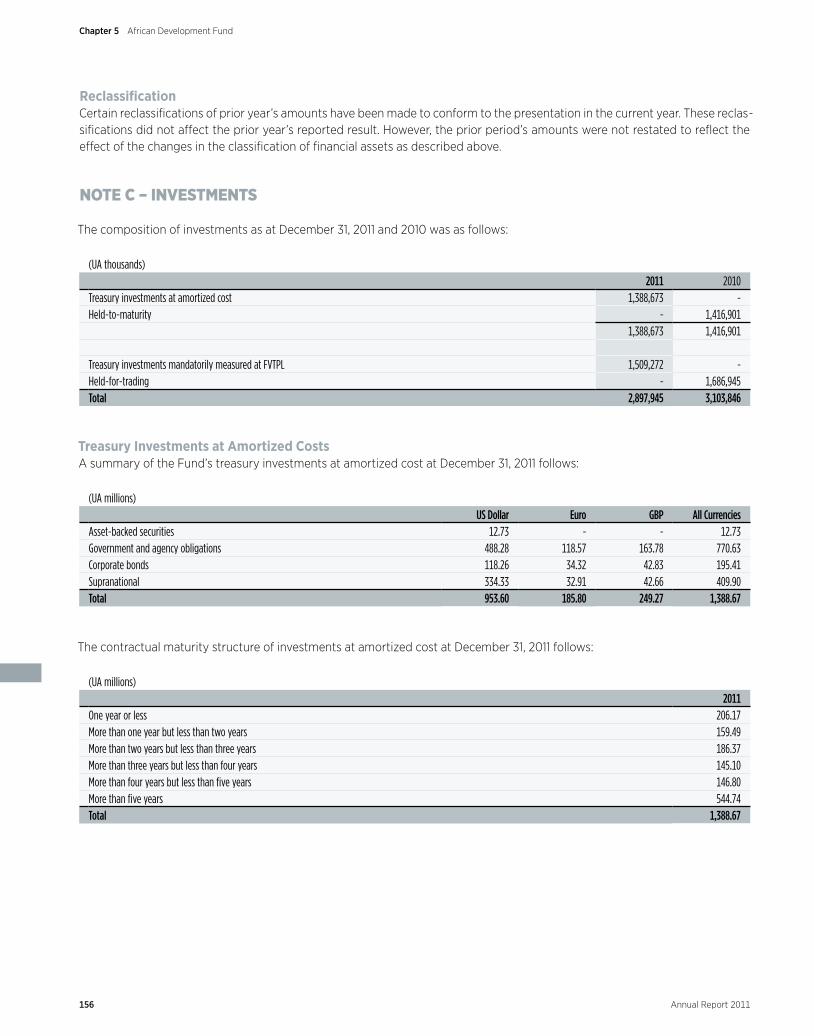
The composition of investments as at December 31, 2011 and 2010 was as follows:
(UA thousands) 2011 2010
Treasury investments at amortized cost 1,388,673 -Held-to-maturity - 1,416,901
1,388,673 1,416,901
Treasury investments mandatorily measured at FVTPL 1,509,272 -Held-for-trading - 1,686,945Total 2,897,945 3,103,846
Treasury Investments at Amortized CostsA summary of the Fund’s treasury investments at amortized cost at December 31, 2011 follows:
(UA millions) US Dollar Euro GBP All Currencies
Asset-backed securities 12.73 - - 12.73Government and agency obligations 488.28 118.57 163.78 770.63Corporate bonds 118.26 34.32 42.83 195.41Supranational 334.33 32.91 42.66 409.90Total 953.60 185.80 249.27 1,388.67
The contractual maturity structure of investments at amortized cost at December 31, 2011 follows:
(UA millions) 2011
One year or less 206.17More than one year but less than two years 159.49More than two years but less than three years 186.37More than three years but less than four years 145.10More than four years but less than five years 146.80More than five years 544.74Total 1,388.67
156 Annual Report 2011
Chapter 5 African Development Fund
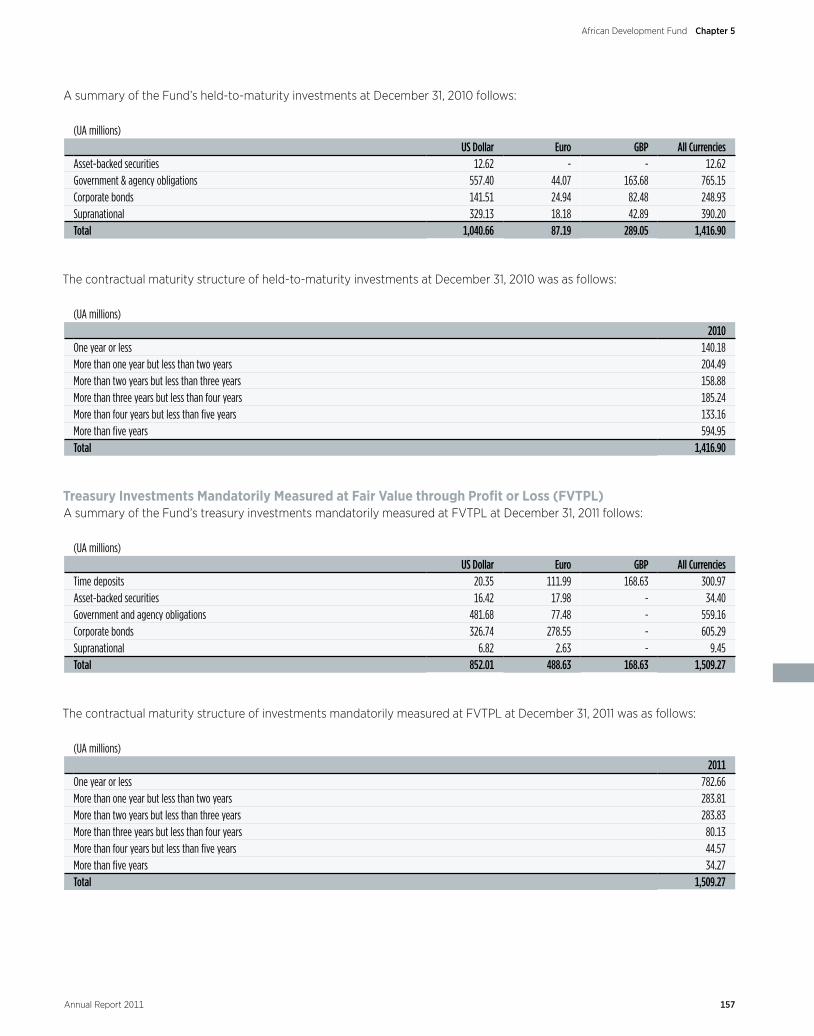
A summary of the Fund’s held-to-maturity investments at December 31, 2010 follows:
(UA millions) US Dollar Euro GBP All Currencies
Asset-backed securities 12.62 - - 12.62Government & agency obligations 557.40 44.07 163.68 765.15Corporate bonds 141.51 24.94 82.48 248.93Supranational 329.13 18.18 42.89 390.20Total 1,040.66 87.19 289.05 1,416.90
The contractual maturity structure of held-to-maturity investments at December 31, 2010 was as follows:
(UA millions) 2010
One year or less 140.18More than one year but less than two years 204.49More than two years but less than three years 158.88More than three years but less than four years 185.24More than four years but less than five years 133.16More than five years 594.95Total 1,416.90
Treasury Investments Mandatorily Measured at Fair Value through Profit or Loss (FVTPL)A summary of the Fund’s treasury investments mandatorily measured at FVTPL at December 31, 2011 follows:
(UA millions) US Dollar Euro GBP All Currencies
Time deposits 20.35 111.99 168.63 300.97Asset-backed securities 16.42 17.98 - 34.40Government and agency obligations 481.68 77.48 - 559.16Corporate bonds 326.74 278.55 - 605.29Supranational 6.82 2.63 - 9.45Total 852.01 488.63 168.63 1,509.27
The contractual maturity structure of investments mandatorily measured at FVTPL at December 31, 2011 was as follows:
(UA millions) 2011
One year or less 782.66More than one year but less than two years 283.81More than two years but less than three years 283.83More than three years but less than four years 80.13More than four years but less than five years 44.57More than five years 34.27Total 1,509.27
157Annual Report 2011
Chapter 5African Development Fund
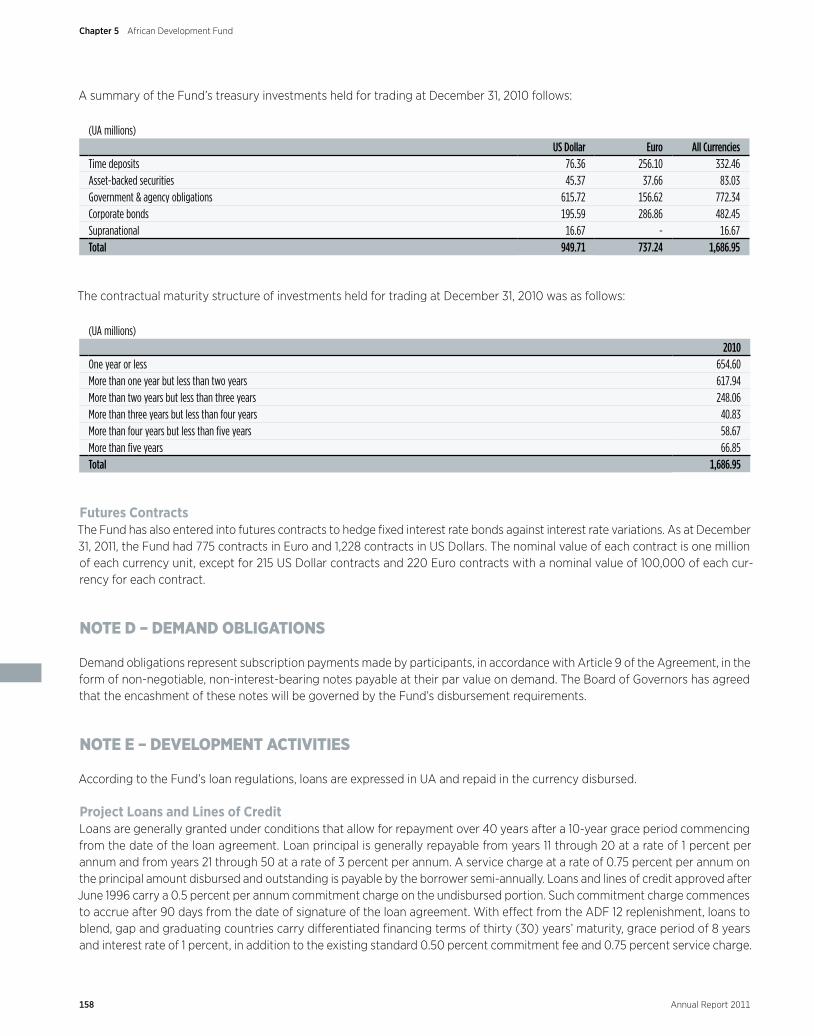
A summary of the Fund’s treasury investments held for trading at December 31, 2010 follows:
(UA millions) US Dollar Euro All Currencies
Time deposits 76.36 256.10 332.46Asset-backed securities 45.37 37.66 83.03Government & agency obligations 615.72 156.62 772.34Corporate bonds 195.59 286.86 482.45Supranational 16.67 - 16.67Total 949.71 737.24 1,686.95
The contractual maturity structure of investments held for trading at December 31, 2010 was as follows:
(UA millions) 2010
One year or less 654.60More than one year but less than two years 617.94More than two years but less than three years 248.06More than three years but less than four years 40.83More than four years but less than five years 58.67More than five years 66.85Total 1,686.95
Futures ContractsThe Fund has also entered into futures contracts to hedge fixed interest rate bonds against interest rate variations. As at December 31, 2011, the Fund had 775 contracts in Euro and 1,228 contracts in US Dollars. The nominal value of each contract is one million of each currency unit, except for 215 US Dollar contracts and 220 Euro contracts with a nominal value of 100,000 of each cur-rency for each contract.
NOTE D – DEMAND OBLIGATIONS
Demand obligations represent subscription payments made by participants, in accordance with Article 9 of the Agreement, in the form of non-negotiable, non-interest-bearing notes payable at their par value on demand. The Board of Governors has agreed that the encashment of these notes will be governed by the Fund’s disbursement requirements.
NOTE E – DEVELOPMENT ACTIVITIES
According to the Fund’s loan regulations, loans are expressed in UA and repaid in the currency disbursed.
Project Loans and Lines of CreditLoans are generally granted under conditions that allow for repayment over 40 years after a 10-year grace period commencing from the date of the loan agreement. Loan principal is generally repayable from years 11 through 20 at a rate of 1 percent per annum and from years 21 through 50 at a rate of 3 percent per annum. A service charge at a rate of 0.75 percent per annum on the principal amount disbursed and outstanding is payable by the borrower semi-annually. Loans and lines of credit approved after June 1996 carry a 0.5 percent per annum commitment charge on the undisbursed portion. Such commitment charge commences to accrue after 90 days from the date of signature of the loan agreement. With effect from the ADF 12 replenishment, loans to blend, gap and graduating countries carry differentiated financing terms of thirty (30) years’ maturity, grace period of 8 years and interest rate of 1 percent, in addition to the existing standard 0.50 percent commitment fee and 0.75 percent service charge.
158 Annual Report 2011
Chapter 5 African Development Fund
Prior to the establishment of the Technical Assistance Account, loans for pre-investment studies were normally granted for a period of 10 years, including a grace period of 3 years, with repayments in seven equal installments from years 4 through 10.
Of the undisbursed balances of loans signed, the Fund may enter into special irrevocable commitments to pay amounts to bor-rowers or others in respect of the cost of goods and services to be financed under loan agreements. As at December 31, 2011, outstanding irrevocable reimbursement guarantees to commercial banks amounted to UA 7.11 million (2010: UA 4.93 million).
As at December 31, 2011, loans made to or guaranteed by certain borrowers with an aggregate principal balance outstanding of UA 286.01 million (2010: UA 284.91 million) of which UA 91.10 million (2010: UA 83.09 million) was overdue, were in non-accrual status. If these loans had not been in non-accrual status, income from loans for the year ended December 31, 2011, would have been higher by UA 2.13 million (2010: UA 2.12 million). At December 31, 2011, the cumulative charges not recognized on the non-accrual loans amounted to UA 35.92 million, compared to UA 33.65 million at December 31, 2010.
Lines of credit to national development banks and similar national finance institutions are generally granted for a maximum of 20 years, including a 5-year grace period.
Grants and Technical Assistance ActivitiesUnder the Fund’s lending policy, 5 percent of the resources available under the third and fourth general replenishments, 10 per-cent under the fifth and sixth general replenishments, and 7.5 percent under the seventh and eighth general replenishments were allocated as grants and grant-based technical assistance for the identification and preparation of development projects or programs in specified member countries. In addition, amounts in the range of 18 to 21 percent of the total resources under the ninth replenishment were set aside in the form of grants for permitted uses, including technical assistance and project financ-ing. Grants do not bear charges. The share of grants under the tenth, eleventh and twelfth general replenishments is based on a country-by-country analysis of debt sustainability. Under the seventh, eighth and ninth general replenishments, technical assis-tance may also be provided on a reimbursable basis.
Technical assistance loans are granted under conditions that allow for repayment in 50 years, including a 10-year grace period, from the date of the loan agreement. However, the following categories of loans have different terms:
(i) where the loan is granted for the preparation of a pre-investment study and the study proves that the project is not feasible, the grace period is extended to 45 years with a repayment period of 5 years thereafter.
(ii) where the loan is granted for strengthening regional member countries’ cooperation or for the improvement of the opera-tions of existing institutions and is not related to specific projects or programs, the grace period is 45 years with a repayment period of 5 years thereafter.
Technical assistance loans do not carry charges.
HIPC Debt Relief InitiativeUnder the original framework of HIPC, selected loans to beneficiary countries were paid off by the HIPC Trust Fund at a price equivalent to the net present value of the loans as calculated using the methodology agreed under the initiative. Following the signature of a HIPC debt relief agreement, loans identified for payment were written down to their estimated net present value. The amount of the write-down, representing the difference between the book value and net present value of the loans, was shown as an allocation of development resources. The amount of UA 71.08 million, which was the write-down in respect of the debt relief granted to Mozambique in 1999 under the original HIPC framework, is included in the amount stated as net debt relief in the Statement of Net Development Resources. The outstanding balance and net present value of the loans owed by Mozambique and sold to the HIPC Trust Fund in 1999 were UA 132.04 million and UA 60.96 million, respectively.
In 1999, the HIPC initiative was enhanced to provide greater, faster and more poverty-focused debt relief. This was achieved by reducing the eligibility criteria for qualification under the initiative and by commencing debt relief much earlier than under the original framework. Under the enhanced framework, where 32 African countries are currently eligible, debt relief is delivered through annual debt service reductions which allow the release of up to 80 percent of annual debt service obligations as they
159Annual Report 2011
Chapter 5African Development Fund
come due until the total net present value (NPV) of debt relief, determined by the debt sustainability analysis (DSA), is provided. Interim financing of up to 40 percent of total debt relief is granted between the decision and completion points. Total contribu-tions by the Fund to the HIPC initiative at December 31, 2011 amounted to UA 184 million and are shown as allocation of devel-opment resources in the Statement of Net Development Resources.
Multilateral Debt Relief InitiativeAt the Gleneagles Summit on July 8, 2005, the Group of 8 major industrial countries agreed on a proposal for the ADF, the International Development Association (IDA), and the International Monetary Fund (IMF) to cancel 100 percent of their claims on countries that have reached, or will reach, the completion point under the enhanced HIPC initiative. Through the Development Committee Communiqué of September 25, 2005, the donor community expressed its support for this MDRI, and urged the insti-tutions referred to above to proceed with the necessary steps to ensure implementation.
The main objective of the MDRI is to complete the process of debt relief for HIPCs by providing additional resources to help 38 countries worldwide, 33 of which are in Africa, to make progress towards achieving the Millennium Development Goals (MDGs), while simultaneously safeguarding the long-term financing capacity of the ADF and the IDA. The debt cancelation is delivered by relieving post-completion-point HIPCs’ repayment obligations and adjusting their gross assistance flows downward by the same amount. To maintain the financial integrity of the ADF, donors are expected to make additional contributions to the ADF to match “dollar-for-dollar” the foregone principal and service charge payments.
The MDRI became effective for the ADF on September 1, 2006. Since disbursed and outstanding loans are already excluded from net development resources, the debt cancelation did not have an impact on the Fund’s balance of net development resources. Cancelation of ADF debts are effected when other eligible countries reach the HIPC completion point.
At December 31, 2011, a gross amount of UA 5.15 billion (2010: UA 4.85 billion) of outstanding loans had been canceled under MDRI for 26 (2010: 23) HIPC completion point countries. Of this amount, UA 1,225.99 million (2010: UA 1,225.99 million) in nominal terms were converted by the HIPC Trust Fund. The present value of the converted loans was UA 942.71 million (2010: UA 942.71 million). As of December 31, 2011, the present value amounts have been transferred from the HIPC Trust Fund to ADF.
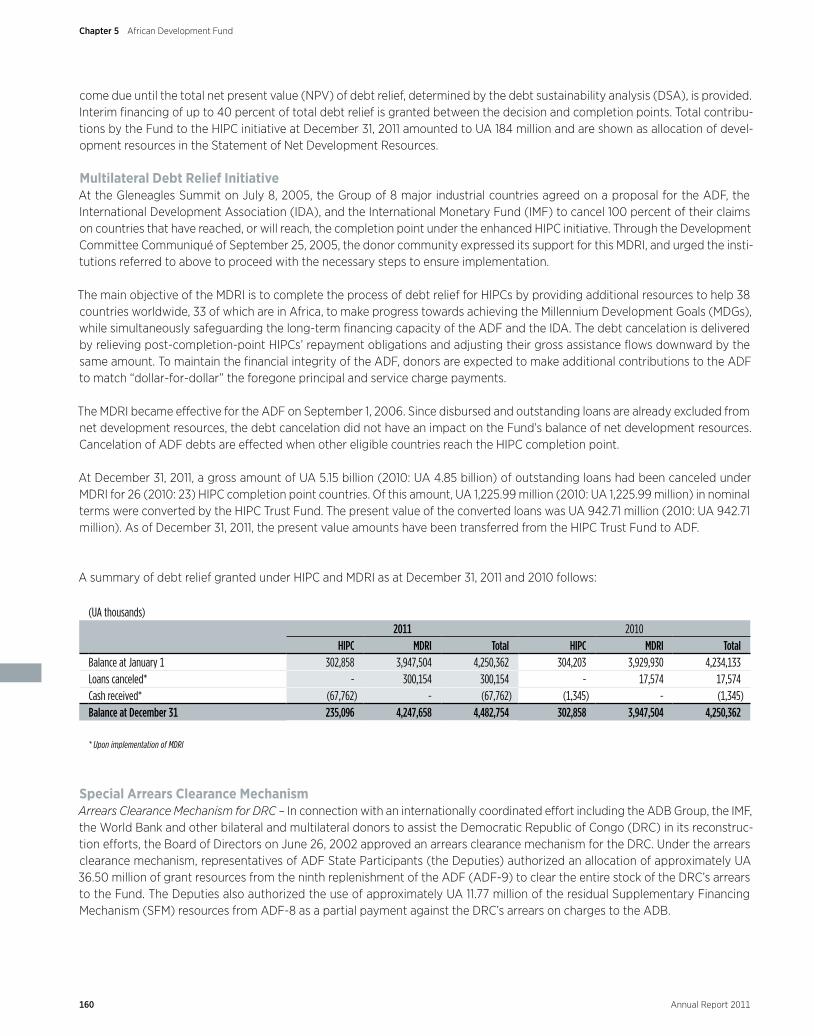
A summary of debt relief granted under HIPC and MDRI as at December 31, 2011 and 2010 follows:
(UA thousands)2011 2010
HIPC MDRI Total HIPC MDRI TotalBalance at January 1 302,858 3,947,504 4,250,362 304,203 3,929,930 4,234,133Loans canceled* - 300,154 300,154 - 17,574 17,574 Cash received* (67,762) - (67,762) (1,345) - (1,345)Balance at December 31 235,096 4,247,658 4,482,754 302,858 3,947,504 4,250,362
* Upon implementation of MDRI
Special Arrears Clearance MechanismArrears Clearance Mechanism for DRC – In connection with an internationally coordinated effort including the ADB Group, the IMF, the World Bank and other bilateral and multilateral donors to assist the Democratic Republic of Congo (DRC) in its reconstruc-tion efforts, the Board of Directors on June 26, 2002 approved an arrears clearance mechanism for the DRC. Under the arrears clearance mechanism, representatives of ADF State Participants (the Deputies) authorized an allocation of approximately UA 36.50 million of grant resources from the ninth replenishment of the ADF (ADF-9) to clear the entire stock of the DRC’s arrears to the Fund. The Deputies also authorized the use of approximately UA 11.77 million of the residual Supplementary Financing Mechanism (SFM) resources from ADF-8 as a partial payment against the DRC’s arrears on charges to the ADB.
160 Annual Report 2011
Chapter 5 African Development Fund
Fragile States Facility Framework – The Fragile States Facility (FSF) was established in March 2008 to provide a broader and inte-grated framework for assistance to eligible states, typically regional member countries of ADB emerging from conflict or crisis. The purposes of FSF are to consolidate peace, stabilize economies and lay the foundation for sustainable poverty-reduction and long-term economic growth. The FSF assumes the arrears clearance activities of the now defunct Post Conflict Countries Facility (PCCF), which was established as a framework to assist countries emerging from conflicts in clearing their arrears and prepare them for re-engagement with the donor communities, in order to reactivate development assistance and help these countries reach the HIPC decision point to qualify for debt relief after clearing their loan arrears to the Bank Group. The framework entails the setting aside of a pool of resources through a separate facility with contributions from the ADF, the ADB and private donors. Resources from the facility are provided on a case-by-case basis to genuine eligible fragile states not yet receiving debt relief to fill financing gaps after maximum effort by the country to clear its arrears to the Bank Group. Contributions made by the Fund to the facility cannot be used to clear the debt owed to the Fund by beneficiary fragile state. Contributions by the Fund to the Facility are included in “Grants and Technical Assistance Activities” in the Statement of Net Development Resources.
NOTE F – SUBSCRIPTIONS AND CONTRIBUTIONS
The Fund’s initial subscriptions were provided by the Bank and the original State Participants to the Agreement, and states acced-ing to the Agreement since the original signing date. Thereafter, further subscriptions were received from participants in the form of a special general increase and twelve general replenishments. Details of these movements are shown in the Statement of Subscriptions and Voting Power in Note O.
The Board of Governors, by its resolution F/BG/2011/01 of 20 January 2011, approved the twelfth general replenishment of the Fund (ADF-12), following the Deputies agreement for a replenishment level of UA 6.10 billion, of which UA 2.01 billion represents internally generated resources, for the three-year operational period 2011 to 2013. ADF-12 came into effect on May 3, 2011 after the State Participants had deposited with the Fund, enough instruments of subscriptions to meet the threshold of 30 percent of pledged subscriptions. At December 31, 2011 subscriptions to ADF-12 amounted to UA 3.16 billion.
At December 31, 2011 cumulative contributions pledged on account of the MDRI amounted to UA 5.94 billion, of which UA 495.60 million had been paid and included in total subscriptions. Consistent with the resolution approving MDRI, the contributions paid entitle the State Participants to voting rights, as reflected in Note O.
Gains or losses arising from translation of subscriptions and contributions received into UA are recorded in the Cumulative Exchange Adjustment on Subscriptions account in the Statement of Net Development Resources.
NOTE G – OTHER RESOURCES
In conformity with the findings of the UN General Assembly, the Board of Directors accepted that the former Socialist Federal Republic of Yugoslavia no longer exists as a state under international law and hence is no longer a State Participant in the Fund or a member of the Bank. Pursuant to a decision of the Board of Directors of the Fund in 1993, the subscriptions of the former Socialist Federal Republic of Yugoslavia in the Fund less the unpaid portion (UA 12.97 million), are deemed to have become part of the permanent patrimony of the Fund and are not returnable to any entity. Accordingly, the amounts of the paid subscrip-tions are reported as part of other resources in the Statement of Net Development Resources.
Also included in other resources is a total of UA 377.30 million representing contributions by the Bank of UA 375.30 million, and by the Government of Botswana of UA 2 million towards the Fund’s activities, in accordance with Article 8 of the Agreement.
161Annual Report 2011
Chapter 5African Development Fund
NOTE H – DISCLOSURES ABOUT FAIR VALUE OF FINANCIAL INSTRUMENTS
Investments: Since the Fund carries its treasury investments mandatory at FVTPL (2010: held-for-trading investments) at mar-ket value, the carrying amount represents the fair value of the portfolio. Fair values are based on quoted market prices where available. If quoted market prices are not available, fair values are based on quoted market prices of comparable instruments.
Loans: All loans of the Fund are intended to provide concessional assistance to low-income regional member countries of the Bank. While the principal amount is fully repayable, no interest is charged to the borrowers. However, a service fee of 0.75 percent of the disbursed and outstanding balance and a commitment charge of 0.5 percent on the undisbursed balance are charged to cover the cost of administering the loans. Due to the highly concessional nature of these loans, it is not meaningful to calculate fair values for outstanding loans.
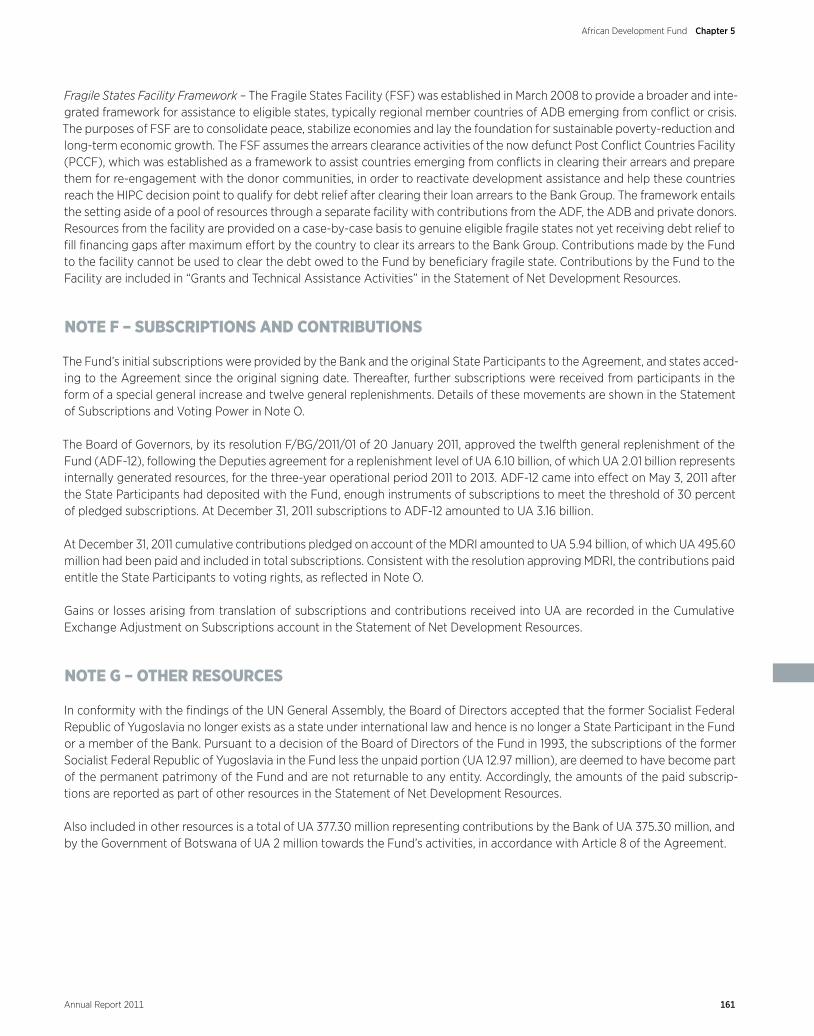
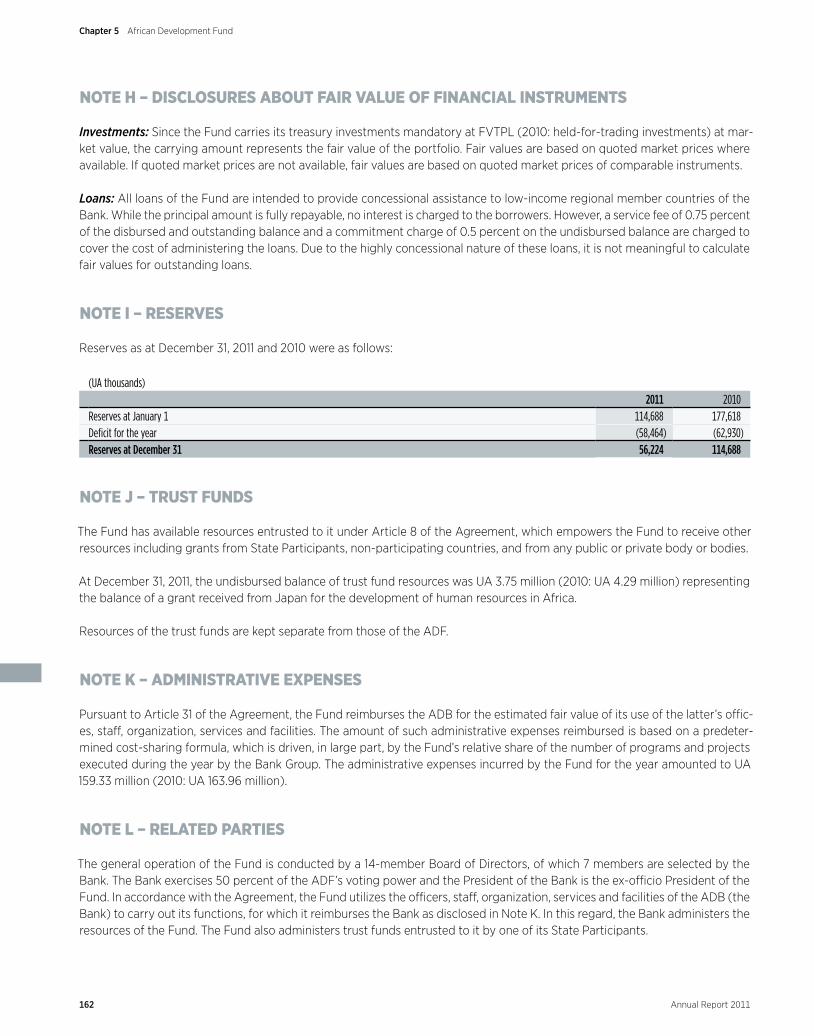
NOTE I – RESERVES
Reserves as at December 31, 2011 and 2010 were as follows:
(UA thousands) 2011 2010
Reserves at January 1 114,688 177,618 Deficit for the year (58,464) (62,930)Reserves at December 31 56,224 114,688
NOTE J – TRUST FUNDS
The Fund has available resources entrusted to it under Article 8 of the Agreement, which empowers the Fund to receive other resources including grants from State Participants, non-participating countries, and from any public or private body or bodies.
At December 31, 2011, the undisbursed balance of trust fund resources was UA 3.75 million (2010: UA 4.29 million) representing the balance of a grant received from Japan for the development of human resources in Africa.
Resources of the trust funds are kept separate from those of the ADF.
NOTE K – ADMINISTRATIVE EXPENSES
Pursuant to Article 31 of the Agreement, the Fund reimburses the ADB for the estimated fair value of its use of the latter’s offic-es, staff, organization, services and facilities. The amount of such administrative expenses reimbursed is based on a predeter-mined cost-sharing formula, which is driven, in large part, by the Fund’s relative share of the number of programs and projects executed during the year by the Bank Group. The administrative expenses incurred by the Fund for the year amounted to UA 159.33 million (2010: UA 163.96 million).
NOTE L – RELATED PARTIES
The general operation of the Fund is conducted by a 14-member Board of Directors, of which 7 members are selected by the Bank. The Bank exercises 50 percent of the ADF’s voting power and the President of the Bank is the ex-officio President of the Fund. In accordance with the Agreement, the Fund utilizes the officers, staff, organization, services and facilities of the ADB (the Bank) to carry out its functions, for which it reimburses the Bank as disclosed in Note K. In this regard, the Bank administers the resources of the Fund. The Fund also administers trust funds entrusted to it by one of its State Participants.
162 Annual Report 2011
Chapter 5 African Development Fund
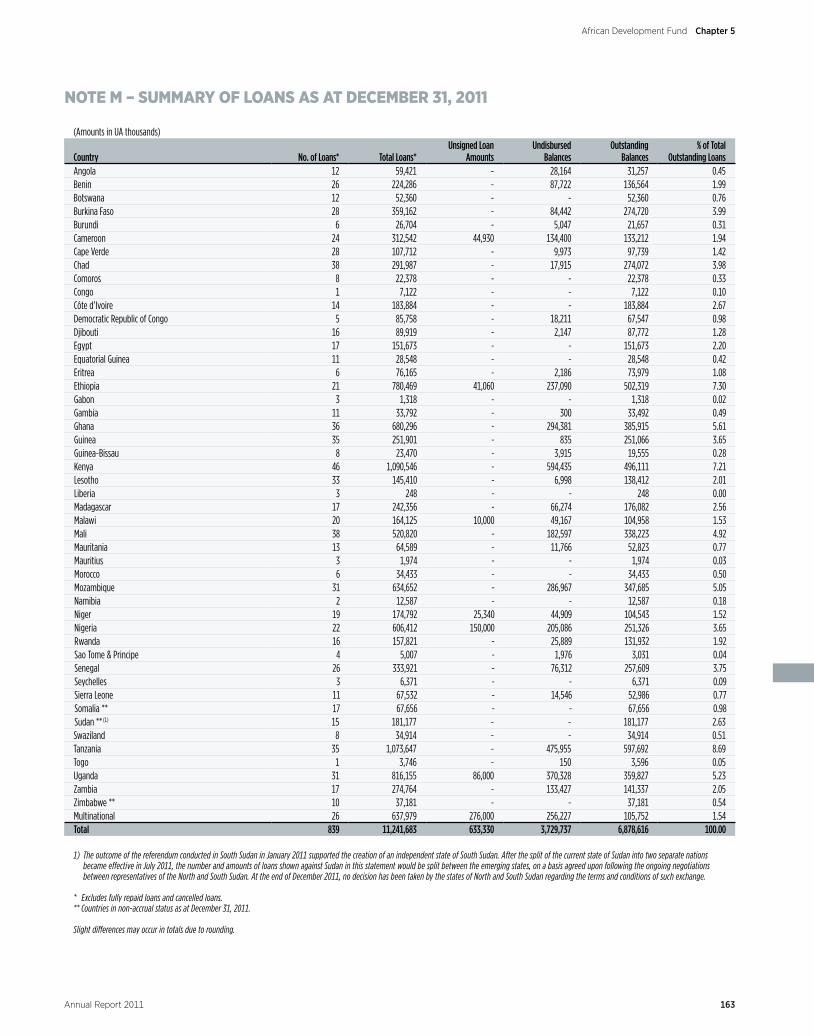
NOTE M – SUMMARY OF LOANS AS AT DECEMBER 31, 2011
(Amounts in UA thousands)
Country No. of Loans* Total Loans*Unsigned Loan
AmountsUndisbursed
BalancesOutstanding
Balances% of Total
Outstanding LoansAngola 12 59,421 - 28,164 31,257 0.45Benin 26 224,286 - 87,722 136,564 1.99Botswana 12 52,360 - - 52,360 0.76Burkina Faso 28 359,162 - 84,442 274,720 3.99Burundi 6 26,704 - 5,047 21,657 0.31Cameroon 24 312,542 44,930 134,400 133,212 1.94Cape Verde 28 107,712 - 9,973 97,739 1.42Chad 38 291,987 - 17,915 274,072 3.98Comoros 8 22,378 - - 22,378 0.33Congo 1 7,122 - - 7,122 0.10Côte d’Ivoire 14 183,884 - - 183,884 2.67Democratic Republic of Congo 5 85,758 - 18,211 67,547 0.98Djibouti 16 89,919 - 2,147 87,772 1.28Egypt 17 151,673 - - 151,673 2.20Equatorial Guinea 11 28,548 - - 28,548 0.42Eritrea 6 76,165 - 2,186 73,979 1.08Ethiopia 21 780,469 41,060 237,090 502,319 7.30Gabon 3 1,318 - - 1,318 0.02Gambia 11 33,792 - 300 33,492 0.49Ghana 36 680,296 - 294,381 385,915 5.61Guinea 35 251,901 - 835 251,066 3.65Guinea-Bissau 8 23,470 - 3,915 19,555 0.28Kenya 46 1,090,546 - 594,435 496,111 7.21Lesotho 33 145,410 - 6,998 138,412 2.01Liberia 3 248 - - 248 0.00Madagascar 17 242,356 - 66,274 176,082 2.56Malawi 20 164,125 10,000 49,167 104,958 1.53Mali 38 520,820 - 182,597 338,223 4.92Mauritania 13 64,589 - 11,766 52,823 0.77Mauritius 3 1,974 - - 1,974 0.03Morocco 6 34,433 - - 34,433 0.50Mozambique 31 634,652 - 286,967 347,685 5.05Namibia 2 12,587 - - 12,587 0.18Niger 19 174,792 25,340 44,909 104,543 1.52Nigeria 22 606,412 150,000 205,086 251,326 3.65Rwanda 16 157,821 - 25,889 131,932 1.92Sao Tome & Principe 4 5,007 - 1,976 3,031 0.04Senegal 26 333,921 - 76,312 257,609 3.75Seychelles 3 6,371 - - 6,371 0.09Sierra Leone 11 67,532 - 14,546 52,986 0.77Somalia ** 17 67,656 - - 67,656 0.98Sudan ** (1) 15 181,177 - - 181,177 2.63Swaziland 8 34,914 - - 34,914 0.51Tanzania 35 1,073,647 - 475,955 597,692 8.69Togo 1 3,746 - 150 3,596 0.05Uganda 31 816,155 86,000 370,328 359,827 5.23Zambia 17 274,764 - 133,427 141,337 2.05Zimbabwe ** 10 37,181 - - 37,181 0.54Multinational 26 637,979 276,000 256,227 105,752 1.54Total 839 11,241,683 633,330 3,729,737 6,878,616 100.00
1) The outcome of the referendum conducted in South Sudan in January 2011 supported the creation of an independent state of South Sudan. After the split of the current state of Sudan into two separate nations became effective in July 2011, the number and amounts of loans shown against Sudan in this statement would be split between the emerging states, on a basis agreed upon following the ongoing negotiations between representatives of the North and South Sudan. At the end of December 2011, no decision has been taken by the states of North and South Sudan regarding the terms and conditions of such exchange.
* Excludes fully repaid loans and cancelled loans.** Countries in non-accrual status as at December 31, 2011.
Slight differences may occur in totals due to rounding.
163Annual Report 2011
Chapter 5African Development Fund

NOTE N – MATURITY AND CURRENCY COMPOSITION OF OUTSTANDING LOANS AS AT DECEMBER 31, 2011 AND 2010
The maturity distribution of outstanding loans as at December 31, 2011 and 2010 was as follows
(Amounts in UA millions)2011 2010
Period Amount % Amount %One year or less 155.97 2.27 149.96 2.38More than one year but less than two years 69.51 1.01 72.16 1.15More than two years but less than three years 79.38 1.15 79.22 1.26More than three years but less than four years 86.04 1.25 88.05 1.40More than four years but less than five years 90.21 1.31 95.06 1.51More than five years 6,397.51 93.01 5,812.34 92.30Total 6,878.62 100.00 6,296.79 100.00
The currency composition of outstanding loans as at December 31, 2011 and 2010 was as follows
(Amounts in UA millions)2011 2010
Currency Amount % Amount %Canadian Dollar 14.57 0.21 18.39 0.29 Danish Kroner 13.11 0.19 16.46 0.26 Euro 2,484.94 36.13 2,136.30 33.93 Japanese Yen 1,524.82 22.17 1,516.86 24.09 Norwegian Krone 26.26 0.38 29.68 0.47 Pound Sterling 6.22 0.09 6.33 0.10 Swedish Krona 17.16 0.25 20.39 0.32 Swiss Franc 72.65 1.06 110.64 1.76 United States Dollar 2,718.57 39.52 2,441.41 38.77 Others 0.32 - 0.33 0.01 Total 6,878.62 100.00 6,296.79 100.00
Slight differences may occur in totals due to rounding.
164 Annual Report 2011
Chapter 5 African Development Fund
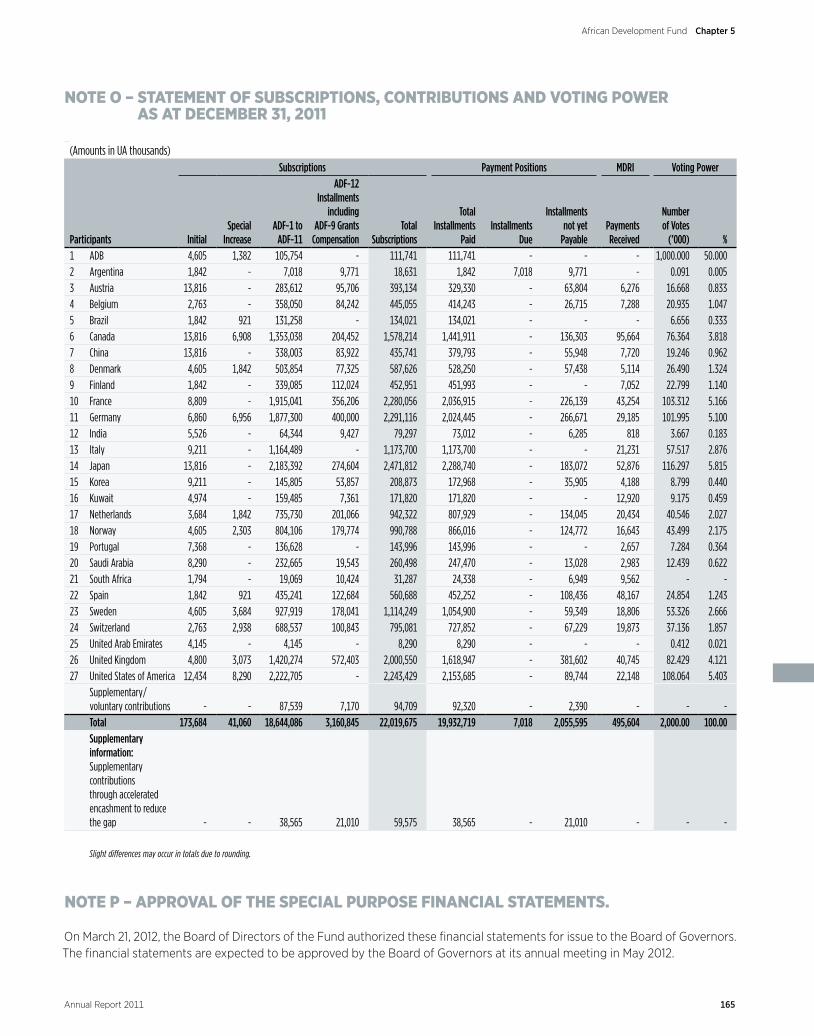
NOTE O – STATEMENT OF SUBSCRIPTIONS, CONTRIBUTIONS AND VOTING POWER AS AT DECEMBER 31, 2011
(Amounts in UA thousands) Subscriptions Payment Positions MDRI Voting Power
Participants Initial Special
IncreaseADF-1 to
ADF-11
ADF-12 Installments
including ADF-9 Grants
Compensation Total
Sub scrip tions
Total Install ments
PaidInstall ments
Due
Install ments not yet
PayablePay ments Re ceived
Number of Votes
(’000) %1 ADB 4,605 1,382 105,754 - 111,741 111,741 - - - 1,000.000 50.000 2 Argentina 1,842 - 7,018 9,771 18,631 1,842 7,018 9,771 - 0.091 0.005 3 Austria 13,816 - 283,612 95,706 393,134 329,330 - 63,804 6,276 16.668 0.833 4 Belgium 2,763 - 358,050 84,242 445,055 414,243 - 26,715 7,288 20.935 1.047 5 Brazil 1,842 921 131,258 - 134,021 134,021 - - - 6.656 0.333 6 Canada 13,816 6,908 1,353,038 204,452 1,578,214 1,441,911 - 136,303 95,664 76.364 3.818 7 China 13,816 - 338,003 83,922 435,741 379,793 - 55,948 7,720 19.246 0.962 8 Denmark 4,605 1,842 503,854 77,325 587,626 528,250 - 57,438 5,114 26.490 1.324 9 Finland 1,842 - 339,085 112,024 452,951 451,993 - - 7,052 22.799 1.140 10 France 8,809 - 1,915,041 356,206 2,280,056 2,036,915 - 226,139 43,254 103.312 5.166 11 Germany 6,860 6,956 1,877,300 400,000 2,291,116 2,024,445 - 266,671 29,185 101.995 5.100 12 India 5,526 - 64,344 9,427 79,297 73,012 - 6,285 818 3.667 0.183 13 Italy 9,211 - 1,164,489 - 1,173,700 1,173,700 - - 21,231 57.517 2.876 14 Japan 13,816 - 2,183,392 274,604 2,471,812 2,288,740 - 183,072 52,876 116.297 5.815 15 Korea 9,211 - 145,805 53,857 208,873 172,968 - 35,905 4,188 8.799 0.440 16 Kuwait 4,974 - 159,485 7,361 171,820 171,820 - - 12,920 9.175 0.459 17 Netherlands 3,684 1,842 735,730 201,066 942,322 807,929 - 134,045 20,434 40.546 2.027 18 Norway 4,605 2,303 804,106 179,774 990,788 866,016 - 124,772 16,643 43.499 2.175 19 Portugal 7,368 - 136,628 - 143,996 143,996 - - 2,657 7.284 0.364 20 Saudi Arabia 8,290 - 232,665 19,543 260,498 247,470 - 13,028 2,983 12.439 0.622 21 South Africa 1,794 - 19,069 10,424 31,287 24,338 - 6,949 9,562 - - 22 Spain 1,842 921 435,241 122,684 560,688 452,252 - 108,436 48,167 24.854 1.243 23 Sweden 4,605 3,684 927,919 178,041 1,114,249 1,054,900 - 59,349 18,806 53.326 2.666 24 Switzerland 2,763 2,938 688,537 100,843 795,081 727,852 - 67,229 19,873 37.136 1.857 25 United Arab Emirates 4,145 - 4,145 - 8,290 8,290 - - - 0.412 0.021 26 United Kingdom 4,800 3,073 1,420,274 572,403 2,000,550 1,618,947 - 381,602 40,745 82.429 4.121 27 United States of America 12,434 8,290 2,222,705 - 2,243,429 2,153,685 - 89,744 22,148 108.064 5.403
Supplementary/voluntary contributions - - 87,539 7,170 94,709 92,320 - 2,390 - - - Total 173,684 41,060 18,644,086 3,160,845 22,019,675 19,932,719 7,018 2,055,595 495,604 2,000.00 100.00 Supplementary information: Supplementary contributions through accelerated encashment to reduce the gap - - 38,565 21,010 59,575 38,565 - 21,010 - - -
Slight differences may occur in totals due to rounding.
NOTE P – APPROVAL OF THE SPECIAL PURPOSE FINANCIAL STATEMENTS.
On March 21, 2012, the Board of Directors of the Fund authorized these financial statements for issue to the Board of Governors. The financial statements are expected to be approved by the Board of Governors at its annual meeting in May 2012.
165Annual Report 2011
Chapter 5African Development Fund
Téléphone : +33 (0)1 55 68 68 68Télécopie : +33 (0)1 55 68 73 00Site internet : www.kpmg.fr
KPMG S.A.,société française membre du réseau KPMGconstitué de cabinets indépendants adhérents deKPMG International Cooperative, une entité de droit suisse.
Société anonyme d’expertisecomptable et de commissariataux comptes à directoire etconseil de surveillance.Inscrite au Tableau de l’Ordreà Paris sous le n° 14-30080101et à la Compagnie Régionaledes Commissaires aux Comptesde Versailles.
Siège social :KPMG S.A.Immeuble Le Palatin3 cours du Triangle92939 Paris La Défense CedexCapital : 5 497 100 €.Code APE 6920Z775 726 417 R.C.S. NanterreTVA Union EuropéenneFR 77 775 726 417
1, cours Valmy92923 Paris La Défense CedexFrance
KPMG Audit
African Development FundTemporary Relocation Agency15 Avenue du Ghana1002 Tunis BelvédèreTunisia
Independent Auditor’s Report on the special purpose financial statements of the African Development Fund to the Board of Governors of the African Development FundYear ended 31 December 2011
We have audited the accompanying special purpose financial statements of the African Development Fund (“ the Fund “) prepared in compliance with the accounting and financial reporting matters as set out in the accounting policies in note B to the Special Purpose Financial Statements for the year ended 31 December 2011.
These special purpose financial statements have been prepared for the purposes of submitting approved and audited special purpose financial statements to the Board of Governors as required by Article 26(v), 35(l) and 35(3) of the Agreement establishing the Fund, and are not intended to be a presentation in conformity with a recognised accounting framework, such as, International Financial Reporting Standards.
This report is made solely to the Fund’s Board of Governors, as a body, in accordance with Article 26(v), 35(l) and 35(3) of the Agreement establishing the Fund. Our audit work has been undertaken so that we might state to the Fund’s Board of Governors those matters we are required to state to them in an auditors’ report and for no other purpose. To the fullest extent permitted by law, we do not accept or assume responsibility to anyone other than the Fund and its Board of Governors as a body, for our audit work, for this report, or for the opinions we have formed.
Management’s Responsibility for the Annual Financial StatementsManagement is responsible for the preparation and presentation of these financial statements in accordance with articles 26(v), 35(l) and 35(3) of the Agreement Establishing the Fund and the accounting policies set out in Note B to the special purpose financial state-ments. This responsibility includes: designing, implementing and maintaining internal control relevant to the preparation and presenta-tion of financial statements that are free from material misstatement, whether due to fraud or error; selecting and applying appropriate accounting policies; and making accounting estimates that are reasonable in the circumstances.
Auditor’s ResponsibilityOur responsibility is to express an opinion on these special purpose financial statements based on our audit. We conducted our audit in accordance with International Standards on Auditing. Those standards require that we comply with ethical requirements and plan and perform the audit to obtain reasonable assurance that the special purpose financial statements are free from material misstatement.
166 Annual Report 2011
Chapter 5 African Development Fund
An audit involves performing procedures to obtain audit evidence about the amounts and disclosures in the special purpose financial statements. The procedures selected depend on the auditor’s judgement, including the assessment of the risks of material misstate-ment of the special purpose financial statements, whether due to fraud or error. In making those risks assessments, the auditor consid-ers internal control relevant to the entity’s preparation and presentation of the special purpose financial statements in order to design audit procedures that are appropriate in the circumstances, but not for the purpose of expressing an opinion on the effectiveness of the entity’s internal control. An audit also includes evaluating the appropriateness of accounting principles used and the reasonable-ness of accounting estimates made by management, as well as evaluating the overall special purpose financial statement presentation.
We believe that the audit evidence we have obtained is sufficient and appropriate to provide a basis for our audit opinion.
OpinionIn our opinion, the special purpose financial statements of the Fund have been prepared, in all material respects, in accordance with the accounting and financial reporting matters as set out in the accounting policies in note B to the special purpose financial statements for the year ended 31 December 2011.
Paris La Défense, 21st March 2012
KPMG Audit A division of KPMG S.A.
Pascal BrouardPartner
African Development Fund Independent Auditor’s Report on the special purpose
financial statements of the African Development Fund to the Board of Governors of the African Development Fund
167Annual Report 2011
Chapter 5African Development Fund
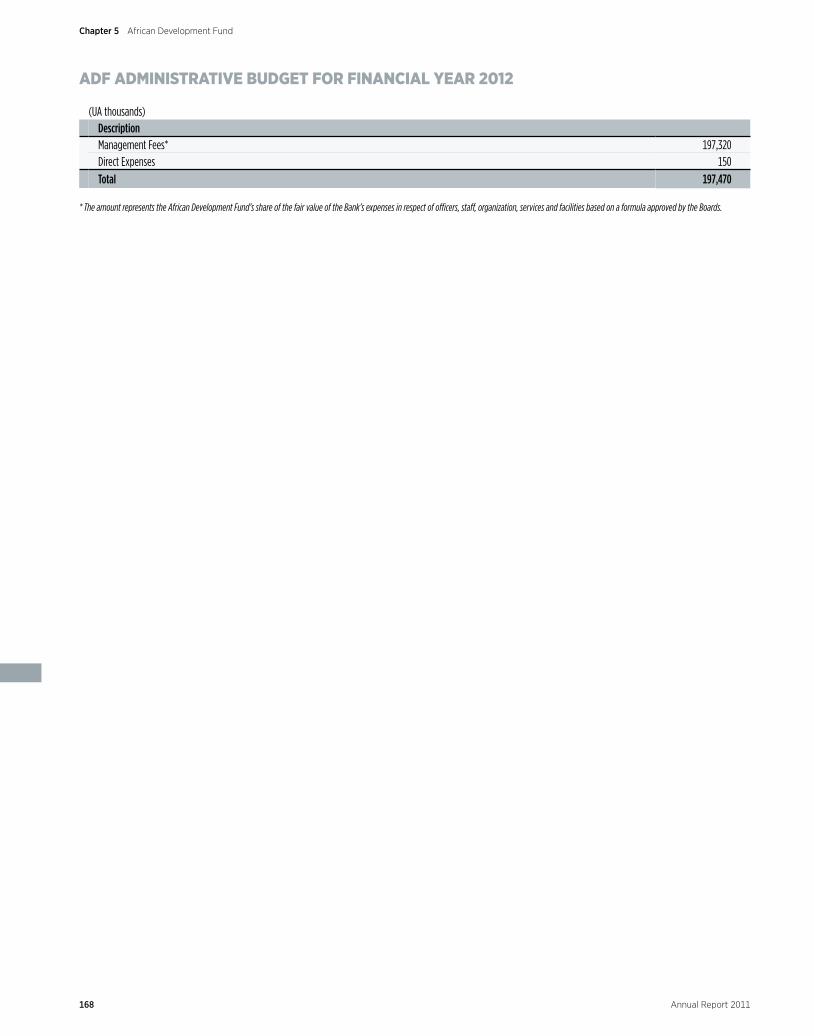
ADF ADMINISTRATIVE BUDGET FOR FINANCIAL YEAR 2012
(UA thousands)DescriptionManagement Fees* 197,320Direct Expenses 150Total 197,470
* The amount represents the African Development Fund’s share of the fair value of the Bank’s expenses in respect of officers, staff, organization, services and facilities based on a formula approved by the Boards.
168 Annual Report 2011
Chapter 5 African Development Fund
NIGERIA TRUST FUNDFinancial Management
NTF ReplenishmentThe Nigeria Trust Fund (the NTF or the Fund) is a special fund administered by the Bank. Its resources primarily consist of subscriptions provided by the Federal Government of Nigeria. The NTF was established in 1976 when an agreement establish-ing the NTF was executed between the Bank and the Federal Government of Nigeria for an initial period of 30 years, with a provision for extension by mutual agreement. After two annual extensions in 2006 and 2007, the operation of the NTF was extended for ten years with effect from April 25, 2008, follow-ing a positive evaluation of its performance during the initial thirty (30) years of operation.
Loan ProductsNTF provides financing in the form of loans to the least developed and low-income regional member countries at highly concession-ary rates in order to enhance economic development and social progress in Africa. While in the past the NTF has provided financial support exclusively to public sector operations, for the extension period to 2018, NTF will expand its financial support to cover private sector operations as well, including the microfinance subsector.
InvestmentsThe cash and treasury investments of the NTF are denominated in US Dollars and amounted to UA 106.33 million at December 31, 2011, compared to UA 107.95 million at the end of 2010. Investment income for 2011 was UA 0.17 million, representing a return of 0.16 percent, on an average liquidity level of UA 107.14 million, compared to an income of UA 0.41 million in 2010, representing a return of 0.38 percent on an average liquidity of UA 108.40 million. The low return is due to the very low level of the USD Libor rates as well as the volatile and stressed financial environ-ment that led to the widening of credit spreads during the year.
Loan PortfolioLoans signed, net of cancelations, as at December 31, 2011, slightly decreased by UA 0.53 million to UA 245.12 million com-pared to UA 245.65 million at the end of 2010. During 2011, no
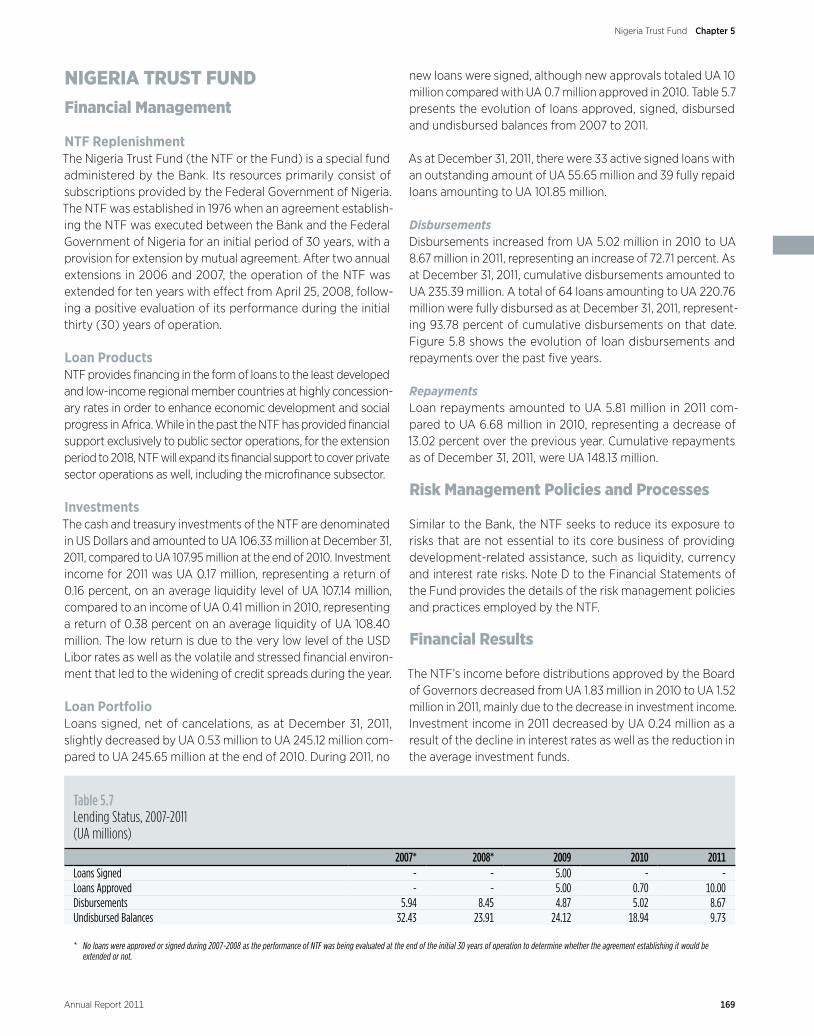
new loans were signed, although new approvals totaled UA 10 million compared with UA 0.7 million approved in 2010. Table 5.7 presents the evolution of loans approved, signed, disbursed and undisbursed balances from 2007 to 2011.
As at December 31, 2011, there were 33 active signed loans with an outstanding amount of UA 55.65 million and 39 fully repaid loans amounting to UA 101.85 million.
DisbursementsDisbursements increased from UA 5.02 million in 2010 to UA 8.67 million in 2011, representing an increase of 72.71 percent. As at December 31, 2011, cumulative disbursements amounted to UA 235.39 million. A total of 64 loans amounting to UA 220.76 million were fully disbursed as at December 31, 2011, represent-ing 93.78 percent of cumulative disbursements on that date. Figure 5.8 shows the evolution of loan disbursements and repayments over the past five years.
RepaymentsLoan repayments amounted to UA 5.81 million in 2011 com-pared to UA 6.68 million in 2010, representing a decrease of 13.02 percent over the previous year. Cumulative repayments as of December 31, 2011, were UA 148.13 million.
Risk Management Policies and Processes
Similar to the Bank, the NTF seeks to reduce its exposure to risks that are not essential to its core business of providing development-related assistance, such as liquidity, currency and interest rate risks. Note D to the Financial Statements of the Fund provides the details of the risk management policies and practices employed by the NTF.
Financial Results
The NTF’s income before distributions approved by the Board of Governors decreased from UA 1.83 million in 2010 to UA 1.52 million in 2011, mainly due to the decrease in investment income. Investment income in 2011 decreased by UA 0.24 million as a result of the decline in interest rates as well as the reduction in the average investment funds.
2007* 2008* 2009 2010 2011Loans Signed - - 5.00 - -Loans Approved - - 5.00 0.70 10.00Disbursements 5.94 8.45 4.87 5.02 8.67Undisbursed Balances 32.43 23.91 24.12 18.94 9.73
* No loans were approved or signed during 2007-2008 as the performance of NTF was being evaluated at the end of the initial 30 years of operation to determine whether the agreement establishing it would be extended or not.
Table 5.7Lending Status, 2007‑2011 (UA millions)
169
Chapter 5Nigeria Trust Fund
Annual Report 2011

Administrative expenses, representing the NTF’s proportion of the total shareable expenses of the ADB Group, decreased by UA 0.08 million from UA 0.47 million in 2010 to UA 0.39 million in 2011. The NTF’s proportion of the total shareable expenses of the ADB group is based on a predetermined cost-sharing for-mula, which is driven by the relative levels of certain operational volume indicators and relative balance sheet size. However, the
NTF’s total administrative expense is capped at no more than 20 percent of its gross income in any year.
The NTF’s reserves net of cumulative currency translation adjust-ments increased from UA 32.28 million at the end of 2010 to UA 34.15 million as at December 31, 2011, a 5.79 percent increase over the previous year.
Figure 5.9Income before Distribution vs. Investment Income, 2007‑2011 (UA millions)
2007 2008 2009 2010 2011
20
15
10
5
0
Income before DistributionInvestment Income
Figure 5.8Loan Disbursements and Repayments, 2007–2011 (UA millions)
2007 2008 2009 2010 2011
Loan RepaymentsDisbursements
20
15
10
5
0
170 Annual Report 2011
Chapter 5 Nigeria Trust Fund