age-moderation of genetic and environmental … s. panizzonf, inge peterseng, catalina zavalab,i,...
TRANSCRIPT

Contents lists available at ScienceDirect
Intelligence
journal homepage: www.elsevier.com/locate/intell
Age-moderation of genetic and environmental contributions to cognitivefunctioning in mid- and late-life for specific cognitive abilities
Shandell Pahlena,b,⁎, Nayla R. Hamdia, Anna K. Dahl Aslanc,d, Briana N. Horwitze,Matthew S. Panizzonf, Inge Peterseng, Catalina Zavalab,i, Kaare Christenseng, Deborah Finkelh,Carol E. Franzf, Margaret Gatzb,i, Wendy Johnsonj, William S. Kremenf, Robert F. Kruegera,Jenae M. Neiderhiserk, Chandra A. Reynoldsb, Nancy L. Pedersenc,i, Matt McGuea,g
a Department of Psychology, University of Minnesota, Minneapolis, MN 55455, USAbDepartment of Psychology, University of California Riverside, Riverside, CA 92521, USAc Department of Medical Epidemiology and Biostatistics, Karolinska Institute, Stockholm SE-17177, Swedend Jönköping Affiliation to School of Health and Welfare, Jönköping University, Jönköping, Swedene Department of Psychology, California State University Fullerton, Fullerton, CA 92834, USAfDepartment of Psychiatry, University of California San Diego, La Jolla, CA 92093, USAg The Danish Twin Register, The Danish Aging Research Center, University of Southern Denmark, DK-5000 Odense C, DenmarkhDepartment of Psychology, Indiana University Southeast, New Albany, IN 47150, USAi Department of Psychology, University of Southern California, Los Angeles, CA 90089, USAjDepartment of Psychology, Centre for Cognitive Ageing and Cognitive Epidemiology, University of Edinburgh, Midlothian, Scotland, UKk Department of Psychology, Penn State University, University Park, PA 16802, USA
A R T I C L E I N F O
Keywords:AgingBehavior geneticsCognitive abilityAdult development
A B S T R A C T
Age moderation of genetic and environmental contributions to Digits Forward, Digits Backward, Block Design,Symbol Digit, Vocabulary, and Synonyms was investigated in a sample of 14,534 twins aged 26 to 98 years. TheInterplay of Genes and Environment across Multiple Studies (IGEMS) consortium contributed the sample, whichrepresents nine studies from three countries (USA, Denmark, and Sweden). Average test performance was lowerin successively older age groups for all tests. Significant age moderation of additive genetic, shared environ-mental, and non-shared environmental variance components was observed, but the pattern varied by test. Thegenetic contribution to phenotypic variance across age was smaller for both Digit Span tests, greater forSynonyms, and stable for Block Design and Symbol Digit. The non-shared environmental contribution wasgreater with age for the Digit Span tests and Block Design, while the shared environmental component was smallfor all tests, often more so with age. Vocabulary showed similar age-moderation patterns as Synonyms, but theseeffects were nonsignificant. Findings are discussed in the context of theories of cognitive aging.
1. Introduction
Cross-sectional and longitudinal research has consistently foundthat average cognitive test performance declines in late life (Salthouse,2009). Nonetheless, there are marked individual differences in thetiming and rate of cognitive aging, and late-life cognitive function isrelatively etiologically distinct from cognitive function at earlier ages(Wilson et al., 2002). Late-life general cognitive ability (GCA) is alsomoderately to strongly heritable, with minimal shared environmentalcontributions (Johnson, McGue, & Deary, 2014). An important butlargely unaddressed question concerns whether the magnitudes of ge-netic and environmental contributions to late-life cognitive ability
differ from those at earlier life stages.A prominent finding from the behavioral genetic literature is that
heritability of behavioral phenotypes increases with age. In a meta-analysis of relevant twin studies, Bergen, Gardner, and Kendler (2007)reported that heritability of diverse behavioral phenotypes includinganxiety, externalizing psychopathology, social attitudes, and GCA allincreased with age. Other research has documented age-related de-clines in the importance of shared environmental influences for GCA(Haworth et al., 2010). There are, however, several important limita-tions in this literature. First, most of the research has focused on tran-sitions from childhood to early adulthood; much less is known aboutthe magnitudes of genetic and environmental contributions beyond
https://doi.org/10.1016/j.intell.2017.12.004Received 27 November 2017; Accepted 19 December 2017
⁎ Corresponding author at: Department of Psychology, University of California - Riverside, 900 University Ave, CA 92521, Riverside, USA.E-mail address: [email protected] (S. Pahlen).
Intelligence 68 (2018) 70–81
0160-2896/ © 2018 Elsevier Inc. All rights reserved.
T

early adulthood (Tucker-Drob & Briley, 2014). Second, research oncognitive transitions from childhood to early adulthood has focusedalmost exclusively on GCA rather than specific cognitive abilities, de-spite evidence of domain specific variation in their developmentaltrajectories. Third, most of the research has focused on standardized,rather than raw, components of variance. Greater heritability, a stan-dardized metric, may be a consequence of less raw environmentalcontribution to variance, greater genetic variance, or both.
The magnitudes of genetic and environmental contributions to late-life cognitive function might differ from those at earlier ages for severalreasons. Reduction in evolutionary pressures in late life as compared toother life stages is posited to lead to amplification of stochastic (i.e.,random, Finch & Kirkwood, 2000) and epigenetic processes (Fragaet al., 2005). For example, many individual-level factors (i.e., bloodpressure, and physical exercise) are associated with late-life cognitivefunctioning but not with cognitive status at younger ages (Anstey &Christensen, 2000). The cumulative effect of these factors might bereflected by increased environmental contributions to phenotypic var-iance with age (c.f., Baltes, Reese, & Lipsitt, 1980). Alternatively,changes in the magnitudes of genetic contributions may reflect ampli-fication of existing genetic factors or mechanisms of gene-environmentinterplay (Reynolds, Finkel, & Zavala, 2013). For instance, geneticfactors that protect against environmental influences leading to cogni-tive decline (e.g., active developmental processes, Scarr & McCartney,1983) can lead to greater genetic variance in late life. High educationalattainment, occupational complexity, and intellectually-stimulatingactivities may reflect genetically influenced selections that promotecognitive reserve and prevent decline (Bosma et al., 2002).
Behavioral genetic research on cognitive abilities does not alwaysprovide consistent evidence for age differences in relative magnitudesof genetic influences. Finkel and Reynolds (2010) reviewed the beha-vioral genetic literature on cognitive aging and concluded that herit-ability of GCA appears to increase through approximately age 60 anddeclines thereafter. Yet, in a subsequent large cross-sectional study of2332 Danish twins age 46 to 96 years, McGue and Christensen (2013)reported that the magnitude of genetic influence on a measure of GCAwas stable across age. Unlike the differential patterns observed by in-dependent studies, recent meta-analyses of twin studies have betterconvergence to the patterns observed. In a recent meta-analysis of twinstudies, Reynolds and Finkel (2015) reported that the heritabilities ofspecific cognitive abilities including verbal, spatial and memory, werelargely stable or slightly increasing with age. Similarly, a large-scalemeta-analysis of all published twin studies by Polderman et al. (2015)also found consistent evidence for stable heritability across age groupsacross cognitive domains of clustered executive functioning andmemory abilities. Although these meta-analyses seem to provide aclearer and more consistent pattern of the genetic and environmentalcontributions to late life, they may be also obscuring differential tra-jectories for specific cognitive abilities, and indeed losing importantinformative differences across time.
Limited sample sizes and study and country differences may con-tribute to the apparent inconsistency of results concerning age mod-eration of genetic influences. In many cases, heritability of late-lifecognitive ability is estimated in samples with a few hundred twin pairs,making it difficult for a single study to distinguish heritability differ-ences across a wide age range reliably. Moreover, studies do not alwaysreport parameter estimates for the same biometric model, making itdifficult to compare estimates using meta-analytic methods. For ex-ample, the shared environmental contribution is not always reportedand some reported heritability estimates are based on models droppingthis component.
This study includes 14,534 participants from a twin study con-sortium to investigate age moderation of genetic and environmentalinfluences on cognitive ability in mid- through late-life. The largesample, broad age range (26 to 98 years), and multiple cognitive abil-ities included (six tests representing four separate domains of cognitive
functioning – short-term/working memory, processing speed, spatialprocessing, and verbal ability) make this the most comprehensive testto date of the hypothesis that the magnitudes of genetic and environ-mental influences on cognitive functioning differ in late-life comparedto earlier life stages. In addition, the consortium this study is derivedfrom provides a special opportunity to directly assess differential evi-dence found by independent studies, often from competing independentstudies that are included in this consortium group, while simulta-neously examining if there are informative differences across time thatmeta-analytic work may not have been able to observe.
2. Method
2.1. Participants
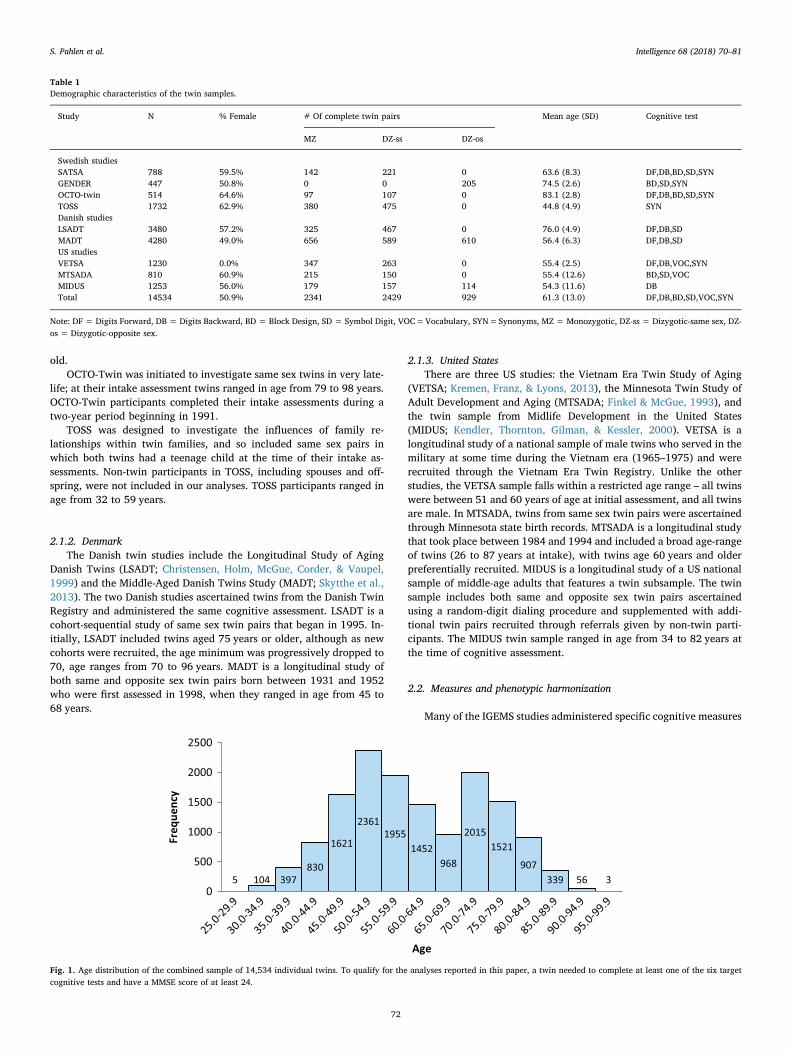
The sample was drawn from nine studies representing three sepa-rate countries (Sweden, Denmark, and the United States) from theInterplay of Genes and Environment across Multiple Studies (IGEMS)consortium (Pedersen et al., 2013). No studies had overlapping parti-cipants. To be included in our analysis, participants had to have com-pleted at least one of six cognitive tests (described below), and have aMini-Mental State Examination (MMSE) score of at least 24, followingthe typical cutoff for cognitive impairment (Tombaugh & McIntyre,1992). A total of 1136 (7.8% of the total number of potential partici-pants) were excluded based on this screen, leaving a sample of 14,534(50.9% women) individual twins. The sample included 2341 pairs ofmonozygotic (MZ) twins, 2429 pairs of dizygotic-same sex twins (DZ-ss), and 929 pairs of dizygotic-opposite sex twins (DZ-os). The samplealso included 3128 unpaired twins, who were informative with respectto age differences in means and variances and so were included in theanalyses. For studies with longitudinal assessments, only data from thefirst test administration for each participant were used in the cross-sectional analyses reported here. Mean age at that measurement occa-sion was 61.3 years (Mdn = 59.82, SD = 13.0). The median wasslightly lower than the mean, suggesting a positive skew, although thedifference is about a one tenth of a SD. Demographic characteristics foreach study, including sample size, gender ratio, age, zygosity and whichcognitive tests were administered, are given in Table 1. Fig. 1 gives theage distribution of the total sample. Brief descriptions of each of thenine studies, separated by country of origin, are given below. Addi-tional details concerning the methodology for each study can be foundin the citations provided.
2.1.1. SwedenIGEMS includes four Swedish studies whose samples were all as-
certained from records from the Swedish Twin Registry: SwedishAdoption/Twin Study of Aging (SATSA; Pedersen et al., 1991), Aging inWomen and Men (GENDER; Gold, Malmberg, McClearn, Pedersen, &Berg, 2002), Origins of Variance in the Oldest-Old (OCTO-Twin;McClearn et al., 1997), and Twin-Offspring Study in Sweden (TOSS;Neiderhiser, Reiss, Lichtenstein, Spotts, & Ganiban, 2007). Parallelcognitive assessments were used across SATSA, OCTO-Twin andGENDER, and all three studies were longitudinal. The Swedish studiesare distinguished by the age range and zygosity represented. SATSAparticipants include same-sex twins, with a subsample of twins rearedapart matched to a subsample of twins reared together by birthdate andcounty of birth and gender. SATSA in-person testing protocol (IPT)followed a cohort-sequential protocol. Those who had reached age 50were invited to participate in IPT that began in 1986. At subsequentIPTs, typically conducted at 3-year intervals, SATSA-eligible twins whoreached age 50 were invited to participate. Intake cognitive data werecollected over four IPT sessions. The age range at initial cognitivetesting was 50.0 to 88.0.
GENDER consists of opposite sex twin pairs born between 1906 and1925. Intake cognitive assessments were completed during a four-yearperiod starting in 1995, when the twins were between 70 and 81 years
S. Pahlen et al. Intelligence 68 (2018) 70–81
71
old.OCTO-Twin was initiated to investigate same sex twins in very late-
life; at their intake assessment twins ranged in age from 79 to 98 years.OCTO-Twin participants completed their intake assessments during atwo-year period beginning in 1991.
TOSS was designed to investigate the influences of family re-lationships within twin families, and so included same sex pairs inwhich both twins had a teenage child at the time of their intake as-sessments. Non-twin participants in TOSS, including spouses and off-spring, were not included in our analyses. TOSS participants ranged inage from 32 to 59 years.
2.1.2. DenmarkThe Danish twin studies include the Longitudinal Study of Aging
Danish Twins (LSADT; Christensen, Holm, McGue, Corder, & Vaupel,1999) and the Middle-Aged Danish Twins Study (MADT; Skytthe et al.,2013). The two Danish studies ascertained twins from the Danish TwinRegistry and administered the same cognitive assessment. LSADT is acohort-sequential study of same sex twin pairs that began in 1995. In-itially, LSADT included twins aged 75 years or older, although as newcohorts were recruited, the age minimum was progressively dropped to70, age ranges from 70 to 96 years. MADT is a longitudinal study ofboth same and opposite sex twin pairs born between 1931 and 1952who were first assessed in 1998, when they ranged in age from 45 to68 years.
2.1.3. United StatesThere are three US studies: the Vietnam Era Twin Study of Aging
(VETSA; Kremen, Franz, & Lyons, 2013), the Minnesota Twin Study ofAdult Development and Aging (MTSADA; Finkel & McGue, 1993), andthe twin sample from Midlife Development in the United States(MIDUS; Kendler, Thornton, Gilman, & Kessler, 2000). VETSA is alongitudinal study of a national sample of male twins who served in themilitary at some time during the Vietnam era (1965–1975) and wererecruited through the Vietnam Era Twin Registry. Unlike the otherstudies, the VETSA sample falls within a restricted age range – all twinswere between 51 and 60 years of age at initial assessment, and all twinsare male. In MTSADA, twins from same sex twin pairs were ascertainedthrough Minnesota state birth records. MTSADA is a longitudinal studythat took place between 1984 and 1994 and included a broad age-rangeof twins (26 to 87 years at intake), with twins age 60 years and olderpreferentially recruited. MIDUS is a longitudinal study of a US nationalsample of middle-age adults that features a twin subsample. The twinsample includes both same and opposite sex twin pairs ascertainedusing a random-digit dialing procedure and supplemented with addi-tional twin pairs recruited through referrals given by non-twin parti-cipants. The MIDUS twin sample ranged in age from 34 to 82 years atthe time of cognitive assessment.
2.2. Measures and phenotypic harmonization
Many of the IGEMS studies administered specific cognitive measures
Table 1Demographic characteristics of the twin samples.
Study N % Female # Of complete twin pairs Mean age (SD) Cognitive test
MZ DZ-ss DZ-os
Swedish studiesSATSA 788 59.5% 142 221 0 63.6 (8.3) DF,DB,BD,SD,SYNGENDER 447 50.8% 0 0 205 74.5 (2.6) BD,SD,SYNOCTO-twin 514 64.6% 97 107 0 83.1 (2.8) DF,DB,BD,SD,SYNTOSS 1732 62.9% 380 475 0 44.8 (4.9) SYNDanish studiesLSADT 3480 57.2% 325 467 0 76.0 (4.9) DF,DB,SDMADT 4280 49.0% 656 589 610 56.4 (6.3) DF,DB,SDUS studiesVETSA 1230 0.0% 347 263 0 55.4 (2.5) DF,DB,VOC,SYNMTSADA 810 60.9% 215 150 0 55.4 (12.6) BD,SD,VOCMIDUS 1253 56.0% 179 157 114 54.3 (11.6) DBTotal 14534 50.9% 2341 2429 929 61.3 (13.0) DF,DB,BD,SD,VOC,SYN
Note: DF = Digits Forward, DB = Digits Backward, BD = Block Design, SD = Symbol Digit, VOC=Vocabulary, SYN=Synonyms, MZ = Monozygotic, DZ-ss = Dizygotic-same sex, DZ-os = Dizygotic-opposite sex.
Fig. 1. Age distribution of the combined sample of 14,534 individual twins. To qualify for the analyses reported in this paper, a twin needed to complete at least one of the six targetcognitive tests and have a MMSE score of at least 24.
S. Pahlen et al. Intelligence 68 (2018) 70–81
72

in addition to those analyzed here. We made use of only those measuresthat could be harmonized across more than one study. This resulted inthe inclusion of six different cognitive ability measures: Digits Forward,Digits Backward, Block Design, Symbol Digit, Vocabulary, andSynonyms. These tests covered four cognitive domains: short-term/working memory (Digits Forward and Digits Backward), spatial pro-cessing (Block Design), processing speed (Symbol Digit), and verbalcomprehension (Synonyms and Vocabulary).
2.2.1. Digits forwardFive of the studies (SATSA, OCTO-Twin, LSADT, MADT and VETSA)
administered a Digits Forward task (total N = 10,206). The twoSwedish and two Danish studies used the same procedure, which in-volved reading a 3- to 9-digit number string and asking the respondentto repeat each string in the correct order as administrated, but haddifferent scoring. In Sweden, the score was the highest string lengththat the respondent correctly repeated so it could vary from 0 to 9; inDenmark the score was the total number of correctly repeated stringsfor both trials so it could vary from 0 to 14. The Digits Forward taskused in VETSA was based on the Weschler Memory Scale-III (WMS-III,Weschler, 1997) Digit Span subtest. The same basic administrationprocedure was followed as in the Scandinavian studies, except stringsranged in length from 2 through 11. VETSA used the same scoringprocedure as in the Danish studies, so that the total score could rangefrom 0 to 20.
2.2.2. Digits backwardSix of the studies (SATSA, OCTO-Twin, LSADT, MADT, VETSA and
MIDUS) administered a Digits Backward task (total N = 11,442), whichrequired the respondent to repeat a sequence of numbers in the reverseorder as presented. The same Digits Backward task, a string lengthranging from 2 to 8, was used in the two Swedish and two Danishstudies, with the same scoring in each study as was used for DigitsForward. The VETSA task was derived from the WMS-III and includedtwo trials at each length from 2 through 10, scored as the total numberof correctly repeated strings (varying from 0 to 18). The MIDUS taskinvolved the same procedure, sequence lengths, and scoring as used inthe Swedish studies, although it was administered over the telephonerather than in person (Tun & Lachman, 2006).
2.2.3. Block designFour of the studies (SATSA, GENDER, OCTO-Twin and MTSADA)
administered a Block Design task (total N = 2320). Block Design is aspatial processing task in which the respondent is asked to reproducethe target two-dimensional geometric shapes using sets of three-di-mensional colored blocks. The three Swedish studies used the KohsBlock Design Test (Stone, 1985). There were seven separate trials, eachscored on a 0 to 6 basis (scoring depending on the speed, efficiency, andaccuracy with which the target was reproduced). In MTSADA, the BlockDesign subtest from the Weschler Adult Intelligence Scale-Revised(WAIS-R, Weschler, 1981) was administered. This task is very similar tothe one used in the other studies, except it involved a total of nineitems, each scored for accuracy and speed and summed to give the totalscore.
2.2.4. Symbol digit (digit symbol)Five studies (SATSA, GENDER, OCTO-Twin, LSADT, and MADT)
administered a Symbol Digit task, while a sixth (MTSADA) adminis-tered a Digit Symbol task (total N = 8755). Both tasks measure per-ceptual speed and accuracy, and so were pooled in analyses reportedhere. For convenience we designate this combined task as Symbol Digit.The same task was administered in the three Swedish and two Danishstudies. Respondents were given a key containing nine separate two-dimensional geometric symbols that were assigned specific digits be-tween 1 and 9. They were then presented with rows of symbols andasked to state out loud what the correct digit was for each symbol. This
Symbol Digit task was administered in two blocks of 50 with 45 s al-lowed for each block. The score was the number of correct trials acrossthe two blocks (varying from 0 to 100). In MTSADA, the Digit Symboltask from the WAIS-R (Weschler, 1981) was administered. Respondentswere asked to write down the symbol that corresponded with eachtarget digit. There was one single administration of 90-second durationwith a total possible score of 90.
2.2.5. VocabularyTwo studies (VETSA and MTSADA) administered a Vocabulary test
in which respondents were required to generate definitions of words(total N = 2030). In VETSA, the Vocabulary subtest from the WechslerAbbreviated Scale of Intelligence (WASI; Weschler, 1999) was ad-ministered, while MTSADA administered the Vocabulary subtest fromthe WAIS-R (Weschler, 1981).
2.2.6. SynonymsFive studies (SATSA, GENDER, OCTO-Twin, TOSS and VETSA) ad-
ministered a Synonyms test (total N = 4523). In all cases, theSynonyms test required the respondent to select the word that providedthe best synonym to a target word from a set of alternatives. The spe-cific words, alternatives and number of items varied across studies.
2.3. Zygosity
The specific methods for zygosity determination varied somewhatfrom study to study but in most cases involved the use of questionnairessupplemented by DNA analysis to resolve uncertain cases. In all cases,regardless of the slight differences in methods to determine zygosity,methods have been validated for each study.
2.4. Scale harmonization
Because the numbers and difficulties of items, and scoring and ad-ministration procedures varied across studies, it was necessary to placecognitive test scores on a common metric while retaining informationabout age differences in means and variances. To start, we pooledcognitive tests for studies from the same country that had the sametesting procedures. Thus, the two Danish studies were pooled togetheras were the four Swedish studies. In addition to reducing the number ofsamples to compare, pooling increased the age coverage within eachpooled sample. The second step in harmonization involved dividingeach study sample into four age groups: below 50, 50 to 59.99, 60 to69.99, and 70 plus. These age groups were selected to provide adequatesample size in each age group and a single group (50 to 59.99) thatexisted for every test-study combination. The 50–59.99 group was thenused to harmonize the differences in scale across the multiple tests foreach of the six abilities. Specifically, for each test-study combination,after removing the main effect of sex, scores were linearly transformedto have a mean of 50.0 and standard deviation of 10.0 (i.e., a T-scoremetric) in the age 50 to 59.99 age group. In this way, we placed eachtest on the same scale while retaining information about variance dif-ferences across age. Finally, to minimize the impact of outlying ob-servations, we winsorized scores within each age group such that scoresgreater than± 3 SDs from the age group means were set equal to± 3SD as appropriate. The frequency of winsorized scores ranged from0.18% for Block Design to 0.88% for Digits Forward. In a normal dis-tribution we would expect 0.3% of scores to fall outside the± 3 SDsrange, so that there were slight excesses of cases in the tails of thedistributions of some of the cognitive tests. To correct for multipletesting, we set the significance threshold at 0.01, a value slightly largerthan the Bonferroni corrected value for 6 independent tests (i.e.,0.008 = 0.05/6), because of the average inter-correlation among thecognitive measures was about 0.30.
S. Pahlen et al. Intelligence 68 (2018) 70–81
73

2.5. Statistical analysis
We first estimated twin correlations in each of the four age groups,separately by study then pooled across studies. Twin correlations by sexwere also examined, but no sex differences were found, thus sex wascollapsed by zygosity group. Although we clearly lose informationwhen a quantitative variable such as age is arbitrarily divided intodiscrete groups, these analyses allowed us to gain a preliminary sensefor how twin similarity varied across age group and study. Second, wedetermined which biometric model (ACE or ADE) best fit the data foreach test as seen in Table S2 of the supplement. The ACE model in-cluded additive genetic (A), shared environmental (C), and non-sharedenvironmental (E) components of variance; in the ADE model the Ccomponent was replaced by a non-additive genetic (D) component.With reared-together twin data, C and D cannot be simultaneously es-timated. Under these models, MZ twins share all additive genetic andnon-additive genetic effects, while DZ twins share half of the additiveeffect and one-quarter of the non-additive effect. The shared environ-ment represents the effects of environmental factors that contribute totwin similarity regardless of zygosity and so is shared equally by MZ
and DZ twins. The nonshared environment represents those environ-mental factors (as well as measurement error) that contribute to twindifferences and so is not shared by either MZ or DZ twins.
Lastly, our analyses involved fitting a series of age-moderated bio-metric models to the pooled twin data for each cognitive test treatingage as a continuous variable. The general age-moderation model isdepicted in Fig. 2 for one member of a twin pair. In this model, weassume that a quantitative phenotype (P) can be expressed as a functionof the three factors in the ACE or ADE model, the effect of each po-tentially moderated by a quadratic function in age.
Because preliminary analysis of DZ twin correlations indicated thatcorrelations for same sex and opposite sex pairs could be pooledwithout a significant increment in χ2, no distinction was made betweenthe two types of DZ twins in the age-moderation analyses. For eachcognitive outcome, seven models of increasing complexity were fit inMx (Neale, Boker, Xie, & Maes, 2004): 1) no-age-moderation, 2) onlythe total phenotypic variance was moderated by age (i.e., a scalarmoderation model implemented by allowing the phenotypic variance toincrease as a logistic function of age but constraining the relativecontributions of the three biometric components to be invariant acrossage), 3–5) linear age-moderation of one of the three biometric com-ponents only, 6) linear age-moderation model of all three biometriccomponents, and 7) both linear and quadratic age moderation of allthree biometric components. Model fit for the biometric models wasevaluated using both the χ2 goodness-of-fit test statistic and the AkaikeInformation Criteria (AIC = 2lnL + 2 k, where k is the number of es-timated parameters), with models having lower AIC preferred.
3. Results
3.1. Descriptive data
Mean test scores on the T-score scale by age group are reported inTable 2 and depicted in Fig. 3. Because of winsorization, the mean andSD in the age 50–59.99 age group deviated slightly from 50 and 10,respectively. Although the age-group effects were statistically sig-nificant for all tests, the magnitudes of these effects (as indicated by η2)were large for Block Design and Symbol Digit (i.e., > 27%), moderatefor Synonyms (i.e., 7.7%), and small for Digits Forward, Digits
Fig. 2. Biometric age-moderation model fit to the twin data. A quantitative phenotype (P)is assumed to be a function of underlying additive genetic (A), shared environmental (C),and non-shared environmental (E) effects. Age moderation is incorporated into the modelby allowing the effects of A, C or D (not depicted), and E to be a function of age andsquared age.
Table 2Mean (SD) cognitive test performance as a function of age group pooled across studies.
Cognitive test Age groupx ̅ (SD)
N
ANOVAresultsF (df)P
Agegroupeffectsizeη2
< 50 50–59 60–69 ≥70 Age group
Digits forward 50.8 (10.0) 50.0 (9.9) 49.0 (9.6) 48.7 (9.5) 18.5 (3) 0.0053498 1812 4111 p < .001785
Digits backward 51.3 (10.1) 50.0 (9.9) 48.6 (9.7) 46.4 (9.5) 132.1 (3) 0.0333855 2065 4241 p < .0011281
Block design 55.6 (9.8) 50.0 (9.9) 44.6 (10.4) 38.1 (9.6) 287.1 (3) 0.271428 554 1117 p < .001221
Symbol digit 54.1 (9.1) 49.9 (9.5) 44.7 (10.0) 36.2 (10.0) 1353.2 (3) 0.3171024 2347 2104 3280 p < .001
Vocabulary 50.1 (9.7) 50.1 (9.8) 47.0 (10.0) 45.9 (9.1) 12.4 (3) 0.018259 1357 353 61 p < .001
Synonyms 48.8 (9.2) 50.1 (9.6) 44.6 (10.6) 42.8 (12.2) 126.4 (3) 0.0771417 1836 293 977 p < .001
Note: Scores were transformed within each study to have a mean of 50 and an SD of 10 in the 50–59 age group and then winsorized to± 3SD. ANOVA results take into account theclustering of the twin data.
S. Pahlen et al. Intelligence 68 (2018) 70–81
74

Backward, and Vocabulary (i.e., < 5%). The pattern of age differenceswas consistent with what has been observed in previous cross-sectionalresearch. That is, Symbol Digit and Block Design showed larger agedifferences than the verbal tasks (Hoyer, Stawski, Wasylyshyn, &Verhaeghen, 2004) and within the Digit Span tasks, the age effect wasgreater for Digits Backward than Digits Forward (Bopp & Verhaeghen,2005).
3.2. Twin correlations
Table 3 gives the estimated twin correlations by age group pooledacross studies. For completeness, all correlations are reported eventhough the sample sizes in several cells were quite small (i.e., < 25).Also given in the table are the model fit statistics for testing whether thetwin correlations varied significantly across studies. Several generaltrends were noteworthy. First, there was little evidence for between-study heterogeneity in the twin correlations except for Synonyms,where pooling the correlations resulted in significant increase in the χ2
test statistic (at p = 0.001). Although the significant between-studyheterogeneity in the twin correlations for Synonyms suggests cautionwhen interpreting results for this scale, for completeness we reportmodeling results for this phenotype along with the others. Second,decreasing MZ twin correlations with age were observed for several ofthe cognitive tests (most notably Digits Forward, Digits Backward, andBlock Design), suggesting that genetic influences might decline with
age for these tests. Alternatively, stable MZ but declining DZ correla-tions were observed for Vocabulary and Synonyms, suggesting thatgenetic influences on these tests might increase with age. The purposeof the age-moderation analysis was to formalize these impressionswhile making maximal use of the available age information.
3.3. Age-moderated biometric analysis
Before fitting the age-moderated biometric models, we determinedwhich model, ACE or ADE, provided a better fit for each cognitive testby fitting the alternative three-parameter models to the pooled data.The ACE model had lower AICs for all cognitive tests except SymbolDigit, for which the ADE model was better-fitting (details in theSupplementary material). Table 4 gives fit statistics for the age-mod-eration models based on the best-fitting ACE or ADE model. For eachcognitive test we began with a no-age-moderation model and thentested to see whether adding various age-moderation terms improvedmodel fit. The best-fitting model by AIC is highlighted for each test.Several general trends were notable. First, for all cognitive tests exceptVocabulary, some form of age-moderation fit better than the no-age-moderation model. That is, when comparing the no-age-moderationmodel (#1) to the full age-moderation model that included both linearand quadratic age-moderation on the three biometric parameters (#7),the χ2 test was statistically significant (at p < .01) and the AIC for theno-age-moderation model was larger than for the full age-moderation
Fig. 3. Mean cognitive test score as a function of age group in the pooled sample. Cognitive scores were scaled to a T-score metric such that mean was 50.0 and standard deviation was10.0 in the 50–59 age group. Error bars give 95% confidence intervals for the means.
S. Pahlen et al. Intelligence 68 (2018) 70–81
75

model. Second, only for Symbol Digit was there evidence for quadraticage moderation. That is, the full age-moderation model did not fitbetter than the linear age-moderation model. Third, except for Voca-bulary, a model with age-moderation on the phenotypic variance only(#2) never fit better by AIC than a model with age-moderation on abiometric component. Fourth, for all five cognitive tests for which therewas evidence of age moderation, some form of moderation on the ge-netic component was required and included in the best-fitting model.Because moderation results can be sensitive to extreme scores on the
moderator, we repeated all age-moderation analyses with participants'ages winsorized to 45 and 85 for ages falling below or above theseboundaries, respectively. There were very few differences between themodels with ages winsorized or preserved. The patterns observed forthe variance components had the same trajectories in the two, and theindicated best-fitting models did not differ. Full sample results are re-ported here.
To determine if the different forms of assessment influenced theresults, we replicated the moderation models restricting our analyses to
Table 3Twin correlations by age-group pooled across studies.
Cognitive test Age group Twin correlation (95% CI)Number of pairs
MZ DZ-ss DZ-os
Digits forward (χ2 = 15.2 on 10df, p = .13)< 50 .36 (.20–.51) .21 (.03–.38) .32 (.13–.47)
124 116 10250–59 .48 (.42–.54) .30 (.23–.37) .25 (.15–.35)
695 622 291360–69 .43 (.33–.52) .25 (.13–.36) .14 (.00–.27)
285 287 214≥70 .31 (.23–.38) .25 (.18–.32) NA
447 593Digits backward (χ2 = 37.1 on 21df, p = .02)
< 50 .41 (.29–.52) .03 (−0.12–0.18) .33 (.18–.46)194 145179
50–59 .41 (.35–.47) .25 (.17–.32) .19 (.09–.29)745 664 327
60–69 .41 (.31–.49) .16 (.05–.26) .35 (.23.46)323 322 237
≥70 .29 (.21–.37) .21 (.14–.28) .27 (.73–.40)466 608 18
Block design (χ2 = 6.5 on 6df, p = .37)< 50 .71 (.56–.81) .59 (.33–.77) NA
60 3450–59 .74 (.63–.82) .44 (.28–.57) NA
85 11360–69 .64 (.52–.73) .32 (.16–.47) NA
124 123≥70 .54 (.41–.65) .28 (.11–.42) .22 (.09–.35)
124 133 203Symbol digit (χ2 = 21.5 on 16df, p = .16)
< 50 .60 (.50–.68) .15 (−.01–.30) .24 (.04–.41)190 97157
50–59 .51 (.44–.58) .25 (.15–.34) .27 (.16–.37)360 374 281
60–69 .58 (.51–.64) .35 (.25–.44) .33 (.20–.45)371 333 197
≥70 .56 (.48–.62) .32 (.23–.40) .34 (.18–.48)335 404 135
Vocabulary (χ2 = 7.9 on 2df, p = .02)< 50 .73 (.61–.82) .74 (.57–.84) NA
73 4450–59 .63 (.56–.69) .40 (.30–.49) NA
372 28960–69 .78 (.69–.84) .51 (.29–.67) NA
98 65≥70 .72 (.30–.90) −.01 (−.54–.52) NA
13 14Synonyms (χ2 = 21.7 on 6df, p = .001)
< 50 .68 (.62–.74) .51 (.43–.58) NA318 383
50–59 .56 (.49–.62) .29 (.20–.37) NA463 439
60–69 .76 (.61–.85) .30 (.10–.48) NA48 84
≥70 .73 (.60–.81) .24 (.06–.41) .43 (.31–.54)83 105 201
NA = Correlation not available; MZ = Monozygotic, DZ-ss = Dizygotic-same sex, DZ-os = Dizygotic-opposite sex. Parenthetical model fit statistics test the fit of pooling twin corre-lations across the multiple studies.
S. Pahlen et al. Intelligence 68 (2018) 70–81
76
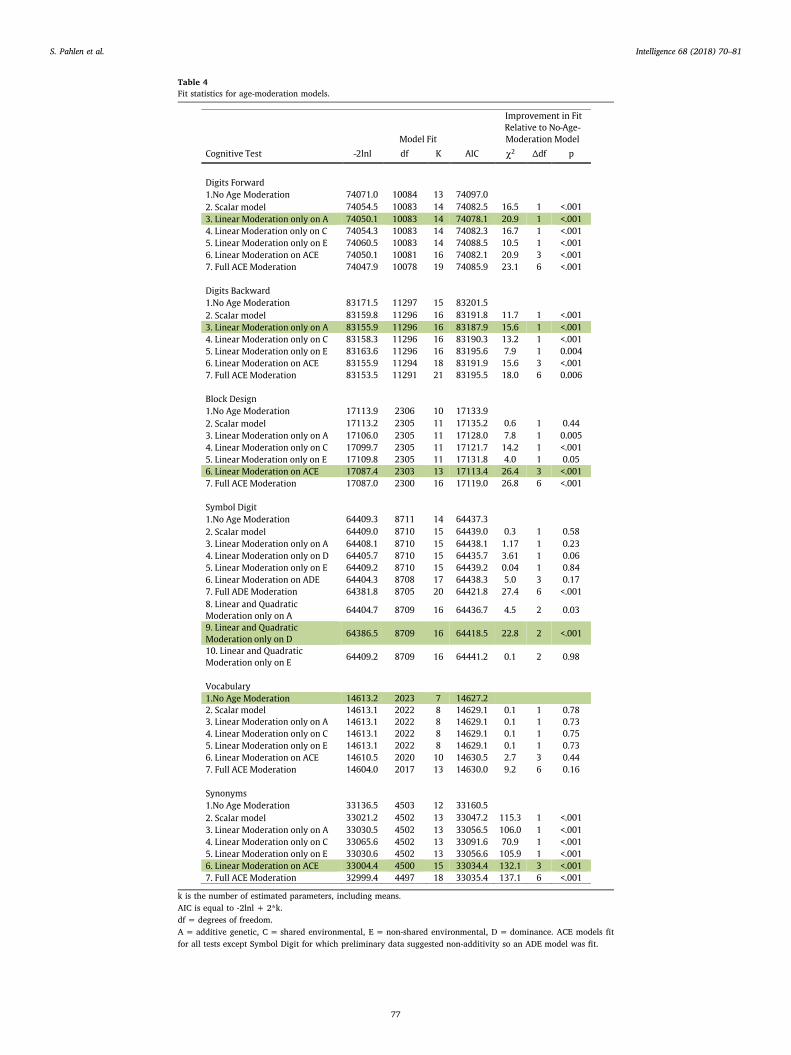
Table 4Fit statistics for age-moderation models.
Model Fit
Improvement in Fit
Relative to No-Age-
Moderation Model
Cognitive Test -2lnl df K AIC χ2 ∆df p
Digits Forward
1.No Age Moderation 74071.0 10084 13 74097.0
2. Scalar model 74054.5 10083 14 74082.5 16.5 1 <.001
3. Linear Moderation only on A 74050.1 10083 14 74078.1 20.9 1 <.001
4. Linear Moderation only on C 74054.3 10083 14 74082.3 16.7 1 <.001
5. Linear Moderation only on E 74060.5 10083 14 74088.5 10.5 1 <.001
6. Linear Moderation on ACE 74050.1 10081 16 74082.1 20.9 3 <.001
7. Full ACE Moderation 74047.9 10078 19 74085.9 23.1 6 <.001
Digits Backward
1.No Age Moderation 83171.5 11297 15 83201.5
2. Scalar model 83159.8 11296 16 83191.8 11.7 1 <.001
3. Linear Moderation only on A 83155.9 11296 16 83187.9 15.6 1 <.001
4. Linear Moderation only on C 83158.3 11296 16 83190.3 13.2 1 <.001
5. Linear Moderation only on E 83163.6 11296 16 83195.6 7.9 1 0.004
6. Linear Moderation on ACE 83155.9 11294 18 83191.9 15.6 3 <.001
7. Full ACE Moderation 83153.5 11291 21 83195.5 18.0 6 0.006
Block Design
1.No Age Moderation 17113.9 2306 10 17133.9
2. Scalar model 17113.2 2305 11 17135.2 0.6 1 0.44
3. Linear Moderation only on A 17106.0 2305 11 17128.0 7.8 1 0.005
4. Linear Moderation only on C 17099.7 2305 11 17121.7 14.2 1 <.001
5. Linear Moderation only on E 17109.8 2305 11 17131.8 4.0 1 0.05
6. Linear Moderation on ACE 17087.4 2303 13 17113.4 26.4 3 <.001
7. Full ACE Moderation 17087.0 2300 16 17119.0 26.8 6 <.001
Symbol Digit
1.No Age Moderation 64409.3 8711 14 64437.3
2. Scalar model 64409.0 8710 15 64439.0 0.3 1 0.58
3. Linear Moderation only on A 64408.1 8710 15 64438.1 1.17 1 0.23
4. Linear Moderation only on D 64405.7 8710 15 64435.7 3.61 1 0.06
5. Linear Moderation only on E 64409.2 8710 15 64439.2 0.04 1 0.84
6. Linear Moderation on ADE 64404.3 8708 17 64438.3 5.0 3 0.17
7. Full ADE Moderation 64381.8 8705 20 64421.8 27.4 6 <.001
8. Linear and Quadratic
Moderation only on A64404.7 8709 16 64436.7 4.5 2 0.03
9. Linear and Quadratic
Moderation only on D64386.5 8709 16 64418.5 22.8 2 <.001
10. Linear and Quadratic
Moderation only on E64409.2 8709 16 64441.2 0.1 2 0.98
Vocabulary
1.No Age Moderation 14613.2 2023 7 14627.2
2. Scalar model 14613.1 2022 8 14629.1 0.1 1 0.78
3. Linear Moderation only on A 14613.1 2022 8 14629.1 0.1 1 0.73
4. Linear Moderation only on C 14613.1 2022 8 14629.1 0.1 1 0.75
5. Linear Moderation only on E 14613.1 2022 8 14629.1 0.1 1 0.73
6. Linear Moderation on ACE 14610.5 2020 10 14630.5 2.7 3 0.44
7. Full ACE Moderation 14604.0 2017 13 14630.0 9.2 6 0.16
Synonyms
1.No Age Moderation 33136.5 4503 12 33160.5
2. Scalar model 33021.2 4502 13 33047.2 115.3 1 <.001
3. Linear Moderation only on A 33030.5 4502 13 33056.5 106.0 1 <.001
4. Linear Moderation only on C 33065.6 4502 13 33091.6 70.9 1 <.001
5. Linear Moderation only on E 33030.6 4502 13 33056.6 105.9 1 <.001
6. Linear Moderation on ACE 33004.4 4500 15 33034.4 132.1 3 <.001
7. Full ACE Moderation 32999.4 4497 18 33035.4 137.1 6 <.001
k is the number of estimated parameters, including means.AIC is equal to -2lnl + 2*k.df = degrees of freedom.A = additive genetic, C = shared environmental, E = non-shared environmental, D = dominance. ACE models fitfor all tests except Symbol Digit for which preliminary data suggested non-additivity so an ADE model was fit.
S. Pahlen et al. Intelligence 68 (2018) 70–81
77

only those studies that had used the exact same test. There were onlytwo tests, Digits Forward and Backward, where this was possible.Overall, the pattern of results for these two tests did not differ markedlywhen using all available data versus only using data based on the sametest. Finally, to assess the power of the age moderation tests, we firstderived the median observed non-centrality parameter for each age-moderation model across cognitive tests. For each cognitive test, wethen derived the observed power for rejecting the null hypothesis withthe effect size set at this median value. Based on this analysis, the ob-served power was at least 88% for the best-fitting models and rangedfrom 71% to 100% for the full age-moderation model (i.e., Model #7;details provided in Supplementary material, Table S9).
Graphical displays of the age-moderation results are provided for theraw variance components and phenotypic variances with 95% confidenceintervals in Fig. 4 and the standardized estimates with 95% confidenceintervals in Fig. 5. To facilitate comparisons across tests, estimates arereported for the linear moderation on ACE model (#6), except for SymbolDigit where quadratic age moderation for the ADE model (#7) is reported.Several patterns were evident. First, phenotypic variance increased for thetwo verbal tests, decreased for the two Digit Span tests and Block Design,and was generally stable for Symbol Digit. Second, Digits Forward andDigits Backward show a near identical pattern of declining genetic var-iances but stable shared environmental and non-shared environmentalvariances. As a consequence, the heritability of the two span measuresdeclined from about 35% at age 45 to 20% at age 80. Third, the two verbaltests, Vocabulary and Synonyms, showed similar patterns of increasinggenetic variances and declining shared environmental variances across ageeven though the no-age-moderation model fit best for Vocabulary and thelinear moderation on ACE model fit best for Synonyms. The non-sharedenvironmental component was, however, stable with age for Vocabularybut increasing for Synonyms. Heritability estimates for these two testsincreased from 30 to 40% at age 45 to 65–75% at age 85. Third, althoughheritability of Block Design was relatively stable across age (at approxi-mately 45%), on the raw scale this test showed declining genetic andshared environmental variance and increasing non-shared environmental
variance with age. Finally, Symbol Digit, the only test for which modelinganalyses supported quadratic age-moderation effects and where the ADEmodel fit better than the ACE model, showed an increase in additive ge-netic variance and a decrease in dominance genetic variance up to aboutage 60 followed by relative stability in these components through age 80.The total genetic variance being the sum of additive and dominance ef-fects, however, was stable across the full age range for Symbol Digit.
4. Discussion
Cross-sectional analyses of six specific measures of cognitive func-tion in a combined sample of 14,534 twins aged 26 to 98 years revealedage differences in the magnitudes of genetic and environmental con-tributions to phenotypic variance that varied across test. Before dis-cussing these findings, we acknowledge the limitations of our study.First, pooling cognitive measures across nine twin samples may obscureimportant between-study differences. Nonetheless, there was limitedstatistical evidence of between-study heterogeneity in twin similarity,apart from the verbal domain, suggesting that it may not be an im-portant contributor to our results. Second, the twin samples came fromthree relatively affluent countries, which may limit the generalizabilityof our findings. Lastly, the six tests we investigated were not all ad-ministered in the nine studies nor do they capture the full range ofcognitive abilities implicated in aging. Consequently, we could notharmonize a valid measure of GCA1; however, our results are still
Fig. 4. Raw variance component estimates and total phenotypic variance with 95% confidence intervals from the age-moderation model. A = additive genetic component of variance,C = shared environmental variance component, D = dominance variance component and E = non-shared environmental variance component.
1 Please note, an attempt to harmonize a GCA was conducted for a subset of the studiesusing only the Swedish and Danish studies as these studies had the most comprehensivecognitive test coverage and same test administration. The GCA factor created from allavailable cognitive tests for these studies could not be harmonized as the within studyheterogeneity was too high. Additionally, a GCA factor was created using the same testcoverage (Digit Span and Symbol Digit tests) between these same studies and no agemoderation evidence was found based on model test fit. It is unknown if this is a truepattern for GCA or an artifact due to limited cognitive test coverage since this GCA factorcould not be validated within this study.
S. Pahlen et al. Intelligence 68 (2018) 70–81
78

informative about GCA. As a single measure, GCA can, of course, haveonly one best-fitting model with respect to age moderation from mid- tolate life. Therefore, our results indicate that examination of age-mod-eration effects on genetic and environmental variance in GCA mustobscure differing directional change for the various specific cognitiveabilities that underlie GCA. GCA typically represents a composite ofmultiple specific cognitive measures. Our results suggest that thesespecific measures show different patterns of age moderation of theunderlying biometric components of variance.
Despite the above mentioned limitations, our findings provide acomprehensive and informative picture of how genetic influences oncognitive abilities vary across adulthood. Overall, the heritability esti-mates we report as seen in Table 3 are consistent with past research onspecific cognitive abilities (i.e., 23–62%, Reynolds & Finkel, 2015).Research with younger samples has consistently found that the herit-ability of GCA increases through early adulthood (Bergen et al., 2007;Haworth et al., 2010), but it is not known whether the same is true forspecific cognitive abilities. We sought to address if there is any differ-ence in heritability of cognitive abilities across age in late life. There area limited number of twin studies of cognitive function in mid- to late-adulthood, and the studies that do exist have reported increasing, de-creasing, as well as stable patterns of heritability with age (Finkel &Reynolds, 2010). This heterogeneity may be the result of differentcognitive abilities having different patterns of heritability with age, apossibility that is supported by our findings. Importantly, a pattern ofchanging heritability could arise because the underlying biometriccomponents are not all changing at the same rate. For example, in-creasing heritability can be the result of an increasing genetic compo-nent but stable environmental components, or alternatively, decreasingenvironmental components but a stable genetic component. To resolvethese possibilities, it is important to investigate age differences in theunderlying biometric components, as we did in this study.
The two verbal tasks, Vocabulary and Synonyms, showed age pat-terning consistent with what has been observed at earlier
developmental stages: greater A (additive genetic variance) at higherages combined with less C (shared environmental variance). Althoughwe interpret this common pattern here, it is important to recognize thatwe did not find statistical evidence for significant age moderation forVocabulary. At younger developmental stages, this pattern of increasingA with decreasing C has been hypothesized to be due to a shift frompassive gene-shared environment to active gene-non-shared environ-ment correlational processes (Scarr & McCartney, 1983). That is, asindividuals achieve greater independence in early adulthood, they in-creasingly seek out environments and experiences that are consistentwith and reinforce their underlying genetic dispositions. This activematching of environment to genotype would result in amplification ofgenetic variance and consequent increases in genetic variance (Briley &Tucker-Drob, 2013). By extension, many estimates of genetic influencesin cross-sectional studies reported to date are biased. The results re-ported here are consistent with active genotype-environment correla-tional processes continuing to be important throughout mid- and late-life for verbal-related abilities. The finding that intellectual engagementin midlife was significantly heritable (McGue, Skytthe, & Christensen,2014) suggests that intellectual engagement might be a useful target infuture investigations of the role of active gene-environment correla-tional processes in late-life cognitive functioning. Why this processwould apply to only two of the six cognitive tests we investigated is,however, unclear. One possibility is that word knowledge may beamenable to active gene-environment correlation because it is amen-able to routine practice (e.g., through reading books), while the othercognitive tasks we assessed are typically not required in everyday life.Regardless, resolving the basis for greater genetic variance with ageobserved with the verbal tests will ultimately require analysis of long-itudinal data.
Although the age moderation models for vocabulary seem to pro-vide an interesting pattern of genetic and environmental contributions,we want to be cautious in interpreting this result to discuss why thiswas the only one of six measures in which age moderation was non-
Fig. 5. Standardized variance component estimates with 95% confidence intervals from the age-moderation model; a2 = proportion of phenotypic variance attributed to additive geneticfactors, c2 = proportion of phenotypic variance attributed to shared environmental factors, d2 = proportion of phenotypic variance attributed to dominance factors, and e2 = proportionof phenotypic variance attributed to non-shared environmental factors.
S. Pahlen et al. Intelligence 68 (2018) 70–81
79

significant. Low power may have contributed to our failure to findevidence for age moderation. Vocabulary had the smallest sample,N = 968, of all cognitive tests examined. We did find significant agemoderation effects for Block Design, which had only a slightly largersample size (N = 996), but there were only 27 people in the> 70 agegroup for Vocabulary compared with 257 for Block Design. Notably,68% of the sample for Vocabulary fell in the 50–59 age range, sug-gesting that the combination of relatively small sample size and low agevariability limited the power for Vocabulary. Consistent with this in-terpretation, among all tests the observed statistical power under thefull ACE moderation model (#7) was lowest for Vocabulary (71%,Supplementary Table S9).
A common interpretation of the lifespan developmental perspectiveleads to the expectation that the E (non-shared environmental variance)contribution to cognitive function will increase with age (Baltes et al.,1980). We found evidence for notable age increases in E for only twocognitive tests: Block Design and Synonyms. This increase in E is furtherstrengthened when A is either stable or decreasing, a pattern observedfor Block Design. Since E is confounded with measurement error,however, an increase in E could be due to declining reliability ratherthan increasing importance of unique experiential factors. We indirectlyevaluated the possibility of differential reliability by assessing the inter-test correlations in all of the four age groups for five test pairings (TableS1 in the Supplemental materials). The resulting average phenotypiccorrelations ranged from .34 in the< 50 group to .42 in the 70 andolder group, suggesting little differential attenuation caused by mea-surement error. This observation was also supported by the stable split-half correlations reported by the WAIS-R for Block Design in age groupscovering 16 to 74 (Weschler, 1981). Our results thus suggested thatBlock Design and Synonyms might be usefully targeted to identify theunique experiential factors that contribute to individual differences inlate-life cognitive functioning. Alternatively, greater E with age maysignal greater differences in genetic sensitivity to environmental ex-posures (Reynolds et al., 2013), as in standard biometric models ofreared-together twin data gene by non-shared environmental interac-tion effects are included in the estimate of E.
Although we observed greater E with age for Block Design andSynonyms, A for these tests was either slightly lower (Block Design) ornotably greater with age (Synonyms). When these patterns were ex-tended to the standardized model (as seen in Fig. 5), heritability wasobserved to be stable and greater with age for Block Design and Sy-nonyms, respectively. We only observed smaller heritability with agefor the two Digit Span tasks, and in both cases this owed to smaller Arather than to greater E. This pattern was unexpected but does mirror asimilar pattern found for GCA after age 60 by Finkel and Reynolds(2010). The decrease in the genetic component of variance for the spanmeasures could arise if task performance strategies change with age,possibly due to perceptions about memory function. Longitudinal stu-dies are needed to determine whether the decline in genetic influencefor the span measures is due to different genetic factors influencingspan performance at different ages or the same genetic factors havingdifferent magnitudes of effect at different ages.
The genetic contributions to Block Design and Symbol Digit wererelatively stable with age, which is in contrast to the lower heritabilityof Digit Span measures, or the greater heritability of the verbal mea-sures with age. For Symbol Digit, the only test for which the ADE modelfit best, E was stable with age, but A increased through age 70 while thedominance variance component (D) declined after age 60. As a con-sequence, the total genetic contribution (i.e., additive plus dominance)on both the raw and standardized scale was largely stable for this test.For Block Design the heritability increased slightly with age, despiteslightly less A with age but substantially greater E. This seeminglyanomalous pattern was the consequence of sharply less C with age forBlock Design. Less C with age was observed with all three tests, BlockDesign, Vocabulary, and Synonyms, for which there was evidence ofmoderate shared environmental influences at the youngest ages in our
sample. This pattern is consistent with the general finding in behavioralgenetics that the shared environment becomes diminishingly importantthe further one is temporally removed from the rearing home(Lichtenstein, Pedersen, & McClearn, 1992).
In summary, we found evidence of age moderation of the biometriccomponents of variance that differed across cognitive tasks.Considering proportions of variance, we observed increasing herit-ability for Vocabulary and Synonyms, decreasing heritability for DigitsForward and Digits Backward, and stable heritability for Block Designand Symbol Digit. We found support for the prediction from lifespandevelopmental theory that unique experiences become increasinglyimportant with age for Block Design and Synonyms. Alternatively, forthe two verbal tasks, Vocabulary and Synonyms, we found evidenceconsistent with the increasing importance of active gene-environmentcorrelational processes with age.
This study provides a preliminary step on moving closer to fillingthe gaps within the behavior genetic literature on cognitive abilitiestrajectories in late life but more work is still needed. In the future, weplan to extend our analyses to longitudinal data to explore intra-in-dividual variability across age and time, an opportunity available be-cause most of the IGEMS studies are longitudinal. Relatedly, potentialbirth cohort effects not examined here will be explored in subsequentwork. In addition, to better understand the mechanisms influencing thedifferential developmental pathways for specific cognitive measures,possible gene-environment interactions should be explored. In conclu-sion, this study aids in trying to bring convergence on a topic within theliterature often plagued by discrepant findings. This study also high-lights the importance of investigating specific cognitive traits across agesince genetic and environmental influences varied by measure. Lastly,this study shows that large scale harmonization projects are possibleand can provide nuanced and informative findings potentially obscuredby standard meta-analytic approaches or unavailable to smaller in-dividual studies.
Author contributions
All authors helped to conceptualize the project and design the dataanalysis through conference calls. All authors read, commented, editedmultiple drafts of the paper, and approved the final version. SP, NRHand MM took primary responsibility for undertaking the analyses; SPand MM took primary responsibility for writing the initial draft of thepaper. Data were contributed by IP & KC (MADT and LSADT); CEF andWSK (VETSA); RFK (MIDUS); JMN (TOSS); NLP, ADA, CAR, DF, andMG (SATSA, OCTO-Twin and Gender); and MM (MTSADA).
Acknowledgement
IGEMS is supported by the National Institutes of Health grant nos.R01 AG037985 and R56 AG037985. SATSA was supported by grantsR01 AG04563, R01 AG10175, the MacArthur Foundation ResearchNetwork on Successful Aging, the Swedish Council For Working Lifeand Social Research (FAS) (97:0147:1B, 2009-0795) and SwedishResearch Council (825-2007-7460, 825-2009-6141). OCTO-Twin wassupported by grant R01 AG08861. Gender was supported by theMacArthur Foundation Research Network on Successful Aging, TheAxel and Margaret Ax:son Johnson's Foundation, The Swedish Councilfor Social Research, and the Swedish Foundation for Health CareSciences and Allergy Research. TOSS was supported by grant R01MH54610 from the National Institutes of Health. The Danish TwinRegistry is supported by grants from The National Program for ResearchInfrastructure 2007 from the Danish Agency for Science andInnovation, the Velux Foundation and the US National Institute ofHealth (P01 AG08761). The Minnesota Twin Study of AdultDevelopment and Aging was supported by NIA grant R01 AG06886.VETSA was supported by National Institute of Health grants NIA R01AG018384, R01 AG018386, R01 AG022381, and R01 AG022982, and,
S. Pahlen et al. Intelligence 68 (2018) 70–81
80

in part, with resources of the VA San Diego Center of Excellence forStress and Mental Health. The Cooperative Studies Program of theOffice of Research & Development of the United States Department ofVeterans Affairs has provided financial support for the developmentand maintenance of the Vietnam Era Twin (VET) Registry. The contentof this manuscript is solely the responsibility of the authors and doesnot necessarily represent the official views of the NIA/NIH, or the VA.
Appendix A. Supplementary data
Supplementary data to this article can be found online at https://doi.org/10.1016/j.intell.2017.12.004.
References
Anstey, K., & Christensen, H. (2000). Education, activity, health, blood pressure andapolipoprotein E as predictors of cognitive change in old age: A review. Gerontology,46(3), 163–177. http://dx.doi.org/10.1159/000022153.
Baltes, P. B., Reese, H. W., & Lipsitt, L. P. (1980). Life-span developmental psychology.Annual Review of Psychology, 31, 65–110.
Bergen, S. E., Gardner, C. O., & Kendler, K. S. (2007). Age-related changes in heritabilityof behavioral phenotypes over adolescence and young adulthood: A meta-analysis.Twin Research and Human Genetics, 10(3), 423–433.
Bopp, K. L., & Verhaeghen, P. (2005). Aging and verbal memory span: A meta-analysis.The Journals of Gerontology. Series B, Psychological Sciences and Social Sciences, 60(5),P223–P233.
Bosma, H., van Boxtel, M. P. J., Ponds, R., Jelicic, M., Houx, P., Metsemakers, J., & Jolles,J. (2002). Engaged lifestyle and cognitive function in middle and old-aged, non-de-mented persons: A reciprocal association? Zeitschrift Fur Gerontologie Und Geriatrie,35(6), 575–581. http://dx.doi.org/10.1007/s00391-002-0080-y.
Briley, D. A., & Tucker-Drob, E. M. (2013). Explaining the increasing heritability ofcognitive ability across development a meta-analysis of longitudinal twin andadoption studies. Psychological Science, 24(9), 1704–1713. http://dx.doi.org/10.1177/0956797613478618.
Christensen, K., Holm, N. V., McGue, M., Corder, L., & Vaupel, J. W. (1999). A Danishpopulation-based twin study on general health in the elderly. Journal of Aging andHealth, 11, 49–64.
Finch, C. E., & Kirkwood, T. B. L. (2000). Chance, development, and aging. New York:Oxford University Press.
Finkel, D., & McGue, M. (1993). The origins of individual differences in memory amongthe elderly: A behavior genetic. Psychology and Aging, 8, 527–537.
Finkel, D., & Reynolds, C. A. (2010). Behavioral genetic investigations of cognitive aging.In Y. K. Kim (Ed.). Handbook of behavior genetics (pp. 101–112). New York: Springer.
Fraga, M. F., Ballestar, E., Paz, M. F., Ropero, S., Setien, F., Ballestart, M. L., ... Esteller, M.(2005). Epigenetic differences arise during the lifetime of monozygotic twins.Proceedings of the National Academy of Sciences of the United States of America, 102(30),10604–10609. http://dx.doi.org/10.1073/pnas.0500398102.
Gold, C. H., Malmberg, B., McClearn, G. E., Pedersen, N. L., & Berg, S. (2002). Gender andhealth: A study of older unlike-sex twins. The Journals of Gerontology. Series B,Psychological Sciences and Social Sciences, 57(3), S168–S176.
Haworth, C. M. A., Wright, M. J., Luciano, M., Martin, N. G., de Geus, E. J. C., vanBeijsterveldt, C. E. M., ... Plomin, R. (2010). The heritability of general cognitiveability increases linearly from childhood to young adulthood. Molecular Psychiatry,15(11), 1112–1120. http://dx.doi.org/10.1038/mp.2009.55.
Hoyer, W. J., Stawski, R. S., Wasylyshyn, C., & Verhaeghen, P. (2004). Adult age and digitsymbol substitution performance: A meta-analysis. Psychology and Aging, 19(1),211–214. http://dx.doi.org/10.1037/0882-7974.19.1.211.
Johnson, W., McGue, M., & Deary, I. J. (2014). Normative cognitive aging. In D. Finkel, &C. A. Reynolds (Eds.). Behavior genetics of cognition across the lifespan (pp. 135–167).New York: Springer.
Kendler, K. S., Thornton, L. M., Gilman, S. E., & Kessler, R. C. (2000). Sexual orientation
in a US national sample of twin and nontwin sibling pairs. American Journal ofPsychiatry, 157(11), 1843–1846. http://dx.doi.org/10.1176/appi.ajp.157.11.1843.
Kremen, W. S., Franz, C. E., & Lyons, M. J. (2013). VETSA: The Vietnam era twin study ofaging. Twin Research and Human Genetics, 16(1), 399–402. http://dx.doi.org/10.1017/thg.2012.86.
Lichtenstein, P., Pedersen, N. L., & McClearn, G. E. (1992). The origins of individualdifferences in occupational status and educational level a study of twins reared apartand together. Acta Sociologica, 35(1), 13–31.
McClearn, G. E., Johansson, B., Berg, S., Pedersen, N. L., Ahern, F., Petrill, S. A., & Plomin,R. (1997). Substantial genetic influence on cognitive abilities in twins 80 or moreyears old. Science, 276, 1560–1563.
McGue, M., & Christensen, K. (2013). Growing old but not growing apart: Twin similarityin the latter half of the lifespan. Behavior Genetics, 43(1), 1–12.
McGue, M., Skytthe, A., & Christensen, K. (2014). The nature of behavioural correlates ofhealthy ageing: A twin study of lifestyle in mid to late life. International Journal ofEpidemiology, 43(3), 775–782. http://dx.doi.org/10.1093/ije/dyt210.
Neale, M. C., Boker, S. M., Xie, G., & Maes, H. H. (2004). Mx: Statistical modeling (6th ed.).Box 126 MCV, Richmond VA 23298: Department of Psychiatry.
Neiderhiser, J. A., Reiss, D., Lichtenstein, P., Spotts, E. L., & Ganiban, J. (2007). Father-adolescent relationships and the role of genotype-environment correlation. Journal ofFamily Psychology, 21(4), 560–571. http://dx.doi.org/10.1037/0893-3200.21.4.560.
Pedersen, N. L., Christensen, K., Dahl, A. K., Finkel, D., Franz, C. E., Gatz, M., & Reynolds,C. A. (2013). IGEMS: The consortium on interplay of genes and environment acrossmultiple studies. Twin Research and Human Genetics, 16(1), 481–489. http://dx.doi.org/10.1017/thg.2012.110.
Pedersen, N. L., McClearn, G. E., Plomin, R., Nesselroade, J. R., Berg, S., & de Faire, U.(1991). The Swedish adoption twin study of aging: An update. Acta Geneticae Medicaeet Gemellologiae, 40, 7–20.
Polderman, T. J., Benyamin, B., de Leeuw, C. A., Sullivan, P. F., van Bochoven, A.,Visscher, P. M., & Posthuma, D. (2015). Meta-analysis of the heritability of humantraits based on fifty years of twin studies. Nature Genetics, 47(7), 702–709.
Reynolds, C. A., & Finkel, D. (2015). A meta-analysis of heritability of cognitive aging:Minding the “missing heritability” gap. Neuropsychology Review, 25(1), 97–112.
Reynolds, C. A., Finkel, D., & Zavala, C. (2013). Gene by environment interplay in cog-nitive aging. In D. Finkel, & C. A. Reynolds (Eds.). Behavior genetics of cognition acrossthe lifespan (pp. 169–199). New York: Springer.
Salthouse, T. A. (2009). When does age-related cognitive decline begin? Neurobiology ofAging, 30(4), 507–514. http://dx.doi.org/10.1016/j.neurobiolaging.2008.09.023.
Scarr, S., & McCartney, K. (1983). How people make their own environments: A theory ofgenotype-environment effects. Child Development, 54(2), 424–435.
Skytthe, A., Christiansen, L., Kyvik, K. O., Bodker, F. L., Hvidberg, L., Petersen, I., ...Christensen, K. (2013). The Danish twin registry: Linking surveys, national registers,and biological information. Twin Research and Human Genetics, 16(1), 104–111.http://dx.doi.org/10.1017/thg.2012.77.
Stone, M. (1985). Kohs block design test. In D. J. Keyser, & R. C. Sweetland (Eds.). Testcritiques II. Kansas City: Test Corporation of America.
Tombaugh, T. N., & McIntyre, N. J. (1992). The mini-mental state examination: A com-prehensive review. Journal of the American Geriatrics Society, 40(9), 922–935.
Tucker-Drob, E. M., & Briley, D. A. (2014). Continuity of genetic and environmental in-fluences on cognition across the life span: A meta-analysis of longitudinal twin andadoption studies. Psychological Bulletin, 140(4), 949–979. http://dx.doi.org/10.1037/a0035893.
Tun, P. A., & Lachman, M. E. (2006). Telephone assessment of cognitive function inadulthood: The brief test of adult cognition by telephone. Age and Ageing, 35(6),629–632. http://dx.doi.org/10.1093/ageing/afl095.
Weschler, D. (1981). Manual for the Weschler adult intelligence scale - revised. New York:Psychological Corporation.
Weschler, D. (1997). Wechsler memory scale—Third edition (WMS–III) administration andscoring manual. San Antonio, TX: The Psychological Corporation.
Weschler, D. (1999). Manual for the Wechsler abbreviated intelligence scale (WASI). SanAntonio: The Psychological Corporation.
Wilson, R. S., Beckett, L. A., Barnes, L. L., Schneider, J. A., Bach, J., Evans, D. A., &Bennett, D. A. (2002). Individual differences in rates of change in cognitive abilitiesof older persons. Psychology and Aging, 17, 179–193.
S. Pahlen et al. Intelligence 68 (2018) 70–81
81