age structure transition and demographic dividend in india ... · age structure transition and...
TRANSCRIPT

AGE STRUCTURE TRANSITION AND DEMOGRAPHIC DIVIDEND IN INDIA
William Joe
Introduction
Demographic transition is a process involving the transition from a young-aged population
structure (high birth and death rates) to an old-aged population structure (low birth and death
rates). Such shifts in population age structure have significant developmental consequences
for large and populous countries, such as India. With demographic transition there is an
increase in the share of working age population which subsequently lowers the dependency
ratio (dependents to working age population) and allows for acceleration in economic growth.
Hence, the net growth benefits derived from an increased share of working age population
due to demographic transition is referred to as the demographic dividend (Gribble and
Bemner 2012). Interestingly, India is currently in a phase where the population is relatively
young; it will witness continual decline in the share of dependents (children and elderly).
It is estimated that nearly one-third of the economic miracle of East Asian countries
(including China) can be attributed to the demographic dividend (Bloom and Williamson
1998; Bloom and Finley 2009). Similarly, other cross-country studies have observed a
positive association between age structure transition and economic growth (Bloom et al.
2003; Bloom et al. 2006; Behrman et al. 1999; Andersson 2001; Kelley and Schmidt 2005;
Choudhry and Elhorst 2010; Wei and Hao 2010; Feng and Mason 2005). Also, there are
reasons to believe that the sustained developmental process in these countries is associated
with the demographic dividend (Mason and Lee 2006). Therefore, following the experience
in East and Southeast Asia, there is high optimism that demographic transition could take
India to newer economic heights (Bloom and Williamson 1998; Bloom et al. 2006; Bloom
2011; Aiyar and Mody 2011).
This paper examines the impact of changing population age-structure on economic growth in
India. We present state-wise estimates of demographic dividend for India during 1980-2010.
Further, we examine the long-term association between demographic transition and economic
growth in India. Based on the analysis, we argue that the phase of demographic dividend
holds the key for sustained growth and that policies have to move faster to safeguard India’s
long-term welfare prospects.

Data and Methods
The data analysis has been carried on for all-India as well as for 15 major states. The data on
gross and state domestic product (GDP and NSDP), share of sectors and population for India
(1981-2010) are obtained from RBIs data bank (the macroeconomic aggregates: at constant
prices). State level data (1981-2010) on Net State Domestic Product (NSDP), industries and
population are obtained from the databank of Ministry of Statistics and Programme
Implementation, Government of India. The data for NSDP is available at 1980-81, 1993-94,
1999-00 and 2004-05 prices, to ensure uniformity, all these figures have been converted to
2004-05 prices. The variable ‘working age’ in this paper refers to the population within the
age group 15-59 years. The proportion of people in working age category and total workers
has been calculated from the census data for the years 1981, 1991, 2001 and 2011. The
classification of industries in each of the census follows a different National Industrial
Classification (NIC). NIC-1970, NIC- 1987, NIC-1998 and NIC-2008 have been used for
census 1981, 1991, 2001 and 2011 respectively.
Decomposition analysis is used to analyze the factors responsible for growth of income per
worker (Bloom et al 2006). Further, time-series econometric methods are applied on 44
(1970-2013) annual observations for the key variables dependency ratio, GDP per capita
(constant 2005 USD), gross domestic savings (as % of GDP), gross fixed capital formation
and average years of schooling. These variables are log-transformed to facilitate
interpretation as elasticities. We conduct the augmented Dickey-Fuller (ADF) unit root tests
(results not reported here) and apply the autoregressive distributed lag (ARDL) model that
offers considerable advantage in the sense that variables could be assumed to be endogenous,
with different order of integration I(0) and I(1), and varying lag orders (Pesaran & Shin 1999,
Pesaran et al 2001). Besides, the long-run and short-run coefficients are estimated
simultaneously, thus removing problems associated with omitted variables and
autocorrelation. For this analysis, the variable lag length is selected using the Schwarz-
Bayesian criterion (SBC). Bounds testing approach is applied to investigate the presence of
long-run relationship among the three variables (Pesaran et al 2001). However, as we are
using a small sample therefore the F-statistic is compared with the critical values suggested
by Narayan (2004, 2005) for an analysis based on 30 to 80 observations. The F-statistic for
India (F = 8.85) is greater than critical values suggesting that we can reject the null of no
levels relationship.

Results
Table 1: Total Fertility Rate, Dependency ratio and Working age population (%)
TFR Dependency ratio % WA population
1981 1991 2001 2011 1981 1991 2001 2011 1981 1991 2001 2011
AP 4 3 2.2 1.8 0.82 0.75 0.66 0.57 54.77 57.00 60.22 63.54
Bihar 5.7 4.4 4.3 3.6 0.94 0.93 0.93 0.88 51.49 51.92 51.91 53.17
Gujarat 4.3 3.1 2.8 2.4 0.80 0.74 0.66 0.59 55.27 57.47 60.19 62.82
Himachal 3.8 3.1 2.1 1.8 0.88 0.79 0.67 0.57 52.89 56.00 59.74 63.75
Karnataka 3.6 3.1 2.4 2 0.85 0.77 0.66 0.56 53.75 56.45 60.34 64.22
Kerala 2.8 1.8 1.8 1.8 0.73 0.63 0.58 0.56 57.52 61.22 63.39 63.90
Maharashtra 3.6 3 2.3 1.9 0.81 0.75 0.69 0.58 55.14 57.02 59.05 63.13
MP 5.2 4.6 3.8 3.1 0.91 0.87 0.83 0.70 52.28 53.50 54.52 58.94
Orissa 4.3 3.3 2.6 2.3 0.85 0.77 0.71 0.63 53.93 56.55 58.40 61.45
Punjab 4 3.1 2.3 1.8 0.81 0.75 0.69 0.56 55.22 56.99 59.34 63.98
Rajasthan 5.2 4.6 3.9 3.1 0.95 0.90 0.89 0.74 51.17 52.61 52.85 57.54
TN 3.4 2.2 2 1.7 0.70 0.63 0.57 0.52 58.57 61.42 63.71 65.93
UP 5.8 5.1 4.4 3.5 0.94 0.92 0.93 0.79 51.47 52.13 51.87 55.97
WB 4.2 3.2 2.3 1.8 0.80 0.76 0.68 0.56 55.56 56.76 59.52 64.29
India 4.5 3.6 3 2.4 0.85 0.80 0.76 0.66 53.91 55.43 56.93 60.29
Table 1 presents the figures for Total Fertility rate, dependency ratio and percentage of
working age population. Understanding fertility decline can provide key insights into the
process of demographic transition. A reduction in number of children on account of falling
birth rates implies a reduction in youth dependency ratio. And, coupled with a higher growth
rate in the working age population due to high fertility rates of the past creates a phase for
demographic dividend. Looking at the above table, it is clear that huge disparities exist in
fertility rates across states over the last three decades. Cluster of major states can be identified
that had historically high and low fertilities respectively. In 1981, high fertility rates can be
observed for states such as UP (5.8), Bihar (5.7), Madhya Pradesh (5.2) and Rajasthan (5.2).
On the other hand low fertility rates can be observed for southern states such as Kerala (2.8),
Tamil Nadu (3.4), Maharashtra (3.6) and Karnataka (3.6). At present, the fertility decline for
states reporting higher fertility in the past has been relatively slow. The fertility rates of States
like UP (3.5), Bihar (3.6), Madhya Pradesh (3.1) and Rajasthan (3.1) in 2011 are still higher
compared to the fertility rates of Southern states during 1980s. A reduction in fertilities of
these BIMARU states is expected. This fact implies that India is currently in middle of a
demographic transition. The southern and western states are on the verge of second stage of

demographic transition, they have enjoyed most of the dividend during the 1980s and 1990s.
On the other hand, the share of working age people is expected to rise and dependency ratio
expected to decline in BIMARU states, thus raising hopes of increase in growth.
The figures for dependency ratio and share of working age from Table 1can further our
understanding about the opportunity created by declining fertility rates. Dependency ratio has
been observed to be lower and percentage of working age population higher for states
reporting low fertility rates historically as in the case of Kerala, Tamil Nadu, Karnataka,
Gujarat and Andhra Pradesh. On the other hand, the number of dependents in BIMARU state
has started to decline recently only, mirroring a decline in fertility rate. Simultaneously, the
numbers of working age people in these states are gradually increasing. In 1981, the
dependency ratio in UP (.94), Bihar (.94), Madhya Pradesh (.91) and Rajasthan (.95) was
higher. In 2011, the dependency ratio has declined considerably: UP (.79), Bihar (.88),
Madhya Pradesh (.7) and Rajasthan (.74). Similarly the percentage of working population has
increased in BIMARU states in 2011 as compared to 1981: from 51 to 53 in Bihar, from 51
to 58 in Rajasthan from, 51 to 56 in UP and from 52 to 59 in Madhya Pradesh. Clearly, the
trends suggest that the remaining demographic transition is expected to take place in
BIMARU states.
Table 2 presents the figures for annual average growth rates of income per capita. The growth
rate of income per capita can be decomposed further into growth of income per worker,
growth of labor participation and growth of the ratio of working age to total population. The
average growth rate of income per capita for India is 4.2 per cent over the period 1980-2010,
the major share of which is attributable to growth of income per worker (3.6 per cent). The
rest 0.5 per cent is contributed by increase in number of workers. Notably, the average
growth in income per capita for India has followed an increasing trend over the last three
decades: 3.2 per cent (1980-90), 3.8 per cent (1990-00) and 5.9 per cent (2000-10).
Moreover, the contribution due to growth of labor participation and growth of the ratio of
working age to total population has also been increasing: 0.2 (1980-90), 0.4 (1990-00)and
1.1(2000-10).
Considering the trends for the states over the decade 1980-10, high growth rates on average
have been reported by states such as Gujarat (5.3), Tamil Nadu (5.3), Maharashtra (4.9),
Andhra Pradesh (4.8) and Kerala (4.7). And, the states reporting lowest growth rates are
Bihar (2.5), UP (2.6), Madhya Pradesh (2.8), Punjab (3.2) and Orissa (3.2). Analyzing the

trends across decades, the states performing consistently better are Gujarat and Tamil Nadu,
while states like Madhya Pradesh, UP and Bihar have been at the bottom of growth pyramid.
The contribution of growth of labor participation and growth of the ratio of working age to
total population for states reporting lower growth in income per capita has increased over
2000-10 from 1980-90: 0 to 1.9 per cent for Bihar, 0 to 1.4 per cent for Madhya Pradesh, 0.6
to 1.5 per cent for Rajasthan; and 0.4 to 1.4 per cent for UP. Also, the growth of the ratio of
working age to total population over 2000-10 is comparatively higher among BIMARU
states: Madhya Pradesh (0.7 per cent), Rajasthan (0.8 per cent) and Uttar Pradesh (0.7 per
cent) except for Bihar (0.2 per cent).

Table 2: Annual average growth rates, India 1980-2010
1980-2010 1980-1990 1990-2000 2000-2010
g(Y/N) g(Y/L) g(L/WA) g(WA/N) g(Y/N) g(Y/L) g(L/WA) g(WA/N) g(Y/N) g(Y/L) g(L/WA) g(WA/N) g(Y/N) g(Y/L) g(L/WA) g(WA/N)
AP 4.8 4.5 -0.2 0.5 4.4 4.5 -0.5 0.4 3.7 3.6 -0.4 0.5 6.3 5.5 0.3 0.5
Bihar 2.5 1.6 0.7 0.1 2.7 2.7 -0.1 0.1 0.2 -0.4 0.7 0.0 4.3 2.3 1.7 0.2
Delhi 4.6 4.5 -0.1 0.3 3.3 3.4 -0.2 0.0 4.6 4.3 0.0 0.3 7.0 6.7 -0.2 0.5
Gujarat 5.3 4.9 0.0 0.4 4.4 3.7 0.3 0.4 5.3 4.8 0.0 0.5 8.5 8.3 -0.2 0.4
Himachal 4.1 2.9 0.5 0.6 3.2 3.1 -0.4 0.5 4.0 2.7 0.6 0.6 5.4 3.3 1.4 0.7
Karnataka 4.5 4.0 0.0 0.6 3.5 3.1 -0.1 0.4 5.7 5.1 -0.1 0.6 5.5 4.8 0.0 0.6
Kerala 4.7 4.0 0.3 0.4 1.7 1.4 -0.3 0.6 5.2 4.9 -0.1 0.4 7.3 5.7 1.4 0.1
Maharashtra 4.9 4.7 -0.2 0.4 4.0 3.9 -0.2 0.3 4.9 5.0 -0.5 0.3 7.1 6.3 0.1 0.6
MP 2.8 2.3 0.1 0.4 1.7 1.7 -0.2 0.2 2.4 2.2 0.0 0.2 5.0 3.5 0.7 0.7
Orissa 3.2 2.3 0.4 0.4 3.3 3.4 -0.5 0.4 3.4 3.1 -0.1 0.3 6.2 3.5 2.1 0.5
Punjab 3.2 2.5 0.2 0.5 3.6 3.8 -0.5 0.3 2.6 0.9 1.3 0.4 3.8 3.4 -0.3 0.7
Rajasthan 4.3 3.4 0.6 0.3 4.8 4.2 0.3 0.3 3.2 2.4 0.7 0.1 5.2 3.7 0.7 0.8
TN 5.3 4.9 0.0 0.4 4.0 3.6 -0.1 0.4 5.1 4.8 -0.1 0.4 6.8 6.1 0.3 0.3
UP 2.6 1.9 0.4 0.2 2.8 2.3 0.3 0.1 1.0 0.8 0.2 0.0 4.1 2.7 0.7 0.7
WB 4.0 2.7 0.8 0.5 2.1 1.5 0.4 0.2 5.1 3.8 0.8 0.4 5.2 3.2 1.2 0.7
India 4.2 3.6 0.2 0.3 3.2 3.0 -0.1 0.3 3.8 3.5 0.1 0.3 5.9 4.7 0.6 0.5
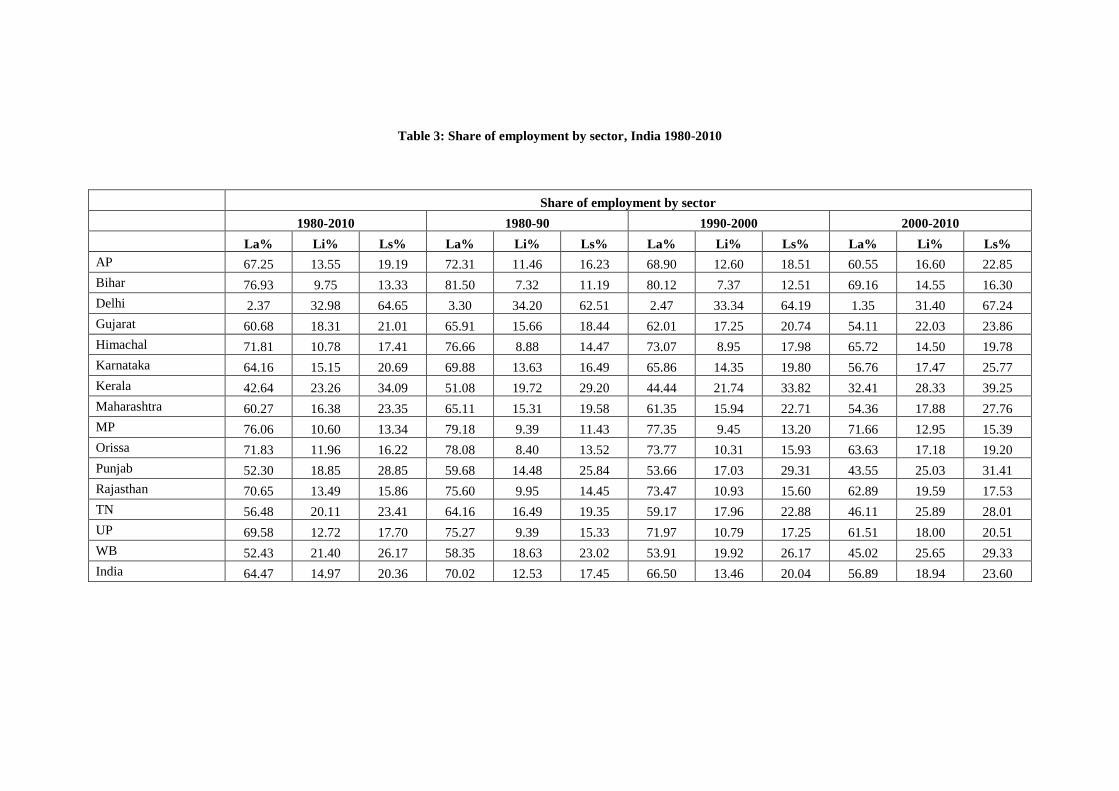
Table 3: Share of employment by sector, India 1980-2010
Share of employment by sector
1980-2010 1980-90 1990-2000 2000-2010
La% Li% Ls% La% Li% Ls% La% Li% Ls% La% Li% Ls%
AP 67.25 13.55 19.19 72.31 11.46 16.23 68.90 12.60 18.51 60.55 16.60 22.85
Bihar 76.93 9.75 13.33 81.50 7.32 11.19 80.12 7.37 12.51 69.16 14.55 16.30
Delhi 2.37 32.98 64.65 3.30 34.20 62.51 2.47 33.34 64.19 1.35 31.40 67.24
Gujarat 60.68 18.31 21.01 65.91 15.66 18.44 62.01 17.25 20.74 54.11 22.03 23.86
Himachal 71.81 10.78 17.41 76.66 8.88 14.47 73.07 8.95 17.98 65.72 14.50 19.78
Karnataka 64.16 15.15 20.69 69.88 13.63 16.49 65.86 14.35 19.80 56.76 17.47 25.77
Kerala 42.64 23.26 34.09 51.08 19.72 29.20 44.44 21.74 33.82 32.41 28.33 39.25
Maharashtra 60.27 16.38 23.35 65.11 15.31 19.58 61.35 15.94 22.71 54.36 17.88 27.76
MP 76.06 10.60 13.34 79.18 9.39 11.43 77.35 9.45 13.20 71.66 12.95 15.39
Orissa 71.83 11.96 16.22 78.08 8.40 13.52 73.77 10.31 15.93 63.63 17.18 19.20
Punjab 52.30 18.85 28.85 59.68 14.48 25.84 53.66 17.03 29.31 43.55 25.03 31.41
Rajasthan 70.65 13.49 15.86 75.60 9.95 14.45 73.47 10.93 15.60 62.89 19.59 17.53
TN 56.48 20.11 23.41 64.16 16.49 19.35 59.17 17.96 22.88 46.11 25.89 28.01
UP 69.58 12.72 17.70 75.27 9.39 15.33 71.97 10.79 17.25 61.51 18.00 20.51
WB 52.43 21.40 26.17 58.35 18.63 23.02 53.91 19.92 26.17 45.02 25.65 29.33
India 64.47 14.97 20.36 70.02 12.53 17.45 66.50 13.46 20.04 56.89 18.94 23.60

Table 3 presents the share of workers employed in primary, secondary and tertiary sector.
According to theories on structural change, development of an economy follows a particular
pattern. In a developing economy, agriculture is the dominant sector, with abundant labor.
Over time manufacturing sector develops followed by the services sector. As the economy
reaches an advanced stage the contribution of services sector is higher towards the GDP as
compared to agriculture and manufacturing sectors. Also, throughout this transformation
phase the share of labor employed by tertiary and manufacturing sector increases but at a
slow pace, with large share of workers being employed in the agricultural sector. From table
3, the effect of structural change on the employment can be observed. For India, the average
share of workers employed in agriculture has declined from 70 per cent during 1980-90 to 57
per cent in 2000-2010. On the other hand, the average share of employment in services has
increased from 17 per cent during 1980-90 to 24 per cent during 2000-2010, and in
manufacturing from 13 per cent to 19 per cent, clearly indicating towards the advancement of
the economy from a developing phase.
Interestingly, from table 3, the economies of some of the states which have reported higher
fertility decline over the past three decades are observed to be towards the advanced state of
development, which reflects a concurrence of demographic transition with structural
transformation. To illustrate, over 1980-2010, the average share of employment in agriculture
are observed to be lower in states with historically lower level of fertilities: Kerala (43 per
cent), Tamil Nadu (56 per cent), Punjab (52 per cent) and West Bengal (52 per cent).
Comparatively over 1980-2010, the average share of employment in BIMARU states is
higher: Bihar (77 per cent), Madhya Pradesh (76 per cent), Rajasthan (71 per cent) and Uttar
Pradesh (70 per cent).
Table 4 presents average output across sectors. Average output per worker (1980-2010) for
India is 52,290. Average output in services sector (1, 36,611) is higher as compared to
industry (69,498) and agriculture (19,915). The increase in average output per worker has
been higher in services sector over the last three decades. The average output per worker is
lower across BIMARU states: Bihar (26,360), Madhya Pradesh (31,111), Rajasthan (35,351)
and Uttar Pradesh (35,875). On the other hand, higher average output has been reported for
the states: Delhi (1, 48,246), Punjab (79,941), Kerala (68,233), Maharashtra (62,675) and
Gujarat (58,051). Disparity in output per worker in agriculture is quite higher as compared to
the services sector, with output being as high as 68,015 in Punjab to as low as 11,901 in
Bihar. Comparing the trends across decades, it can be observed that output per worker has

been historically low in BIMARU states. On the other hands, states such as Delhi, Punjab,
Kerala, Gujarat and Maharashtra have reported higher output per worker across all the
sectors.
Growth in income per worker can be decomposed into two components: growth due to
increase in number of workers in a high productivity sector on account of reallocation
(sectoral growth) and growth due to increase in productivity in each sector (productivity
growth). Table 5 presents the figures for productivity and sectoral growth. For India over the
period 1980-2010, the growth due to increased productivity is 2.67 per cent and due to
sectoral shift is 0.99 per cent. The increase in productivity within sectors has fluctuated: 2.65
per cent over 1980-90, 2.61 per cent over 1990-00 and 3.34 per cent over 2001-10. On the
other hand the growth due to sectoral shift of workers has been increasing consistently: 0.40
per cent over 1980-90, 1.15 per cent over 1990-00 and 1.63 per cent over 2001-10.
The states reporting high productivity growth over the period over 1980-2010 are Delhi (4.3
per cent), Gujarat (3.95 per cent), Tamil Nadu (3.57 per cent) and Maharashtra (3.41 per
cent), while very low productivity growth has been observed for Bihar (0.11 per cent),
Madhya Pradesh (1.21 per cent), Orissa (1.02 per cent) and Uttar Pradesh (0.91 per cent).
High sectoral productivity has been reported for Bihar (1.61 per cent), Tamil Nadu (1.27 per
cent), Orissa (1.25 per cent) and Himachal Pradesh (1.21 per cent). And, low productivity has
been observed across states such as Kerala (0.66 per cent), West Bengal (0.41 per cent),
Punjab (0.36 per cent) and Delhi (0.12 per cent).

Table 4: Output per worker by sector, India 1980-2010
Output per worker by sector
1980-2010 1980-90 1990-2000 2000-2010
Y/L Ya/La Yi/Li Ys/Ls Y/L Ya/La Yi/Li Ys/Ls Y/L Ya/La Yi/Li Ys/Ls Y/L Ya/La Yi/Li Ys/Ls
AP 39877 21969 63263 107352 25137 18190 39407 70138 36301 20041 66632 101490 58192 27674 83752 150428
Bihar 26360 11901 97925 93916 24736 13050 109369 88549 26090 10831 123723 96556 28253 11820 60683 96643
Delhi 148246 208561 86723 186596 96125 243167 62461 114417 138575 183882 88613 172690 210039 198636 109096 272681
Gujarat 58051 24497 113385 124121 38132 22274 78821 81282 53695 23198 118599 112466 82327 28018 142736 178614
Himachal 48553 26476 157914 107324 34918 25226 98924 83284 46076 25431 182632 96482 64665 28771 192184 142207
Karnataka 45601 22516 86426 106683 29633 19866 61151 71402 42657 23529 86882 100345 64512 24154 111246 148301
Kerala 68233 38121 64312 121653 42215 26277 46828 79798 62446 37653 66224 108127 100037 50432 79884 177032
Maharashtra 62675 16692 129650 157816 36840 12814 95585 98695 59537 16281 134284 151389 91648 20982 159080 223365
MP 31111 16149 81867 105365 24766 15988 61734 89409 31593 17118 89018 107700 36974 15342 94849 118985
Orissa 34173 19207 82161 89595 28543 21214 78899 69614 32291 18210 90760 85648 41683 18196 76824 113522
Punjab 79941 68015 102853 120855 65561 55645 89473 108483 80581 69747 114287 112568 93682 78654 104798 141516
Rajasthan 35351 18154 75061 105727 25651 15577 61432 76561 36413 18900 89473 110249 43990 19984 74279 130370
TN 50059 16320 80779 122324 29689 11691 66025 76076 46405 16559 87958 112356 74082 20709 88356 178539
UP 35875 21027 67598 104400 30318 19512 67209 92140 35892 20688 77131 106183 41414 22883 58456 114876
WB 45542 29354 42038 96572 33680 22745 37808 73093 43316 29982 41982 88287 59629 35335 46326 128335
India 52290 19915 69498 136611 36133 16945 56073 97119 48892 19505 75425 127489 71846 23296 76996 185226

Table 5: Productivity and sectoral growth, India 1980-2010
1980-2010 1980-1990 1990-2000 2000-2010
Productivity Sectoral Productivity Sectoral Productivity Sectoral Productivity Sectoral
AP 3.38 1.01 3.89 0.45 2.58 1.03 4.42 1.79
Bihar 0.11 1.61 3.10 -0.39 -1.33 1.74 -1.43 3.82
Delhi 4.30 0.12 3.36 -0.08 4.36 -0.11 6.13 0.58
Gujarat 3.95 0.84 3.21 0.32 3.40 1.20 6.11 1.19
Himachal 1.71 1.21 2.45 0.46 1.82 0.87 1.25 2.57
Karnataka 2.77 1.07 2.59 0.36 3.59 1.26 2.73 1.84
Kerala 3.30 0.66 0.98 0.43 4.57 0.91 5.09 0.78
Maharashtra 3.41 1.15 2.80 0.92 3.96 1.26 4.22 1.52
MP 1.21 1.01 1.14 0.40 2.46 0.87 0.31 1.98
Orissa 1.02 1.25 2.93 0.32 -0.54 1.63 0.91 2.07
Punjab 2.12 0.36 3.26 0.36 0.48 0.47 3.10 0.31
Rajasthan 2.24 1.12 3.95 0.17 2.85 0.86 0.41 2.58
TN 3.57 1.27 3.09 0.44 3.90 1.61 4.51 2.04
UP 0.91 1.03 1.84 0.40 0.31 0.96 0.77 1.96
WB 2.29 0.41 1.14 0.30 3.30 0.67 2.93 0.35
India 2.67 0.99 2.65 0.40 2.61 1.15 3.34 1.63

Table 6: Correlation between demographic variables and NSDP, Indian states 1981-2011
1981 1991 2001 2011
TFR and NSDP per capita -0.5952** -0.5641** -0.8072*** -0.7689***
p value 0.0247 0.0356 0.0005 0.0013
Dep. Ratio and NSDP per capita -0.4881 -0.5576** -0.7752*** -0.7942***
p value 0.0766 0.0383 0.0011 0.0007
NSDP per capita and WA% 0.4659 0.5254 0.7648*** 0.7887***
p value 0.0931 0.0537 0.0014 0.0008
Table 6 presents the figures for correlation between TFR, NSDP per capita and proportion of
working age population. The relation between TFR and NSDP per capita is highly negative
and significant for all the data years, implying that fertility rates are inversely correlated with
NSDP per capita. The association between Dependency ratio and NSDP per capita is also
highly negative, although not significant for 1981, implying that lower dependency ratio is
associated with higher NSDP per capita and vice-versa. The figures for correlation
coefficient between NSDP per capita and proportion of working age population are
significant for 2001 and 2011. A positive sign indicates a direct association between the two
variables.
We further confirm the association between population age-structure, gross domestic savings
and economic growth in India using time-series econometrics. The results reported in Table
3 are in expected direction and suggest a significant and positive association between growth
of gross fixed capital (proxy for investment) and per capita GDP in India. Similarly, we find
a negative but insignificant association between population growth and per capita GDP
growth in India. Interestingly, average years of schooling show a positive but statistically
insignificant association with per capita GDP growth. Finally, we confirm a significant long-
run association between dependency ratio and per capita GDP. It is evidently clear that
reductions in dependency ratio have favourable impact on economic growth. Some back of
the envelope estimates would suggest that on an average, India needed about 2.1 years to
achieve a one percent decline in dependency ratio. Therefore, from the long-run coefficient it
can be inferred that the contribution of reduced dependency burden to overall per capita GDP
growth during the analysis period is about 0.6 per cent per annum. However, capital

accumulation as well as human capital is yet to display a major role in India’s economic
growth.
Table 3: Long-run coefficients of determinants of GDP, China and India, 1970-2010
Variables
India Long-run coefficients (dependent variable: log of GDP)
Coefficient Std. error
Ln of gross fixed capital formation 0.36*** 0.079
Ln of total population -0.44 0.745
Ln of average years of schooling 0.49 0.394
Ln of dependency ratio -1.30*** 0.416
Speed of adjustment -0.73*** 0.131
Notes: ***, **, * imply significance at the 1%, 5%, 10% level, respectively. The models include an intercept.
The lag length was selected using Schwarz-Bayesian Criterion (SBC).
Discussion
Regarding population and economic growth, three views are apparent: a) the pessimist view
(Malthusian legacy), that population growth negatively affects economic growth; b) the
optimist view, that population growth is beneficial for economic growth and; c) the neutralist
view, that population is unrelated to economic performance (Bloom et al 2003). In this
regard, there is increasing evidence to suggest that demographic transition has mostly
supported economic growth in many countries. Besides, the fact that two of the largest
population in the world (China and India) also happen to be the two fastest growing
economies compels us for discarding the pessimistic view1. Also, it may be reiterated that
demographic dividend is not necessarily based on labour abundance but quintessentially
captures the impact of young population-age structure on economic growth via pathways
such as increased savings and investments and reduced dependency burden.
1 There appears to be significant empirical evidence that economic growth is positively related to population
growth, provided that opportunities are created for the growing numbers. Choudhry & Elhorst (2010) have
included the demographic variables in the Solow-Swann growth model to show the effect of population
dynamics on economic growth. Specifically, they use data for the period 1961-2003, to show that economic
growth is positively associated with growth differential between working age population and the total
population; and negatively with child and old age dependency ratio. Similarly, Kelley and Schmidt (2005)
highlight that combined impacts of demographic transition have lead to 20 per cent of per capita output growth
impact, with larger shares in Asia and Europe. In fact, the optimists have been proved right by the growth
experience of other Southeast Asian countries such as Thailand and Vietnam (Wongboonsin et al 2005, Minh
2009).

From the analysis it emerges that the pace of fertility decline was instrumental in determining
the impact of demographic transition on economic growth in India. However, unlike
Southeast Asian countries, population growth can still prove to be a major challenge in
sustaining economic development in India. It is projected that due to population momentum
India’s population would continue to grow for another 50 years or so despite achieving
replacement level fertility in about 2020s (Bhat undated). In fact, the process of fertility
transition is ongoing in several major states of the country (such as Uttar Pradesh and Bihar)
and does restrict the scope to maximize gains from the current demographic phase. Also, the
potential to harness the first demographic dividend to a large extent relies on the existing
policy environment. For instance, since independence the Indian economy has been
grappling with several institutional and structural constraints that disallowed accelerated
improvements in productivity and output (Basu and Maertens 2007). In contrast, the social
and institutional arrangements in China during the Maoist regime were consequential for the
phenomenal growth run of China (Basu 2009).
The growth performance during the phase of first demographic dividend also provides signals
(and prerequisites) to insulate the economy (and the second dividend) from plausible impact
of imminent population aging. For instance, the East Asian economies are better placed to
harness a second divided as they have accumulated higher levels of savings while
institutional disadvantages may constrain the savings and growth potential of the Indian
economy (Basu 2009). The situation can still be salvaged if the current phase of output
growth leads to increased level of savings and investments in the economy. As noted earlier,
savings in India has increased at a slow pace and these gradual increments are easily
correlated with economic growth and fertility decline. In this regard, what works in India’s
favour is that currently India is in the middle of its phase of first demographic dividend and
this phase is expected to last till 1940s. This also allows considerable scope to undertake
medium- to long-term changes to improve the social and institutional environment.
However, what is required is an integrated set of policies to ensure that India maximizes the
first dividend and stays on course for the second.
The sustainability prospects of the economy hinges upon its preparedness to realize a second
demographic dividend by prioritizing the following areas. First, policy focus on fertility
decline in large States such as Uttar Pradesh, Bihar, Madhya Pradesh and Rajasthan is critical
to ensure an age-structure profile that contributes to low dependency burden. However, in

the Indian context we observe somewhat diluted focus on fertility decline (family planning)
which until recently was a major item in the policy agenda. Second, there is a positive
relationship between savings and growth but the strength of the association is much weaker
and needs stimulus. In fact, savings responds to economic growth thus reiterating the
importance of higher growth in a period of falling dependency ratio. Such a phenomenon is
observed in China other Asian economies which significantly helped in attaining very high
rate of savings (Bonham and Wiemer 2012).
Third, India should continue to have policy reforms for sustaining the growth momentum.
This is important because investment climate is increasingly determined by global outlook
whereby financial investors are keen to invest in robust business environments. In fact, India
is a huge market for several products and there is potential for partnerships in production and
distribution of goods and services in sectors where local demand is much higher, such as
automobiles and electronics. However, India is yet to progress with cost-efficient alternatives
(including skilled labor) to promote in-house manufacturing and exports. The literature on
productivity growth in India is also critical of institutional constraints that disallow output
and employment growth (Virmani & Hashim 2009). Also, there are concerns that only a
small part of the gain in labour productivity gets translated into wage increase thus further
constraining savings potential (Goldar and Banga 2005). Needless to add, remedies here can
go a long way in restoring balance and growth sustainability.
Fourth, this brings us to the most important task of all around employment generation to
absorb the increasing work force. This again involves exploring opportunities for
deployment of increasing labour force in the non-agricultural sector (Chandrasekhar et al
2006). Besides, the issue becomes all the more important because of increasingly evident
adverse impact of climate change on agricultural sector (Jha and Tripathi 2011). Fifth,
increasing female education and female labour force participation can also boost economic
development in India (Dreze and Murthi). For this India needs a proactive approach for
increasing both public and private investments in human capital that also ensures equitable
access and quality. Sixth, investments in health may go a long way in safeguarding India’s
prospects of growth sustainability (Bloom et al 2006). In particular, living longer and
healthier is not only important for productivity improvements but it also facilitates potential
for higher savings and investments. Besides, a healthy population can have a savings and
consumption profile which will be pro-growth.