age wants to live life
TRANSCRIPT


Our mission is to develop telecom products and services for Seniors to lead full and rich lives: to do things they want to do more easily as well as the things they thought they might never do.
DORO A GLOBAL LEADER IN TELECOM FOR SENIORS
CONTENTS
This Annual Report is a translation of the Swedish original. If any differences exist, the Swedish version is the official version and should prevail.
Images in this Annual ReportFollow the links on the cover, and on pages 5, 12, 17 and 22, to find out what our users think.
Doro in brief 3The year in brief 4CEO’s comments 6Market and drivers 10Strategy 13Operations 18A sustainable business 23Employees 30Doro share 32Directors’ Report 34Corporate Governance Report 37Board of Directors 40Management 41Financial statements 42Notes 51Board signing 68Auditor’s report 69Quarterly summary 72Five-year summary 73Definitions 74Press releases 2017 75

A SECURE AND RELIABLE COMPLETE OFFERINGDoro is the global market leader in telecom for seniors, and the market leader in digital safety solutions in Sweden and Norway. Doro provides easy-to-use mobile phones and smart-phones, mobile applications and fixed line telephony. Our safety solutions offering extends from standalone products to integrated and tailored complete solutions combining hardware and software, services and support. They address individuals, their relatives, as well as health and social care providers.
A GLOBAL MARKET WITH VARYING NEEDSDoro’s solutions are sold in over 40 countries on five continents through an extensive network of leading telecom operators, specialists and resellers with distribution channels reaching end-users. Doro’s growth story is founded on its genuine interest in, and deep insight into, seniors’ needs and their expecta-tions of life. Combined with long-term
experience, this helps us take our work forward to produce specifically adapted solutions that simplify everyday lives and increase safety in an environment of growing technological complexity.
A GROWING USE OF TECHNOLOGYThe usage of smartphones by people aged 65 and over is increasing, and more of these people are using a variety of channels to communicate with friends and family. So, by utilising its know-how and innovative capability, Doro sees clear value in developing and delivering solutions and systems that bring seniors a stronger sense of belonging, security, community and being a genuine mem-ber of society—just like everyone else. We’re proud of what we’ve achieved so far and are now moving onto an even more service-centered strategy of developing complete smart solutions that help enhance the quality of life of our society’s seniors.
DORO IN BRIEF
Doro cares about our society’s seniors—they are our heroes. We think everyone should have the opportunity of living a full and rich life without compromise. We want to make ageing an independent, empowering and rich phase of life. For us, age is just a number.
40countries
5continents
82%users satisfied with their Doro mobile phone
NO. 1the market leader in mobile phones for seniors
” With our in-depth understanding of seniors’ wants and needs in the later phases of life, Doro creates the security users need.”
DORO ANNUAL REPORT 2017 DOrO iN brieF3

Q3 • Net sales decreased by 1.7 percent. • excluding the US and Canada, sales were up by 1.2 percent
• Doro Care’s sales were up by 30 percent year on year • High sales in the UK and for Care, weaker in other regions
• Malin Lindgärde became new VP Marketing & Communications
• Participation in Google’s worldwide campaign.
Q4 • Net sales decreased by 6.5 percent • Doro Care increased sales by 17 percent • Doro held a capital markets day in Stockholm on 14 November
• New financial goals announced at Doro’s capital markets day
• Magnus eriksson resigned as CFO.Carl-Johan Zetterberg boudrie was promoted to new CFO
• Carl-Johan rijpma became Doro’s new VP Operations.
THE YEAR IN BRIEF
BUSINESS HIGHLIGHTS IN 2017 • Strong earnings performance for the Group • Positive progress and high growth within Doro Care • Launch of Doro 8040/8042 smartphone • Updated strategy focusing on service-centered complete solutions
• New financial goals reflecting our updated strategy • Smartphone segment remains in growth • New, stronger management team.
Q1 • Net sales increased by 9.5 percent. The operating margin was 3.8 percent
• Doro Care increased sales by 91.6 percent (40.7 per-cent excluding Trygghetssentralen)
• robert Puskaric became Doro’s President and Chief executive Officer
• Doro started a partnership with consulting firm Sigma industry of Lund, Sweden, bringing greater flexibility, cost-efficiency and speed of product development
• Sales divided between geographical regions, with Doro Care as a separate region
• Doro wins the red Dot Award for the Doro 6050, an easy-to-use 2G feature phone, and mobile operator Orange’s Supplier of excellence award.
Q2 • Net sales decreased by 5.8 percent. excluding the US and Canada, net sales increased by 5.5 percent.
• Sales up in four of Doro’s seven regions, including the largest, DACH, where sales rose by 24.1 percent
• Doro Care’s sales rose by 7.7 percent.
10product launches
Doro 2404, Doro 1360/1361/1362, Doro 2414, Doro 2424, Doro 8040/8042, Doro 540X, Doro 8020X
DORO ANNUAL REPORT 2017 THe yeAr iN brieF 4

2016 2017
Net sales, SEKm 1,959 1,924
Gross margin, % 38.5 38.6
Operating profit (EBIT), SEKm 47.7 92.0
Operating margin (EBIT), % 2.4 4.8
Cash flow from operating activities, SEKm 61.7 119.5
Earnings per share after tax, SEK 1.33 2.83
Dividend per share, SEK 1) 1.00 0.00
Number of employees at year-end 500 4581) See proposed appropriation of profit on page 36.
ANNUAL COMPARISON KEY FIGURES
GoalOutcome
2016Outcome
2017
Annual growth, including acquisitions, % at least 10 7.1 –1.8
Long-term operating margin (EBIT)% at least 8 2.4 4.8
Revenue from services, long term share of total revenue, % at least 30 6.8 10.0
Net debt to EBITDA, times at most 2.5 1.2 0.7
Dividend as share of net profit after tax, % 33 75 01)
1) Doro has decided to pursue a buyback program corresponding to 37.6% of net profit after tax 2017. See page 36 for more information.
FINANCIAL GOALS AND GOAL ACHIEVEMENT
“ i haven’t needed to ask anyone for help with my new Doro phone – it’s so easy to use!”
MADELEINE'S STORY
THe yeAr iN brieFDOrO ANNUAL rePOrT 2017 5
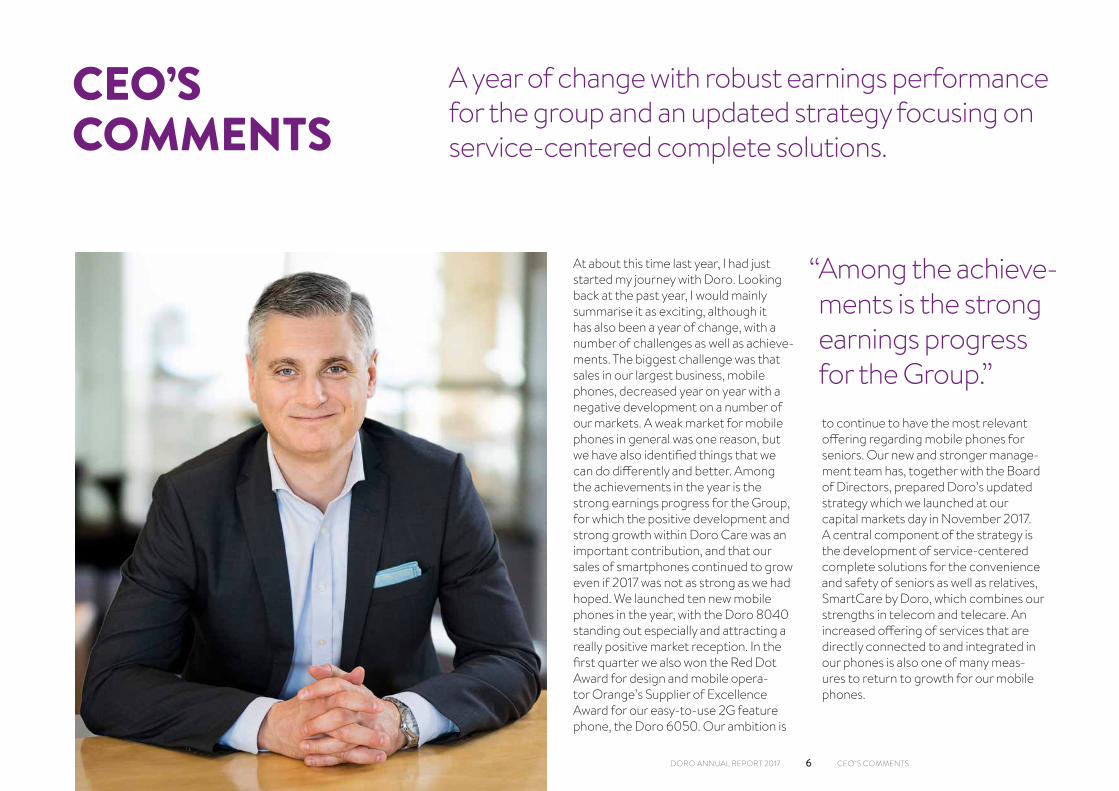
At about this time last year, i had just started my journey with Doro. Looking back at the past year, i would mainly summarise it as exciting, although it has also been a year of change, with a number of challenges as well as achieve-ments. The biggest challenge was that sales in our largest business, mobile phones, decreased year on year with a negative development on a number of our markets. A weak market for mobile phones in general was one reason, but we have also identified things that we can do differently and better. Among the achievements in the year is the strong earnings progress for the Group, for which the positive development and strong growth within Doro Care was an important contribution, and that our sales of smartphones continued to grow even if 2017 was not as strong as we had hoped. We launched ten new mobile phones in the year, with the Doro 8040 standing out especially and attracting a really positive market reception. in the first quarter we also won the red Dot Award for design and mobile opera-tor Orange’s Supplier of excellence Award for our easy-to-use 2G feature phone, the Doro 6050. Our ambition is
to continue to have the most relevant offering regarding mobile phones for seniors. Our new and stronger manage-ment team has, together with the board of Directors, prepared Doro’s updated strategy which we launched at our capital markets day in November 2017. A central component of the strategy is the development of service-centered complete solutions for the convenience and safety of seniors as well as relatives, SmartCare by Doro, which combines our strengths in telecom and telecare. An increased offering of services that are directly connected to and integrated in our phones is also one of many meas-ures to return to growth for our mobile phones.
CEO’S COMMENTS
A year of change with robust earnings performance for the group and an updated strategy focusing on service-centered complete solutions.
“ Among the achieve-ments is the strong earnings progress for the Group.”
CeO´S COMMeNTS6DOrO ANNUAL rePOrT 2017

PRIORITIES AND RESULTS FOR 2017As incoming CeO, one of my first priorities was to increase growth in Doro Care. Doro Care’s sales rose to SeK 276.6m in 2017, up 31.7 percent on 2016. This was supported by posi-tive progress in Germany and a larger subscription-based operation in the Nordics, where we had a bigger sub-scriber base than in 2016. This progress is really pleasing, but obviously comes at a cost, requiring the hard work of my dedicated colleagues.
Another priority for 2017 was to focus on the Group’s efficiency, shorten product development lead-times, whilst continuing to develop the company’s growth strategy further. So, we started the year by comprehensively evaluating our working methods and processes, which resulted in the execution of a number of measures to increase effi-ciency and reduce costs through our business. As part of this, we began the
implementation of a new, Group-wide erP system (enterprise resource Planning). This work will continue in 2018. At the end of the year, we also decided to relocate Doro’s head office from Lund to Malmö. Apart from offer-ing our employees a better working environment, it also gives us the chance to co-locate our head office with one of our alarm receiving centres and the administrative functions of Doro Care, which will help create a more cohesive Doro. Our relocation to these larger, shared premises will be in Autumn 2018.
Another focus in 2017 was advancing our position in smartphones, thus win-ning more market share internationally. in terms of total handset unit sales in the european market (including smart-phones and feature phones), sales in europe have been poor in recent years, even if 2017 was better than previously. Despite smartphone unit sales increas-ing in the year, sales did not accelerate at the rate we had worked for, so we
will be focusing more on this in 2018. in general, our mobile phone sales decreased in three out of four quarters, and for the full year 2017, which of course is a disappointment. For us, the US and Canada were very weak markets and other markets also had lower sales year on year. However, our focus on the senior segment has kept us on a stable level in total depite a weaker market for mobile phones in recent years. in 2018 we will strive to turn the negative development in 2017, by strengthen-ing our product offering among other things. We also conclude that we are still under- represented in certain european regions. An increased presence in these regions is something we see as a possi-bility to extend our position as market leader in mobile telephony for seniors.
“ We executed a number of measures to increase efficiency and reduce cost through our business.”
DORO ANNUAL REPORT 2017 CeO'S COMMeNTS7

UPDATED STRATEGY As seniors attain greater technological maturity, we want to get even better at communicating the value our products and solutions create and distinguish ourselves from the market’s other par-ticipants. This is one of many reflections that have led us to decide that while we
continue to focus on seniors, we will be prioritising their relatives more, to improve safety and the active lives this enables. i’m convinced that the combi-nation of Doro’s in-depth understanding of its consumers, brand recognition among seniors and strong services offering, not least within Doro Care, can
make a big difference to people’s every-day lives. Accordingly, this conviction is one of the drivers behind the continued evolution of innovative complete solu-tions. There’s more information on the execution and directions of Doro’s strat-egy on page 13.
COMBINING OFFERINGS TO CREATE A NEW DIMENSION
“ i am convinced that the combination of Doro’s in-depth understanding of its consumers can make a big difference to people’s every-day lives.”
Phones Telecare
Combiningo�erings to create a new
dimentionDoro Response
Smartphones
Feature phones
Care Services
Doro Connect
Care Devices
DORO ANNUAL REPORT 2017 CeO'S COMMeNTS8
PRIORITIES IN 2018 in 2018 we are committed to work to turn around the negative trend in sales of mobile phones in 2017. Among other things, we will launch subscription-based mobile safety services, which will be fully integrated in our mobile phones, directly to consumers. We will increase our presence in markets where we are under-represented and open more sales channels in markets where we are already well established. Naturally, we will continue to develop the best mobile phones for seniors in the market.
in line with our updated strategy, we will also be working to develop and launch our SmartCare offering in the year to sharpen our service sales in the longer term. We executed the very first demo of this offering at Mobile World Congress in barcelona at the end of February.
After a period of efficiency measures and development of Doro Care, we are now ready to study how to expand this operation geographically.
Just as in 2017, we will be continuing our work on actions to improve effi-ciency, for example management of logistics, inventory and transportation.
Last, but not least, i’m looking forward to continuing my exciting journey with my colleagues at Doro, working alongside them for safer and more active lives for seniors and their relatives.
robert Puskaric, President and CeO
March 28, 2018
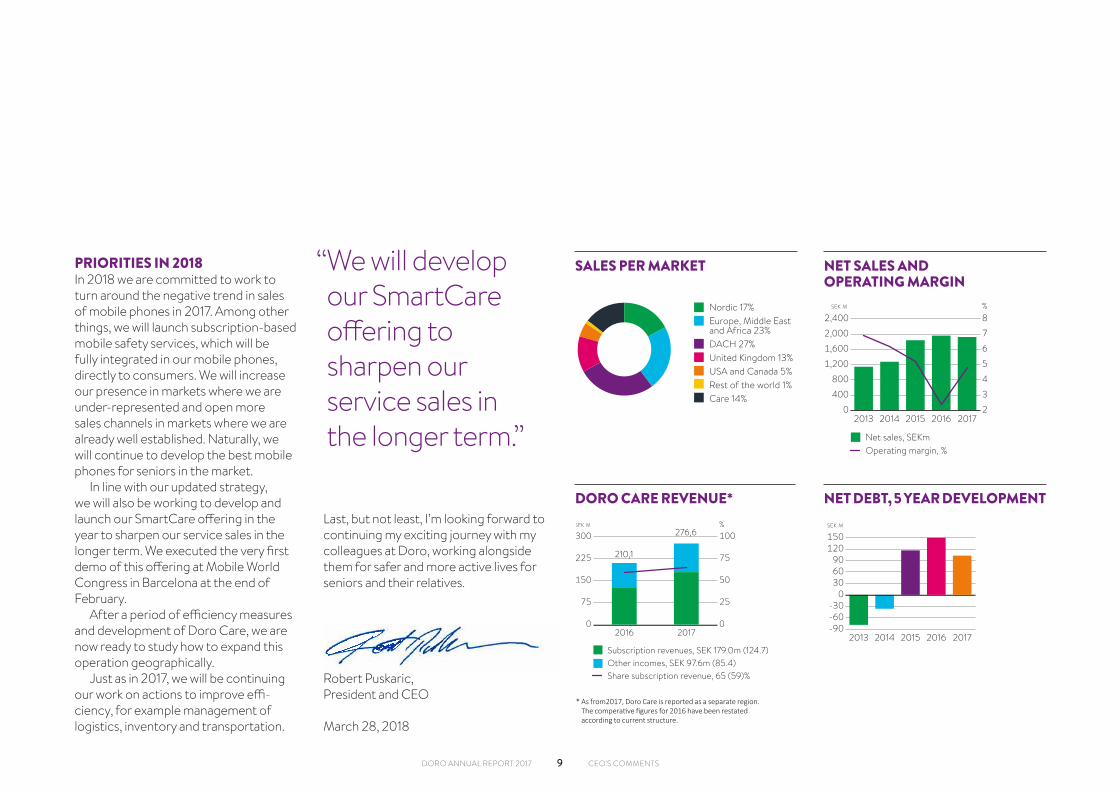
“ We will develop our SmartCare offering to sharpen our service sales in the longer term.”
SALES PER MARKET
Nordic 17%Europe, Middle East and Africa 23%DACH 27%United Kingdom 13%USA and Canada 5%Rest of the world 1%Care 14%
Nettoomsättning markander
NET SALES AND OPERATING MARGIN
Net sales, SEKmOperating margin, %
0
400
800
1,200
1,600
2,000
2,400
201720162015201420132
3
4
5
6
7
8SEK M %
Doro koncernen
NET DEBT, 5 YEAR DEVELOPMENT
-90-60-30
0306090
120150
20172016201520142013
SEK M
Nettoskuld, utvecklingDORO CARE REVENUE*
Subscription revenues, SEK 179.0m (124.7)Other incomes, SEK 97.6m (85.4) Share subscription revenue, 65 (59)%
210,1
276,6
0
75
150
225
300
201720160
25
50
75
100SEK M %
Doro Care
* As from2017, Doro Care is reported as a separate region. The comperative figures for 2016 have been restated according to current structure.
DORO ANNUAL REPORT 2017 CeO'S COMMeNTS9

The share of the global population aged over 65 is growing1),we’re living longer and are healthier. This is a contributor to the growing demand for connected and mobile solutions for seniors. Forecasts for 2040 estimate that in europe, there will be about two working people per pensioner, compared to 1980, when the corresponding figure was about five1). Helping older people live at home longer, which is usually what they want, is a clear focus for decisionmakers and the authorities. Older people want to balance their lives in town, the vacation home, or abroad. in order to balance the cost challenges facing society, we think the power of innovation to create intelli-gent solutions will become more impor-tant for retaining, or even enhancing, the quality of life of seniors and their rela-tives. Our experience indicates that this is a significant part of the efforts neces-sary to create the potential for a healthy population in a sustainable society.
GLOBAL MARKET TRENDSDoro has always been engaged in how to find the best way to help seniors live active, rich lives. Somewhat carelessly, seniors are often lumped together as a
single homogeneous group, instead of viewing them as individuals with widely differing needs and expectations of life. We also see these differing needs in our geographical markets. Doro’s biggest markets display technological maturity and a growing demand for smartphones. between 2014 and 2017 alone, smartphone usage by people aged 65 and over increased from 33 to 49 percent1). Our research also indicates that the mobile functionality seniors use most widely is calling, sending and receiving texts, capturing and view-ing images, emailing and browsing the internet1). Going forward, our challenge on the smartphone market will remain to stand out from other players in terms of making phones easy to understand and use. This is why Doro always puts the interests of seniors first when develop-ing new solutions.
DIGITALIZATION WITHIN HEALTH AND SOCIAL CAREPublic bodies are still facing a pressing need for digital safety solutions, prod-ucts and services because they do not view the analog alternatives as equally reliable. in recent years, Doro’s solutions
MARKET AND DRIVERS
We’re living longer and are healthier. This is a contributor to the growing demand for connected and mobile solutions for seniors.
have played a leading role in the migra-tion to digital alarm systems by many of Sweden’s municipalities, and we still see substantial development potential and opportunities on the market for digital-ized solutions.
As a participant on the global market, we always present Doro in relation to the business environment we operate in. in our efforts to formulate Doro’s new strategy, there are five primary market trends that we have identified, which are the foundation of our services offering: • Seniors want to be part of the digital world, creating a growing need for new technology
• Senior purchases and usage of mobile phones will be the highest-growth segment over the next five years Meanwhile, consumer willingness to pay for safety services is growing
• Current telecare solutions could be made more efficient and intelligent through technological innovation
• Government-funded geriatric care needs to be optimized to address this growing need and demographic changes
• An increasing need for private operators in health and social care solutions.
DRIVERSGovernment finances are contracting—or the same funds need to finance more in society. At the same time, there is vast technological development where con-tinuous innovation gives us the prerequi-sites to be smart, so we can enhance the quality of life of seniors, simultaneous with participating and contributing to reducing social costs.
Our driver is to develop and deliver safe, complete solutions and systems that enable seniors to enjoy a stronger feeling of belonging, safety, community, and being
49%smartphone usage by people aged 65 and over
1) Sources: UN World Population Prospects och River Research
DORO ANNUAL REPORT 2017 MArKeT AND DriVerS10

DORO’S COMPETITIVE EDGEMarket access: • Market channels in place in over 40 countries
• Sale through operators, resellers, municipalities and online
• extensive distribution network • extensive partner network.
Offering and technology: • Strong brand recognition among seniors
• Award-winning product portfolio in mobile telephony for seniors
• Complete digital alarm chain.
Consumer understanding: • Long-term and solid experience of the senior segment
• in-depth understanding of seniors and the changes that occur with ageing
• Substantial knowledge of adapting technology to seniors.
a genuine part of our society—just like everyone else. We think this is largely about instilling our seniors with self-confidence so that they can live full and rich lives: to do the things they want to more easily and make things they never thought they could do possible.
COMPETITION Doro faces competitors in each seg-ment worldwide, but the breadth of our product and service portfolio, as well as our geographical coverage, are unique. Doro’s tailored telecom and telecare offerings match the different phases of ageing. Our competition consists of other handset producers, operators and businesses active in safety technology.
USTotal population:
327million
Of which aged >65 years:
51 million
15.6%Source:CIA World Factbook
EUTotal population:
516million
Of which aged >65 years:
99million
19.1%Source: CIA World Factbook
DORO ANNUAL REPORT 2017 MArKeT AND DriVerS11

“ Doro is so easy, it’s wonderful if you want to learn how to use a smartphone”
LASSE'S STORY

STRATEGY
BUSINESS CONCEPT AND VISIONDoro wants to make age a life stage of independence, empowerment and enjoyment. We want seniors to feel free to pursue their desires and get what they want out of life. Doro has been working to give senior users the possibility of adopting digital technology according to their own circumstances for a long time. While it might be obvious that indi-vidual circumstances differ, it is equally obvious that not everyone is lucky enough to remain completely healthy in their senior years. even normal ageing involves compromised vision, hearing and motor skills. Additionally, many older people experience everything from limited movement to the need to get in touch with relatives or care staff quickly for help in different situations. This is why we are developing service-centered complete solutions that help seniors live active and rich lives.
“THE THIRD WAVE”—A NEW STRATEGY FOR LONG-TERM PROFITABILITY AND GROWTHWe presented an updated strategy to lead us in our work in becoming a com-plete provider of digital and physical solutions and services in an integrated services portfolio at Doro’s capital markets day on 14 November 2017. The core components of Doro’s updated strategy are about offering the market service-centered, complete solutions for senior comfort and safety—a direc-tion that addresses external challenges and utilises our internal strengths. These complete solutions combine capabili-ties in the mobile telecom and telecare areas. We have called our offering, which is currently in development, SmartCare by Doro.
Where previously Doro’s products and solutions were largely addressed separately, by integrating our mobile telecom and telecare offerings, we open
a new dimension of possibilities. Our telecom offering currently spans feature phones and smartphones, and we will be adding subscription-based alarm-services in 2018. Our offering in the tel-ecom offering is largely driven by seniors who want to be part of the technology society, which has accentuated the need for simple and adaptive products and solutions. The understanding of technol-ogy increases, which requires that our phones have the most popular functions and work with the most used applica-tions. Our main focus so far has been on hardware, and our route to consumers was via resellers, distributors and opera-tors. We now see possibilities to extend our position as market leader in mobile telephony for seniors by continuing to have the most relevant product offer-ing in combination with services, and to increase our presence on markets where we are under-represented. The most fundamental drivers of Doro’s telecare
offering are to produce smart products and services that make people safer and enable them to live at home longer. in turn, this helps reduce the costs for wider society, while enhancing the well-being of seniors and their relatives. At present, our business to consumers is through care providers, municipalities and non-profit bodies. Going forward, our ambition is to also offer security ser-vices directly to private individuals.
Primarily, Doro is planning for con-tinued organic and acquisition-led geographical expansion across europe, with the goal of attaining clear and relevant market positioning in relation to competitors and customers, and this applies to telecom and telecare—as well as ultimately, SmartCare by Doro.
The need for cost-efficient health and social care is growing simultaneously with changes to global demographics. Accordingly, innovative solutions to address the challenges facing society are imperative—now and in the future.
DORO ANNUAL REPORT 2017 STrATeGy13
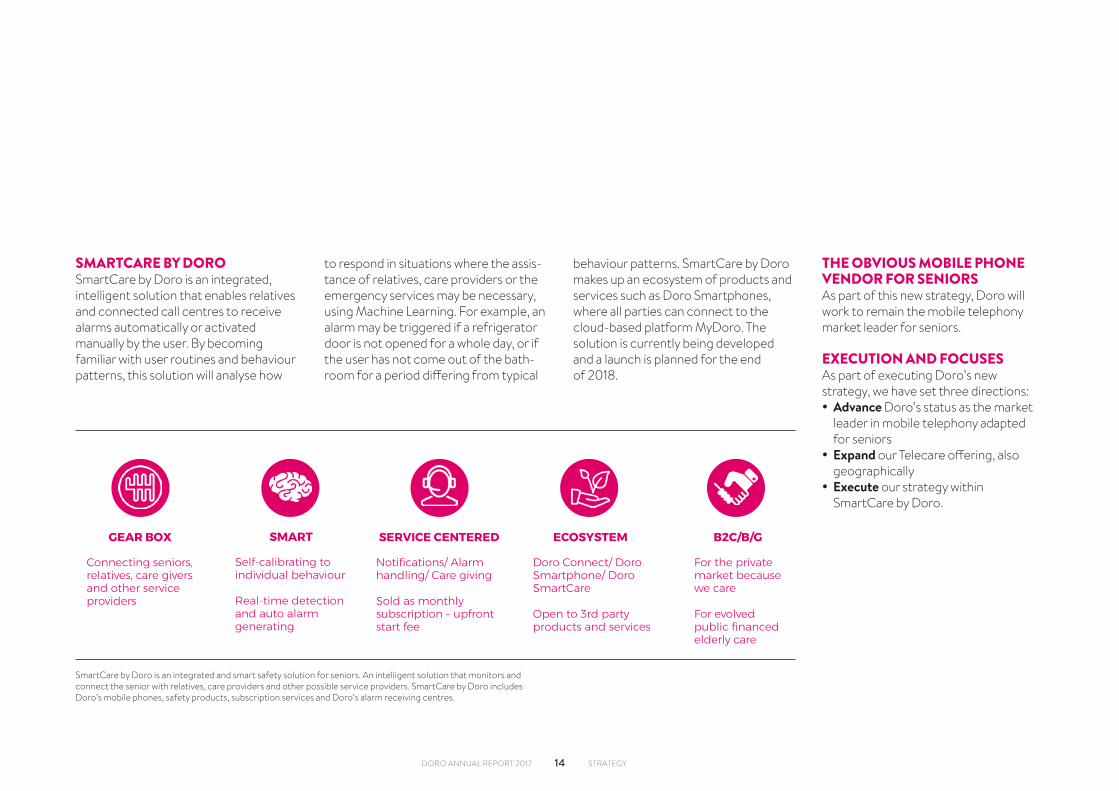
SMARTCARE BY DORO SmartCare by Doro is an integrated, intelligent solution that enables relatives and connected call centres to receive alarms automatically or activated manually by the user. by becoming familiar with user routines and behaviour patterns, this solution will analyse how
to respond in situations where the assis-tance of relatives, care providers or the emergency services may be necessary, using Machine Learning. For example, an alarm may be triggered if a refrigerator door is not opened for a whole day, or if the user has not come out of the bath-room for a period differing from typical
behaviour patterns. SmartCare by Doro makes up an ecosystem of products and services such as Doro Smartphones, where all parties can connect to the cloud-based platform MyDoro. The solution is currently being developed and a launch is planned for the end of 2018.
SmartCare by Doro is an integrated and smart safety solution for seniors. An intelligent solution that monitors and connect the senior with relatives, care providers and other possible service providers. SmartCare by Doro includes Doro’s mobile phones, safety products, subscription services and Doro’s alarm receiving centres.
Connecting seniors, relatives, care givers and other service providers
GEAR BOX
Self-calibrating to individual behaviour
Real-time detection and auto alarm generating
SMART
Notifications/ Alarm handling/ Care giving
Sold as monthly subscription – upfront start fee
SERVICE CENTERED
Doro Connect/ Doro Smartphone/ Doro SmartCare
Open to 3rd party products and services
ECOSYSTEM
For the private market because we care
For evolved public financed elderly care
B2C/B/G
THE OBVIOUS MOBILE PHONE VENDOR FOR SENIORSAs part of this new strategy, Doro will work to remain the mobile telephony market leader for seniors.
EXECUTION AND FOCUSES As part of executing Doro’s new strategy, we have set three directions: • Advance Doro’s status as the market leader in mobile telephony adapted for seniors
• Expand our Telecare offering, also geographically
• Execute our strategy within SmartCare by Doro.
DORO ANNUAL REPORT 2017 STrATeGy14

DORO SMARTPHONES
DORO WEB PORTAL
Relative Senior Care Provider Retail Support
DORO FEATURE PHONES DORO SERVICES
Doro ResponseDoro Assist
Doro ConnectThird-party Services
+ SMART SENSOR COMPATIBLE
GATEWAY PROHOME GATEWAY
SMART SENSORS
MACHINE LEARNING
UNIFIED CLOUD SOLUTION
SmartCare by Doro
MyDoro is the spider in the web for SmartCare by Doro. MyDoro is a cloud-based service that makes it possible to monitor and handle all the senior’s safety products, such as mobile phones, sensors and cameras, and services connected to a relative or to an alarm receiving centre. MyDoro will be offered as one version for individuals and one version for care providers.
DORO ANNUAL REPORT 2017 STrATeGy15
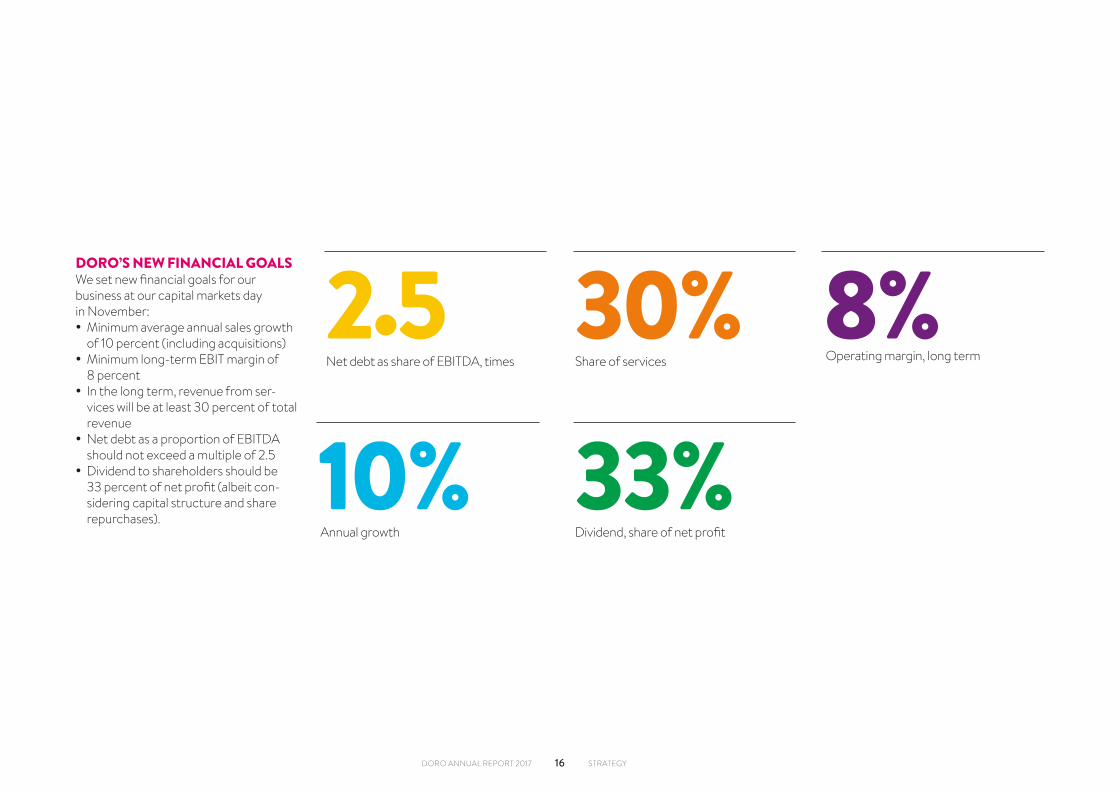
DORO’S NEW FINANCIAL GOALSWe set new financial goals for our business at our capital markets day in November: • Minimum average annual sales growth of 10 percent (including acquisitions)
• Minimum long-term ebiT margin of 8 percent
• in the long term, revenue from ser-vices will be at least 30 percent of total revenue
• Net debt as a proportion of ebiTDA should not exceed a multiple of 2.5
• Dividend to shareholders should be 33 percent of net profit (albeit con-sidering capital structure and share repurchases).
30%Share of services
2.5Net debt as share of ebiTDA, times
33%Dividend, share of net profit
8%Operating margin, long term
10%Annual growth
DORO ANNUAL REPORT 2017 STrATeGy16

“ The best thing i like about Doro, i must tell you, is its simplicity.”
LOREDANA'S STORY

OPERATIONS
A TAILORED COMPLETE OFFERING OF SOLUTIONS, PRODUCTS AND SERVICES Doro works continuously on producing solutions that create value in seniors’ everyday lives. The common feature of our overall offering is that experiences should be easy and safe, so that the every day lives of seniors and their rela-tives can also be so. When we create a new offering, our work always begins with end-user wants and needs. There are many reasons people need our solutions, which vary depending on their stage of life, and accordingly, we develop products that interact with each other and last.
Doro focuses on developing subscrip-tion-based mobile safety services that work within and outside the home. These services suit people that need extra safety at home in case anything unex-pected happens, and people who want to be active outdoors more safely. This type of service encapsulates Doro’s offering, in terms of the needs and challenges facing its target group and wider society.
Doro divides its offering between Telecom and Telecare. Telecom covers feature phones and smartphones, while
Telecare includes safety alarms, services, alarm reception and support.
ORGANISATION Doro’s organisation is populated by professionals with a high level of techni-cal competence, and many have worked for, and grown with, the company for a long time. Sales professionals, product developers and marketers operate close to customers and suppliers. This close collaboration is something that is becoming more important as Doro conducts more complex, and more effective, development projects. We also appoint external specialists on projects in segments we want to discover more about. Using this educa-tional working method, we accumulate valuable knowledge, and thus create good potential for innovation and the supply of competence.
DEVELOPMENT, MANUFACTURE AND DISTRIBUTIONDoro leads its development work from its head office in Lund, supported by units in Kalix in Sweden, Hong Kong and China. in 2017, Doro co-located
more resources in Lund to streamline its processes. Development work is largely based on our extensive market research, which provides us with insight into the needs of seniors and their relatives. Doro’s partnerships feature long-term relationships worldwide. Manufacturing and development is conducted jointly with carefully selected providers in the US, india, Taiwan and Australia. Doro’s 14 offices around the world deal with distri-bution, marketing and sales, through an extensive network of carefully selected collaborative partners and various chan-nels. These channels are resellers in
consumer electronics, ergonomics and rehabilitation, network operators and e-commerce providers. For Doro Care, the counterparties are municipalities, other organisations, and commercial care providers.
DORO’S DEVELOPMENT UNITS, SALES OFFICES & PARTNERS
Head office: Lund Development units: Kalix, Lund, Hong Kong Sales offices/partners: Lund, Stockholm, Oslo, Helsinki, Copenhagen, Paris,
London, Milan, Madrid, Frankfurt, Amberg, New york, Melbourne
DORO ANNUAL REPORT 2017 OPerATiONS18

PHASE
UNDERSTANDING/ KNOW-HOW PRODUCT DEVELOPMENT PRODUCTION DISTRIBUTION CUSTOMERS SAFETY SERVICES
VALUE CREATION
THE KNOWLEDGE
BANK5.6PERCENT
1,858CHECKS
3.1 mNO. OF DEVICES
40,000TRAINED SALESPEOPLE
15,000 SAFETY ALERTS
Doro has unique and deep knowledge about and insight into users’ needs and requests
This share of Doro’s total sales is spent on product development
performed by 11 collabora-tion partners in 2017
delivered every year by distributors, operators and retailers
worked for resellers in 2017 are received daily in Sweden and Norway
Continuous studies of seniors and their relatives are conducted to develop products and services that fully meet their require-ments for a safer and richer everyday life. by doing so, Doro contrib-utes to raise awareness of what is needed to facili-tate everyday life for the users and their relatives, and that it is possible and desirable to meet these needs and requests.
by clearly and consciously specifying requirements, the development of Doro’s hardware makes design and user interfaces provide an enhanced user experience and user-friendliness.
Our product develop-ment is certified for quality according to iSO 9001 and has clear processes and structure on how we develop products in accordance to customers’ requirements.
Doro’s conscious and systematic quality control and monitoring processes and close dialogue with carefully selected produc-tion partners means qual-ity is embedded at every step.
We always endeavor to choose high quality mate-rials for best results.
Collaborations with carefully selected dis-tributors big enough to manage high flows but small enough to be able to adapt to flows so volume and destination flexibility is tailored over time and tracks fluctua-tions in pricing, supply and demand.
Doro works actively on training and informing customers’ staff/sales-people, so they inform users of the actual ben-efits of Doro products and services. This ensures that users get accurate infor-mation and can make the right purchasing decisions.
Doro Care offers a com-plete digital alarm chain in Sweden and Norway. Around the clock, every day. Doro’s alarm receiv-ing centres (ArC) in Sweden and Norway receive around 15,000 alerts daily from more than 125,000 connected safety alarms. The staff of the ArC’s are educated assistant nurses, working experience from care providers and speak 15 dif-ferent languages as well as Swedish and Norwegian.
Doro endeavors to create added value for users, their families and wider society by enabling easier, free and safer everyday lives for seniors. Doro achieves this by
developing high-quality, easy-to-use communication solutions and safety services especially tailored for sen-iors. Through deep understanding, innovative product
development and well-structured distribution and sales, Doro creates value in the form of enhanced quality of life, the conservation of resources and economic value.
DORO'S VALUE CREATION
DORO ANNUAL REPORT 2017 OPerATiONS19

MOBILE PHONES
With the aim of simplifying everyday lives and making it easier for users to stay in touch, Doro has created a broad portfolio of feature phones and smartphones, with all models being user-friendly and based on individual user needs.
FEATURE PHONES SMARTPHONES
Doro’s feature phones are logical, intuitive and easy to use, and can be combined with a selection of our other services.
Once you start using a smartphone, it’s hard to live without one. Using smartphones, users can safely stay in touch with family and friends through social networks, send messages, listen to music, make video calls and stream videos.
APPLICATIONS & SERVICES
Doro develops apps that address the needs of its target group. Unlike many other providers, we adapt font sizes, contrast levels and designs within the apps them-selves. To get up and running with a new Doro mobile as quickly as possible, users get comprehensive guidance appropriate for their individual understanding of technology. We also offer training and support on our website so that everyone can use our services easily.
MY DORO MANAGER CONNECT & CARE
My Doro Manager is a practical web service that makes owning a Doro mobile even easier and safer. by logging into the website, users or their relatives can easily change mobile settings and content from any location. This service also enables data transfer to a new mobile.
Connect & Care® is an app and sub-scription service that makes staying in touch with family and friends easier. Doro Connect & Care® enables a network of family and friends to care for a loved one by monitoring their daily status, responding to requests for assistance and urgent alerts, or just stay in touch using a simple messaging service.
OUR PRODUCTS AND SERVICES
DORO ANNUAL REPORT 2017 OPerATiONS20

CARE SOLUTIONS
Doro Care offers reliable products, solutions and services for an end-to-end digital alarm chain, mainly for seniors and disabled people who want to feel safer within or outside the home. This solution covers the complete alarm chain, from safety alarms through accessories to alarm reception and call-outs. We have been developing digital safety alarms and systems for over ten years and are now the market leader in digital safety alarms in Sweden and Norway.
DORO CONNECT DORO ALARM APPLICATION (DAA) SAFETY ALARMS ALARM RECEPTION
Doro Connect is a mobile safety sub-scription service. The service is suitable for people that want extra safety at home if something unexpected hap-pens, and for people who want to feel safer and more secure outdoors. A mobile safety service that works within and outside the home.
Doro Alarm Application (DAA) is a mobile app that makes Doro smartphones compatible with alarm receiving centres. The app enables alarms to be triggered using different functions on the phone. DAA can be downloaded or comes pre-installed on selected Doro smartphones.
A safety alarm enhances user safety between health and social care staff visits, and suits people who want to manage their own lives at home. Doro has been developing safety alarms for over ten years and provides secure safety solutions that cover the com-plete alarm chain, from safety alarms through accessories to alarm recep-tion and call-outs. SmartCare by Doro is an offering that is in development. it is an integrated and intelligent solution that enables relatives and connected alarm receiving centres to receive alarms automatically or triggered manually by the user. read more about SmartCare by Doro in the Strategy section.
if you fall, need to contact staff or are just worried, then being able to trigger an alarm and get help brings a sense of security. A simple click sends the alarm to Doro’s alarm receiving centre, and help is on its way. We provide a complete digital alarm chain in Sweden and Norway, which provides seniors and disabled people with a secure safety solution.
A description of our alarm receiving centre in Sweden:
Doro Care provides 24/7/365 alarm recep-tion, specialising in safety alarms. The service receives some 15,000 alarms per day. Our alarm centre currently has over 90,000 alarms connected in some 150 municipalities, making us the largest private safety alarm receiving centre in Sweden. in order to be able to offer a competent alarm reception service, we put a premium on knowledge. Accordingly, our staff have nursing assistant training and health and social care work experience. Our staff speak some 15 languages as well as Swedish.
DORO ANNUAL REPORT 2017 OPerATiONS21

“ i think with the Doro it is just so clear what you want to do. it's just very easy to use.”
GILL'S STORY

A SUSTAINABLE BUSINESS
BUSINESS MODELboth our products and services pass through several steps from the require-ments of the stakeholders to satisfied customer. For each step in the business model, there are policies, guidelines, routines and instructions which guide us in the right direction to create value for our stakeholders. Management and supporting processes supervise, support and develop.
DORO ANNUAL REPORT 2017 SUSTAiNAbiLiTy23

in 2017, Doro studied the UN’s Global Sustainable Development Goals, and concluded that our sustainability work is a good fit with three of them. This is why we created three focuses to work on, each of which reflects a global goal.
UN SUSTAINABILITY GOALDORO’S FOCUS OUR CONTRIBUTION
Reduced inequalities Our phones and telecare solutions improve the lives of seniors and disabled people. Our products enable them to live more like other people.
What we sell should be good for the world
We utilise good materials in our products to improve their environmental performance end to end through life cycles, from raw material to recycling. We reduce our environmental impact through more efficient and environmental transportation.
Production and products that do not harm the environment or people
Responsible consumption and production
Phones are an important information channel. Our staff and suppliers enjoy fundamental freedoms and comply with legal standards.
Our staff enjoy good conditions, and conduct themselves well
Peace, justice and strong institutions
DORO ANNUAL REPORT 2017 SUSTAiNAbiLiTy24

With its adaptive products and solutions, Doro simplifies everyday lives, creating security for seniors and their relatives. As the market leader in easy-to-use and secure telecom and telecare solutions for seniors, we’re helping create a soci-ety where older people can enjoy safer and more active lives fully. Our service-based home security solutions enable more seniors to live in their homes for longer, which is usually what they want themselves. This also offers gains from socioeconomic and environmental per-spectives, one of many examples being health and social care staff being able to avoid vehicle journeys because user status is presented digitally.
CUSTOMERS AND USERSDoro provides technology that helps seniors live more active and richer lives. Our customer base consists of a range
of institutions such as municipalities and health authorities, as well as consumers.
Our customers should feel safe using our products, solutions and services. Personal data is managed with a high degree of confidentiality in Doro’s partnerships with municipalities, which is why we accredited our call centre with iSO 27001 in 2017. This means we apply stringent standards to the systematic management of information security based on customer requirements and legislation. This sets high standards on: • Confidentiality (prevention of unau-thorised access)
• Accuracy (prevention of undesired amendment)
• Accessibility (access by authorised people at the appropriate time)
• Traceability (capability to track changes).
This work is founded on our information security policy and guidelines. Amongst many other requirements, it includes rules governing how staff should conduct themselves to avoid personal data being disclosed to third parties, but instead, should only be available to the individuals that this information relates to.
Creating high awareness and pro-cesses regarding information security among staff is an important part of this work. This is why one initiative in the year was training our employees to satisfy the requirements set on internal processes by certification. These training packages will remain a priority, as will focusing on reducing the risks.
Doro has competitors on the market that provide similar services, but what is unique is the breadth of our product and services portfolios. Our tailored, complete offerings in telecom and tel-ecare have been produced to match the different phases of ageing. Our strength is that Doro’s technology enables high integrity and safety, which are long-term value creators for all our customers.
WHAT WE SELL SHOULD BE GOOD FOR THE WORLDGoal 10: reduced inequalities
Target 10.2: by 2030, empower and promote the social, eco-nomic and political inclusion of all, irrespective of age, sex, disability, race, ethnicity, origin, religion or economic or other status.
OUR CONTRIBUTION:
Our phones and telecare solutions improve the lives of seniors and disabled people. Our products enable them to live more like other people.
DORO ANNUAL REPORT 2017 SUSTAiNAbiLiTy25

RESPONSIBILITY IN EVERY ASPECT OF OUR BUSINESSin different ways, Doro attempts to contribute to more sustainable develop-ment in every aspect of our business—from raw material to production and use by consumers (see value creation illustration on page 19). Doro does not conduct any production in-house and our manufacturing partners are in loca-tions including China. it is important for Doro to live up to our values in every part of our business, including our part-ners’ production units, which require
systematic working methods for speci-fying requirements and monitoring.Doro complies with the GSM Associ-ation’s Universal Charging Solution (UCS) initiative to standardise USb chargers on the market and eventually reduce the production of new chargers.
MATERIALS AND RAW MATERIALSDoro endeavors to select materials with the minimum environmental impact possible. As more environmental materi-als are developed, we evaluate whether
they can replace current alternatives. Our membership of the electronic industry Citizenship Coalition (eiCC) has enabled Doro to start work on improving the traceability of raw materials through the supplier level, and thus ensure that wherever possible, conflict minerals are not used.
Doro satisfies eU standards governing materials and chemicals in our products.
The usage of hazardous substances is formalised within roHS (restriction of the use of certain Hazardous Substances in electrical and electronic equipment). The purpose of this eU directive is to reduce risks to human health and the environment, and stipulates Ce labelling in addition to environmental labelling. The POP (Persistent Organic Pollutants) directive sets another new limitation in terms of materials. We also comply with reACH/SVHC (Substance of Very High Concern), the batteries Directive, the Packaging Directive and labelling plastic for recycling etc.
PRODUCTION, PRODUCTS AND SERVICES THAT DO NOT DAMAGE THE ENVIRONMENT OR PEOPLE Goal 12: responsible consumption and production
Target 12.2 by 2030, achieve the sustainable management and effi-cient use of natural resources.
Target 12.4 by 2020, achieve the environmentally sound manage-ment of chemicals and all wastes throughout their life cycle, in accordance with agreed inter-national frameworks, and signifi-cantly reduce their release to air, water and soil in order to minimize their adverse impacts on human health and the environment.
Target 12.6 encourage compa-nies, especially large and transna-tional companies, to adopt sus-tainable practices and to integrate sustainability information into their reporting cycle.
OUR CONTRIBUTION:
We utilise good materials in our products to improve their environmental performance end to end through life cycles, from raw material to recycling. We reduce our environ mental impact through more efficient and environmental transpor tation. For example, hardware components within our Care offering can be recycled because they are produced in a way, and using materials, that enable disinfection.
DORO ANNUAL REPORT 2017 SUSTAiNAbiLiTy26

MANUFACTURING AND OUR SUPPLIERSDoro has contracts and partnerships with about a dozen manufacturing partners in China. Most specialise in consumer electronics and telecom, although we also have agreements with a number of accessory producers. it is important that Doro is clear about what it stands for and conducts itself accord-ingly—in every aspect of our business. Doro endeavors to secure long-term relationships and close collaborations with partners and suppliers. We want to be a positive force for change and cre-ate incentives for our partners and sup-pliers to evolve and improve. We believe we can contribute to progress by stand-ing up for our values and demanding that our suppliers satisfy our code of conduct and environmental standards. Our risk analysis in 2017 identified occupational health & safety of our partners in China as one of our major sustainability risks, which means objectives and monitoring are important.
All our suppliers undertake to comply with our Code of Conduct, which has been produced in two versions—one for the european market and a more specific and extensive one for the Asian market. Doro has been executing third-party audits of existing suppliers at least every third year since 2008, depending on whether the supplier is rated high or low risk. We make our own visits to China four times per year, to ensure on site that plants are complying with our Code and guidelines. Our Chinese inspectors also play a crucial role in our efforts in upholding the Code, verifying all deliveries before shipping from each plant, and because they are on site, they can detect any unsatisfactory working conditions.
if a supplier breaches the Code or any other standard, we make it clear that this is not acceptable. Accordingly, to continue our partnership, we demand that the supplier produces a remedial actionplan. if the supplier still does not satisfy standards, Doro is entitled to dis-continue the collaboration immediately, which has not been necessary to date.
We give feedback back to our current suppliers using a Supplier Score Card after each visit, with CSr being one of several evaluation and monitoring parameters. We are always clear about the standards we apply to new suppliers.
Doro also sets clear environmental standards for its suppliers, and works actively on improving the environmen-tal performance of products through efficient design. When developing a new product, we always endeavor to make it better than the previous version—in terms of performance, energy con-sumption, ergonomics, user-friendliness, and in terms of recycling and servicing.
Doro’s largest suppliers hold iSO 14001 certification, and more plants are executing a range of environmental pro-grams to achieve iSO 14001 certification.
Doro does not conduct any opera-tions that require permits or reporting to regulators.
LOGISTICSin house, Doro works on optimising logistics for products and packag-ing. As far as possible, Doro uses
environmentally accredited suppliers and haulage contractors. We utilise maritime freight, and video and telecon-ferencing extensively.
IN-HOUSE OPERATIONSin-house, Doro endeavors to minimise its external environmental impact by utilising resources efficiently in every context. Doro Care Sweden has been environmentally certified since 2011, and more parts of our Norwegian operations secured environmental certification in 2017.
LIFE CYCLE PERSPECTIVEDoro takes a holistic view of product life cycles. Manufacturing products that last a long time and have good bat-tery capacity is an important part of its environmental philosophy. Our Care products can be disinfected and parts exchanged, conferring them with good environmental performance. Quality, respect for the environment and people are fundamental as we build the Group’s success and long-term profitability.
“ We want to be a positive force for change and create incentives for our partners and suppliers to evolve and improve.”
DORO ANNUAL REPORT 2017 SUSTAiNAbiLiTy27

VALUES AND BUSINESS ETHICSDoro operates in a sector in rapid trans-formation, which is why we need to be flexible and adapt to new user behaviour patterns and needs as we develop technology solutions. it is also important that Doro retains its core values and behaviour consistent with its Code of Conduct, even when progress is rapid. This implies responsibility in every aspect of our business. Doro’s core values per-meate our business culture and are guid-ing principles when we develop products and interact with each other, our customers and end-users. Our ethical Code of Conduct is the bridge between these principles, and our behaviour and
actions. We will be producing a plan to make us even better at disseminating our values to the people in our organisa-tion during 2018.
VALUESTrust: Trust that we will always deliver on our promises. Ease: Simplicity, and doing what we can to make everyday life easier. Care: Care and sympathy for other peo-ple’s needs.
CODE OF CONDUCT • business ethics and bribery • Human rights • Health and safety • Wider society • The environment • employee relationships.
Our complete Code of Conduct is available at Doro’s website.
OCCUPATIONAL HEALTH & SAFETYTo stay at the leading edge in our sector, we need to hire, retain and develop the right people with the right competence. This means employees are our most important resources and ambassadors. Find out more about how we achieve a positive working climate on page 30.
OUR STAFF ENJOY GOOD CONDITIONS AND CONDUCT THEMSELVES WELLGoal 16: Peaceful and inclusive societies
Target 16.5 Substantially reduce corruption and bribery in all their forms.
Target 16.10 ensure public access to information and protect funda-mental freedoms, in accordance with national legislation and inter-national agreements.
OUR CONTRIBUTION:
Phones are an important channel for accessing information. Our staff and suppliers should enjoy fundamental freedoms and comply with legal standards.
DORO ANNUAL REPORT 2017 SUSTAiNAbiLiTy28

Legal requirement How we respond
1. The Company’s business model
The business model is presented on page 23
2. Policy including audit procedures
The following policies are primarily relevant for sustainability aspects and are published on our website: • environmental Policy • Health & Safety Policy • business ethics
Group management follows up on these policies annually
3. Policy outcomes Our policies are monitored coincident with internal and external audits (iSO 9001, 14001, 27001), as well as annual follow-ups by Group management
4. Material risks Our most material sustainability risks are information security and suppliers, see page 36
5. risk management risk management is reviewed on page 36
6. Central performance indicators
• employee satisfaction and motivation • employee loyalty • Share of transportation from Asia by sea/air • Achieve iSO 27001 (information security) for call centers • reduce information security risks • increased awareness of information security by training staff • Achieve iSO 14001 (environment) for our Oslo operation.
All of the last four points are targets that have been satisfied.
SWEDISH ANNUAL ACCOUNTS ACT STANDARDS ON SUSTAINABILITY REPORTING:
AUDITOR’S REPORT ON THE STATUTORY SUSTAINABILITY REPORTTo the general meeting of the shareholders in Doro AB (publ), corporate identity number 556161-9429
Engagement and responsibilityIt is the board of directors who is responsible for the statutory sustainability report for the year 2017 on pages 23–29 and that it has been prepared in accordance with the Annual Accounts Act.
The scope of the auditOur examination has been conducted in accordance with FAR’s auditing standard RevR 12 The auditor’s opinion regarding the statutory sustainability report. This means that our examination of the statutory sustainability report is substantially different and less in scope than an audit conducted in accordance with International Standards on Auditing and generally accepted auditing standards in Sweden. We believe that the examination has provided us with sufficient basis for our opinion.
OpinionA statutory sustainability report has been prepared.
Malmö 28 March, 2018PricewaterhouseCoopers AB
Johan RönnbäckAuthorised Public Accountant
Magnus WillforsAuthorised Public Accountant
Auditor in charge
DORO ANNUAL REPORT 2017 SUSTAiNAbiLiTy29

EMPLOYEES “ We are convinced that differing competences and backgrounds are necessary to keep growing, on new and established markets.”
CULTURETo be able to offer our seniors pleasur-able lives by using our products and solu-tions, it’s critical that our employees feel the same when they go to work each morning. Doro’s core values are Trust, ease and Care, and we think it’s impor-tant to embed these core values into our everyday philosophy. This may be about looking for smart and simple solutions in what we do, but also in how we behave towards each other, our customers and partners. Our core values set the criteria for our annual employee reviews, and eventually, will also be the foundation of Doro’s leadership programme. in 2017, we conducted an employee satisfaction survey, which had a positive outcome. We measure motivation and satisfac-tion, as well as loyalty, and take actions on a departmental basis on any seg-ments where there are shortcomings. One practical outcome is that in 2018, we will relocate operations from Lund and Malmö to new, shared premises in central Malmö, because of dissatisfac-tion with the current premises being too crowded. We have also implemented more communication channels to all staff.
SEARCH & SELECTIONDoro has a flat organisational structure, which we hope, creates the potential to identify future talent and competences, but also promotes profitability and growth through a clear connection to our overall business goals. it is impor-tant for us that Doro is a sustainable employer that considers employees’ drive and needs. To streamline our Hr administration and care for our staff bet-ter, we implemented a new Hr system across all our operations in 2017, and work on this will continue in 2018.To even out our peaks and ensure that we have access to the resources and competence necessary to execute our mission, we appoint consultants when we need them. Our search and selec-tion process is managed by an external recruitment agency.
COMPETENCE & DIVERSITYWe are convinced that differing compe-tences and backgrounds are necessary to keep growing, on new and established markets. Our customers and consumers are located in over 40 countries, as are our operations. even if most of Doro’s
employees are in the Nordics, we priori-tise local presence on all our markets. Doro’s global diversification and under-standing of people and the society they live in are fundamental to our business. Our employees represent a wide variety of job categories including engineers, accountants, developers, care assistants, sales professionals and marketers. Many of them speak several languages, espe-cially at our alarm receiving centre in Malmö. However, collaboration between our businesses is in english to create functional communication group wide.
AGE AND GENDER DIVISION
LENGTH OF SERVICES
0
30
60
90
120
150
0–2 year2–5 year5–10 year10–20 year>20 year
NUMBER
Anställningstid
Women, 44%Men, 56%
Könsfördelning/Åldersfördelning, anställda
<20 year 1%20–30 year 24%31–40 year 26%41–50 year 26%
51–60 year 17%61–65 year 4%>66 year 2%
DORO ANNUAL REPORT 2017 eMPLOyeeS30

HEALTH & SAFETYWe continued to develop our proce-dures and monitoring of health and safety in 2017. We have policy and guide-lines in place that apply group wide. each business in individual countries then implement them in accordance with their national legislation, in order to satisfy the relevant standards. Follow-ups are conducted yearly to verify that our site offices are satisfying their standards. This process is in continuous development.
Our occupational health and safety risks are not substantial, but the most important ones we have identified are travel by car, travel to less safe countries and stress.
GEOGRAPHICAL DIVISION OF EMPLOYEES
Nordic 73%DACH 14%United Kingdom 4%EMEA 7%Hong Kong 2%
Anställda Geografiskt

DORO SHARE
SHARE PRICE AND MARKET CAPITALIZATIONThe Doro share is listed on Nasdaq Stockholm in the smallcap seg-ment, where companies have market capitalizations of up to eUr 150m. OMX Technology, the Stockholm Stock exchange sector index where Doro is a constituent, rose by a total of 9.2 per-cent in 2017. in the same period, Doro’s share price fell by 17.6 percent. The Stockholm Stock exchange overall rose by 6.4 percent. At year-end 2017, Doro’s market capitalization was SeK 1,038 m (1,232). in 2017, more than 87 percent (93) of turnover in the Doro share was on Nasdaq Stockholm. A total of some 16.0 million (21.1) shares were traded in the year, with average daily turnover of 63,633 (83,495) shares.
SHARE CAPITALThe AGM (Annual General Meeting) in April 2017 approved the board of Directors’ proposal to authorise the board to reach decisions on new share issues up to an aggregate maximum number of shares, which at the day of the AGM, correspond to 10 percent of all outstanding shares, in the period until the following AGM. The resolution
was unanimous. The same AGM also approved the board of Directors’ pro-posal to authorise the board to decide to purchase treasury shares of a number, which any time, does not exceed 10 per-cent of all the shares of the Company. This resolution was unanimous. 517,000 new shares were issued coincident with staff exercise of warrants in July, the authorisation to purchase treasury shares was not exercised in 2017.
As of December 31, 2017, Doro’s share capital amounted to SeK 23,755,255 (23,238,255) with a total number of outstanding shares of 23,755,255 (23,238,255), each with a quotient value of SeK 1.00. All shares carry equal votes.
OWNERSHIP STRUCTURE AND SIGNIFICANT CHANGESeffective January 4, 2017, Jérôme Arnaud, formerly CeO and president of Doro, sold all his holdings in Doro, of 163,336 shares, to Accendo Capital. On September 28, 2017, the privately held investment firm rite Ventures reported a shareholding in the Company of over 2.2 million shares, or 9.3 percent of the capital and votes.
INVESTOR RELATIONS The Doro share is regularly monitored by financial analysts who work for remium and redeye, who publish updated research at www.introduce.se/foretag/doro and www.redeye.se/bolag/doro. Coincident with the Company’s publica-tion of its quarterly interim reports, the CeO and CFO host a webcast presenta-tion associated with each report. This webcast, normally held at 9 a.m. on the reporting date, is available at the Company’s website, https://corporate.doro.com. The CeO and CFO take ques-tions at these presentations. in addition to the quarterly report webcasts, the CeO and CFO are also available for meetings and telephone conferences with investors, financial analysts and shareholders regularly through the year.
DIVIDENDDoro’s long-term target is a dividend payout ratio of 33 percent of net profit (albeit considering capital structure and share buy-backs). The board of Directors proposes that no dividend should be paid for 2017 since a decision has been taken to undertake a share buyback program.
SHAREHOLDERS BY HOLDING SIZEHolding, no. of shares
Number of shareholders
% of all shareholders
1–500 6,522 (8,746) 77.3 (79.0)
501–1,000 928 (1,161) 11.0 (10.5)
1,001–5,000 763 (897) 9.0 (8.1)
5,001–10,000 88 (107) 1.0 (1.0)
10,001–15,000 37 (44) 0.4 (0.4)
15,000–20,000 17 (17) 0.2 (0.2)
Över 20,001 83 (94) 1.0 (0.8)
Total 8,438 (1, 066) 100.0
Source: Euroclear
INVESTORS BY COUNTRY
Sweden, 58.9%Luxembourg, 19.8%Finland, 4.3%France, 4.9USA, 3.4%Other, 8.7%
DORO ANNUAL REPORT 2017 DOrO SHAre32

SHARE CAPITAL HISTORYYear Transaction
Change in number of shares
Issueprice, SEK
Increase in share capital, SEKm
Amount deposited, SEKm
Total number of shares
2001 Directed issue 11,764,705 8.50 11.8 100 21,467,859
2005 New share issue 7,141 1.00 0.0 0 21,475,000
2005 Reverse split, 5:1 –17,180,000 0.00 0.0 0 4,295,000
2006 New share issue, 3:1 12,885,000 6.00 64.4 71.2 17,180,000
2006 Offset issue 227,631 7.66 1.1 1.5 17,407,631
2009 Directed issue 1,700,000 9.50 1.7 16.2 19,107,631
2011 Directed issue 241,543 25.56 0.2 6.3 19,349,174
2013 Directed issue 1,457,000 27.89 1.5 40.6 20,806,174
2014 Warrant program 398,309 35.30 0.4 14.1 21,204,483
2015 Directed issue 2,033,772 41.50 2.0 84.4 23,238,255
2017 Warrant program 517,000 42.00 0.5 21.7 23,755,255
SHARE DATA Transaction 2017 2016 2015 2014 2013
Number of shares at year-end,000 23,755 23,238 23,238 21,204 20,806
Share price at year-end, SEK 43.70 53.00 62.00 38.80 44.00
Share price high 60.75 78.00 62.00 55.00 57.30
Share price low 42.10 45.10 37.50 25.10 24.60
Market capitlization at year-end, SEKm 1,038 1,232 1,440 823 915
Quotient value, SEK 1.00 1.00 1.00 1.00 1.00
Earnings per share, SEK 2.83 1.33 2.78 2.76 3.07
Cash flow per share, SEK1) 5.03 2.66 3.69 1.06 5.60
Reported equity, SEK 24.57 22.38 20.74 15.79 13.79
Dividend per share, SEK – 1.00 – – 1.50
Dividend share of net profit, % – 75 – – 51
P/E–ratio2) 15.44 39.73 22.30 14.05 14.33
Dividend yield, % 3) – 1.9 – – 3.41) Cash flow from operating activities dividend by number of shares before dilution at year-end2) Share price at year-end divident by earnings per share for the year3) Dividend per share divided by share price at year-end
MAJOR SHAREHOLDERS As of December 31, 2017 Ten largest shareholders
No. of shares
Proportion of capital and votes, %
Accendo Capital 3,743,092 15.8
Rite Ventures 1,916,199 8.1
FCP Objectif Investissement, Microcaps 997,000 4.2
Humle Kapitalförvaltning 932,288 3.9
Clearstream Banking S.A., W8IMY 745,121 3.1
Nordea Investment Funds 736,209 3.1
Avanza Pension 730,975 3.1
Origo Quest 1 634,592 2.7
LINC AB 600,000 2.5
Originat AB 560,000 2.4
Subtotal 11,595,476 48.8
Total number of shares 23,755,255 100
Source: Euroclear
0
500
1,000
1,500
2,000
2,500
3,000
30
40
50
60
70
80
90No. of shares 000 SEK
Jan Feb Mar Apr May Jun Jul Aug Sep Oct Nov Dec
SHARE PRICE AND VOLUME
Number of shares traded on all marketplaces Doro share, SEK OMX Stockholm OMX Technology
Source: Six och Fidessa
DORO ANNUAL REPORT 2017 DOrO SHAre33

OPERATIONS IN 2017
Doro AB (also referred to below as Doro) is a public limited company. The Company has its registered office in Lund, Sweden. It is registered in Sweden with corporate identity number 556161-9429. The head office address is Magistratsvägen 10, 226 43 Lund, Sweden. Doro has subsidiaries in France, Hong Kong, Norway, the UK, Germany, Italy and the US. The legal structure of the Group is stated in Note 9.
OPERATIONSDoro AB provides telecom products and services for seniors so they can live full and rich lives—doing the things they want to do more easily, and making things they never thought they could do possible. As the market leader in its segment—telecom for seniors—Doro provides easy-to-use mobile feature phones and smartphones, mobile apps and fixed line telephony with high volume and clear sound quality. Doro Care provides safety alarms and services for seniors and disabled people in their homes. Doro received several international design awards during the year, including the Orange Partner Award for Outstanding Excellence in Smart Mobile Designs for Seniors.
BUSINESS ENVIRONMENTDoro operates in the rapidly changing market for mobile communication and safety solutions for older consumers in Europe, North and South America and the Asia-Pacific region. Doro’s products are manufactured by contractors, mainly in China. Doro protects its products by owning moulding tools and design rights, and also by actively participating in design, development and quality assurance processes. Doro coordinates its sourcing to achieve economies of scale and attractive pricing.
THE SHAREInformation on the Doro share is on pages 32–33.
THE PAST YEAR’S OPERATIONS IN BRIEF:Total revenue amounted to SEK 1,924.0m (1,959.1), a decrease of 1.8 percent. • EBIT totalled SEK 92.0m (47.7).• The operating margin was 4.8 percent (2.4).• Profit after tax amounted to SEK 66.5m (31.0).
• Earnings per share after tax amounted to SEK 2.83 (1.33).• Cash flow from operating activities amounted to SEK 119.5m (61.7).
Doro launched a range of products and services in the year, including:
Smartphones• DORO 8040/8042—Intuitive smartphone with built-in remote access for
friends and family • DORO 8020X—bump and water-resistant smartphone for an active
lifestyle with IP67-classification • DORO 1360/1361/1362—Easy-to-use mobile phone with wide display
and camera • DORO 2404—Flip phone with large display • DORO 2424—Flip phone with external display• DORO 2414—Feature phone with large display and torch • DORO 540X—Robust dust and water-resistant feature phone.
Doro CareRadio transmitter 9350—radio transmitter module compatible with social alarm band. Supplied with or without casing to fit proprietary or third-party accessories.
REVENUE AND RESULTS OF OPERATIONSDoro’s total revenue in the year amounted to SEK 1,924.0m (1,959.1), a decrease of 1.8 percent on 2016. Growth was 31.7 percent in Doro Care and 12.9 percent in the DACH region (Germany, Austria, Switzerland and central Europe). Other markets returned low or negative growth, with the US and Canada down by 49.4 percent. Slow progress in the US and Canada was due to a technology migration that increased sales in 2016.
EBIT was SEK 92.0 M (47.7), generating an EBIT margin 4.8 percent (2.4). The margin expansion is due partly to reduced overheads and is partly because 2016 was affected by several non-recurring expense items.
Profit after tax amounted to SEK 66.5m (31.0). Net financial items were SEK –0.3m (–8.3).
CASH FLOW, INVESTMENTS AND FINANCIAL POSITION Cash flow from operating activities amounted to SEK 119.5m (61.7). The Group’s net cash flow and change in cash and cash equivalents, which amounted to SEK –3.9m (17.1) in the year, was charged with investments of SEK –70.2m (–96.4). The investments that were capitalised are primarily attributable to product development. A dividend of SEK 23.3m (0) was paid. At year-end, Doro had interest-bearing liabilities of SEK 165.0m (236.7), while cash and cash equivalents amounted to SEK 57.1m (61.0). The equity ratio increased to 49.6 percent (40.4) at the end of the period.
FINANCE POLICYThe aim of the Policy is to clarify responsibilities and define general rules and guidelines for specific areas within Doro, with a view to supporting operations, reducing financial risk and allowing efficient use of capital and cash flow.
Estimated currency flows based on normal volumes and current price lists (which usually apply for around three months) are 70–90 percent hedged. Doro applies hedge accounting in accordance with IFRS.
BOARD OF DIRECTORSThe members of the Board of Directors are Chairman of the Board Johan Andsjö, Karin Moberg, Jonas Mårtensson, Lena Hofsberger and Deputy Chairman Henri Österlund. The Chief Executive Officer Robert Puskaric also participates at Board meetings. The Company’s CFO Carl-Johan Zetterberg Boudrie is co-opted to the Board of Directors as Secretary.
REMUNERATION TO SENIOR EXECUTIVESThe Board’s proposed guidelines for remuneration of senior executives for 2018 are principally that salaries and other terms of employment for the management will be at market levels. In addition to fixed basic salary, management can also receive variable remuneration and bonuses with a predetermined ceiling and based on results achieved relative to established targets (and in certain cases, other key performance indicators).
The maximum cost, including social security contributions, for variable remuneration may not exceed the fixed remuneration to the company’s senior executives. The total expense for fixed and variable remuneration
DORO ANNUAL REPORT 2017 DireCTOrS rePOrT34

will be determined yearly at an amount that includes all the company’s remuneration expenses. The company’s senior executives are entitled to allocate a portion of their fixed and variable remuneration to other benefits, such as pension benefits. Management’s pension plans will mainly be defined contribution.
If employment is terminated by the Company, senior executives may be entitled to severance pay; in which case, this shall have a predetermined ceiling. No severance pay is due if employment is terminated by the employee. The Board is entitled to depart from these guidelines if there are particular reasons for this in individual cases. This proposal is consistent with the guidelines adopted by the Annual General Meeting 2017.
PRODUCT DEVELOPMENT AND DEVELOPMENT EXPENSES Doro conducts product development and design projects jointly with various external partners. In addition to the Company’s own development costs, manufacturing partners also bear significant development costs. Doro engages design companies from different countries and the costs may be either fixed or variable. Doro also sometimes sources technology from various external companies.
In addition, Doro invests in various moulding tools and design rights in order to protect product designs. These costs are capitalised until products are ready for shipment, when depreciation begins.
For 2017, the Group’s costs of development work amounted to SEK 49.1m (42.1).
Doro has registered the trademarks Doro, Doro Care, Care Electronics, Doro PhoneEasy, Doro Secure, Doro Experience, Doro Connect & Care, Doro Liberto, Ergonomic Sound, Audioline, Swisstone, CareTech and i-care, as well as many other product names and figurative trademarks. Doro has also protected its designs through a large number of registered design rights.
INVESTMENTSInvestments are made in design, moulding tools, certification processes, control equipment, other equipment, computers and software systems. Investments amounted to SEK 70.2m (67.4). See also accounting principles.
LEGAL PROCEEDINGS During the year Doro was not involved in any disputes that have affected, or will affect, the Company’s position materially.
QUALITYDoro regularly assesses suppliers using the “Doro Scorecard”. Assessments focus on suppliers’ manufacturing processes and specifies points of escalation for reported quality failures and associated remedial action. Potential suppliers are assessed on site in respect of all quality-related processes. At the same time, Doro conducts an initial assessment pursuant to its Code of Supplier Conduct. Product quality checks are also conducted on individual consignments.
REGULATIONDoro’s Quality Manager continually monitors the Company’s products to check that, as a minimum, they meet the standards set by authorities in relevant markets, technical specifications and environmental requirements.
DIVIDEND AND FINANCIAL TARGETSThe Company has a long-term operating margin target of 8 percent and an annual growth target of 10 percent (including acquisitions) for the coming years. For the long term, revenue from services will be a minimum of 30 percent of total revenue The Company’s target is a dividend of one-third of profit after tax (allowing for its capital structure and share repurchases). Finally, the Board of Directors has specified that net debt as a share of EBITDA will not exceed a multiple of 2.5.
In February 2018, the Board of Directors decided to execute a share repurchase programme for an aggregate maximum of up to SEK 25m, until and including 26 April 2018. The Board also decided not to propose a dividend for 2017.
PARENT COMPANYIn addition to Group management and finance functions, Parent Company Doro AB also provides a number of support functions for the rest of the Group. Marketing and product development are coordinated by the Parent Company, while the product and quality department oversees design and
tool modifications, as well as quality assurance of deliveries. Purchasing and logistics are also coordinated by the Parent Company, which isresponsible for flows of material within the Group. Doro AB and wholly owned subsidiary Doro Care AB were merged in June 2017.
Doro AB had net sales of SEK 1,531.8m (1,439.5). Profit after financial items amounted to SEK 48.5m (–1.3). Doro AB manages its subsidiaries’ financing. The Parent Company’s net debt was SEK 138.5m (221.0) at year-end 2017. Shareholders’ equity amounted to SEK 411.3m (373.2m).
RISKSDoro’s risks and uncertainties primarily relate to its ability to continually develop competitive products, disruptions in supply, customer relations and exchange rate fluctuations and the public tender financing process in Doro Care.
More information on Doro’s management of financial risks is in Note 23. Other risks are described below.
PRICE RISKDoro operates largely in telecommunications and is affected by general price decreases and the progress of costs in the consumer electronics industry. This means that selling prices may fall faster than production prices. Doro actively utilises a range of forecasting tools and monitoring programmes for production planning and stock management. The Company works in partnership with suppliers, enabling high flexibility based on forecasts that are converted into purchase orders. Changes to regulatory standards and technological progress could result in products in stock having a significantly lower sales value than estimated.
For Care products, pricing is normally determined by competitive public tender for new hardware sales, or new contracts for services for safety solutions.
BORROWINGSIn March 2016, Doro signed a loan agreement with Svenska Handelsbanken for a total credit facility of SEK 310m. SEK 50m (40) of this facility was repaid in the year. The loan facility with Handelsbanken also includes a SEK 50m overdraft facility.
DORO ANNUAL REPORT 2017 DireCTOrS rePOrT35

CASH FLOW RISKDoro’s cash flow from operating activities fluctuates naturally through the year due to the seasonality of sales. The Company’s cash funds and credit agreements have been adapted to address these fluctuations.
COMPETITION RISK Doro operates in competitive markets. Market segmentation is one way of facing the competition. In addition, Doro continually conducts market research into end-customers’ needs and preferences, so it can develop unique products. Activities to increase productivity are conducted in parallel. Brand development within the seniors’ market is another distinguishing feature of Doro that is an asset to the Company.
RISK OF BAD DEBT In recent years, Doro has maintained a low level of bad debt, since its main customer base consists of large corporate groups with regular trade. In 2017, Doro incurred bad debt of SEK 5.3m (2.5). Doubtful debt in 2017 amounted to SEK 3.5m (6.7). In 2017, no individual customer accounted for more than 10 percent of revenue.
RISK OF COMPLAINTS The risk of complaints refers to the costs of correcting faults arising in products supplied by Doro. Warranty periods are usually 12–24 months. Various provisions are made for outstanding warranties. The Group’s extensive quality work has improved quality in recent years.
INSURANCE RISKDoro has a coordinated programme for insurance. Drawing on external expertise, Doro has formulated a policy stating the type of insurance to be arranged, the amounts of cover required and risk allocation between the Parent Company and subsidiaries.
POLITICAL RISKPolitical risk is the risk that authorities in various countries take political decisions that make continued operations more difficult, more expensive or impossible. All production is in Asia (as is also the case for basically all competitors).
INFORMATION SECURITY RISKSThere is a risk of loss or spreading of information, but also that information is not available when it should be. Because of this, we have been working on applying ISO27001 in the most sensitive parts of the company. The risks have been evaluated in a very structured way during 2016–2017 in connection with our certification. The risks that have required or require action have plans that are revised on a regular basis.
LEGAL DISPUTESThis type of risk refers to the costs that may be incurred by Doro for pursuing various legal proceedings, as well as costs of third parties. Doro was not party to any material legal dispute in 2017. Doro draws on external expertise with a view to prevention and actively safeguards its rights.
SUSTAINABILITY RISKSSustainability risks are evaluated in a general way by each department concerned. Suppliers are an important risk since there could be suppliers with poor conditions regarding working environment or environmental impact in our supply chain. We perform our own as well as third party audit of our most important suppliers to ensure a proper level regarding foremost working environment and environmental impact.
SUSTAINABILITY REPORTDoro’s sustainability report, in accordance with the new requirements in the Annual Accounts Act, can be found on pages 23–29.
ANNUAL GENERAL MEETINGThe Annual General Meeting will be held at 2 p.m. on 27 April 2018 at Hotel Scandic Anglais, Humlegårdsgatan 23, 102 44 Stockholm, Sweden.
PROPOSED APPROPRIATION OF PROFITIn accordance with the authorisation of the AGM 2017, Doro has decided to execute a share repurchase programme of an aggregate total of up to SEK 25m, which is consistent with the previous year’s dividend, in the period up to and including 26 April 2018. The Board has also decided not to propose any dividend for 2017. The aim is to bring flexibility to the company’s capacity for distributing a portion of earnings to shareholders, and to serve as a tool for the Board to optimise the Company’s capital structure if it considers this the best option for utilising the Company’s cash reserves at the time.
The following unrestricted funds in the Parent Company are available to the Annual General Meeting:
Share premium reserve 179,811,455.70Fair value reserve –836,943.00Retained earnings 79,323,323.94Profit for the year 36,758,226.40 295,056,063.04
The Board of Directors proposes that the funds at the disposal of the Annual General Meeting are carried forward.
FULL-YEAR OUTLOOK FOR 2018Our expectation for 2018 is sales in the SEK 1.9–2.1 billion interval, and that EBIT will be in the SEK 100–140m interval, excluding potential acquisitions.
EVENTS AFTER THE END OF THE YEARIn February 2018 the company announced that Group management had been strengthened by the inclusion of Jörgen Alsing, vice president with responsibility for the new function SmartCare & Services. The new function strengthens Doro’s drive for safety services for seniors and their relatives. It was also announced that Annika Björk had been appointed new Human Resources Director and member of Group management.
DORO ANNUAL REPORT 2017 DireCTOrS rePOrT36

CLEAR RESPONSIBILITY FOR OPERATIONS CREATES CONFIDENCE
Having the confidence of the market, shareholders and the public is essential to Doro’s continued success. To maintain it, the Board of Directors and management must conduct themselves in a responsible, transparent and committed manner. Accordingly, it is reassuring that in the year, the Board of Directors worked effectively and constructively with the Company’s management and other employees. The role of the Board is becoming increasingly important in a global business environment where change is occurring ever more rapidly—not only in terms of the macroeconomic climate and specific business conditions that Doro operates in, but also through the increased competition now present in some of our markets.
We are well prepared to face changing market conditions and the Company can adapt quickly to new circumstances.
We are also in a period of significant investment in new products and services that make life easier for the world’s seniors. This places great demands on the Board’s ability to take well-founded decisions and to balance the risks and opportunities always associated with a commercial enterprise.
Doro’s openness to the market and the fact that we continually provide information about ongoing actions and results of operations are just as important to Doro’s credibility. This is the basis of a value-creating relationship with all our stakeholders, whereby existing and new shareholders can be sure they are receiving accurate information at the right time.
Doro AB is a Swedish public limited company listed on OMX Nasdaq Stockholm (“the Stockholm Stock Exchange”). Doro’s corporate governance is based on Swedish legislation, primarily the Swedish Companies Act, but also on the Stockholm Stock Exchange’s Rule Book for Issuers, the Swedish Corporate Governance Code (“the Code”) and other applicable rules. The Company is also governed by its Articles
of Association, internal instructions and policies, and recommendations issued by relevant bodies. This Corporate Governance Report has been prepared by the Board of Directors of Doro AB in compliance with the Swedish Annual Accounts Act and the Code. This Report is part of the formal Annual Accounts.
SHAREHOLDERSAccording to the share register maintained by Euroclear Sweden AB as of 31 December 2017, Doro AB had 8,438 shareholders. Foreign shareholders represented 41.1 percent of the total number of shares. The number of shares of Doro AB as of 31 December 2017 was 23,755,255, and at the same date, Doro’s market capitalisation was SEK 1,038m. Doro’s largest shareholder is Accendo Capital, which holds 15.8 percent of the Company’s shares.
SWEDISH CORPORATE GOVERNANCE CODEAll companies listed on the Stockholm Stock Exchange must comply with the Swedish Corporate Governance Code. Its aim is to improve the corporate governance of listed companies and to create confidence in them, from the public and participants on the capital markets. The Code is based on the principle of “comply or explain”, which means that companies may depart from the rules provided they give a satisfactory explanation for their departure and review the selected alternative. The Code is available on the website www.corporategovernanceboard.se.
ANNUAL GENERAL MEETINGThe Annual General Meeting is the Company’s highest decision-making body. The Board of Directors and Chairman of the Board of Doro AB are elected at the Annual General Meeting. The Company’s auditors are also appointed. The Annual General Meeting approves the Income Statement and Balance Sheet, and the
appropriation of profit or loss for the year. Other matters to be dealt with are laid down in the Swedish Companies Act. The Annual General Meeting is to be held within six months of the end of the financial year. Shareholders who are registered in Euroclear Sweden’s register of shareholders on the record date and have notified their intention to attend are entitled to participate at the Annual General Meeting.
NOMINATION COMMITTEEThe Annual General Meeting appoints the members of the Company’s Nomination Committee. The duties of the Nomination Committee are to nominate Board members and, where appropriate, auditors for election at the next Annual General Meeting, and to propose remuneration for work on the Board and its Committees to the Annual General Meeting. The Nomination Committee also proposes a Chairman for the Annual General Meeting.
The members of the Nomination Committee are Chairman Mark Shay, nominated by Accendo Capital, Christoffer Häggblom, nominated by Rite Ventures and Carl Rydin, nominated by Origo Capital. Johan Andsjö, Chairman of Doro AB, is a co-opted member of the Nomination Committee.
BOARD OF DIRECTORSDoro AB’s Board of Directors consists of five members elected by the AGM on 27 April 2017. Johan Andsjö was elected as Chairman. There is a more detailed presentation of each member on page 40. The Company’s former CFO Magnus Eriksson was co-opted to the Board of Directors as Secretary up to and including the Board meeting on 13 September 2017. Subsequently, Doro AB’s current CFO Carl-Johan Zetterberg Boudrie was co-opted to the Board of Directors as Secretary. Other senior executives participate at Board meetings to make presentations.
BOARD MEETINGS The Board of Directors met on 12 occasions in 2017, four meetings were held in Stockholm, three meetings were held at the Company’s premises in Lund, and one meeting was held at the Company’s premises in Malmö. Other meetings were held as conference calls. All Board members attended all meetings apart from Lena Hofsberger, who was absent on 9 November 2017. The Company’s CFO and Board Secretary attended all meetings apart from one. The Board deals with matters arising such as market conditions, budgets, results for the period and cost efficiency. All Board meetings follow an agenda, which is approved in advance. This is sent out to each Board member a week in advance of each meeting, along with relevant documentation and a list of matters outstanding from the previous meeting. The meetings of the Remuneration Committee are reported back to the Board and minutes of these meetings are distributed to the Board. Each month, the previous month’s results are also distributed with comments.
THE BOARD’S RULES OF PROCEDUREThe Board of Directors’ rules of procedure stipulate the working methods for Doro AB’s Board of Directors. The rules of procedure are based on the Articles of Association, the Swedish Companies Act and the Code. The Board bears overall responsibility for the Doro Group. The Board of Directors’ responsibilities also encompass Doro’s relationships with its shareholders, the general public, public authorities and other organisations and interest groups. The Board of Directors is responsible for executing resolutions made by the AGM and for achieving the business targets stated in the Articles of Association. The Board of Directors’ authorisations are stated in the Articles of Association and the Swedish Companies Act.
DORO ANNUAL REPORT 2017 COrPOrATe GOVerNANCe rePOrT37

APPRAISAL OF THE WORK OF THE BOARD OF DIRECTORSAn appraisal of the overall work of the Board of Directors through a collective internal assessment of the Board’s work should be conducted yearly. The results of this appraisal should be reported to the Nomination Committee.
SEGREGATION OF DUTIES BETWEEN THE BOARD OF DIRECTORS AND THE CHIEF EXECUTIVE OFFICERThe Company’s Board of Directors appoints its Chief Executive Officer. The segregation of duties between the Board of Directors and the Chief Executive officer is stated in the Board of Directors’ rules of procedure and instructions for the Chief Executive Officer. These documents state that the Board of Directors is responsible for the Company’s governance, monitoring, organization, strategies, internal controls and policies. The Board of Directors also decides on major investments, matters of principle regarding governance of subsidiaries and electing Board members and Presidents of subsidiaries. The Board of Directors assures the quality of financial reporting. In turn, the Chief Executive Officer is responsible for the Company being managed in accordance with the Board of Directors’ guidelines and instructions. Additionally, the Chief Executive Officer is responsible for budgeting and planning the Company’s operations to achieve specific targets. The Chief Executive Officer should make arrangements for a good control environment and for the Group’s risk-taking always complying with the Board of Directors’ instructions. Any non-compliance must be reported to the Board of Directors. The Board of Directors also receives regular updates from the Chief Executive Officer through monthly reports.
REMUNERATION COMMITTEE The whole Board is responsible for remuneration matters and other terms of employment for Group management and two other key employees. The Chairman of the Board approves the employment terms of managers who report to the CEO. In total, this applies to the terms of employment for nine people.
Directors’ fees are decided annually by the Annual
General Meeting. The Company’s Nomination Committee consults on proposals for fees.
The Board then sets the remuneration for the CEO. The Board has appointed Jonas Mårtensson and Henri Österlund internally to be members of the Remuneration Committee. The Committee held its first meeting on 27 April 2017,in which both members participated, to decide on remuneration principles for 2017.
REMUNERATIONTotal Directors’ fees amounted to SEK 1,350,000, in accordance with an Annual General Meeting resolution. Of this amount, the fees to the Chairman of the Board were SEK 450,000, SEK 300,000 to the Deputy Chairman, with each other Board member
receiving SEK 200,000. The Company’s current Chief Executive Officer received a salary of SEK 3,406,000 for his work in February to December 2017. Pursuant to the current employment contract, the Chief Executive Officer and the company have a mutual notice period of 12 months. During the notice period, the Chief Executive Officer is entitled to full salary and other employment benefits. The company’s former Chief Executive Officer received SEK 367,000 for January 2017. Salaries to the Group management’s other six members amounted to SEK 7,353,000. SEK 255,000 of variable compensation was paid for 2017. All employed members of Group management including the CEO are offered an employment benefit in the form of a company car. The Annual General Meeting held on 27 April 2017 adopted guidelines for remuneration of senior executives for the financial year 2017. The Company’s other senior executives have notice periods of two to twelve months.
GOVERNANCE OF SUBSIDIARIESThe 15 subsidiaries are managed and monitored by the Board of Directors in each country, mainly consisting of representatives of Doro AB in Sweden. Doro AB’s Chief Executive Officer and President is Chairman of every subsidiary apart from Doro SAS in France, where pursuant to local French law, Johan Andjsö is President/Chairman. The subsidiaries report to Doro AB’s Board of Directors at each meeting. Their reports contain
information on each company’s progress and financial position.
STEERING COMMITTEE/ FINANCE COMMITTEE The Finance Committee became an integrated part of the Board of Directors in the year, with the Company’s financial position and other issues within the remit of the Finance Committee discussed regularly during Board meetings. The Committee’s primary duty is to consult on quarterly financial statements, and provide decision support for acquisitions and the Group’s financing.
CONTROL AND AUDITING The Board of Directors bears ultimate responsibility for ensuring that the Company has a satisfactory structure for internal control and the preparation of reliable financial reports. It is the responsibility of the Board and Group management to monitor and identify commercial risks and govern the Company in such a way that it is able to manage its main risks.
The auditors monitor and review how the Company is being managed by its Board of Directors and CEO, and the quality of the Company’s financial reporting.
The AGM 2017 appointed audit firm PricewaterhouseCoopers AB as Doro’s auditors for a period of one year, with Magnus Willfors as Auditor in Charge. In the past three years, the Doro Group’s audit fees have amounted to SEK 1.6m (2017), SEK 2.0m (2016), and SEK 2.1m (2015).
AUDIT COMMITTEEThe responsibilities of the Audit Committee are an integrated part of Board meetings and minutes of these meetings. The auditor is scheduled to participate at meetings twice a year.
The focus and scope of the audit is presented by the Company’s auditor. An audit is conducted based on the quarterly accounts as of 30 September, with its outcome presented at a meeting with the Audit Committee.
All members attended all meetings, along with the auditor, Magnus Willfors. The Audit Committee satisfies the requirement of independence stated in the
Swedish Corporate Governance Code. The main duty of the Committee is to support the Board of Directors in its work on auditing and internal control, accounting and financial reporting. The main focus of work in 2017 was on following up on the year-2016 audit, and a more detailed review of the January-September 2017 period, known as the hard close.
INTERNAL CONTROLThe clear definition and communication of organizational resources, decision-making structures, responsibilities and authority levels in the Company’s policy documents is an important component of the control environment. More information on the Company’s internal controls is in the Directors’ Report on page 39.
The Group Controller is responsible for raising specific issues with the CFO. In view of the limited size of the Finance department, Doro does not consider that there is any need for a separate internal audit function.
APPOINTMENT AND DISMISSAL OF BOARD MEMBERS AND AMENDMENTS TO THE ARTI-CLES OF ASSOCIATIONThe company’s Board of Directors shall have a minimum of three and a maximum of seven members. Members are elected at the Annual General Meeting (AGM) for the period until the end of the first Annual General Meeting held after the Board member was appointed. The Articles of Association can be amended at Annual General Meetings or shareholders’ meetings.
AUTHORIZATION REGARDING NEW ISSUES OF SHARES AND PURCHASES OF TREASURY SHARESThe AGM on 27 April 2017 resolved to authorize the Board of Directors to decide on new issues of shares of a total maximum not exceeding 10 percent of the total number of outstanding shares. The AGM also decided to authorize the Board of Directors to take decisions on the purchase of treasury shares, of a maximum number of shares that treasury holdings do not exceed 10 percent of all the shares of the company at any time.
DORO ANNUAL REPORT 2017 COrPOrATe GOVerNANCe rePOrT38

THE BOARD’S REPORT ON INTERNAL CONTROLS FOR THE FINANCIAL YEAR 2017According to Swedish Corporate Governance Code, the Board shall ensure that the Company has sound internal controls and shall constantly be kept informed concerning, and evaluate the functioning of, the Company’s system for internal controls. In addition, theBoard shall submit a report showing how internal controls over financial reporting are organized and, if there is no internal audit function, evaluate the need for such a function and justify its position.
CONTROL ENVIRONMENTWith a view to creating and maintaining a functioning control environment, the Board has established a number of fundamental documents of significance for financial reporting, including in particular the Board’s rules of procedure and instructions for the CEO and the committees. The CEO bears the primary responsibility for maintaining the control environment established by the Board in the day-to-day work of the Company. He reports regularly to the Board as part of established procedures. In addition, reports are received from the Company’s auditors.
The internal control system also rests on a management system based on the Company’s organization and method of conducting operations, with clearly defined roles, areas of responsibility and delegation of powers. Steering documents such as policies and guidelines also play an important role in the control structure.
RISK ASSESSMENTThe Group conducts ongoing risk assessment to identify material risks in respect of the financial statements.
The main risk relating to the financial statements is considered to be of material misstatement, e.g. in accounting records and the measurement of assets, liabilities, income and expenses, or other discrepancies.
Fraud and losses through embezzlement are a further risk. Risk management is an integral part of each process and various methods are used to evaluate and limit risks, and to ensure that the risks Doro is exposed to are managed according to established rules, instructions and follow-up procedures. The purpose of this is to minimize any risks and promote accurate accounting, reporting and disclosure.
CONTROL ACTIVITIESControl activities are in place to manage the risks that the Board and Company management consider to be material to the business, internal control and financial reporting.
The control structure sets out clear roles within the organization that enable the efficient segregation of duties for specific control activities aimed at the timely detection and prevention of the risk of reporting errors. Such control activities include a clear decision-making hierarchy and procedures for major decisions such as acquisitions, other types of major investment, divestments, agreements and analyses.
Implementing, improving and maintaining the Group’s control procedures and conducting internal controls for mission-critical issues is an important duty of Doro’s central functions. The individuals responsible for processes at different levels are responsible for implementing the necessary controls over financial reporting. The period close and reporting processes include controls relating to measurement, accounting principles and estimates.
Jointly with the analysis conducted at group level, continuous analysis of financial reporting is critical for ensuring that the financial statements are free from material misstatement.
The Group controller serves an important role in the internal control process, bearing responsibility for financial reporting from each unit being accurate, complete and timely.
INFORMATION AND COMMUNICATION Doro collaborates with communications consultancy Hallvarsson & Halvarsson AB, with the aim of promoting completeness and accuracy in financial statements released to the stock market. Regular updates and bulletins inform the employees concerned of changes to accounting principles and reporting requirements and also provide them with other information. The organization has access to policies and guidelines. The Board receives monthly financial reports. External information and communication is regulated by documents including the Company’s Communications Policy, which states Doro’s general disclosure principles.
MONITORINGDoro’s compliance with adopted policies and guidelines is monitored by the Board and management. The Company’s financial position is discussed at each Board meeting. The Board’s Remuneration Committee and Steering/Finance Committee serve an important role in matters such as remuneration, financial reporting and internal control. Before publication of Interim Reports and the Annual Report, the Board and management review the financial statements.
Doro’s management conducts monthly follow-ups of earnings, analyzing variances from budget, forecasts and the previous year. The duties of the external auditor include performing an annual review of the internal controls implemented by Group subsidiaries.
The Board meets with the auditors twice a year to discuss internal controls, and in specific cases, instruct the auditors to perform separate reviews focusing on specific areas.
In this overall context, the Board does not consider it necessary to establish a dedicated internal audit function.
Lund, Sweden, March 2018
INTERNAL CONTROLS
DORO ANNUAL REPORT 2017 COrPOrATe GOVerNANCe rePOrT39

BOARD OF DIRECTORS AND AUDITORS
JOHAN ANDSJÖ
Chairman of the BoardPrimary occupation: Chairman of the Board
Education: B.Sc., Royal institute of Technology, Stockholm
Year of election: 2016
Year of birth: 1972
Nationality: Swedish
Other assignments: Board member: Crystal Almond holding (Wind Hellas), Adamo Telecom Iberia SA, Advisory Board T-mobile NL
Dependence: Company: No Owners: No
Previous assignments: CEO of Salt (former Orange Switzerland), Consejero Delegado Yoigo
Own and related parties shareholdings: 80,000 shares
KARIN MOBERG
Member of the BoardPrimary occupation: Founder and CEO of FriendsofAdam AB
Education: MBA, Stockholm University
Year of election: 2009
Year of birth: 1963
Nationality: Swedish
Other assignments: Chairman of the Board: Friends-OfAdam AB, Board member: Doro Care AB, SBAB
Dependence: Company: No Owners: No
Previous assignments: 14 years experience from leading posi-tions at Telia Company Board member: AP 7, IAR Sys-tems Group AB, Caretech AB
Own and related parties share-holdings, 2016: 5,000 shares
JONAS MÅRTENSSON
Member of the BoardPrimary occupation: Partner and Board member in Alted AB
Education: MBA, Stockholm School of Economics
Year of election: 2007
Year of birth: 1963
Nationality: Swedish
Other assignments: Chairman of the Board: Alcadon Group AB, Ownpower Projects Europe AB, Board member: DistIT AB, IAR Systems Group AB, JNM Invest AB
Dependence: Company: No Owners: No
Previous assignments: 17 years in corporate finance at SEB Enskilda, Maizels, Westberg & Co and Nordea
Own and related parties shareholdings: 50,000 shares (through companies)
LENA HOFSBERGER
Member of the BoardPrimary occupation: Profes-sional Board member
Education: Master of Business Administration, Bachelor of Arts, Both degrees Gothenburg University
Year of election: 2015
Year of birth: 1954
Nationality: Swedish
Other assignments: Chairman of the Board: Ambea AB (publ)Pharma Relations AB, Leos Lek-land, RestaurangAssistans AB, Board member: Max Hamburgerrestauranger
Dependence: Company: No Owners: No
Previous assignments: CEO of Aleris, CEO of SSP Group Ltd, and a number of positions at Compass Group Plc and SAS Service Partner
Own and related parties shareholdings: 0 shares
HENRI ÖSTERLUND
Vice chairman of the BoardPrimary occupation: Managing Partner, Accendo Capital
Education: M.Sc. (econ.), Helsinki School of Economics
Year of election: 2015
Year of birth: 1971
Nationality: Finnish
Other assignments: Founder and partner Accendo Capital
Dependence: Company: No Owners: Yes
Previous assignments: Board member: Okmetic Oyj, Talentum Oyj, Comptel Oyj, Partner: Conventum Corporate Finance, Triton, Associate: Doughty Hanson in Stockholm
Own and related parties share-holdings: 6,830 shares
MAGNUS WILLFORS
AuditorPricewaterhouseCoopers ABOther assignments: Elanders AB, Carl Bennet AB, Lifco AB, Midway Holding AB, Arise AB and Genovis AB
Year of birth: 1963
DORO ANNUAL REPORT 2017 bOArD OF DireCTOrS AND AUDiTOrS40
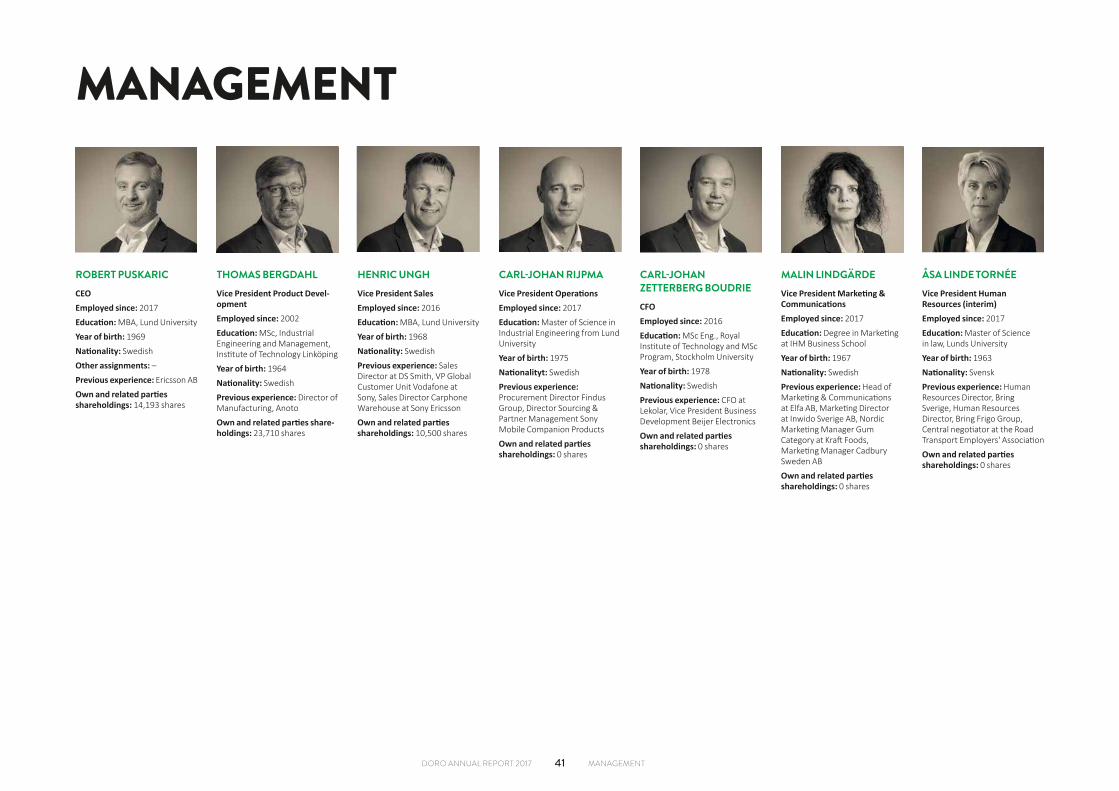
MANAGEMENT
ROBERT PUSKARIC
CEOEmployed since: 2017
Education: MBA, Lund University
Year of birth: 1969
Nationality: Swedish
Other assignments: –Previous experience: Ericsson AB
Own and related parties shareholdings: 14,193 shares
THOMAS BERGDAHL
Vice President Product Devel-opmentEmployed since: 2002
Education: MSc, Industrial Engineering and Management, Institute of Technology Linköping
Year of birth: 1964
Nationality: Swedish
Previous experience: Director of Manufacturing, Anoto
Own and related parties share-holdings: 23,710 shares
MALIN LINDGÄRDE
Vice President Marketing & CommunicationsEmployed since: 2017
Education: Degree in Marketing at IHM Business School
Year of birth: 1967
Nationality: Swedish
Previous experience: Head of Marketing & Communications at Elfa AB, Marketing Director at Inwido Sverige AB, Nordic Marketing Manager Gum Category at Kraft Foods, Marketing Manager Cadbury Sweden AB
Own and related parties shareholdings: 0 shares
HENRIC UNGH
Vice President SalesEmployed since: 2016
Education: MBA, Lund University
Year of birth: 1968
Nationality: Swedish
Previous experience: Sales Director at DS Smith, VP Global Customer Unit Vodafone at Sony, Sales Director Carphone Warehouse at Sony Ericsson
Own and related parties shareholdings: 10,500 shares
CARL-JOHAN RIJPMA
Vice President OperationsEmployed since: 2017
Education: Master of Science in Industrial Engineering from Lund University
Year of birth: 1975
Nationalityt: Swedish
Previous experience: Procurement Director Findus Group, Director Sourcing & Partner Management Sony Mobile Companion Products
Own and related parties shareholdings: 0 shares
CARL-JOHAN ZETTERBERG BOUDRIE
CFOEmployed since: 2016
Education: MSc Eng., Royal Institute of Technology and MSc Program, Stockholm University
Year of birth: 1978
Nationality: Swedish
Previous experience: CFO at Lekolar, Vice President Business Development Beijer Electronics
Own and related parties shareholdings: 0 shares
ÅSA LINDE TORNÉE
Vice President Human Resources (interim)Employed since: 2017
Education: Master of Science in law, Lunds University
Year of birth: 1963
Nationality: Svensk
Previous experience: Human Resources Director, Bring Sverige, Human Resources Director, Bring Frigo Group, Central negotiator at the Road Transport Employers' Association
Own and related parties shareholdings: 0 shares
DORO ANNUAL REPORT 2017 MANAGeMeNT41

FINANCIALSTATEMENTS

CONSOLIDATED INCOME STATEMENT THE GROUP
STATEMENT OF COMPREHENSIVE INCOMETHE GROUP
SEKm Note 2017 2016
REVENUE
Net sales 2, 3 1,924.0 1,959.1
Other revenue 2 34.4 16.0
OPERATINGS COST
Merchandise 19 –1,182.1 –1,205.7
Other external costs 4, 16 –343.1 –361.8
Personnel costs 5 –277.0 –274.2
Depreciation and impairment of property, plant and equipment 8 –5.3 –2.9
Depreciation and impairment of intangible assets 7 –58.9 –70.8
Other expenses 2 0.0 –12.0
Operating profit/loss 2 92.0 47.7
PROFIT/LOSS FROM FINANCIAL ITEMS
Interest income and similar profit/loss items 6 5.2 2.6
Interest costs and similar profit/loss items 6 –5.5 –10.9
Profit/loss after financial items 91.7 39.4
Tax on profit/loss for the year 17 –25.2 –8.4
Profit/loss for the year 66.5 31.0
Attributable to: Parent company’s shareholders 66.5 31.0
KEY FIGURES
Average number of shares, thousands 11 23,536 23,238
Average number of shares after dilution, thousands 23,591 23,411
Earnings per share after tax, SEK 2.83 1.33
Earnings per share after tax,after dilution, SEK 2.82 1.32
SEKm 2017 2016
PROFIT/LOSS FOR THE YEAR 66.5 31.0
Other comprehensive income to be reclassified to profit or loss in subsequent periods:
Translation differences 1.1 4.9
Effects from cash flow hedges –3.1 4.9
Deferred tax 0.7 –1.1
Other comprehensive income –1.3 8.7
Total result 65.2 39.7
Attributable to: Parent company’s shareholders 65.2 39.7
DORO ANNUAL REPORT 2017 FiNANCiAL STATeMeNTS43

BALANCE SHEETTHE GROUP
Assets, SEKm Note 2017 2016
ASSETS
Goodwill 7 375.3 372.1
Customer register and distribution agreements 7 11.5 17.0
Trademarks 7 0.0 0.0
Capitalized expenditure for development work 7 77.9 73.3
Right to lease 7 1.8 1.7
Equipment and tools 8 19.0 12.9
Long-term receivables 4 7.3 6.5
Other financial non-current assets 0.5 0.8
Deferred tax asset 17 9.5 11.9
502.8 496.2
CURRENT ASSETS
Inventories 19 196.9 217.9
Prepayments to supplier 2.1 6.3
Accounts receivable – trade 23 360.4 371.2
Other current receivables 4, 10 28.4 66.8
Current tax receivables 9.8 39.1
Prepaid expenses and accrued income 10 19.8 29.4
Cash and bank balances 12, 23 57.1 61.0
674.5 791.7
TOTAL ASSETS 1,177.3 1,287.9
Shareholders’ equity SEKm Note 2017 2016
SHAREHOLDERS’ EQUITY
Share capital 11 23.8 23.2
Other allocated capital 264.0 242.9
Reserves 12.0 13.3
Profit/loss brought forward 217.4 209.6
Profit/loss for the year 66.5 31.0
Total shareholders’ equity 583.7 520.0
LONG TERM LIABILITIES
Interest-bearing liabilities
Provisions for pension 21 2.6 2.2
Liabilities to credit institutions 4, 24 100.0 162.2
Total interest-bearing liabilities 102.6 164.4
Non interest-bearing liabilities
Other provisions 22 16.6 32.6
Total non interest-bearing liabilities 16.6 32.6
CURRENT LIABILITIES
Interest-bearing liabilities
Liabilities to credit institutions 4, 12, 24 62.4 72.3
Total interest-bearing liabilities 62.4 72.3
Non interest-bearing liabilities
Provisions for guarantees 20 51.5 58.1
Accounts payable – trade 158.8 254.9
Other liabilities 13.2 16.9
Current tax liability 4.4 2.6
Accrued expenses and prepaid income 13 184.1 166.1
Total non interest-bearing liabilities 412.0 498.6
TOTAL SHAREHOLDERS’ EQUITY AND LIABILITIES 1,177.3 1,287.9
DORO ANNUAL REPORT 2017 FiNANCiAL STATeMeNTS44

SHAREHOLDERS' EQUITY THE GROUP
Changes in shareholders' equity, SEKmShare
Capital Other allocated capital Reserves 1) Profit brought forward Total Shareholders' Equity
Shareholders' Equity December 31, 2015 23.2 244.7 4.5 209.6 482.0
Total Result for the year 31.0 31.0
Other comprehensive income 8.8 8.8
Total result 0.0 0.0 8.8 31.0 39.8
Warrants –1.8 –1.8
Total transactions with shareholders 0.0 –1.8 0.0 0.0 –1.8
Shareholders' Equity December 31, 2016 23.2 242.9 13.3 240.6 520.0
Total Result for the year 66.5 66.5
Other comprehensive income –1.3 –1.3
Total result 0.0 0.0 –1.3 66.5 65.2
Dividend –23.2 –23.2
New Share issue connected to warrant program 0.6 21.1 21.7
Total transactions with shareholders 0.6 21.1 0.0 –23.2 –1.5
Shareholders' Equity December 31, 2017 23.8 264.0 12.0 283.9 583.7
1) Specifikaction of reserves 2017 2016
Accumulated translation differences, January 1 11.7 6.7
Translation differences for the year 1.1 4.9
Accumulated translation differences, December 31 12.8 11.7
Accumulated effects of cash flow hedges, January 1 1.6 –2.2
Effects of cash flow hedges for the year –3.1 4.9
Deferred tax in effects of cash flow hedges 0.7 –1.1
Accumulated effects of cash flow hedges, December 31 –0.8 1.6
Total reserves, December 31 12.0 13.3
DORO ANNUAL REPORT 2017 FiNANCiAL STATeMeNTS45

CASH FLOW STATEMENTTHE GROUP
SEKm Note 2017 2016
CURRENT ACTIVITIES
Operating profit 92.0 47.7
Adjusted for items not in cash flowChange in provisions 20, 21, 22 –22.2 4.7
Depreciation and write downs 7, 8 64.2 73.7
Unrealized exchange differences in cash flow hedges 9.9 –0.6
Total adjustment for other non-cash items 51.9 77.8
Paid and received interest, net –5.0 –8.3
Taxes paid 17 –10.9 –26.3
Cash flow from current activities before changes in working capital 128.0 90.9
Change in working capital
Change in stocks 19 20.9 –25.3
Change in receivables 63.0 –3.7
Change in non-interest-bearing liabilities –92.4 –0.2
Cash flow from current activities 119.5 61.7
INVESTMENT ACTIVITIES
Acquisitions of subsidiaries 18 0.0 –29.0
Acquisition of intangible fixed assets 7 –58.4 –59.7
Acquisition of tangible fixed assets 8 –11.8 –7.7
Cash flow from current activities –70.2 –96.4
SEKm Note 2017 2016
FINANCING ACTIVITIES
Dividend –23.2 0.0
New Share issue 21.7 0.0
Warrant Program, buy back –1.2 –0.6
Amortization of loans –75.5 –79.8
Loan raised and change in bank overdraft facility 25.0 129.8
Cash flow from financing activities –53.2 49.4
Cash flow for the year –3.9 14.7
Liquid assets at start of year 61.0 43.9
Exchange rate difference in liquid assets 0.0 2.4
Liquid assets at end of year 23 57.1 61.0
DORO ANNUAL REPORT 2017 FiNANCiAL STATeMeNTS46

INCOME STATEMENTPARENT COMPANY
STATEMENT OF COMPREHENSIVE INCOMEPARENT COMPANY
SEKm Note 2017 2016
OPERATING INCOME
Net sales 2, 3 1,531.8 1,439.5
Other revenue 2 24.1 5.7
OPERATING COSTS
Merchandise 19 –971.0 –936.9
Other external costs 4, 16 –376.5 –373.6
Personnel costs 5 –97.2 –64.0
Depreciation and impairment of property, plant and equipment 8 –3.1 –0.5
Depreciation and impairment of intangible assets 7 –62.0 –57.7
Other expenses 2 0.0 –10.1
Operating profit/loss 2 46.1 2.4
PROFIT/LOSS FROM FINANCIAL ITEMS
Interest income and similar profit/loss items 6 10.2 7.2
Interest costs and similar profit/loss items 6 –7.8 –10.9
Profit/loss after financial items 48.5 –1.3
Group contributions received 1.4 0.0
Tax on profit/loss for the year 17 –13.1 –0.2
PROFIT/LOSS FOR THE YEAR 36.8 –1.5
SEKm 2017 2016
Profit/loss for the year 36.8 –1.5
Other comprehensive income to be reclassified to profit or loss in subsequent periods:
Effects from cash flow hedges –3.1 4.9
Deferred tax 0.7 –1.1
Other comprehensive income –2.4 3.8
Total result 34.4 2.3
DORO ANNUAL REPORT 2017 FiNANCiAL STATeMeNTS47

BALANCE SHEETPARENT COMPANY
Assets, SEKm Note 2017 2016
FIXED ASSETS
Intangible assets
Capitalized expenditure for development work 7 77.9 52.0
Goodwill 7 198.7 0.0
Customer register 7 6.3 0.0
Brands 7 0.0 0.0
Tangible assets
Equipment and tools 8 14.0 0.8
Financial assets
Participations in Group companies 9, 25 118.2 309.9
Receivables from Group companies 0.0 29.5
Deferred tax assets 17 1.4 8.1
Total fixed assets 416.5 400.3
CURRENT ASSETS
Inventories
Goods for resale 19 139.3 130.5
Advanced payment to suppliers 0.3 0.1
Current receivables
Accounts receivable – trade 23 267.1 266.7
Receivables from Group companies 210.2 253.6
Other current receivables 10 23.7 42.4
Current tax receivables 0.0 3.9
Prepaid expenses and accrued income 10 19.7 7.4
Cash and bank balances 12, 23 41.5 43.4
Total current assets 701.8 748.0
TOTAL ASSETS 1,118.3 1,148.3
Shareholders’ equity and liabilities, SEKm Note 2017 2016
SHAREHOLDERS’ EQUITY
Restricted equity
Share capital 23,755,255 (23,238,255) shares, quota value SEK 1 11 23.8 23.2
Revaluation reserve 0.5 0.5
Other allocated capital 55.5 55.5
Reserve for development expenses 36.5 28.5
Total restricted equity 116.3 107.7
Shareholders’ equity and liabilities, SEKm Note 2017 2016
Non-restricted equity
Share premium reserve 179.7 158.6
Fair value reserve –0.8 1.6
Profit/loss brought forward 79.3 106.8
Profit/loss for the year 36.8 –1.5
Total non-restricted equity 295.0 265.5
Total shareholders’ equity 411.3 373.2
PROVISIONS
Provisions for guarantees 20 42.8 49.9
Other provisions 22 15.8 25.0
Total provisions 58.6 74.9
LONG-TERM LIABILITIES
Interest-bearing liabilities
Liabilities to credit institutes 100.0 160.0
Total interest-bearing liabilities 100.0 160.0
CURRENT LIABILITIES
Interest-bearing liabilities
Overdraft facility 12 0.0 0.0
Liabilities to credit institutes 60.0 50.0
Liabilities to Group companies 20.0 54.4
Total interest-bearing liabilities 80.0 104.4
Non interest-bearing liabilities
Accounts payable – trade 125.5 178.1
Liabilities to Group companies 208.2 160.2
Other liabilities 12.2 5.6
Current tax liability 3.1 0.0
Accrued expenses and prepaid income 13 119.4 91.9
Total non interest-bearing liabilities 468.4 435.8
TOTAL SHAREHOLDERS’ EQUITY AND LIABILITIES 1,118.3 1,148.3
DORO ANNUAL REPORT 2017 FiNANCiAL STATeMeNTS48

CHANGES IN SHAREHOLDERS' EQUITYPARENT COMPANY
Changes in shareholders' equity 2017, SEKm Share capitalRevaluation
reserveStatutory
reserveDevelopment
expenses reserveShare premium
reserveFair value
reserveRetainedearnings
Total share-holders' equity
Shareholders' equity December 31 23.2 0.5 55.5 0.0 158.6 –2.2 135.3 370.9
Profit for the year –1.5 –1.5
Other comprehensive income 3.8 3.8
Total result 0.0 0.0 0.0 0.0 0.0 3.8 –1.5 2.3
Allocation of earnings to development expenses reserve 28.5 –28.5 0.0
Total transactions with shareholders 0.0 0.0 0.0 28.5 0.0 0.0 –28.5 0.0
Shareholders' equity December 31 23.2 0.5 55.5 28.5 158.6 1.6 105.3 373.2
Profit for the year 36.8 36.8
Other comprehensive income –2.4 –2.4
Total result 0.0 0.0 0.0 0.0 0.0 –2.4 36.8 34.4
Allocation of earnings to development expenses reserve 8.0 –8.0 0.0
Dividend –23.2 –23.2
Merger difference 5.2 5.2
New Share issue connected to warrant program 0.6 21.1 21.7
Total transactions with shareholders 0.6 0.0 0.0 8.0 21.1 0.0 –26.0 3.7
Shareholders' equity December 31 23.8 0.5 55.5 36.5 179.7 –0.8 116.1 411.3
DORO ANNUAL REPORT 2017 FiNANCiAL STATeMeNTS49

CASH FLOW STATEMENT PARENT COMPANY
SEKm Note 2017 2016
OPERATING ACTIVITIES
Operating profit 46.1 2.4
Adjusted for items not in cash flow
Change in provisions 20, 21, 22 –16.3 2.0
Depreciation and write downs 7, 8 65.1 58.1
Unrealized exchange differences in cash flow hedges 9.9 –0.6
Total adjustment for non-cash items 58.7 59.5
Net paid financial items –0.5 –3.7
Taxes paid 0.4 –4.4
Cash flow from current activities before changes in working capital 104.7 53.8
Change in working capital
Change in stocks 19 11.3 –9.6
Change in receivables 140.8 –44.9
Change in non-interest-bearing liabilities –124.2 28.6
Cash flow from operating activities 132.6 27.9
INVESTMENT ACTIVITIES
Acquisition of subsidiaries 18 0.0 0.0
Capital injection to subsidiaries –8.4 0.0
Acquisition of intangible fixed assets 7 –63.7 –50.6
Acquisition of tangible fixed assets 8 –9.2 0.0
Loan to subsidiary 0.0 –29.5
Cash flow from investment activities –81.3 –80.1
SEKm Note 2017 2016
FINANCING ACTIVITIES
Dividend –23.2 0.0
New share issue 21.7 0.0
Warrant program –1.2 0.0
Increase of non interest-bearing liabilities subsidiares 0.0 32.7
Amortization of loan 25.0 130.8
Loans raised –75.5 –75.0
Cash flow from financing activities –53.2 88.5
Cash flow for the year –1.9 36.3
Liquid assets at start of year 43.4 7.1
Liquid assets at end of year 23 41.5 43.4
DORO ANNUAL REPORT 2017 FiNANCiAL STATeMeNTS50

NOTES AND ACCOUNTING PRINCIPLES
NOTE 1ACCOUNTING PRINCIPLESThe Annual Accounts and Consolidated Accounts were approved for publication by the Board of Directors and Chief Executive Officer on March 28, 2018 and will be presented to the AGM on April 27, 2018 for approval.
The Consolidated Accounts were prepared in accordance with International Financial Reporting Standards (IFRS/IAS) as issued by the International Accounting Standards Board (IASB) as endorsed by the EU.
The Consolidated Accounts were also prepared in accordance with the Swedish Annual Accounts Act and the Swedish Financial Reporting Board’s recommendation RFR 1 (Supplementary Accounting Rules for Groups).
The Annual Accounts of the Parent Company were prepared in accordance with the Swedish Annual Accounts Act and applying the Swedish Financial Reporting Board’s recommendation RFR 2 (Accounting for Legal Entities). Statements applicable to listed companies issued by the Swedish Financial Reporting Board have also been applied.
New accounting policies for 2017There are no new accounting principles or interpretation statements that came into effect as of January 1, 2017 that materially affect these financial statements.
New accounting policies for 2018 and laterIASB has submitted several updated accounting standards that came into effect as of 1 January 2018. None of these are expected to have a significant effect on the consolidated financial statements.
IFRS 9 Financial instrumentsIFRS 9 addresses the classification, measurement and derecognition of financial assets and financial liabilities, introduces new rules for hedge accounting and a new impairment model for financial assets. The Group has reviewed its financial assets and liabilities and assessed the potential impact on its consolidated financial statements resulting from the application of IFRS 9. Doro concluded that its current hedge relationships qualifies as continuing hedges upon the adoption of IFRS 9 and has updated its hedge documentation in accordance with IFRS 9. Regarding impairment, the effect of the impairment model for expected credit losses will be insignificant. As the effects are insignificant the opening balances as of 1 January 2018 will not be affected by the adption of the new standard.
IFRS 15 Revenue from Contracts with CustomersIFRS 15 establishes a comprehensive framework for determining whether, how much and when revenue is recognised. The new standard is based on the principle that revenue is recognised when control of a good or service transfers to a customer. Doro carried out an analysis and impact assessment during the past financial year. The main part of the Group's sales are products delivered a specific point in time. IFRS 15 does not affect the Group's accounting of this type of sales. The accounting of the Group's sales of services delivered over time are neither affected by IFRS 15. In addition Doro Care offers a package deal of performance obligations (alarm device, alarm receiving services, communication etc). Based on a detailed analysis of these contracts, Doro identified a need to adjust the allocation of sales prices between different performance obligations included in the package deals. The changed allocation model has no significant impacts on Doro's consolidated financial statements. As the effects are insignificant the opening balances as of 1 January 2018 will not be affected by the adption of the new standard.
IFRS 16 LeasesIFRS 16 Leases was published in January 2016 and replaces the former IAS 17 Leases and the related IFRIC 4, SIC-15 and SIC-27 interpretation statements. Although accounting for lessors will be unchanged in all material respects, the accounting for lessees will change. There will no longer be a distinction between operating and finance leases, all leases will be recognized in the Balance Sheet apart from short-term leases and those of minor value. The model reflects the fact that at the start of a lease, the lessee obtains the right to use an asset for a period of time and has an obligation to pay for that right. The standard is effective for financial years beginning on or after 1 January 2019. Doro’s evaluation of the impact of IFRS 16 is on-going.
Other new or revised accounting standards are not considered to have a material impact on Doro’s financial statements.
Basis for the preparation of the financial statements Assets, provisions and liabilities are based on historical cost unless otherwise stated below.
All amounts, unless otherwise stated, are in millions of Swedish kronor (SEKm).
GROUP Consolidated Accounts Principles The Group includes Parent Company Doro AB, and the companies in which the Parent Company, directly or indirectly owns shares controlling more than half of the voting rights. This means that Doro AB exerts a controlling influence over Group companies.
At the end of the financial year there were 14 (15) trading companies in the Group.
Acquired companies are included in the Consolidated Accounts from the acquisition date or when control of the company is obtained. Sold companies are included up to and including the date they are sold.
The Consolidated Accounts are prepared in accordance with the purchase method, which means that the historical cost of participations in Group companies is divided between identifiable assets and liabilities at their fair value on the acquisition date. Unutilized loss carry-forwards for tax purposes in the acquired company are converted into deferred tax assets in the Consolidated Accounts if the assessed earnings capacity is such that utilising them is deemed possible. Furthermore, deferred tax is calculated on the difference between the fair values of assets and liabilities and their tax base.
In cases where the historical cost of participations in Group companies exceeds the net of acquired assets and liabilities, as above, the difference is recognized as goodwill, which is tested at least once a year for impairment.
For company acquisitions, the purchase price can be earnings dependent. The calculation is then based on future profit and hence the total purchase price. On a quarterly basis, an assessment is made as well as an adjustment of the expected purchase price. Changes in the item in question are recognized in profit or loss.
Intra-Group balances and unrealized internal gains are eliminated in the Consolidated Accounts. When eliminating internal transactions, accounts is also taken of the tax effect on the basis of nominal tax rates in each country.
Exchange rates Translation of foreign operationsAll of the assets and liabilities of foreign Group companies are translated at the closing day rate, while all items in the income statements are translated at the average rate for the financial year. The exchange rate differences arising in this context are partly an effect of the differences between the income statements’ average rates and closing day rates, and partly of the fact that net assets are translated at a different rate at the end of the year than at the beginning of the year. Translation differences are recognized in the Statement of Comprehensive Income.
DORO ANNUAL REPORT 2017 NOTeS51

Exchange rates The following exchange rates have been used in the translation of foreign operations:
Average rate Closing day rate
Currency 2017 2016 2017 2016
EUR 9.63 9.44 9.83 9.54
HKD 1.10 1.10 1.05 1.17
NOK 1.03 1.02 1.00 1.05
GBP 11.03 11.59 11.07 11.19
USD 8.53 8.57 8.21 9.07
Effects of altered exchange ratesReceivables and liabilities in foreign currencies are translated at the closing day rates and unrealized exchange gains and losses related to operations are included in other income and other expenses. Exchange rate differences related to non-operational items, such as cash and cash equivalents and bank loans, are recognised in net financial income/expense.
Revenue recognitionDors's revenues includes product sales of mainly telephone handsets and alarm devices and sales of alarm services. The services are normally offered as a package deal for a contracted period including alarm device, alarm services and communication between the alarm device and the alarm receiving centre. Product sales are recognised when the essentially all risks and rights associated with ownership has been transferred to the buyer, which usually occurs on delivery. Revenues relating to services are recognised in the period when services are rendered.Doro has discount agreements with most customers. Contracted discounts reduce sales revenue in the period the sale is recognised.
Employee benefits Employee remuneration is reported as salaries earned and paid plus vested bonus. Accrued holiday pay and social security contributions are recognized as accrued expenses.
Pensions The predominant share of Doro’s obligations towards employees consists of various defined-contribution pension plans.
A defined-contribution pension plan is a pension plan according to which the Group pays fixed fees to a separate legal entity. The Group has no legal or informal obligations to pay further fees if this legal entity lacks sufficient funds to pay all remuneration to employees associated with the employees’ service during current or previous periods.
For defined-contribution pension plans, the Group pays fees to publicly or privately managed pension insurance plans on a compulsory, contractual or voluntary basis. The Group has no further payment obligations once these fees have been paid. The fees are recognized as personnel costs when they become due for payment. Prepaid fees are recognized as an asset to the extent that cash repayment or reductions in future payments may accrue to the Group.
In addition, a limited number of employees at the Group’s French subsidiary have defined-benefit pension plans. A defined-benefit pension plan is one that is not a defined-contribution plan. Characteristic of defined-benefit plans is that they specify an amount for the pension benefit to be received by an employee following retirement. This is normally based one or more factors such as age, period of service and salary.
All obligations for which provisions are made are assessed by an actuary to determine the amount of the provision. The liability recognized in the Balance Sheet for defined-benefit pension plans is the present value of the defined-benefit obligation at the end of the reporting period.
Since the recognized liability regarding defined-benefit pension plans is an insignificant amount, the assumptions on which the actuarial calculations are based are not presented in the Annual Accounts.
Research and developmentProduct development is conducted in collaboration with various manufacturing partners and most expenditure is borne by them. Doro works in an environment of rapid technological progress. Product development refers to expenditure for product adaptations, design, model approval, etc.
Expenses relating to the development phase are capitalized as an intangible asset if it is likely, with a high degree of reliability, that they will result in future financial benefits for the Group.
This means that strict criteria must be met before a development project results in intangible assets being capitalized. Such criteria include the option of ending a project, proof that a project is technically feasible and that a market exists, and that there is an intention and opportunity to use or sell the intangible asset. There must also be an opportunity to reliably measure expenses during the development phase.
External partners’ moulds for manufacturing products are, however, owned by Doro and expenditure for them is capitalized and depreciated according to plan if the lifespan of the product is expected to exceed one year.
Doro has no research expenses.
Property, plant and equipment and intangible fixed assets Property, plant and equipment and intangible fixed assets are recognized at historical cost less accumulated depreciation/amortization according to plan, except goodwill and right to lease, which is not amortized in the Group.
Financial instruments Financial instruments recognized as assets in the Balance Sheet include, on the asset side, accounts receivable, other receivables, forward currency contracts, non-current investments and bank balances. Overdraft facilities, liabilities to credit institutions, accounts payable and other current liabilities are included in shareholders’ equity and liabilities. With the exception of forward currency contracts , financial instruments are initially recognized at historical cost, equal to the fair value of the instrument plus transaction expenses. Instruments are then recognized subject to how they have been classified in accordance with the following. Forward currency contracts are recognized in the Balance Sheet as of the contract date and are measured at fair value, both initially and in subsequent reassessments. For more information see the section on hedge accounting below.
A financial asset or financial liability is recognized in the Balance Sheet when the company becomes party to the instrument’s contractual terms. Accounts receivable are recognized in the Balance Sheet when invoiced. Liabilities are recognized once the counterparty has delivered and there is a contractual obligation to pay, even though an invoice may not yet have been received. Accounts payable are recognized when invoices are received.
A financial asset or part of a financial asset is de-recognized from the Balance Sheet when the contractual rights are realized, mature or are no longer under the company’s control. This also applies for part of a financial asset. A financial liability or part of a financial liability is de-recognized from the Balance Sheet when contractual obligations are met or otherwise extinguished. The same applies to part of a financial liability.
The purchase or sale of financial assets is recognized at the transaction date, which is the date on which the Company undertakes to purchase or sell the asset.
A financial asset and financial liability are offset against each other and the net amount recognized in the Balance Sheet only when there is a legal right to offset the amounts and there is an intention to settle the items to a net amount or realize the asset and settle the liability simultaneously.
Financial instruments are measured at fair value and classified in the following categories:• Derivatives held for trading• Derivatives subject to hedge accounting• Saleable assets• Accounts receivable and loans receivable• Other financial liabilities
Fair value is determined based on the following three levels:• Level 1: According to quoted prices on an active market for the same
instrument• Level 2: Based on directly or indirectly observable market data not
included in Level 1
Note 1 ACCOUNTING PRINCIPLES, cont.
DORO ANNUAL REPORT 2017 NOTeS52

• Level 3: Based on input data not observable on the marketAll financial instruments measured at fair value have been measured according to Level 2.
Financial assetsDerivatives – currency hedges• Derivatives are classified as held for trading or accounted for as hedges.
Derivatives held for trading• Measurement at fair value in profit or loss.
Derivatives accounted for as hedges• Measurement at fair value through other comprehensive income.
Available-for-sale assets• Measurement at fair value through other comprehensive income.
Accounts receivable and loans receivableAccounts receivable and loans receivable are non-derivative financial assets with determined or determinable payments that are not quoted on an active market. They are included among currents assets, with the exception of items maturing more than 12 month after the close of the reporting period, which are classified as non-current assets. The Group’s accounts receivable and loans receivable consist of accounts receivable and other receivables in the Balance Sheet. Accounts receivable are recognized net less doubtful debt. Deductions for doubtful debt are based on a model in which extended maturities give increased deductions. In addition, an individual assessment is made of accounts receivable, with account taken of anticipated bad debt losses. Other receivables are recognized net less doubtful debt based on individual assessments with account taken of the expected losses they are expected to incur.
Other financial liabilitiesOther financial liabilities consist of accounts payable, liabilities to banks and accrued expenses, apart from social security contributions and taxes. Other financial liabilities are measured at amortized cost.
Hedge accountingEffective from January 1, 2013, Doro applies hedge accounting for forward currency contracts. The hedging strategy conforms to an adopted finance policy in terms of purpose, amounts, maturities and currencies.
Changes in the value of forward exchange contracts classified as cash flow hedges are recognized in other comprehensive income. Hedge
accounting ceases when the underlying exposure enters the Balance Sheet (i.e. when purchases and sales occur). Accumulated results in the hedging reserve (which is in other comprehensive income) are then dissolved against cost of goods sold of forward exchange contracts relating to purchases, or against sales for forward exchange contracts relating to sales.
Forward exchange contracts linked to commercial flows not subject to hedge accounting are classified as “held for trading”. Value changes relating to such foreign exchange transactions have been recognized directly in sales for contracts relating to sales, and in the cost of goods sold for contracts relating to purchases. Hedge accounting is only used for forward contracts in EUR, USD, NOK and GBP and that relate to exposures that have not yet entered the Balance Sheet. Currency derivatives linked to liquidity management and loans are not subject to hedge accounting. They are classified as “held for trading”. Value changes relating to such foreign exchange transactions are recognized in net financial income/expense.
Impairment At least at every year-end at the close of accounts, an assessment is made as to whether there is any indication of impairment of the carrying amounts of the Group’s assets. When there is such an indication, the recoverable amount of the asset is measured. The recoverable amount is the greater of an asset’s net realizable value and its value in use. When establishing value in use, present value measurement is performed for estimated future payments that the asset is expected to generate during its useful life.
In present value measurement, an interest rate before tax is used for the purpose of the measurement that reflects the current market interest rate and the risk attributable to the asset. If the recoverable amount is less than the carrying amount, the asset is impaired to its recoverable amount.
Reversals of impairment are recognized if there are no grounds for such impairment, except for goodwill. Impairment and reversals of impairment are recognized in profit or loss.
At least once a year, an assessment of forecast future earnings and cash flow trends is made with regard to goodwill, capitalised expenditure for ongoing development projects and leasehold rights on premises. When the carrying amount exceeds the recoverable amount, it is impaired.
Depreciation of property, plant and equipment Depreciation according to plan is on a straight-line basis on the historical cost of the asset category and the estimated useful life:Tools for the manufacture of products are included in intangible assets, capitalized expenditure for development work. Equipment and tools 2–5 years
Amortization of intangible assetsIntangible assets are amortized over their estimated useful life. For capitalized product development, amortization commences as of market launch of the product in question. Amortization according to plan is on a straight-line basis on the historical cost of the asset category:Capitalized expenditure for development work 1–3 yearsTrademarks and brands 1–5 yearsCustomer register and distribution agreements 3–5 years
Leases Leases are classified in the Consolidated Accounts as either finance or operating leases. Finance leases exist when the financial risk and benefits associated with the ownership are essentially transferred to the lessee.
Finance leases mainly refer to the lease of alarm devices to public sector customers. Leases for company cars, photocopiers, computer equipment and similar are recognized as operating leases. Rent for premises is included in operating leases.
Inventory Inventories are measured at the lower of cost (in accordance with the first-in, first out principle—FIFO) and net realizable value (in accordance with the lowest value principle). Cost is calculated for each delivery.
Technological development is rapid and prices fall regularly. Impairment of inventory is recognized according to a model whereby older inventory gives greater impairment. Different product groups have varying rates of impairment. The net sales value is defined as the selling price less selling expenses. Impairment to the net realizable value includes impairment due to technological and commercial obsolescence made in the Group company in question.
Provisions Provisions are defined as liabilities that are uncertain in term of amounts or time of settlement. A provision is recognized when there is an undertaking ensuring from a transpired event, it is probable that an outflow of resources will be required in order to settle the undertaking and that the amount can be reliably estimated. Pensions, guarantee commitments, disputes and additional expenses are recognized as provisions in the Balance Sheet.
Warranties and repairs Provisions are made for estimated repair expenditure and losses of margins regarding goods that may be returned within the warranty period (between one and two years from the sale to the end user).
Note 1 ACCOUNTING PRINCIPLES, cont.
DORO ANNUAL REPORT 2017 NOTeS53

A statistical program has been developed that captures outcomes regarding the time at which products are sold until they are returned, the proportion that is repaired, scrapped, compensated for through product exchange of crediting as well as cost for checking, repairs (including parts) and transport. In the event of variances (mainly in the share of returned products), warranty provision requirements are changed. The total warranty reserve is classified as current liabilities as majority of guarantees falls within one year.
Tax All tax expected to be payable on reported profit is recognized in the Income Statement. Such taxes have been computed according to each country’s tax regulations and are recognized under the item tax on profit for the year.
The Group’s total tax in the Income Statement consists of current tax on taxable profits for the period, and deferred tax. Deferred tax mainly consists of changes in deferred tax assets with respect to loss carry-forwards and for tax purposes and other temporary differences.
The Group uses the balance sheet method for calculating deferred tax assets and liabilities. According to the balance sheet method, computation is based on tax rates on the closing date applied to temporary differences between an asset or liability’s value in terms of accounting and taxation, and loss carry-forwards for tax purposes. Deferred tax assets are recognized in the Balance Sheet only to the extent of value that can probably be utilized within the foreseeable future. An individual assessment is performed of the situation for companies in each country.
Cash flow statement Cash flow statements are prepared using the indirect method, which means that profit/loss after financial income/expense is adjusted for transactions that did not entail incoming and outgoing payments during the period, and for income and expenses relating to the cash flow of investment activities.
Cash and cash equivalents Cash and equivalents comprise cash, bank balances and current investments.
Share warrants On the sale of share warrants, the purchase consideration received is recognised as an increase in Other paid-up capital. On the repurchase of share warrants, the purchase consideration is recognised as a reduction in other paid-up capital.
Segment reporting (IFRS 8) Operating segments are reported in a manner consistent with the internal reporting presented to the chief operating decision maker of the Group. The chief operating decision maker is the function responsible for the allocation of resources and the assessment of the segments’ earnings. For Doro, this function has been identified as the CEO. For more information about Doro’s segment reporting, see Note 2.
Classification The balance sheet items entitled current assets and current liabilities are expected to be recovered or paid within a twelve-month period. All other balance sheet items are recovered or repaid later.
Critical accounting matters and uncertainty in estimates In their preparation of Doro’s Consolidated Accounts, the Board of Directors and the CEO, besides estimates made, have made a series of judgments regarding critical accounting matters that can significantly affect the amounts recognized. These relate to the following:
Goodwill measurement When testing carrying amounts of goodwill for impairment, assumptions are made about the future expected profit and cash flow trend for the lowest possible cash-generating unit. This is described in more detail in -Note 7.
Deferred tax related to loss carry-forwards When measuring deferred tax assets, an assessment of future surpluses for tax purposes of each company is made, and thereby of the ability to utilize the loss carry-forwards. The size of the loss carry-forwards is detailed in Note 17.
Credit risks in accounts receivable Individual assessments are made when evaluating credit risks in accounts receivable. The assessment is based on past payment capacity and other information. Doro has in the past had very low realized bad debt losses, but is active in follow-up. Refer to Note 23 for more information.
Measurement of inventory Measurement of inventory is based on an inventory turnover model. In addition, individual assessments are performed based on past sale statistics and sales forecasts compared with product volumes in inventory and in production with suppliers.
PARENT COMPANYImpairment of participation in Group companies and impairment reversalsParticipations in Group companies are measured at historical cost. If the recoverable amount (see section above entitled “impairment”) should prove to be lower, there is an impairment. Impairment of the value of participations in subsidiaries is reversed when there are no longer grounds for such impairment.
Financial instrumentsThe parent company applies fair value accounting for financial instruments in accordance with Annual Accounts Act Chap 4:14.
Note 1 ACCOUNTING PRINCIPLES, cont.
DORO ANNUAL REPORT 2017 NOTeS54

NOTE 2REVENUE PER SEGMENT AND INCOME TYPE AND OTHER REVENUE AND -EXPENSES
Group Parent Company
Net sales 2017 2016 2017 2016
Net sales of products 1,731.3 1,826.0 1,398.3 1,439.5
Net sales of services 192.7 133.1 133.5 0.0
Total 1,924.0 1,959.1 1,531.8 1,439.5
Group Parent Company
Other Revenue 2017 2016 2017 2016
Activated development costs 13.3 11.7 10.1 5.7
Recovered receivables 0.0 1.3 0.0 0.0
Gain on sale of fixed assets 0.1 0.1 0.1 0.0
Valutakursvinster 14.2 0.0 13.6 0.0
Others 6.8 2.9 0.3 0.0
Total 34.4 16.0 24.1 5.7
Other Expenses 2017 2016 2017 2016
Exchange rate differences 0.0 –12.0 0 –10.1
Total 0.0 –12.0 0.0 –10.1
Segment reporting (According to IFRS 8) Doro is recognized as a functional organization. The functional matrix structure provides a focused support for the organization and these services will be shared amongst the various products, geographical regions and distribution channels.
The regions are responsible for the regional sales and reports to the Vice President Sales. Doro's operations has been integrated as one reporting segment with a common strategy and common profit control as well as cost budget and investment budget.
The Doro business is one reporting segment and the financial information is analyzed and reviewed by the executive chief operating decision maker as one segment in the assessment of Doro's performance. The most important measure to control the business is EBIT.
The location of the customers in combinations with type of offerings to the customers forms the basis of sales by geographic region. No single customer amounts to more than 10% of Net sales. All significant tangible and intangible fixed assets are controlled by the Parent company in Sweden.
Total revenue per region 2017 2016
Nordic 332.6 353.1
Care 276.6 210.1
EMEA (Europe (other), Mid East and Africa) 437.0 461.4
DACH (Germany, Austria, Switzerland, Central Europe) 522.4 462.9
UK (Great Britain, Ireland) 239.9 266.4
USA and Canada 96.1 189.8
Rest of the world 22.6 18.9
Central overhead –3.2 –3.5
Total 1,924.0 1,959.1
whereof Sweden 384.0 401.2
NOTE 3INTRA GROUP TRANSACTIONS Of the Parent Company's invoicing SEK 179.5m (132.8) relates to subsidiaries. Invoicing from subsidiaries to the Parent Company amounted to SEK 157.7m (146.0). Invoicing between subsidiaries amounted to SEK 0m (58.9).
NOTE 4RENTAL AND LEASING AGREEMENTS
Operational leasing where the Group is lesseeCosts for operational rental and leasing charges during the year amount to SEK 18.8 m (18.3) for the group and SEK 9.2m (3.0) for the parent company. Agreed future rental and leasing costs fall due for payment as shown below.
The Group Parent Company
Operational leasing 2017 2016 2017 2016
Within 1 year 17.4 17.1 9.4 2.8
Within 2 to 5 years 40.7 23.6 25.5 3.5
Later than 5 years 14.5 0.0 13.9 0.0
Total 72.6 40.7 48.8 6.3
Financial leasing where the Group is lesseeCost for leasing of alarm devices from finance companies amounts to SEK 22.1m (26.5). Short-term financial lease liability amounts to SEK 2.4m (21.6) and long-term financial lease liability amounts to SEK 0.0m (2.4). No new lease agreents were signed during the year.
Leasing where the Group is lessorThe Group has both operational and financial lease out of alarm devices to customers in the public sector. The lease term is normally 12 to 24 months with an option of addtional 12 to 24 months. No provision for bad debts has been recorded as customers in the public sector are considered to be financially sound.
Agreed future leasing revenue are due as shown below.
Group Parent Company
Financial leasing 2017 2016 2017 2016
Within 1 year 6.4 23.6 6.4 23.6
Within 2 to 5 years 7.3 6.5 7.3 6.5
Later than 5 years 0.0 0.0 0.0 0.0
Total 13.7 30.1 13.7 30.1
NOTE 5EMPLOYEES AVERAGE NUMBER OF EMPLOYEES
Number 2017Of whom
men 2016Of whom
men
Parent Company 93 62 57 36
Other companies Sweden 114 37 137 60
Norway 71 49 68 38
United Kingdom 15 10 13 8
France 26 11 36 20
Hong Kong 9 7 9 7
Germany 51 36 52 38
Italy 2 2 1 1
Total 381 214 373 208
DORO ANNUAL REPORT 2017 NOTeS55

SALARIES AND REMUNERATIONSalaries, remuneration, social charges and pension cost have appeared with the following amounts:
The Group Parent Company
SEKm 2017 2016 2017 2016
Salaries and other remuneration 193.9 194.9 60.6 39.4
193.9 194.9 60.6 39.4
Payroll overheads excluding pension costs 56.3 55.5 22.0 12.8
56.3 55.5 22.0 12.8
Pension costs 18.9 16.0 11.4 7.1
of which premium-based 18.3 16.7 11.4 7.1
18.9 16.0 11.4 7.1
GENDER OF SENIOR MANAGERS
Number2017 total
Women %
2016 total
Women %
Board 5 40 6 33
Group Management 7 20 6 17
SALARIES AND REMUNERATION INCLUDING DIRECTORS' FEE
2017 2016
SEKmBoard
and CEOOther
employeesBoard
and CEOOther
employees
Sweden 4.9 90.2 6.0 88.8
Norway 0.0 35.1 0.0 27.5
United Kingdom 0.0 8.8 0.0 7.5
France 0.2 19.3 9.1 21.1
Germany 0.0 28.2 0.0 28.6
Hong Kong 0.0 5.5 0.0 5.3
Italy 0.0 3.0 0.0 2.3
Total 5.1 190.1 15.1 181.1
MANAGEMENT REMUNERATION (SEK 000)
The Board 2017 Fees Pension
Other remu-
neration Total
Chairman of the Board 450 0 0 450
Other Board members 900 0 0 900
Total 1,350 0 0 1,350
Vice chairman of the board Henri Österlund received SEK 300,000. Jonas Mårtensson, Karin Moberg and Lena Hofsberger each received SEK 200,000.
Senior Executives 2017 Salary
Bonus and
variable remu-
neration PensionOther
benefits Total
Robert Puskaric (CEO from 1 February 2017) 3,406 0 1,031 137 4,574
Jérôme Arnaud (CEO until 31 January 2017) 367 0 24 8 399
Other senior executives 7,353 255 2,570 297 10,475
Total 11,126 255 3,625 442 15,448
The above amounts include salaries and remunerations to employed senior executives. In 2017, the management team had seven members. In addition to salaries and remunerations to senior executives, consultancy fees of SEK 2,445,000 have been paid to interim senior executives.
The Board 2016 Fees Pension
Other remu-
neration Total
Chairman of the Board 400 0 0 400
Other Board members 871 0 0 871
Total 1,271 0 0 1,271
Bo Kastensson, who served as Chairman until the end of the AGM on 3 May 2016, received SEK 175,000. Magnus Mandersson, who was elected as Chairman by the AGM on 3 May 2016, and resigned on 17 October 2016, received SEK 216,000. Johan Andsjö, who was elected to the Board of Directors by the AGM on 3 May 2016, and was then elected as Chairman on 17 October 2016, received SEK 105,000. Charlotta Falvin, who resigned from the Board at the AGM on 3 May 2016, received SEK 75,000. Henri Österlund, Lena Hofsberger, Karin Moberg and Jonas Mårtensson each received SEK 175,000.
Senior Executives 2016 Salary
Bonus and
variable remu-
neration PensionOther
benefits Total
Jérôme Arnaud (CEO) 13,367 477 391 101 14,336
Other senior executives 8,508 2,695 681 11,884
Total 21,875 477 3,086 782 26,220
The above amounts include salaries, remuneration on and severance pay to employed senior executives. In 2016, the management team had seven members. The Chief Executive Officer’s salary of SEK 13.4m includes severance pay of SEK 9.0m.
PrinciplesFees are paid to the Chairman and other Board members in accordance with AGM resolution. Remuneration to the CEO and other senior executives comprises basic salary, variable remuneration, other benefits (mainly company cars) and pension premiums. The balance between basic salary and variable remuneration should be in proportion to the executive’s responsibilities and authorities. The average number of senior executives in the management team in 2017 was 7 (7).
PensionsThe retirement age of the CEO and other senior executives of the Group is 65 and pensions are usually paid in accordance with occupational pensions plan plus full provisioning for the full amount of salaries according to the ITP/ITPK plans (supplementary pensions for salaried employees). All pension benefits are irrevocable, i.e. not dependent on continued employment. The retirement age of the CEO is 65 years. No agreements have been signed concerning pension commitments or equivalent, apart from as stated regarding the periods of notice mentioned above, whether for Board members or senior executives. Pension schemes for senior executives are substantially defined contribution with premiums of SEK 3.6m 3.1) paid.
NoticeIf notice is served by the company or by the CEO himself, the period of notice is one year. The CEO is entitled to salary for 12 months during the period of notice. No severance pay will be paid if notice is served by CEO. Other senior executives are entitled to salary for notice periods of between two and twelve months.
Consultation and decision-making processes These procedures are explained in the Directors’ Report.
Note 5 EMPLOYEES, cont.
DORO ANNUAL REPORT 2017 NOTeS56

Share-based payment and options An Extraordinary General Meeting on 21 August 2014 resolved on a directed issue of new warrants to senior executives and key employees of the Doro Group. Each warrant gives the holder the right to buy one share to a predetermined price of SEK 42.00 in the period 22 May 2017 to 21 June 2017. The warrant price is calculated according to the Black & Scholes model, taking into consideration estimated dividend and the applied share price of SEK 31.10, volatility 30 percent, risk-free interest of 0.31 percent and dura on of 2.78 years (12 September 2014–21 June 2017). The CEO subscribed for 200,000 warrants and the rest of the Group management subscribed for 325,000 warrants. Doro Incentive subscribed for 141,000 warrants for potential future employees. A total of 841,000 warrants were issued.
In 2015, an additional 135,000 warrants were subscribed and 65,000 warrants were repurchased.
Another 65,000 warrants were subscribed in 2016, and 265,000 were repurchased.
In June 2017 the warrant program was closed after 517,000 warrants had been used to subscribe for 517,000 new shares.
NOTE 6INTEREST AND SIMILAR ITEMS
The Group Parent Company
Income 2017 2016 2017 2016
Interest income, external 0.3 0.2 0.0 0.1
Interest income, internal 0.0 0.0 5.4 5.1
Exchange rate gain 4.7 2.4 4.8 2.0
Other 0.2 0.0 0.0 0.0
Total 5.2 2.6 10.2 7.2
Expenses
Interest expenses, external –4.9 –5.8 –4.2 –5.2
Interest expenses, internal 0.0 0.0 –1.2 –0.6
Exchange rate losses 0.0 –4.8 0.0 –4.8
Other –0.6 –0.3 –2.4 –0.3
Total –5.5 –10.9 –7.8 –10.9
Financial net –0.3 –8.3 2.4 –3.7
NOTE 7INTANGIBLE FIXED ASSETS
Group/ Goodwill 2017 2016
Opening cost 372.1 348.6
Acquisitions during the year 0.0 16.8
Exchange rate difference 3.2 6.7
Closing accumulated cost 375.3 372.1
Group / Customer register and distribution agreements 2017 2016
Acquisition value brought forward 46.0 37.3
Acquisitions during the year 0.0 7.3
Exchange rate difference 0.2 1.4
Closing accumulated acquisition value 46.2 46.0
Write-downs brought forward –29.0 –21.0
Write-downs for the year –5.2 –7.2
Exchange rate difference –0.5 –0.8
Closing depreciation/write-downs –34.7 –29.0
Closing residual value according to plan 11.5 17.0
Parent company / Goodwill 2017 2016
Acquisition value brought forward 19.1 19.1
Acquisitions during the year 5.4 0.0
Merger of subsidiary 200.0 0.0
Closing accumulated acquisition value 224.5 19.1
Write-downs brought forward –19.1 –19.1
Write-downs for the year –6.7 0.0
Closing depreciation/write-downs –25.8 –19.1
Closing residual value according to plan 198.7 0.0
Parent company / Customer register 2017 2016
Acquisition value brought forward 14.8 14.8
Acquisitions during the year 8.1 0.0
Closing accumulated acquisition value 22.9 14.8
Write-downs brought forward –14.8 –14.0
Write-downs for the year –1.8 –0.8
Closing depreciation/write-downs –16.6 –14.8
Closing residual value according to plan 6.3 0.0
The Group assesses the need for goodwill to be written down on an annual basis or when indications of impairment arise. Impairment testing is applied at the lowest level where separable cash flows can be identified. Since all the Group companies' activities and their contributions are very much dependent on each other there is no breakdown of goodwill.
The recoverable value of the unit has been established based on the current value in use of future cash flows. Future cash flows are estimated on the basis of expected growth rate in accordance with established forecasts for the next five years. These forecasts are based on historical experience, but also takes expected future development into account. Assumptions regarding future growth and profitability are based on external and internal estimates of market growth, past performance and management’s assessment of market shares.The WACC discount factor, has been set using the Capital Asset Pricing Model (CAPM). As part of the WACC the risk free interest equivalent to the yield on 10-year government-bonds has been applied with the addition of stock market 's risk premium for small companies. The return requirement has been ascertained based on the optimum capital structure as derived from the capital market. Since the recoverable amount exceeds the carrying amount, no need for impairment is deemed to exist.
SENSITIVITY ANALYSIS Growth rate after 5 years: In the impairment test Doro used a sustainable growth rate of 2 percent (2). A change in the growth rate from 2 to 1 percent implies no impairment. Discount rate before tax increases by 1 percentage point: In the impairment test Doro used a WACC discount factor of 13.9% (13.6%) before tax. A change of the discount rate to 14.9% implies no impairment.
Note 5 EMPLOYEES, cont.
DORO ANNUAL REPORT 2017 NOTeS57

The Group / Brands, SEKm 2017 2016
Acquisition value brought forward 1.8 1.8
Acquisitions during the year 0.0 0.0
Exchange rate difference 0.1 0.0
Closing accumulated acquisition value 1.9 1.8
Depreciation according to plan brought forward –1.8 –1.6
Depreciation according to plan for the year –0.1 –0.2
Closing depreciation according to plan –1.9 –1.8
Closing residual value according to plan 0.0 0.0
Parent company/ Brands 2017 2016
Acquisition value brought forward 36.8 36.8
Acquisitions during the year 0.0 0.0
Closing accumulated acquisition value 36.8 36.8
Depreciation according to plan brought forward –36.8 –36.7
Depreciation according to plan for the year 0.0 –0.1
Closing depreciation according to plan –36.8 –36.8
Closing residual value according to plan 0.0 0.0
Group / Right to lease 2017 2016
Acquisition value brought forward 1.7 1.8
Exchange rate difference 0.1 –0.1
Closing accumulated cost 1.8 1.7
The Group’s capitalized expenditure for development work / IT, SEKm 2017 2016
Acquisition value brought forward 205.1 159.3
Acquisitions during the year 42.7 47.2
Acquisitions 0.0 0.0
Exchange rate difference 0.0 0.0
Sales/Disposals/Write-downs –2.8 –30.1
Reclassifications 16.2 28.7
Closing accumulated acquisition value 261.2 205.1
Depreciation according to plan brought forward –136.4 –103.8
Depreciation according to plan for the year –53.7 –46.3
Sales/Disposals/Write-downs 2.7 13.7
Reclassifications 0.0 0.0
Exchange rate difference 0.0 0.0
Closing depreciation according to plan –187.4 –136.4
Closing residual value according to plan 73.8 68.7
Ongoing capitalized expenditure for development work /IT, SEKm 2016
Opening balance 4.6 20.8
Reclassifications –16.2 –28.7
New expenditure 15.7 14.3
Cost accounted 0.0 –1.8
Closing balance 4.1 4.6
Total closing residual value 77.9 73.3
Parent company / Capitalized expenditure for development work / IT, SEKm 2017 2016
Acquisition value brought forward 184.9 148.4
Acquisitions during the year 42.7 42.1
Merger of subsidiary 23.2 0.0
Sales/Disposals/Write-downs –1.4 –26.0
Reclassifications 16.2 20.4
Closing accumulated acquisition value 265.6 184.9
Depreciation according to plan brought forward –141.3 –110.7
Depreciation according to plan for the year –53.5 –42.3
Merger of subsidiary –6.2 0.0
Sales/Disposals/Write-downs 1.4 11.7
Reclassifications 0.0 0.0
Closing depreciation according to plan –199.6 –141.3
Closing residual value according to plan 66.0 43.6
Ongoing capitalized expenditure for development work /IT, SEKm 2017 2016
Opening balance 8.4 20.4
Reclassifications –16.2 –20.4
Merger of subsidiary 4.0 0.0
New expenditure 15.7 10.2
Cost accounted 0.0 –1.8
Closing balance 11.9 8.4
Total closing residual value 77.9 52.0
Note 7 INTANGIBLE FIXED ASSETS, cont.
DORO ANNUAL REPORT 2017 NOTeS58

NOTE 8TANGIBLE FIXED ASSETS
The Group Parent Company
Equipment and tools, SEKm 2017 2016 2017 2016
Acquisition value brought forward 33.9 25.8 14.4 14.5
Acquisitions during the year 11.8 7.8 9.2 0.0
Merger of subsidiary 0.0 0.0 14.4 0.0
Acquisitions 0.0 2.2 0.0 0.0
Sales/Disposals –2.7 –2.3 0.0 –0.1
Reclassifications 0.0 0.0 0.0 0.0
Exchange rate difference –0.4 0.3 0.0 0.0
Closing acquisition value 42.6 33.9 38.0 14.4
Depreciation according to plan brought forward –20.9 –18.1 –13.6 –13.1
Depreciation according to plan for the year –5.3 –3.4 –3.1 –0.6
Merger of subsidiary 0.0 0.0 –7.3 0.0
Sales/Disposals 2.7 0.6 0.0 0.1
Reclassifications 0.0 0.0 0.0 0.0
Exchange rate difference –0.1 0.0 0.0 0.0
Closing depreciation according to plan –23.6 –20.9 –24.0 –13.6
Closing residual value according to plan 19.0 13.0 14.0 0.8
2017 2016
Opening balance 309.9 309.9
Acquisition 0.0 0.0
Merger of wholly-owned subsidiary –191.7 0.0
Closing balance 118.2 309.9
Subsidiary – Company reg. no Registered office
Doro AS – 934210719 Fredrikstad, Norway
Doro UK Ltd – 1180330 Chalfont St Peter, United Kingdom
Doro SAS – 309 662 195 Versailles, France
Doro Hong Kong Ltd – 08194263-000-12-98-6 Kowloon, Hongkong
Doro Inc. – 4706937 810 0 090679976 New York, USA
Doro Incentive AB – 556843-4962 Lund, Sweden
Doro Deutschland GmbH – HRB75859 Köln, Germany
IVS Industrievertretung Schweiger GmbH – HRB 2040 Amberg, Germany
Doro S.R.L – 08721340969 Milano, Italy
Aldebaran SAS – 504 770 116 Paris, France
Doro Care Trygghetsjour AB – 556569-9740 Malmö, Sweden
Doro Care Nordic AB – 556773-1301 Kalmar, Sweden
Doro Care Sales UK Limited – 7776454 London, United Kingdom
Doro Care GmbH – HRB 6783 Taunus, Germany
Doro Care AS – 986616500 Oslo, Norge
NOTE 9PARTICIPATION IN GROUP COMPANIES
Subsidiary No of.
shares %Book value
SEKm, 2017Book value
SEKm, 2016
Doro AS, Norway 200 100 0.6 0.6
Doro UK Ltd 3,013,400 100 4.2 4.2
Doro SAS 66,667 100 11.6 11.6
Doro Hong Kong Ltd 4,500 100 5.1 5.1
Doro Inc 3,000 100 0.0 0.0
Doro Incentive AB 50,000 100 0.1 0.1
Doro Deutschland GmbH 1 100 0.2 0.2
IVS Industrievertretung Schweiger GmbH1) 9,239 33.33 46.5 46.5
Doro S.R.L 1 100 0.1 0.1
Aldebaran SAS 275,000 100 5.2 5.2
Doro Care AB2) 0.0 236.3
Doro Care Trygghetsjour AB 2,500 100 11.3
Doro Care Nordic AB 1,000 100 0.1
Doro Care Sales UK Limited 1 100 0.0
Doro Care GmbH 1 100 2.0
Doro Care AS 242,294 100 31.3
Total 118.2 309.91) IVS industrievertretung Schweiger GmbH is included in the Group to 100%. Doro AB owns
33.33% and Doro Deutschland GmbH owns 66.67%.2) Doro Care AB was merged into Doro AB on 11th June 2017.
DORO ANNUAL REPORT 2017 NOTeS59

NOTE 10OTHER CURRENT RECEIVABLES AND PREPAID EXPENSES AND ACCRUED INCOME
The Group Parent Company
Other current receivables 2017 2016 2017 2016
VAT receivable 13.4 27.1 16.9 29.2
Cash Flow hedges 4.0 12.4 4.0 12.4
Financial lease receivables 6.5 23.7 2.4 0.0
Other current receivables 4.5 3.6 0.4 0.8
Total 28.4 66.8 23.7 42.4
Prepaid expenses and accrued income
The Group Parent Company
Rent 2016 2017 2016
Prepaid rent 1.0 4.8 0.7 0.5
Insurance premiums 0.9 1.0 0.2 0.0
Exhibition costs 1.3 1.6 1.3 1.6
IT costs 1.6 0.9 1.6 0.7
Licence costs 3.4 3.5 3.3 3.3
Installation expenses 6.8 12.9 6.8 0.0
Other prepaid expenses 4.8 4.7 5.8 1.3
Total 19.8 29.4 19.7 7.4
NOTE 11SHARE CAPITAL AND DIVIDENDS
No. of shares Voting rights Class
A shares 23,755,255 1 vote per share Normal
Share capital23,755,255 shares at a quota value of SEK 1.00 per share = SEK 23,755,255.
Share issue 2017In 2017 Doro issued 517,000 new shares in connection to the closing of a warrant program.
DividendsThe Board of Directors proposes no dividend for the 2017 financial year.
Warrant programAn extraordinary General Meeting was held in August 21, 2014, and descision was made on directed issue of new warrants to senior executives and key employees within the Doro group. Each warrant gives the holder the right to buy one share to a predetermined price of SEK 42.00 during May 22, 2017 until June 21, 2017. The warrant price is calculated according to the Black & Scholes model, taking into consideration estimated dividend and used share price of SEK 31.10, volatility 30%, riskfree interest 0.31% and duration of 2.78 year (2014-09-12–2017-06-21). The CEO subscribed for 200,000 warrants and the rest of the group management subcribed for 325,000 warrants. Doro Incentive subcribed for 141,000 warrants possible to be used for future employees. Totaly 841,000 warrants were issued. In 2015 an additional 135,000 warrants were subscribed and 65,000 warrants were re-purchased. In 2016 65,000 warrants were subscribed and 265,000 warrants were re-purchased. In June 2017 the warrant program was closed and 517,000 warrants were utilised to purchase 517,000 new shares.
NOTE 12OVERDRAFT FACILITIES
The Group Parent Company
SEKm 2017 2016 2017 2016
Approved credit 50.0 50.0 50.0 50.0
Utilized credit 0.0 0.0 0.0 0.0
NOTE 13ACCRUED EXPENSES AND PREPAID INCOME
The Group Parent Company
SEKm 2017 2016 2017 2016
Holiday pay liability 17.7 22.6 10.6 5.6
Payroll overheads 11.2 10.6 7.4 2.6
Other staff liabilities 7.3 11.7 2.0 0.0
Accrued royalty 35.3 29.3 30.9 29.3
Accrued customer bonus 56.3 37.8 36.7 24.2
Other accrued expenses 56.3 54.1 31.8 30.2
Total 184.1 166.1 119.4 91.9
DORO ANNUAL REPORT 2017 NOTeS60

NOTE 14PLEDGED ASSETS FOR LIABILITIES TO CREDIT INSTITUTIONS
The Group Parent Company
SEKm 2017 2016 2017 2016
Chattel mortgages 170.0 186.6 170.0 170.0
Shares in subsidiary 0.0 243.2 0.0 236.3
Total 170.0 429.8 170.0 406.3
NOTE 15CONTINGENT LIABILITIES
The Group Parent Company
2017 2016 2017 2016
Guarantees for subsidiary 0.0 0.0 0.0 0.0
Total 0.0 0.0 0.0 0.0
Doro AB has the ultimate responsibility for the obligations of its subsidiary, Doro UK Ltd. Doro UK Ltd acts as an agent for Doro AB in the UK and Ireland and has no external customer relations of its own.
NOTE 16AUDITORSThe 2017 AGM elected Magnus Willfors (PricewaterhouseCoopers AB) to be the auditor of the Parent Company, Doro AB. PwC will carry out auditing at all large units for the period of one year, except for Doro SAS for which EY has the audit assignment.
Fees and costs, SEKm
The Group Parent Company
2017 2016 2017 2016
PwC
Auditing assignments 1.1 0.0 0.7 0.0
of which PricewaterhouseCoopers AB 0.7 0.0 0.7 0.0
Auditing outside the assignment 0.0 0.0 0.0 0.0
of which PricewaterhouseCoopers AB 0.0 0.0 0.0 0.0
Tax assignments 0.0 0.0 0.0 0.0
of which PricewaterhouseCoopers AB 0.0 0.0 0.0 0.0
Other advisory services by auditors 0.1 0.0 0.1 0.0
of which PricewaterhouseCoopers AB 0.1 0.0 0.1 0.0
EY
Auditing assignments 0.5 2.0 0.0 0.8
Auditing outside the assignment 0.3 0.2 0.3 0.2
Tax assignments 0.8 0.4 0.7 0.4
Other advisory services by auditors 0.1 0.8 0.0 0.8
Total 2.9 3.4 1.8 2.2
NOTE 17TAXES
The Group Parent Company
Taxes on profit/loss for the year 2017 2016 2017 2016
Current tax –22.1 –7.8 –7.2 0.0
Deferred tax –3.1 –0.6 –5.9 –0.2
Total tax on profit/loss for the year –25.2 –8.4 –13.1 –0.2
Connection between the tax expense for the year and the reported earnings before tax:
The Group Parent Company
Taxes, SEKm 2017 2016 2017 2016
Reported profit/loss before tax 91.7 39.4 49.9 –1.3
Tax at current rate 22.0 % –20.2 –8.7 –11.0 0.3
Non-deductible expenses –0.2 –1.2 –2.1 –0.5
Non-taxable income 0.3 3.1 0.0 0.0
Utilisation of previously unrecognized tax loss carryforwards 0.0 0.0 0.0 0.0
Change in valuation in losses carryforwards 1.2 0.2 0.0 0.0
Change in valuation of temporary differences 0.0 0.0 0.0 0.0
Tax cost/revenue concerning previous year –3.6 3.1 0.0 0.0
Adjustment for tax rates in foreign Group company –2.7 –4.9 0.0 0.0
Reported tax –25.2 –8.4 –13.1 –0.2
DORO ANNUAL REPORT 2017 NOTeS61

Temporary differences arise in those cases where accounted values of assets or liabilities and their tax value are different. Temporary differences, unutilized losses carry forward and other future tax deductions have led to deferred tax liabilities and tax assets for the following:
The Group Parent Company
Deferred tax asset 2017 2016 2017 2016
Unutilized losses carry forward 5.9 7.2 0.0 0.2
Temporary differences, provisions 4.3 9.0 1.2 8.4
Temporary differences, other –0.7 –4.3 0.2 –0.5
Total reported deferred tax asset 9.5 11.9 1.4 8.1
Deferred tax assets are shown for unutilized losses carried forward and temporary differences in the balance sheet, when they are calculated to be used in the near future. A single calculation is made for each company with respect to past earnings trends, future plans and the option of using losses carried forward.
Of the consolidated losses carried forward, SEK 79 m (95) can be used without a time limit being imposed. The remaining losses are in the United Kingdom, France and Sweden.
Losses carry forward fall due as follows: 2017 2016
Without limit 79 95
Total 79 95
Non-accounted deferred tax assets in the balance sheet concerning unutilized taxable losses carry forward amount to:
The Group Parent Company
SEKm 2017 2016 2017 2016
14 15 0 0
Gross changes of deferred taxes
The Group Parent Company
2017 2016 2017 2016
Opening balance 11.9 15.6 8.1 9.4
Tax attributable to the income statement –3.1 –0.6 –5.9 –0.2
Tax attributable to other comprehensive income 0.7 –1.8 0.7 –1.1
Acquisitions/Mergers 0.0 –1.3 –1.5 0.0
Closing balance 9.5 11.9 1.4 8.1
NOTE 18ACQUISITIONS 2016On April 15, 2016, DORO AB acquired all shares of Trygghetssentralen AS in Norway. Costs for the acquisition of SEK 1.2m was charged to the operating result (Other external expenses) for the first half year. The purchase price was paid in cash with SEK 29.4m, whereof 8.8m referred to settlement of Trygghetssentralen's loans from its previous owner. In Q4 a final cash settlement of SEK 1.1m was paid. Goodwill is linked to the enhanced position in the Care area in Norway that Trygghetssentralen's sales channel provide, as well as increased expertise in the Care area. On the acquisition date, the headcount was 68 permanent employees and approximately 60 temporary employees. Trygghetssentralen has annual sales of NOK 68m. In 2016 the Trygghetssentralen business was integrated with Doro and consequently it is not possible to measure Net sales and EBIT for the acquired operations isolated.
The figures for the acquired net assets and goodwill are presented below
Fair value SEKm
Intangible assets 7.4
Tangible fixed assets 2.2
Deferred tax asset 0.5
Inventories 2.2
Accounts receivable 6.1
Other receivables, prepaid expenses and accrued income 2.0
Cash and bank 1.5
Accounts payable –1.2
Deferred tax liability –1.9
Other liabilites, accrued expenses and prepaid income –5.1
Acquired Net Assets 13.7
Goodwill 16.8
Total purchase consideration 30.5
Cash in company acquired –1.5
The acquisition's impact on the Group's cash flow 29.0
The Group
Company acquisition impact on Group cash flow 2017 2016
Trygghetssentralen AS 0.0 –29.0
0.0 –29.0
NOTE 19GOODS FOR RESALE
The Group, SEKm 2017 2016
Opening gross stock 233.6 201.8
Acquisition 0.0 2.2
Change in gross stock –18.8 23.2
Internal profit in stock –0.1 4.0
Exchange rate difference 2.0 2.4
Closing gross stock 216.7 233.6
Opening write-downs of stock –15.7 –13.3
Acquisition 0.0 0.0
Change in write-downs of stock –3.9 –2.2
Exchange rate difference –0.2 –0.2
Closing write-downs of stock1) –19.8 –15.7
Net stock in balance sheet 196.9 217.9
1) Acquisition value for the inventory that write-downs of stock of SEK 19.8m (15.7) relates to is based on inventory book value of SEK 54.2m (46.1).
Parent company, SEKm 2017 2016
Opening gross stock 141.3 129.8
Merger of subsidiary 21.4
Change in gross stock –10.5 11.5
Closing gross stock 152.2 141.3
Opening write-downs of stock –10.8 –9.0
Merger of subsidiary –1.3
Change in write-downs of stock –0.8 –1.8
Closing write-downs of stock1) –12.9 –10.8
Net stock in balance sheet 139.3 130.5
1) Acquisition value for the inventory reserve of SEK 12.9m (10.8) is based on inventory book value of SEK 53.9m (42.7).
Note 17 TAXES, cont.
DORO ANNUAL REPORT 2017 NOTeS62

NOTE 20PROVISION FOR GUARANTEES
The Group Parent Company
SEKm 2017 2016 2017 2016
Opening balance 58.1 54.3 49.9 48.0
Acquisition 0.0 0.0 0.0 0.0
Amount released –73.9 –75.1 –19.9 –65.8
New provisions 67.0 78.7 12.8 67.7
Exchange rate difference 0.3 0.2 0.0 0.0
Closing balance 51.5 58.1 42.8 49.9
NOTE 21PENSION ALLOCATIONS
The Group, SEKm 2017 2016
Opening balance 2.2 2.9
Amount released 0.0 –0.8
New provisions 0.4 0.0
Exchange rate difference 0.0 0.1
Closing balance 2.6 2.2
NOTE 22OTHER PROVISIONS
The Group Parent Company
SEKm 2017 2016 2017 2016
Opening balance 32.6 31.1 25.0 25.0
Amount released –34.0 –2.4 –26.4 0.0
New provisions 17.9 3.7 17.2 0.0
Unutilized amount cancelled 0.0 0.0 0.0 0.0
Reclassification 0.0 0.0 0.0 0.0
Exchange rate difference 0.1 0.2 0.0 0.0
Closing balance 16.6 32.6 15.8 25.0
The Group Parent Company
2017 2016 2017 2016
Additional royalty costs 15.8 29.1 15.8 25.0
Other provisions 0.8 3.5 0.0 0.0
Closing balance 16.6 32.6 15.8 25.0
Additional royalty costsAdditional royalty costs include costs that are known but that have not been debited at the time of invoicing and those that are unknown but expected at the time of invoicing. The provision for additional costs is charged against costs for goods sold to obtain correct allocation by period of the gross margin.
NOTE 23RISK MANAGEMENT AND FINANCIAL INSTRUMENTS Financial risk managementThe Board of Directors of Doro has adopted a treasury policy that regulates how financial risks are to be identified and managed. Risk Management aims to reduce or eliminate risks. The main objective is to achieve a financial low risk profile.
Doro AB (parent company) has the overall responsibility for the Group´s financial risk management including currency risk management, liquidity management and cash management. Centralisation and coordination enable substantial economies of scale with respect to the terms obtained for financial transactions and financing. The risk to which Doro is exposed are described below.
Credit and counterparty riskThe Group is primarily exposed to credit risk associated with commercial transactions with customers but also in financial transactions. The latter as counterparty risk associated with foreign exchange hedging and issuer risk in potential short-term investments. Credit and counterparty risks are managed centrally by the parent company Doro AB. Financial instruments may only be done with approved banks. Short-term investments may only be done with the counterparty categories government, municipalities and banks. In 2017 there there were no short-term investments carried out.
Accounts receivable amounted to SEK 360.4m (371.2) and leasing receivables amounted to SEK 13.7m (30.1). In recent years Doro has experienced low credit losses (less than 0.5 percent of sales) due to the fact that the main customer group is large business with regular trade. The single largest customer accounts for less than 10% of Group sales. In most countries Doro operates without credit insurance.
DORO ANNUAL REPORT 2017 NOTeS63

Group
Age analysis of accounts receivable 2017 2016
Not yet due 309.2 275.5
Due for payment < 60 days 51.4 96.5
Due for payment > 60 days 6.2 8.4
Total accounts receivable 366.8 380.4
Expected bad debt losses –6.4 –9.2
Accounts receivable in the financial state-ments 360.4 371.2
Group
Impaired accounts receivable 2017 2016
Opening balance –9.2 –4.6
Through Aquisitions 0.0 –0.4
Expected bad debt losses –3.5 –6.7
Confirmed bad debt losses 5.3 2.5
Translation differences 0.0 –0.1
Amount reversed 1.0 0.1
Closing balance –6.4 –9.2
Other receivablesOther receivables including financial lease receivables are not yet due.
Liquidity riskAt 31 December 2017, the Group had SEK 165.0 m (236.7) in interest-bearing liabilities, including finacial lease agreements for alarm devices within Doro Care, amounting to SEK2.4m (24.0). In April 2016 a new Revolving Facility Agreement was signed, amounting to SEK 310m. At 31 December 2017, the RCF was amortized to SEK 220m, whereof 160m was utilized.
At 31 December 2017, Group liquidity amounted to SEK 57.1 m (61.0). In addtion the Group also had an untilized bank overdraft facility of SEK 50m (50.0).
The overall objective is to meet the short-term financing need from Group operations, while minimizing surplus liquidity. Doro should have a liquidity reserve at minimum SEK 20.0m.
Foreign exchange riskDoro is exposed to foreign exchange risks caused by unfavourable exchange rate fluctuations that may affect sales, earnings and equity. Foreign exchange risk are described below, broken down into transaction exposure and translation exposure.
Transaction exposureTransaction exposure arises when sales and purchases take place in foreign currencies. Doro has income and expenses in different currencies. Goods are primarily purchased in USD, while sales are commonly in EUR, GBP and the Nordic currencies. In accordance with the treasury policy, forecast currency flows are hedged on a quarterly basis for periods for which the price list is set at between 70 to 90 percent. The hedge horizon can thus vary between three to six months. Foreign exchange management is centralised in Doro AB’s Finance department, which buys and sells currencies in accordance with the treasury policy. Since 2013, Doro has been applying hedge accounting in accordance with IFRS (see accounting principles for further information).
Transaction volumes Outstanding exposure (SEKm) 31 December 2017 and sensitivity analysis(Before and after hedging)
Beforehedging
2017
AfterHedging
2017
Sensitivity at 5%
weaker SEK
Beforehedging
2016
AfterHedging
2016
Sensitivity at 5%
weaker SEK
NOK 19.2 19.2 1.0 23.3 7.5 0.4
EUR 278.6 55.4 2.8 237 65.8 3.3
GBP 75.0 8.6 0.4 92.4 19.7 1
USD –305.4 –48.4 –2.4 –303.2 –87.6 –4.4
The table shows outstanding transaction exposure at year-end for the hedged period. The hedged period as per the end of December refers to flows through the end of May. The net market value for all outstanding currency futures amounts to SEK –4.1m at 31 December 2017, whereof SEK –1m refers to transaction exposures recognised as hedge.
Translation exposureTranslation exposure arises when foreign assets and liabilities, as well as the income statements of foreign subsidiaries, are translated into SEK upon consolidation. Doro does not hedge the translation exposure.
At year-end the value of foreign net assets was SEK 256m (184). The breakdown by currency is shown in the table below.
Value of foreign assets 2017 2016
USD 9 9
NOK 13 3
EUR 197 139
GBP 31 26
HKD 6 7
Total 256 184
Interest rate riskInterest rate risk is the risk that the Group’s net financial income/expense decreases due to rising market interest rates. Doro’s existing loan portfolio exclusively comprises loans with variable interest. In 2017, the average interest on borrowings was 2.2 percent. If SEK interest rates increased by one percentage point, Doro’s net financial income/expense would deteriorate by approximately SEK 1.5m, based on indebtedness as of 31 December 2017.
Term analysis for derivatives and financial liabilities as per 31 December 2017
Group, SEKm Currency0–3
months3 months
–1 year 1–3 years3 years
or more Total
Bank loan SEK 60.0 100.0 160.0
Overdraft facility SEK 0.0
Futures EUR 3.5 –0.4 3.1
Futures USD –2.8 1.1 –1.7
Futures GBP 2.7 0.1 2.8
Futures HKD 0.1 0.1
Leasing liability SEK 1.6 0.7 2.3
Accounts payable SEK 158.8 158.8
Total 163.9 61.5 100.0 – 325.4
Note 23 RISK MANAGEMENT AND FINANCIAL INSTRUMENTS, cont.
DORO ANNUAL REPORT 2017 NOTeS64

Note 23 Risk Management and Financial Instruments, cont.
Group 2017
Financial assets and
liabilities at fair value
through profit
Derivatives subject
to hedge accounting
Saleable assets
Accounts receivable and loans
receivable
Other financial liabilities
Carrying amount
Fair value
Accounts receivable 360.4 360.4 360.4
Leasing receivable 13.8 13.8 13.8
Other receivable 4.5 4.5 4.5
Foreign exchange derivatives subject to hedge accounting 4.0 4.0 4.0
Bank balances 57.1 57.1 57.1
Assets 0.0 4.0 0.0 435.8 0.0 439.8 439.8
Foreign exchange derivatives subject to hedge accounting 7.6 7.6 7.6
Liabilities to credit instituions 162.4 162.4 162.4
Accounts payable 158.8 158.8 158.8
Additional purchase consideration 0.5 0.5 0.5
Other liabilities 186.7 186.7 186.7
Liabilities 0.5 7.6 0.0 0.0 507.9 516.0 516.0
Group 2016
Accounts receivable 371.2 371.2 371.2
Other receivable 3.6 3.6 3.6
Foreign exchange derivatives subject to hedge accounting 12.1 12.1 12.1
Foreign exchange derivatives held for trading 0.3 0.3 0.3
Bank balances 61.0 61.0 61.0
Assets 0.3 12.1 0.0 435.8 0.0 448.2 448.2
Foreign exchange derivatives subject to hedge accounting 3.2 3.2 3.2
Liabilities to credit institutions 234.5 234.5 234.5
Accounts payable 254.9 254.9 254.9
Other liabilities 169.7 169.7 169.7
Liabilities 0.0 3.2 0.0 0.0 659.1 662.3 662.3
Parent Company 2017
Financial assets and
liabilities at fair value
through profit
Derivatives subject
to hedge accounting
Saleable assets
Accounts receivable and loans
receivable
Other financial liabilities
Carrying amount
Fair value
Accounts receivable 267.1 267.1 267.1
Receivables from Group companies 13.8 13.8 13.8
Other receivables 210.2 210.2 210.2
Foreign exchange derivatives subject to hedge accounting 0.4 0.4 0.4
Foreign exchange derivatives held for trading 4.0 4.0 4.0
Bank balances 41.5 41.5 41.5
Assets 0.0 4.0 0.0 533.0 0.0 537.0 537.0Foreign exchange derivatives subject to hedge accounting 7.6 7.6 7.6
Foreign exchange derivatives held for trading 0.5
Liabilities to credit institutions 160.0 160.0 160.0
Accounts payable 125.5 125.5 125.5
Accounts payable 228.2 228.2 228.2
Other liabilities 119.4 119.4 119.4
Liabilities 0.5 7.6 0.0 0.0 633.1 640.7 640.7
Parent Company 2017
Accounts receivable 266.7 266.7 266.7
Leasing receivable 0.0 0.0
Receivables from Group companies 253.6 253.6 253.6
Other receivables 0.7 0.7 0.7
Foreign exchange derivatives subject to hedge accounting 12.1 12.1 12.1
Foreign exchange derivatives held for trading 0.3 0.3 0.3
Bank balances 43.4 43.4 43.4
Assets 0.3 12.1 0.0 564.4 0.0 576.8 576.8
Foreign exchange derivatives subject to hedge accounting 3.2 3.2 3.2
Liabilities to credit institutions 210.0 210.0 210.0
Accounts payable 178.1 178.1 178.1
Receivables from Group companies 214.6 214.6 214.6
Other liabilities 91.9 91.9 91.9
Liabilities 0.0 3.2 0.0 0.0 694.6 697.8 697.8
FINANCIAL INSTRUMENTS – FAIR VALUE
The breakdown of fair value determination is performed at the following three levels:Level 1: According to quoted prices on an active market for the same instrument.Level 2: Based on directly or indirectly observable market data not included in Level 1.Level 3: Based on input date not observable on the market.Derivates at fair value in the table above have been valued according to Level 2.For other financial instruments, the carrying amount is a reasonable estimate of fair value.
DORO ANNUAL REPORT 2017 NOTeS65

NOTE 24LIABILITIES TO CREDIT INSTITUTE
The Group Parent Company
Long-term 2017 2016 2017 2016
Bank loans 100.0 159.8 100.0 160.0
Financial leasing liability 0.0 2.4 0.0 0.0
Total 100.0 162.2 100.0 160.0
Short-term
Bank loans 60.0 50.7 60.0 50.0
Financial leasing liability 2.4 21.6 2.4 0.0
Overdraft facilities 0.0 0.0 0.0 0.0
Factoring facilities 0.0 0.0 0.0 0.0
Total 62.4 72.3 62.4 50.0
Total liabilities to credit institutes 162.4 234.5 162.4 210.0
The bank loans accrue interest of 1.85 percent + STIBOR. Plan amortisation is on a semi-annual basis. All liabilities to credit institutions are denominated in Swedish kronor.
The Group Parent Company
Maturity dates of long-term liabilities 2017 2016 2017 2016
1–2 years 100.0 62.4 100.0 60.0
2–5 years 0.0 99.8 0.0 100.0
More than 5 years 0.0 0.0 0.0 0.0
Total 100.0 162.2 100.0 160.0
NOTE 25RELATED PARTY TRANSACTIONS Helmut Schweiger, owner of 2.9% of Doro, has at year-end a liability to Doro amounting to SEK 2.3 million (1.9) referring to tax expenses relating to the time before Doro acquired IVS GmbH from him. The parties have agreed that Helmut Schweiger pays the liability when the Group settles the corresponding liability towards the German tax authority. The liability was settled in March 2018.
No other related party transactions during the year, apart from salaries and remunerations in Note 5.
NOTE 27 NET DEBT CHANGES
Other assets Liabilities related to financing activities
Cash and bank/ bank
overdraft
Financial leases due
within 1 year
Financial leases due
after 1 year
Financial leases due
within 1 year
Financial leases due
after 1 year
Liabilities to credit institu-
tions due within 1 year
Liabilities to credit institu-
tions due after 1 year Total
Net Debt 31 December 2016 –61.0 –21.6 –2.4 21.6 2.4 50.7 159.8 149.5
Cash flow 3.9 21.6 –21.6 –50.5 –46.6
Exchange rate differences 0.0
Other items not in cash flow –2.4 2.4 59.8 –59.8 0.0
Net Debt 31 December 2017 –57.1 –2.4 0.0 0.0 2.4 60.0 100.0 102.9
NOTE 26 SIGNIFICANT EVENTS AFTER THE REPORTING DATE In February 2018 the company announced that Group management had been strengthened by the inclusion of Jörgen Alsing, vice president with responsibility for the new function SmartCare & Services. The new function strengthens Doro’s drive for safety services for seniors and their relatives. It was also announced that Annika Björk had been appointed new Human Resources Director and member of Group management.
DORO ANNUAL REPORT 2017 NOTeS66

NOTE 28 USE OF NON-INTERNATIONAL FINANCIAL REPORTING STANDARDS ("IFRS") MEASURESGuidelines on Alternative Performance Measures (APMs) for companies with securities listed on a regulated market within the European Union have been issued by ESMA (the European Securities and Markets Authority). These guidelines apply to APMs disclosed when publishing regulated information on or after July 3, 2016. Reference is made in the annual report to a number of non-IFRS performance measures that are used to help investors as well as management analyse the company's operations. Described below are the non-IFRS performance measures that are used as a complement to the financial information that is reported in accordance with IFRS.
Description of financial performance measures that are not used in IFRS
Non-IFRS performance measure Description Reason for use of the measure
Restructuring costs Costs for impairment together with personnel costs in connection with restructuring.
This measure shows the specific costs that have arisen in connec-tion with restructuring of a specific operation, which contributes to a better understanding of the underlying cost level in the continu-ing operations.
Gross Margin % Net Sales minus Merchandise costs in percentage of Net Sales. Gross Margin is an important measure for showing the margin before Personnel expenses and Other external expenses.
Sales growth comparable entities %
Net Sales for the period minus Net Sales for entities acquired dur-ing the year minus Net Sales for the corresponding period last year in percentage of Net Sales for the corresponding period last year.
Sales growth for comparable entities shows the Group's organic growth excluding acquired businesses.
Equity/assets ratio Equity expressed as a percentage of total assets. A traditional measure for showing financial risk, expressing the amount of restricted equity that is financed by the owners.
Return on average shareholders' equity
Profit/Loss rolling twelve months after financial items and tax divided by average shareholders' equity.
Shows from a shareholder perspective the return that is generated on the owners' capital that is invested in the company.
Capital employed Total assets reduced with non-interestbearing debt and cash and bank balances.
This measure shows the amount of total capital that is used in the operations and is thus one component for measuring the return from operations.
Return on average capital employed
Operating profit/loss rolling twelve months, divided by the quar-terly average capital employed excluding cash and bank balances.
This is the central ratio for measuring the return on the capital tied up in operations.
Recurring revenues Net Sales during the quarter from existing recurring agreements. The measure shows revenues during the quarter from recurring agreements.
Number of subscribers Number of subscribers connected to the alarm receiving center. The mearsure shows the volume of customers in the alarm receiving center.
Leverage ratio Interest bearing liabitlities divided by Equity. The mearsure shows the company's financial risk (interest rate sensitivity).
Dividend yield Dividend per share divided by the share price at year-end. Return measure on investment in the company's shares.
P/E ratio The share price at year-end divided by earnings per share for the year.
Measure on the value of the company's shares.
Capital turnover rate Net sales divided by the average total assets. The measure shows how much capital the operation requires.
Cash conversion rate % Cash flow from operating activities divided by EBIT. Measures the proportion of profit that are converted to cash flow.
Calculation of financial performance measures that are not defined in IFRS
2017 2016
Capital employed
Total assets 1,177.3 1,287.9
Non interest-bearing liabilities 428.6 533.5
Cash and bank 57.1 61.0
Reported Capital employed 691.6 693.4
Leverage ratio
Interest bearing liabilities 165.0 234.5
Equity 583.7 520.0
Reported leverage ratio 0.28 0.45
Capital turnover rate
Net sales 1,924.0 1,959.1
Average total assets 1,232.6 1,243.4
Reported capital turnover rate 1.6 1.6
DORO ANNUAL REPORT 2017 NOTeS67

BOARD SIGNING
The undersigned hereby pledge that the consolidated accounts and the annual report have been drawn up in accordance with the International Financial Reporting Standards (IFRS) as adopted by the EU and according to good accounting practices and give a true picture of the Group´s and company´s position and earnings,
and the consolidated directors´report and directors´report give a true overview of developments in the Group´s and company´s business, position and earnings and describes significant risks and uncertainty factors faced by Group companies.
Lund, March 28, 2018
Johan Andsjö
Chairman of the Board
Henri Österlund Lena Hofsberger Karin Moberg
Vice-Chairman of the Board Board member Board member
Jonas Mårtensson Robert Puskaric
Board member CEO
Our auditor´s report was submitted on March 28, 2018
PricewaterhouseCoopers AB
Magnus Willfors Johan Rönnbäck
Authorized Public AccountantAudito-in-charge
Authorized Public Accountant
DORO ANNUAL REPORT 2017 bOArD SiGNiNG68

AUDITOR’S REPORT To the general meeting of the shareholders of Doro AB (publ), corporate identity number 556161-9429
REPORT ON THE ANNUAL ACCOUNTS AND CONSOLIDATED ACCOUNTS
OpinionsWe have audited the annual accounts and consolidated accounts of Doro AB (publ) for the year 2017 except for the corporate governance statement on pages 37–39. The annual accounts and consolidated accounts of the company are included on pages 34–68 in this document.
In our opinion, the annual accounts have been prepared in accordance with the Annual Accounts Act and present fairly, in all material respects, the financial position of parent company as of 31 December 2017 and its financial performance and cash flow for the year then ended in accordance with the Annual Accounts Act. The consolidated accounts have been prepared in accordance with the Annual Accounts Act and present fairly, in all material respects, the financial position of the group as of 31 December 2017 and their financial performance and cash flow for the year then ended in accordance with International Financial Reporting Standards (IFRS), as adopted by the EU, and the Annual Accounts Act. Our opinions do not cover the corporate governance on pages 37–39. The statutory administration report is consistent with the other parts of the annual accounts and consolidated accounts.
We therefore recommend that the general meeting of shareholders adopts the income statement and balance sheet for the parent company and the group.
Our opinions in this report on the the annual accounts and consolidated accounts are consistent with the content of the additional report that has been submitted to the parent company's audit committee in accordance with the Audit Regulation (537/2014) Article 11.
Basis for OpinionsWe conducted our audit in accordance with International Standards on Auditing (ISA) and generally accepted auditing standards in Sweden. Our responsibilities under those standards are further described in the Auditor’s Responsibilities section. We are independent of the parent company and the group in accordance with professional ethics for accountants in Sweden and have otherwise fulfilled our ethical responsibilities in accordance with these requirements. This includes that, based on the best of our knowledge and belief, no prohibited services referred to in the Audit Regulation (537/2014) Article 5.1 have been provided to the audited company or, where applicable, its parent company or its controlled companies within the EU.
We believe that the audit evidence we have obtained is sufficient and appropriate to provide a basis for our opinions.
Other informationThe audit of the annual accounts and consolidated accounts for financial year 2016 was conducted by another auditor who have issued an unqualified opinion dated 3 April 2017 regarding the report on the annual accounts and consolidated accounts.
Our audit approachAudit scopeWe designed our audit by determining materiality and assessing the risks of material misstatement in the consolidated financial statements. In particular, we considered where management made subjective judgements; for example, in respect of significant accounting estimates that involved making assumptions and considering future events that are inherently uncertain. As in all of our audits, we also addressed the risk of management override of internal controls, including among other matters consideration
of whether there was evidence of bias that represented a risk of material misstatement due to fraud.
We tailored the scope of our audit in order to perform sufficient work to enable us to provide an opinion on the consolidated financial statements as a whole, taking into account the structure of the Group, the accounting processes and controls, and the industry in which the group operates.
MaterialityThe scope of our audit was influenced by our application of materiality. An audit is designed to obtain reasonable assurance whether the financial statements are free from material misstatement. Misstatements may arise due to fraud or error. They are considered material if individually or in aggregate, they could reasonably be expected to influence the economic decisions of users taken on the basis of the consolidated financial statements.
Based on our professional judgement, we determined certain quantitative thresholds for materiality, including the overall group materiality for the consolidated financial statements as a whole. These, together with qualitative considerations, helped us to determine the scope of our audit and the nature, timing and extent of our audit procedures and to evaluate the effect of misstatements, both individually and in aggregate on the financial statements as a whole.
Key audit mattersKey audit matters of the audit are those matters that, in our professional judgment, were of most significance in our audit of the annual accounts and consolidated accounts of the current period. These matters were addressed in the context of our audit of, and in forming our opinion thereon, the annual accounts and consolidated accounts as a whole, but we do not provide a separate opinion on these matters.
DORO ANNUAL REPORT 2017 AUDiTOr’S rePOrT69

Key audit matter How our audit addressed the Key audit matter
Valuation of intangible assetsRefer to note 1 and 7 in the annual report.The value of Goodwill with indefinite economic use amounted, as of 31 December 2017, to SEK 375.3m. In accordance with IFRS, management shall annually perform an impairment test.
No impairment requirement was identified in conjunction with the testing under-taken by management. In our audit, we have focused on the risk that Goodwill is reported at an incorrectly high level and that an impairment needs could exist.
Some of the assumptions and judgments undertaken by management regarding future cash flows and other circumstances are complex and have an impact on the calculation of the value in use. This applies, in particular, to the following: growth rate, profit margins and discount rate. Changes in these assumptions could lead to a change in the reported value of Goodwill.
Our audit activities include a review of the applied calculation model and the challenging of significant assumptions applied by management in their tests.
We have assessed the reasonableness of the budget presented by management, and which has been approved by the Board of Directors, by evaluating historical outcome against adopted budgets.
We have compared the country specific growth in perpetuity values with inde-pendent forecasts regarding economic growth and have noted that the assump-tions applied are within a reasonable interval; and
We have assessed the discount rate (weighted average cost of capital ("WACC")) against comparable operations and have noted that the assumptions applied are within a reasonable interval.
We have also evaluated the management’s assessment of the manner in which the group’s calculation models are impacted by changes in assumptions, and have compared this with the information presented in the annual accounts related to impairment testing.
In our audit, we have noted no significant deviations and our assessment is that the disclosures provided regarding significant assumptions and sensitivity analyses as found in the Annual report are correct.
Other Information than the annual accounts and consolidated accountsThis document also contains other information than the annual accounts and consolidated accounts and is found on pages 3–33 and 72–75. The Other Information does not include the annual report, except for the sustainability report and our report regarding this. The Board of Directors and the Managing Director are responsible for this other information.
Our opinion on the annual accounts and consolidated accounts does not cover this other information and we do not express any form of assurance conclusion regarding this other information.
In connection with our audit of the annual accounts and consolidated accounts, our responsibility is to read the information identified above and consider whether the information is materially inconsistent with the annual
accounts and consolidated accounts. In this procedure we also take into account our knowledge otherwise obtained in the audit and assess whether the information otherwise appears to be materially misstated.
If we, based on the work performed concerning this information, conclude that there is a material misstatement of this other information, we are required to report that fact. We have nothing to report in this regard.
Responsibilities of the Board of Directors and the Managing DirectorThe Board of Directors and the Managing Director are responsible for the preparation of the annual accounts and consolidated accounts and that they give a fair presentation in accordance with the Annual Accounts Act and, concerning the consolidated accounts, in accordance with IFRS as adopted by the EU. The Board of Directors and the Managing Director are
also responsible for such internal control as they determine is necessary to enable the preparation of annual accounts and consolidated accounts that are free from material misstatement, whether due to fraud or error.
In preparing the annual accounts and consolidated accounts, The Board of Directors and the Managing Director are responsible for the assessment of the company’s and the group’s ability to continue as a going concern. They disclose, as applicable, matters related to going concern and using the going concern basis of accounting. The going concern basis of accounting is however not applied if the Board of Directors and the Managing Director intends to liquidate the company, to cease operations, or has no realistic alternative but to do so.
Auditor’s responsibilityOur objectives are to obtain reasonable assurance about whether the annual accounts and consolidated accounts as a whole are free from material misstatement, whether due to fraud or error, and to issue an auditor’s report that includes our opinions. Reasonable assurance is a high level of assurance, but is not a guarantee that an audit conducted in accordance with ISAs and generally accepted auditing standards in Sweden will always detect a material misstatement when it exists. Misstatements can arise from fraud or error and are considered material if, individually or in the aggregate, they could reasonably be expected to influence the economic decisions of users taken on the basis of these annual accounts and consolidated accounts.
A further description of our responsibility for the audit of the annual accounts and consolidated accounts is available on Revisorsinspektionen’s website www.revisorsinspektionen.se/revisornsansvar. This description is part of the auditor´s report.
DORO ANNUAL REPORT 2017 AUDiTOr’S rePOrT70

REPORT ON OTHER LEGAL AND REGULATORY REQUIREMENTS
OpinionsIn addition to our audit of the annual accounts and consolidated accounts, we have also audited the administration of the Board of Directors and the Managing Director of Doro AB (publ) for the year 2017 and the proposed appropriations of the company’s profit or loss.
We recommend to the general meeting of shareholders that the profit be appropriated in accordance with the proposal in the statutory administration report and that the members of the Board of Directors and the Managing Director be discharged from liability for the financial year.
Basis for OpinionsWe conducted the audit in accordance with generally accepted auditing standards in Sweden. Our responsibilities under those standards are further described in the Auditor’s Responsibilities section. We are independent of the parent company and the group in accordance with professional ethics for accountants in Sweden and have otherwise fulfilled our ethical responsibilities in accordance with these requirements.
We believe that the audit evidence we have obtained is sufficient and appropriate to provide a basis for our opinions.
Responsibilities of the Board of Directors and the Managing DirectorThe Board of Directors is responsible for the proposal for appropriations of the company’s profit or loss. At the proposal of a dividend, this includes an assessment of whether the dividend is justifiable considering the requirements which the company's and the group’s type of operations, size and risks place on the size of the parent company's and the group’s equity, consolidation requirements, liquidity and position in general.
The Board of Directors is responsible for the company’s organization and the administration of the company’s affairs. This includes among other things continuous assessment of the company’s and the group’s financial
situation and ensuring that the company's organization is designed so that the accounting, management of assets and the company’s financial affairs otherwise are controlled in a reassuring manner. The Managing Director shall manage the ongoing administration according to the Board of Directors’ guidelines and instructions and among other matters take measures that are necessary to fulfill the company’s accounting in accordance with law and handle the management of assets in a reassuring manner.
Auditor’s responsibilityOur objective concerning the audit of the administration, and thereby our opinion about discharge from liability, is to obtain audit evidence to assess with a reasonable degree of assurance whether any member of the Board of Directors or the Managing Director in any material respect:• has undertaken any action or been guilty of any omission which can give
rise to liability to the company, or• in any other way has acted in contravention of the Companies Act, the
Annual Accounts Act or the Articles of Association.
Our objective concerning the audit of the proposed appropriations of the company’s profit or loss, and thereby our opinion about this, is to assess with reasonable degree of assurance whether the proposal is in accordance with the Companies Act.
Reasonable assurance is a high level of assurance, but is not a guarantee that an audit conducted in accordance with generally accepted auditing standards in Sweden will always detect actions or omissions that can give rise to liability to the company, or that the proposed appropriations of the company’s profit or loss are not in accordance with the Companies Act.
A further description of our responsibility for the audit of the administration is available on Revisorsinspektionen’s website: www.revisorsinspektionen.se/revisornsansvar. This description is part of the auditor´s report.
The auditor’s examination of the corporate governance statementThe Board of Directors is responsible for that the corporate governance statement on pages 37–39 has been prepared in accordance with the Annual Accounts Act.
Our examination of the corporate governance statement is conducted in accordance with FAR’s auditing standard RevU 16 The auditor’s examination of the corporate governance statement. This means that our examination of the corporate governance statement is different and substantially less in scope than an audit conducted in accordance with International Standards on Auditing and generally accepted auditing standards in Sweden. We believe that the examination has provided us with sufficient basis for our opinions.
A corporate governance statement has been prepared. Disclosures in accordance with chapter 6 section 6 the second paragraph points 2–6 of the Annual Accounts Act and chapter 7 section 31 the second paragraph the same law are consistent with the other parts of the annual accounts and consolidated accounts and are in accordance with the Annual Accounts Act.
PricewaterhouseCoopers AB, box 4009, 203 11 Malmö, was appointed auditor of Doro AB (publ) by the general meeting of the shareholders on the 27 April 2017 and has been the company’s auditor since the 27 April 2017.
Malmö, 28 March, 2018 PricewaterhouseCoopers AB
Magnus Willfors Johan Rönnbäck Authorized Public Accountant Authorized Public Accountant Auditor in charge
DORO ANNUAL REPORT 2017 AUDiTOr’S rePOrT71

2017 2016
SEKm Q 1 Q 2 Q 3 Q 4 Q 1 Q 2 Q 3 Q 4
QUARTERLY PROFIT TREND
Net sales 452 446 465 560 413 474 473 599
Capitalised product development/other income 5 2 2 2 3 8 1 5
Operating costs –426 –414 –429 –509 –394 –461 –441 –560
Operating profit/loss before depreciation 31 34 38 53 22 21 33 45
Planned depreciation and write-downs –14 –15 –16 –19 –13 –17 –19 –25
Operating profit/loss after depreciation 17 19 22 34 9 4 14 20
Net financial items 0 0 0 –1 –1 –3 0 –4
Profit/loss after financial items 18 19 21 33 8 1 14 16
Taxes –5 –4 –6 –10 –2 0 –1 –5
Net profit/loss 13 15 16 23 6 1 13 11
QUARTERLY BALANCE SHEET FOR THE GROUP
Intangible assets 464 463 464 466 445 469 473 464
Property, plant and equipment 15 17 18 19 8 10 10 13
Financial assets 7 7 7 8 13 12 8 7
Deferred Tax Asset 13 12 12 10 18 18 21 12
Inventories 232 279 259 197 231 212 240 218
Current receivables 363 378 383 420 378 426 429 513
Cash and bank balances 36 58 64 57 51 34 23 61
Total assets 1,129 1,213 1,207 1,177 1,143 1,180 1,204 1,288
Shareholders' equity 531 541 557 584 486 496 511 520
Long -term liabilities 150 165 165 119 218 239 192 201
Current liabilities 448 507 485 474 439 445 501 567
Total shareholders' equity and liabilities 1,129 1,213 1,207 1,177 1,143 1,180 1,204 1,288
2017 2016
SEKm Q 1 Q 2 Q 3 Q 4 Q 1 Q 2 Q 3 Q 4
QUARTERLY CASH FLOW
Operating profit 31 34 38 53 22 21 33 45
Other non-cash items 4 5 –1 –4 11 –5 –2 –5
Taxes –7 –4 –1 2 –9 –10 –8 0
Change in working capital 14 –21 –11 –12 –57 1 14 10
Cash flow from operating activities 42 14 25 39 –33 7 37 50
Investments –16 –15 –18 –21 –14 –45 –18 –20
Cash flow from investing activities –16 –15 –18 –21 –14 –45 –18 –20
Dividend warrant program premium 0 –23 0 0 0 0 0 0
New share issue and warrant program premium –1 21 0 0 0 0 0 0
Change in interest-bearing liabilities –50 25 0 –25 53 20 –31 8
Cash flow from financing activities –51 23 0 –25 53 20 –31 8
Translation differences and other 0 0 0 0 0 1 1 0
Cash flow (change in cash and cash equivalents) –25 22 7 –7 7 –17 –11 39
QUARTERLY OVERVIEW
DORO ANNUAL REPORT 2017 QUArTerLy OVerVieW72

SEKm 2017 2016 2015 2014 2013
INCOME STATEMENT
Net sales 1,924.0 1,959.1 1,838.0 1,276.2 1,142.5
Operating profit/loss before depreciation and write-downs, EBITDA 156.2 121.5 139.2 122.6 113.7
Operating profit/loss after depreciation and write-downs, EBIT 92.0 47.7 95.2 79.7 78.9
Net financial items –0.3 –8.3 –10.8 –0.4 –0.7
Profit/loss after financial items 91.7 39.4 84.4 79.3 78.2
BALANCE SHEET
Fixed assets 502.8 496.2 481.4 222.3 227.8
Current assets 617.4 730.7 673.8 552.2 397.2
Cash and bank balances 57.1 61.0 43.9 78.2 123.9
Shareholders’ equity 583.7 520.0 482.0 334.8 287.0
Long-term liabilities 119.2 197.1 170.3 59.6 138.3
Current liabilities 474.4 570.8 546.6 458.3 323.6
Balance sheet total 1,177.3 1,287.9 1,198.9 852.7 748.9
KEY FIGURES (Definitions on page 74)
RETURN RATIOS
Average return on capital employed, % 13.5 7.5 17.2 32.8 52.2
Average return on shareholders’ equity, % 12.1 6.2 15.6 18.7 24.4
Cash conversion rate, SEK 130 129 90 26 140
SEKm 2017 2016 2015 2014 2013
MARGINS
Operating margin, EBITDA, % 8.1 6.2 7.6 9.6 10.0
Operating margin, EBIT, % 4.8 2.4 5.2 6.2 6.9
Net margin, % 4.8 2.0 4.6 6.2 6.8
CAPITAL TURNOVER
Capital turnover rate (multiple) 1.6 1.6 1.8 1.6 1.8
FINANCIAL DATA
Equity/assets ratio, % 49.6 40.4 40.2 39.3 38.3
Cash flow from operating activities 119.5 61.7 85.7 22.5 110.5
Number of employees 458.0 500.0 358.0 172.0 149.0
Cash and cash equivalents (incl. unused credit) 107.1 111.0 89.8 86.7 123.9
Investments (incl. acquisitions) 70.2 96.4 220.7 51.2 146.7
FIVE-YEAR OVERVIEW
DORO ANNUAL REPORT 2017 FiVe yeAr OVerVieW73

DEFINITIONS
AVERAGE NUMBER OF SHARESNumber of shares at the end of the month divided by the number of months.
AVERAGE NUMBER OF SHARES, DILUTEDAverage number of shares adjusted for the dilution effect from warrants is calculated as the difference between the assumed number of shares issued at the redemption price and the assumed number of shares issued at the average share price for the period.
CAPITAL EMPLOYEDTotal assets less non-interest-bearing liabilities and cash and cash equivalents.
CAPITAL TURNOVER RATENet sales for the year divided by the average balance sheet total.
CASH CONVERSION RATECash flow from operating activities divided by EBIT.
CASH FLOWCash flow from operating activities.
CASH FLOW PER SHARECash flow from operating activities divided by the average number of shares.
EARNINGS PER SHARE AFTER TAXProfit/loss after tax divided by the average number of shares for the period.
EARNINGS PER SHARE AFTER TAX, DILUTEDProfit/loss after financial items divided by the average number of shares for the period, after dilution.
EBIT MARGINOperating profit/loss (after depreciation/amortisation) as a percentage of sales for the year.
EBITDA MARGINProfit/loss before depreciation/amortisation as a percentage of sales for the year.
EQUITY PER SHAREShareholders’ equity at the end of the period divided by the number of shares at the end of the period.
EQUITY PER SHARE, DILUTEDShareholders’ equity at the end of the period divided by the number of shares at the end of the period, after dilution.
EQUITY/ASSETS RATIOShareholders’ equity as a percentage of the balance sheet total.
INTEREST COVERAGE RATIOProfit/loss after net financial items plus interest expenses divided by financial expenses.
MARKET CAPITALISATION, SEKMShare price at the end of the period multiplied by the number of shares at the end of the period.
NET DEBT/EQUITY RATIOInterest-bearing liabilities minus cash position as a percentage of shareholders’ equity.
NET MARGINProfit/loss after financial items as a percentage of sales for the year.
NUMBER OF SHARES AT END OF PERIODNumber of shares at the close of the period.
NUMBER OF SHARES AT END OF PERIOD, DILUTEDThe number of shares at the end of the period adjusted for the dilution effect from warrants is calculated as the difference between the assumed number of shares issued at the redemption price and the assumed number of shares issued at the average share price at the end of the period.
REPORTED EQUITY PER SHAREShareholders’ equity divided by the number of shares at year-end.
RETURN ON AVERAGE CAPITAL EMPLOYEDOperating profit/loss divided by the quarterly average capital employed excluding cash and bank balances.
RETURN ON AVERAGE SHAREHOLDERS’ EQUITYProfit/loss after financial items and tax divided by average shareholders’ equity.
SHARE PRICE AT PERIOD END, SEKClosing price at the end of the period.
DORO ANNUAL REPORT 2017 DeFiNiTiONS74

PRESS RELEASES 2017
14-Nov Doro updates on strategies and financial targets
31-Oct Invitation to Doro's Capital Markets Day 2017
24-Oct Doro AB's nomination committee for the 2018 Annual General Meeting
24-Oct Interim report for January-September 2017
10-Oct Doro to present its interim report for July–September 2017 via audiocast and telephone conference
4-Oct Doro strengthens Group management with new VP Operations
11-Sep Magnus Eriksson to leave Doro
5-Sep Changes in Doro's Group management
13-Jul Interim report January-June 2017
3-Jul Change in number of outstanding shares in Doro
28-Jun Doro to present its interim report for April–June 2017 via audiocast and telephone conference
22-May Excercise of Employee Warrants in Doro
27-Apr Press release from Doro AB's (publ) annual general meeting 2017
27-Apr Interim report January–March 2017
7-Apr Doro to present its interim report January–March 2017 via audiocast and telephone conference
5-Apr Annual report 2016
28-Mar Notice of annual general meeting 2017
17-Feb Year-end report 2016
3-Feb Doro to present its Year-end report 2016 via audiocast and telephone conference
4-Jan Doro's CEO Jérome Arnaud has sold shares
DORO ANNUAL REPORT 2017 PreSS reLeASeS 201775