ageing in the community: thomond parish cluster
DESCRIPTION
Ageing in the Community: Thomond Parish Cluster. Main findings of the social study. Background. Demographic trends … ageing population … By 2036, 20%, 65 years and over (11% at present) Increase in “oldest old” (80 years and older) Differences in health - PowerPoint PPT PresentationTRANSCRIPT

Ageing in the Community: Thomond Parish Cluster
Main findings of the social study
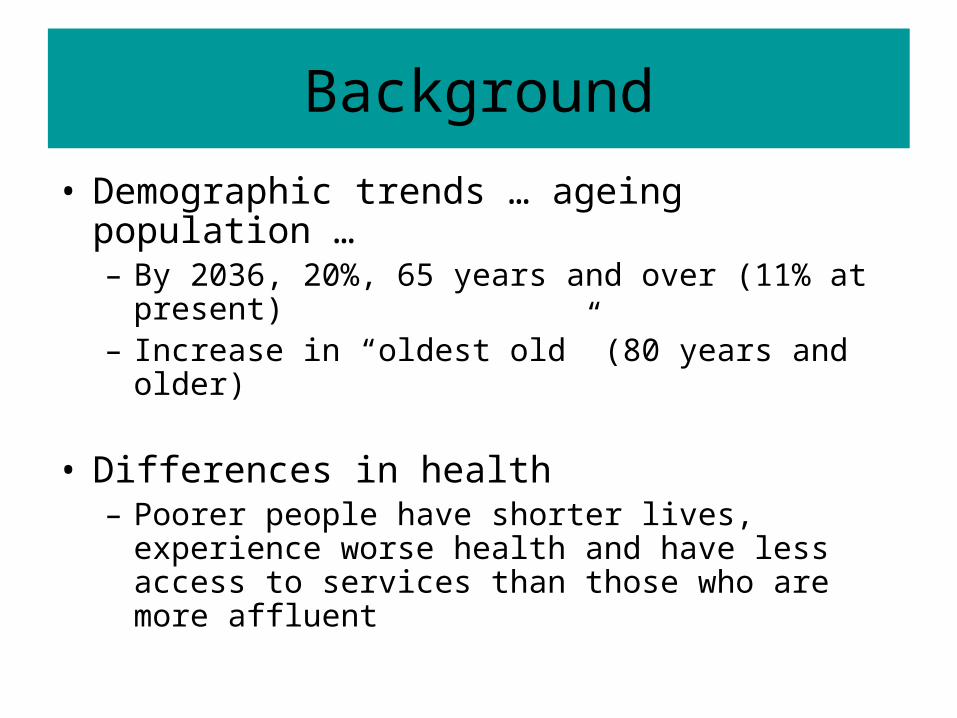
Background
• Demographic trends … ageing population … – By 2036, 20%, 65 years and over (11% at present)– Increase in “oldest old” (80 years and older)
• Differences in health – Poorer people have shorter lives, experience worse
health and have less access to services than those who are more affluent

What factors affect health?
• Age, gender, education, income …• Neighbourhoods …(parishes)
– Accessible essential services– Community / social facilities and services– Problems …
• Quality of care & health services.. – GPs, hospital, Public Health Nurses
• Sense of community• Friends and family … contact and support

What the research involved
• The Four Parishes• Snap-shot of the
position in 2007• Collecting data
– Population 65 years and over resident
– Data to describe the parishes (the 2006 Census)
• Social survey • Health screening
– St. Camillus’s Hospital • Sampling
– OL Rosary and St. Munchin’s (larger older population)
– Total coverage in Christ the King and Corpus Christi

Numbers, sample size & response rates
Male Female TotalResponde
nt No.Sample
size (%)
Corpus C* 58 27 47
Christ the K 132 156 288 146 51
OL Rosary 492 668 1160 218 19
St. Munch's 422 585 1007 151 15
Corpus Christi - estimate


Population: Parishes & Thomond Cluster
Parish 2002 2006
Number % of total Number % of total
Corpus Christi 4020 18.3 3674 17.5
Christ the King 3702 16.9 3865 18.4
Our Lady of the Rosary 6136 28.0 5617 26.7
St. Munchin's 8081 36.8 7863 37.4
Thomond Cluster 21939 100.0 21019 100.0


Age profile in older age groupings, 2006 (by parish)
0
10
20
30
40
50
Christ the K OL of the R St. Munchin's Corpus Christi
parish
% o
f pop
ulat
ion
% 50+
% 65+

Essential services very easy or fairly easy to get to by parish
0102030405060708090
100
Services
% o
f p
op
ula
tio
n
Chris t the K
Holy R
St. Munchins
Corpus Ch
Range: +2 very easy, -2 very difficult


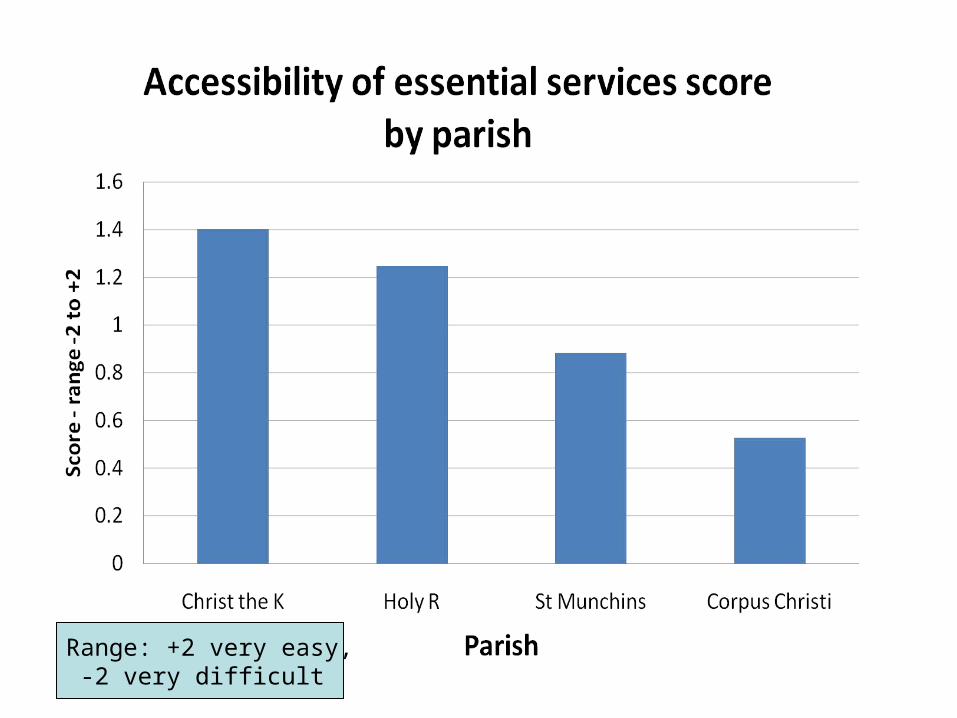
Ac c es s ibility of c ommunity / s oc ial fac ililities s c ore by paris h
0
0.5
1
1.5
C hris t the K Holy R S t Munc hins C orpus C hris ti
P a rish
Scor
e - ra
nge -
2 to
+2
Range: +2 very easy, -2 very difficult

Attendanc e at relig ious s ervic es weekly or more often by paris h
020406080
100
C hris t the K Holy R os ary S t. Munc hin's C orpus C hris ti
P a rish
% o
f pop
ulati
on
Not stat. significant by gender
Stat. sig by age, p=0.05

P ray at leas t daily, by paris h
70
75
80
85
90
C hris t the K Holy R os ary S t. Munc hin's C orpus C hris ti
P a rish
% of
popu
lation
Association with gender, statistically significant p=0.000

Main form of trans port by paris h
020406080
100
C hris t the K Holy R os ary S t.Munc hin's
C orpusC hris ti
P a rish
% o
f pop
ulati
on
C ar
P ublic T
Walking / c yc ling

% s tating public trans port is g ood by paris h
020406080
100
C hris t the K Holy R os ary S t. Munc hin's C orpus C hris ti
P a rish
% of
popu
lation

Types / extent of neighbourhood problems by parish
00.5
11.5
22.5
33.5
4
Problems
Scor
es - r
ange
0 to
4
Christ the King
Holy Rosary
St. Munchin's
Corpus Christi
Range: 0=not at all a problem4=a very big problem

Concentration of neighbourhood problems, by parish (average score)
0
0.5
1
1.5
2
Christ the King Holy Rosary St. Munchin's Corpus Christi
Parish
Aver
age s
core
- ran
ge 0-
4
Range: 0=not at all a problem4= a very big problem

Neighbourhood: good or very good place to live, by parish
020406080
100120
Christ the K Holy Rosary St. Munchin's Corpus Christi
Parish
% of
popu
lation

S ens e of belong ing to c ommunity by paris h
0
20
40
60
80
100
C hris t the K Holy R os ary S t. Munc hin's C orpus C hris ti
P a rish
% o
f pop
ulati
on

Involved in voluntary org anis ations , by paris h
0
20
40
60
80
C hris t the K Holy R os ary S t. Munc hin's C orpus C hris ti
P a rish
% o
f pop
ulati
on

Extent of knowing and trusting people in the neighbourhood by parish
0
20
40
60
80
100
Christ the K Holy Rosary St.Munchin's
CorpusChristi
Parish
% o
f pop
ulati
on
Know most
Trust most

Institutional trust scores - various institutions - by parish
-1
-0.5
0
0.5
1
1.5
2
Institutions
Sco
re -
ran
ge -
2 t
o +
2
Christ the K
Holy Rosary
St. Munchin's
CorpusChristi
Range: +2=trust completely-2=not at all

Institutional trust score by parish
0
0.2
0.4
0.6
0.8
1
Christ the K Holy Rosary St. Munchin's Corpus Christi
Parish
Scor
e - r
ange
-2 to
+2
Range: +2=trust completely-2=not at all

Social networks & interaction
• Networks of family, friends & people to turn to in crisis:– Christ the King (Caherdavin), largest average size &
Corpus Christi (Moyross), smallest– No friends and no-one to turn to
• 12% no friends, 1% no-one to turn to St. Munchin’s• 19% no friends & 3% no-one to turn to Corpus Christi
– In touch by meeting & telephone contact (least in Corpus Christi)
• Age affects regularity of interaction

S elf-rated health, by paris h
0
10
20
30
40
50
E xc ellent V good G ood F air P oor
R a ting
% o
f pop
ulati
on C hris t the K
Holy R os ary
S t. Munc hin's
C orpus C hris ti
Age … not statisticallySignificant in oldest age

Average number of GP visits per annum by self-rated health
0
2
4
6
8
10
12
excellent very good good fair poor
Self-rated health
Ann
ual n
umbe
r of
vis
its
(av)
All: 5.34; CthK=5.86; HR=4.64;St.M=5.93; CC=4.85

Health services utilisation
0
10
20
30
40
50
60
HopsIn-
patient
HospOut-
patient
A&E Rehabclinic
Respite Daycentre
PublicH N
HomeHelp
Health services
% o
f p
op
ula
tio
n
Relationship to parish

Health services utilisation: Evidence factors of association
• Health status .. – People in poor health use services to a greater extent
• Parish (social class)– Average annual GP visits – social pattern…– Home help (gradient) – social pattern..– Public health nursing (almost statistically significant)
• Age (increasing)– Hosp. inpatient (Cramer’s V=0.203, p<0.001)– Respite, (Cramer’s V=0.213, p<0.001)– Day centre, (Cramer’s V=0.356, p<0.001)– PHN (Cramer’s V=0.230, p<0.001)– Home help (Cramer’s V=0.329, p<0.001)

Findings
• Age and gender … physical health … – Men better physical health
• Differences by social class & place (parish)– Oldest old (resilient survivors) … many don’t survive
• “Better” neighbourhoods, better services etc. but– OL Rosary .. poor community-based services– Access to essential services .. Better physical health
• Social networks, trust, participation in voluntary associations .. Follow the social pattern– Regular meeting with friends… physical health
• Age, health, social class .. health services utilisation– Community-based services … low level of provision and higher
take-up disadvantaged• Older population … differences … but a lot in common

Recommendations
• Heavier health services utilisation .. .making up for accumulated disadvantages ..
• Conditions of neighbourhood .. good essential services
• Safe and accessible meeting places …
• Maintain contact with friends
• Contact across the social divide
• Engagement .. building up trust
• Trust in institutions