agency costs, mispricing, and ownership structure files/10-094.pdf · agency costs, mispricing, and...
TRANSCRIPT

Copyright © 2010 by Sergey Chernenko, C. Fritz Foley, and Robin Greenwood
Working papers are in draft form. This working paper is distributed for purposes of comment and discussion only. It may not be reproduced without permission of the copyright holder. Copies of working papers are available from the author.
Agency Costs, Mispricing, and Ownership Structure Sergey Chernenko C. Fritz Foley Robin Greenwood
Working Paper
10-094

NBER WORKING PAPER SERIES
AGENCY COSTS, MISPRICING, AND OWNERSHIP STRUCTURE
Sergey ChernenkoC. Fritz Foley
Robin Greenwood
Working Paper 15910http://www.nber.org/papers/w15910
NATIONAL BUREAU OF ECONOMIC RESEARCH1050 Massachusetts Avenue
Cambridge, MA 02138April 2010
We thank Malcolm Baker, Mihir Desai, Masako Egawa, Alp Ercil, Yasushi Hamao, Sam Hanson,Naoki Kamiyama, David Matsa, David Scharfstein, Andrei Shleifer, Jeremy Stein, Kenji Wada, LucyWhite, and seminar participants at Georgetown, Harvard, IESE, the NBER, and Washington Universityin St. Louis for helpful comments. We also thank Jim Quinn and Sonya Lai for research assistanceand Masako Egawa, Alp Ercil, Lydia Petersen, Naoki Kamiyama, Daiwa Institute of Research Ltd.,Toyo Keizai Inc., and the Sandra Ann Moreilli Pacific-Basin Capital Markets Research Center forhelp assembling data. The Division of Research at Harvard Business School provided generous funding.The views expressed herein are those of the authors and do not necessarily reflect the views of theNational Bureau of Economic Research.
© 2010 by Sergey Chernenko, C. Fritz Foley, and Robin Greenwood. All rights reserved. Short sectionsof text, not to exceed two paragraphs, may be quoted without explicit permission provided that fullcredit, including © notice, is given to the source.

Agency Costs, Mispricing, and Ownership StructureSergey Chernenko, C. Fritz Foley, and Robin GreenwoodNBER Working Paper No. 15910April 2010JEL No. G14,G3,G32,K22
ABSTRACT
Standard theories of corporate ownership assume that because markets are efficient, insiders ultimatelybear agency costs and therefore have a strong incentive to minimize conflicts of interest with outsideinvestors. We show that if equity is overvalued, however, mispricing offsets agency costs and caninduce a controlling shareholder to list equity. Higher valuations support listings associated with greateragency costs. We test the predictions that follow from this idea on a sample of publicly listed corporatesubsidiaries in Japan. When there is greater scope for expropriation by the parent firm, minority shareholdersfare poorly after listing. Parent firms often repurchase subsidiaries at large discounts to valuationsat the time of listing and experience positive abnormal returns when repurchases are announced.
Sergey ChernenkoHarvard Business SchoolBaker Library 220ASoldiers FieldBoston, MA [email protected]
C. Fritz FoleyHarvard Business SchoolSoldiers FieldBoston, MA 02163and [email protected]
Robin GreenwoodHarvard Business SchoolBaker Library 267Soldiers FieldBoston, MA 02163and [email protected]
1
I. Introduction
A large literature in finance and economics suggests that corporate ownership and capital
structure decisions reflect attempts to mitigate agency problems between various stakeholders. A
common idea is that corporate ownership is set to maximize firm value, accounting for potential
conflicts of interest between a controlling shareholder and minority investors. Following Jensen
and Meckling (1976), this literature assumes that markets are efficient, which means that
minority investors anticipate and price the full extent of agency problems and more generally
form unbiased estimates of the cash flows they will receive. One implication is that, because
minority investors require a fair return on their capital, controlling shareholders ultimately bear
all agency costs that they create. The greater is the opportunity for the controlling shareholder to
take advantage of minority investors, the more expensive it is for him to raise outside capital.
Under what circumstances then do firms access capital markets when the potential for agency
costs is high? The prevailing view, summarized by Shleifer and Wolfenzon (2002) and Morck,
Wolfenzon, and Yeung (2005), is that controlling shareholders sell shares to outsiders only when
internal capital is inadequate to fund attractive investment opportunities.1
This paper proposes a new explanation – based on stock market mispricing – for why
firms with a controlling shareholder raise outside equity, even when they cannot commit not to
expropriate minority shareholders. Our main idea is that the controlling shareholder takes
advantage of stock market mispricing to offset the burden of agency costs. To the extent that
agency costs are deadweight instead of distributional transfers, mispricing facilitates the creation
of inefficient ownership structures.
1 See Almeida and Wolfenzon (2006) for a theoretical treatment of this motivation. Other motives to sell equity to outsiders in the presence of agency costs might include a risk-averse controlling shareholder’s desire to diversify, benefits from learning the market value of certain operations (Perotti and Rossetto (2007)), and gains from the political power that can accompany control of a large business group (Morck, Wolfenzon, and Yeung (2005)).
2
While the role of market efficiency in corporate finance has attracted considerable
research attention, the interaction of stock market mispricing with agency problems is not well
understood.2 To motivate our empirical work, we present a simple extension of the standard
agency model of Jensen and Meckling (1976) that allows for mispricing. This extension
generates some basic predictions about the interaction of agency costs, ownership structure, and
stock market mispricing. We test these predictions empirically on a sample of subsidiary listings
in Japan.
We model a controlling shareholder who considers selling equity in a part of his
operations. This shareholder can divert resources from the operations for his own private benefit,
but in doing so he bears costs that depend on investor protection and his ability to conceal
diversion. If markets are efficient, outsiders anticipate diversion and price the equity claims
accordingly. Absent other considerations, the controlling shareholder chooses to retain full
ownership – otherwise he would bear the agency costs without receiving any benefits. The
outcome is quite different if there is mispricing. In this case, the controlling shareholder trades
off the benefit of selling overvalued equity against the agency costs he would incur after listing.
The greater is the mispricing, the more the controlling shareholder wants to sell, and thus the
more severe are the subsequent agency problems.
For evidence to support these ideas, we analyze a sample of 431 publicly listed
subsidiaries in Japan in which the original corporate owner retains effective control after listing.
This empirical setting has a number of advantages. Capital markets are well developed in Japan,
but minority shareholder rights are weak, especially when it comes to policing self-dealing
2 For example, in Graham and Harvey’s (2001) survey of Chief Financial Officers (CFOs), managers claim to try to time the market when deciding to issue equity. And, Ritter (1991) and Loughran and Ritter (1995), among others, document low average returns following initial public offerings (IPOs) and seasoned equity offerings (SEOs), suggesting that managers’ attempts to time the market are successful.

3
transactions. By retaining effective control of their subsidiaries after listing, parent firms
therefore leave open the possibility of taking advantage of minority shareholders. An additional
advantage of this setting is that parent firms in our sample do not appear to be financially
constrained, lending more credence to explanations related to stock market mispricing.
Foley, Greenwood, and Quinn (2008) provide a case study of one of these listings, NEC
Electronics (NECE), the semiconductor subsidiary of Japanese electronics conglomerate NEC.
Following its listing in 2003, NECE incurred excessively high capital expenditures and research
and development expenses to develop microchips used in NEC’s phones and charged its parent
low transfer prices. NECE’s stock underperformed relative to the market and to the parent firm.
The performance of NECE is representative: parent firms list subsidiaries when market and
industry valuations are high, and over the following two years, average cumulative subsidiary
returns are -8.74%, while average cumulative parent returns are 2.64%.
Although Foley, Greenwood, and Quinn (2008) present specific evidence of agency
problems at NECE, more generally diversion and agency costs are difficult to observe directly.
Therefore, our large sample tests are based on predictions concerning the relation between the
characteristics of listed firms and their subsequent performance. Our first prediction is that
subsidiaries in which the controlling shareholder sells a larger share of equity should have lower
stock market returns than other firms following their listing. Burkart, Gromb, and Panunzi (1998)
and La Porta, Lopez-de-Silanes, Shleifer, and Vishny (2002) explain that the incentive to divert
resources from minority shareholders is particularly strong when a large shareholder retains
effective control but limited cash flow rights. Equity must be particularly overvalued to induce
the controlling shareholder to incur the large agency costs. This prediction holds in our data–

4
subsidiaries in which the parent firm maintains a minority ownership stake that exceeds 20%
underperform significantly post listing.
Our second prediction exploits cross-sectional variation in the ex-ante scope for agency
problems. Listings with greater ex-ante scope for agency problems should occur when equity is
more overvalued. In these instances, the controlling shareholder can be expected to divert more
resources from minority shareholders, and thus requires higher ex-ante valuations to offset the
costs of diversion. In our data we identify subsidiaries which have a sales relationship with the
parent firm as being particularly prone to agency problems. Because transfer pricing regulations
in Japan are weak, parent firms can use transfer pricing to divert resources from subsidiaries.
Over two years after listing, these subsidiaries earn monthly risk-adjusted returns of -71 basis
points.
Our last prediction relates to the actions of the parent company after mispricing has
reverted. Since agency costs—such as the costs of covering up diversion—are likely to be
recurring, once mispricing has reverted, the parent company has a strong incentive to repurchase
its listed subsidiaries and thereby eliminate the agency costs. In our data, approximately a quarter
of the subsidiaries listed during the sample period are repurchased by their parent firms, and
typically at a significant discount to the valuations at the time of listing. The median buy-and-
hold return earned by a stockholder of a repurchased subsidiary from the beginning of the month
following listing to the repurchase date is -41.5%. When repurchases are announced, both the
acquiring parent and the target subsidiary experience positive abnormal returns. Acquiring parent
returns average about 18% of the market capitalization of repurchased subsidiaries, suggesting
that parent firms capture many of the gains from eliminating ownership structures that are prone
to agency problems. In summary, stock market mispricing facilitates the creation of ownership

5
structures prone to agency problems, and these structures are often dismantled once prices
correct.
In our discussion so far, we have been silent on the source of stock market mispricing. An
interesting possibility to consider is that the mispricing itself comes from investors
underestimating the full extent of agency problems. Such an interpretation would be consistent
with previous evidence that investors sometimes overlook agency problems. Cain, Loewenstein,
and Moore (2005), for example, show that decision makers tend to ignore conflicts of interest,
even when such conflicts are prominently disclosed. And Perkins, Morck, and Yeung (2008)
show that joint ventures between Brazilian telecommunications firms and foreign partners are
more likely to fail if the foreign partners are from countries with few business groups –
suggesting that these partners underestimate the agency problems from dealing with firms that
are part of business groups. Malmendier and Shanthikumar (2007) suggest that retail investors
are naïve regarding incentives.3
Our findings are related to an extensive literature documenting expropriation of minority
shareholders in different countries. Bertrand, Mehta, and Mullainathan (2002) find evidence of
tunneling within Indian business group structures, while Bae, Kang, and Kim (2002) and Baek,
Kang, and Lee (2006) illustrate how group relationships allow insiders to use mergers and
acquisitions as well as security issuance to benefit controlling shareholders. Claessens, Djankov,
Fan, and Lang (2002) and La Porta, Lopez-de-Silanes, Shleifer, and Vishny (2002) show that
corporate valuations are lower when minority shareholder protection is weaker. These papers do
not, however, analyze returns following listing or test whether agency problems are fully
3 Regulators often express concern that investors will not be able to understand conflicts of interest, even if there is disclosure. Consider for example the recent decision of the Securities and Futures Commission of Hong Kong to allow shares of United Company RUSAL to be listed on the Hong Kong Stock Exchange. The regulator prevented retail investors from participating, despite the risks being prominently disclosed in a thousand-page prospectus.

6
anticipated and priced at the time of listing. Our findings are also related to research on equity
carveouts, recently surveyed by Eckbo and Thorburn (2008).4 Also related is Atanasov, Boone,
and Haushalter (forthcoming), who consider the possibility that parent firms in the U.S. behave
opportunistically toward their publicly listed subsidiaries and show that such subsidiaries trade at
a discount relative to their peers.
The next section develops our main predictions. Section III provides a brief background
on the protection of minority shareholders under Japanese law, while section IV describes our
data. Section V analyzes the valuations and performance of subsidiary listings. Section VI looks
at what happens to the ownership of subsidiaries following their listing. Section VII concludes.
II. Stock market mispricing and ownership structure
We draw our main predictions from a simple extension of the standard agency model in
which a controlling shareholder decides to sell a fraction of the equity claims on some assets to
dispersed outside investors. We draw on Jensen and Meckling (1976), La Porta, Lopez-de-
Silanes, Shleifer, and Vishny (2002) and Shleifer and Wolfenzon (2002) who explore optimal
ownership structure in settings where there is scope for expropriation of minority shareholders
post listing. We introduce the possibility that equity is misvalued and explore the interaction of
agency costs, ownership structure, and stock market mispricing. For starkness, we consider a
firm that does not face financial constraints.
4 In explaining carveouts, researchers have considered hypotheses related to increases in corporate focus (Vijh (2002)), obtaining financing (Schipper and Smith (1986)), addressing information asymmetries (Nanda (1991) and Slovin and Shuska (1997)), and beginning the process of firm restructuring (Klein, Rosenfeld, and Beranek (1991) and Perotti and Rossetto (2007)).

7
Basic setup
There are two periods. At time 0, a controlling shareholder owns all equity in a firm that
will generate $1 of cash flow in period 1. The controlling shareholder considers selling fraction
α of firm equity to dispersed outside investors. The firm generates gross cash flow of $1
irrespective of whether the controlling shareholder raises external capital.
Once the equity has been listed, an agency problem arises – the controlling shareholder
prefers to divert cash flow to himself instead of receiving only his pro rata share. Such diversion
can potentially take many forms including transfer pricing, inefficient perk consumption, and
outright stealing. Diverting fraction θ of cash flow, however, costs the controlling shareholder
( ) 2C kθ θ= . These costs include the cost of covering up diversion and the probability of being
caught and the associated punishment.5 Following much of the literature (e.g., Shleifer and
Wolfenzon (2002)), we assume that diversion costs are convex in θ , reflecting the fact that
cover up becomes increasingly costly and the probability of being caught increases as more
diversion takes place. Parameter k can be thought of as a measure of shareholder protection or
as the inverse of the ex-ante scope for agency problems. When k is low, shareholder protection
is weak, or more generally, it is easier for the controlling shareholder to divert resources, and
there is more scope for agency problems.
The timing of the decisions is as follows. In period 0, the controlling shareholder chooses
fraction α of the firm to sell to the public at price P per share. In period 1, the firm produces $1
of cash flow, the controlling shareholder diverts fraction θ of this cash flow, and the remaining
1 θ− dollars of cash flow are distributed pro rata. 5 It makes no difference whether the controlling shareholder bears these costs or shares them with the minority investors. In equilibrium, he must bear them anyway.

8
In period 1, the controlling shareholder diverts θ to maximize
( )( ) 2|max 1 1 .kθ α α θ θ θ− − + − (1)
The first term is his pro rata share of the post-diversion cash flow, the second term is the amount
diverted, and the last term is the cost of diversion. Differentiating yields the solution
,2kαθ =
(2)
which reflects the standard intuition that the lower is the controlling shareholder’s share of cash
flow rights, ( )1 α− , the stronger is his incentive to divert. When diversion is costly or difficult
(i.e., when k is high) the incentive to divert is weak.
When the controlling shareholder decides how much equity to sell in period 0, he
maximizes total proceeds, taking into account both the direct proceeds from selling equity at the
IPO and the benefits of diversion
( )( ) 2max 1 1
. . .2
k P
s tk
α α θ θ θ ααθ
− − + − +
=
(3)
In the standard rational expectations framework, the price of equity would be set to
reflect the level of diversion, i.e., P = 1 - θ. We allow stock prices to be misvalued by an error
term ε
1P θ ε= − + (4)
We do not take a stand on where the mispricing comes from or what specific errors or biases
cause investors to misvalue the firm. For our purpose it does not matter. In principle, ε could

9
represent mispricing at the market level, broad investor sentiment for a particular industry or
type of firm, or it could signify investors’ willingness to overlook agency concerns.6
Substituting (2) and (4) into (3) and differentiating yields
2kα ε= (5)
Intuitively, the controlling shareholder trades off the benefit of selling overvalued equity against
the agency costs. If shareholder protection is strong, or k is high, very little overvaluation is
required to motivate the controlling shareholder to sell shares. With little scope for agency
problems, the controlling shareholder can take advantage of the mispricing by selling a large
fraction of his firm; doing so does not generate high levels of diversion or agency costs. When k
is low, on the other hand, agency costs are an important deterrent to selling equity.
What is the net benefit from selling overvalued shares? Simple algebra shows that by
selling 2kα ε= shares to outside investors, the controlling shareholder gets 2kε more than if he
did not sell any shares at all and retained full control. We can also see that, in equilibrium,
diversion θ equals mispricing ε . Intuitively, by offsetting the agency costs, mispricing creates
scope for expropriation. And the more diversion that is expected to take place, the higher is the
mispricing required to induce the controlling shareholder to list.
Assuming that prices ultimately revert to the rational expectations level 1P θ= − , post
listing percentage returns realized by minority investors are simply 1 11 1
θ εθ ε θ ε− −
− =− + − +
.
6 Our approach is similar to an increasing number of papers in corporate finance that take stock market mispricing as given and use it to derive consequences for corporate behavior. See Stein (1996) and Shleifer and Vishny (2003) for examples. Like these papers, our focus is on the consequences of mispricing. We do note, however, that mispricing seems sustainable by virtue of subsidiaries’ low market capitalizations and low float. Low float is correlated with short sales constraints in U.S. data, as indicated in D’Avolio (2002).

10
The implications of mispricing for overall welfare hinge on the nature of the agency costs
C(θ). A natural assumption is that costs are deadweight, incurred as the controlling shareholder
takes actions to cover up the resource diversion. Inefficiencies would also arise if agency costs
distorted investment or R&D decisions. If the costs are deadweight, the socially optimal level of
equity sold to minority shareholders is zero, and positive mispricing promotes an inefficient
ownership structure. A less realistic assumption is that agency costs do not generate
inefficiencies, in which case our model has only distributional consequences.7 Irrespective,
mispricing would support listings that are prone to agency problems.
Testable predictions
One empirical challenge in the agency literature is the difficulty of observing diversion
directly. However, it is possible to observe when controlling shareholders do decide to list, the
characteristics of listed firms, and stock returns following listing, which we use as a proxy for ex
ante mispricing. Our empirical predictions relate to these features of our data.
Our first prediction is that listings in which the controlling shareholder sells a large
fraction of shares α should occur when equity valuations are high and should experience poor
post-listing returns. This reflects the fact that mispricing must be large to sustain the costs of
diversion, itself motivated by the separation between cash flow and control rights of the
controlling shareholder. We test this prediction by analyzing subsidiaries in which the parent’s
ownership stake after listing is between 20% and 50%.
7 Even if we are to interpret agency costs as a fine to the government that is subsequently distributed to shareholders, as in Shleifer and Wolfenzon (2002), administering the fines is costly, as is monitoring and detection of malfeasance. Once detected, the company may incur deadweight legal costs disputing the fine. Last, such fines must be administered through an inefficient court system (Shleifer 2010).

11
Our second prediction is that listings for which the ex-ante scope for agency problems is
high, or those for which k is low, should also occur when equity valuations are high and should
experience poor equity returns after listing. In our setting, we identify such listings as
subsidiaries which have a sales relationship with their parent firm. The parameter k should be
lower for these kinds of listings relative to others because transfer pricing provides a means of
diverting resources that is relatively easy to cover up, especially given the weak nature of
transfer pricing regulations in Japan. When these kinds of subsidiaries are listed, controlling
shareholders divert more resources, and therefore more mispricing is required to induce the
controlling shareholder to list in the first place.
Our third prediction concerns the aftermath of selling overpriced equity. With a bit of
liberty, we can consider a simple dynamic extension of the model in which controlling
shareholders divert resources on an ongoing basis and bear recurring costs associated with
diversion. If mispricing reverts, the controlling shareholder has an incentive to repurchase listed
shares and eliminate the agency costs. More broadly, the controlling shareholder enjoys only a
one-time benefit from mispricing but bears the costs of diversion forever. Thus, in our data we
would expect to see parent companies attempt to repurchase subsidiaries, and to do so at discount
to the valuation at listing, thus reflecting the initial overvaluation. Furthermore, because minority
shareholders are in a weak bargaining position when repurchases take place, controlling
shareholders may capture most of the benefits of eliminating agency costs and may avoid having
to share gains in the form of high takeover premia. This is particularly true in Japan, where
minority squeeze out regulations provide little protection to minority shareholders. To the extent
that the controlling shareholder is able to capture the benefits of the eliminated agency costs, he
should experience positive returns when repurchases are announced.

12
III. Rights of minority shareholders in publicly listed subsidiaries in Japan
The discussion above assumes that minority shareholders may be expropriated by the
majority owner. While this assumption is commonplace in the law and finance literature, here we
discuss its applicability to subsidiary listings in Japan. We follow discussions of Japanese
corporate law by Nishiyama (2007) and Kamiyama (2008) as well as Tokyo Stock Exchange’s
listing guidelines, and where possible, we contrast Japanese law with the U.S. benchmark.
Courts in most countries prohibit outright theft from minority shareholders, but beyond
obvious cases of stealing, there is substantial variation in what is permitted. Johnson, La Porta,
Lopez-de-Silanes, and Shleifer (2000) explain that two common legal principles applied by
courts are the duty of care and the duty of loyalty. The duty of care requires directors to act in a
reasonable, prudent, and rational way, and as such does not offer much protection to minority
shareholders. The duty of loyalty, or fiduciary duty, addresses conflicts of interest specifically.
In the U.S., directors are endowed with both the duty of care and the duty of loyalty and
therefore have fiduciary duties to the company and its shareholders. In Japan, directors have a
duty of care, but the judiciary has avoided detailing or enforcing regulations that restrict breaches
of fiduciary duty. Directors must obey the company’s organizational documents and must act in
good faith but are not required to act in the interest of minority shareholders.
Controlling shareholders in the U.S. also have both the duty of care and the duty of
loyalty; controlling shareholders in Japan have neither. In Japan, minority shareholders’ only
protection from undue pressure by a controlling shareholder comes from the board of directors.
In practice, however, directors of subsidiary firms do not have much incentive to protect the
interests of minority shareholders; many directors are former or current executives of the parent
company. Regulators at the Tokyo Stock Exchange have expressed concern about this situation,

13
remarking that “relationships between parent companies and minority shareholders of the
subsidiary entail potential conflicts of interest, and there is a risk that the subsidiary conducts its
business for the benefit of the parent to the detriment of the interest of overall shareholders”
(TSE-Listed Companies White Paper of Corporate Governance 2007).
The broad guidelines of the law have particularly significant implications for minority
shareholders of subsidiaries with regard to three issues: (a) related-party transactions, (b) usurped
business opportunities, and (c) minority squeeze outs.
Related-party transactions. Related-party transactions must be disclosed and are subject to
audit, but parent and subsidiary companies often share auditors, and there is no burden of proof
with respect to fairness. This is in contrast to the U.S., where all transactions between a
controlling shareholder and the company are subject to court scrutiny, and where the burden of
proof rests with the controlling shareholder to show that transactions occurred at an arms’ length
price.
Usurped business opportunities. A parent company may influence the subsidiary indirectly and
particularly in ways that are difficult to prove in court. A parent company may force the
subsidiary to continue in a particular business venture that provides benefits for the parent or
may prohibit the subsidiary from competing with it in a particular area of business. In the case of
NEC Electronics, for several years after listing, the subsidiary incurred significant excess
research and development costs and capital expenditures to enhance the competitive position of
its parent’s products (Foley, Greenwood, and Quinn 2008).8 In the U.S., controlling shareholders
may not direct activity in this manner and may not take a business opportunity for themselves if 8 In the specific case of NEC Electronics, it is also reasonable to argue that the excess investment was inefficient in that production at the subsidiary was done at an inefficient scale so that with perfect alignment of incentives between NEC Electronics and NEC it would have been cheaper to purchase semiconductors from another supplier.

14
the opportunity is in the subsidiary’s interest and scope of competency. In the event of a breach,
the subsidiary can recover benefits from the controlling shareholder. In Japan, no such fiduciary
responsibility exists.
Minority squeeze outs. Squeezing out a minority investor by means of a cash-out merger is a
related-party transaction that in the U.S. invites a high degree of court scrutiny. The majority
shareholder bears the burden of proving that the squeeze out is fair to all shareholders. As with
other related-party transactions, controlling shareholders have no fiduciary duty in Japan. A court
can revoke a shareholder resolution approving a squeeze out only if it is clearly and grossly
unfair. Dissenting shareholders have appraisal rights, but these are of limited value given the
ability of parents to take actions that affect valuations. Japanese regulators have become
increasingly concerned about some recent cases in which parents have repurchased subsidiaries
at large discounts to listing prices soon after listing them.9 Yoshimoto Kogyo bought back
Fandango 19 months after listing it, and NEC bought back NEC System Technologies 20 months
after listing it. Investors that bought shares in these subsidiaries at the beginning of the month
following their listing and sold them back to the parent at the time of the repurchase earned buy-
and-hold returns of -71% and -39% respectively.
IV. Publicly listed subsidiaries in Japan 1980-2005
We collect a sample of subsidiary listings from the Toyo Keizai Japan Company
Handbooks, which provide background information on all publicly listed companies in Japan.
We identify subsidiary listings by scanning volumes from 1980, 1985, 1987, 1990, 1995, 2000,
9 See “Subsidiaries in Japan,” Financial Times, August 15, 2007.

15
and 2005 for firms with corporate owners.10 We define a newly listed firm to be a subsidiary if a
publicly listed Japanese corporate parent owns at least 20% of the equity before and after listing.
The 20% cutoff corresponds to the definition of effective control used by La Porta, Lopez-de-
Silanes, Shleifer, and Vishny (1999).11 In the vast majority of cases we are able to determine pre-
listing ownership stakes from the firm’s first appearance in the handbooks. In a few cases, we
rely on handbook descriptions stating that firms are subsidiaries. In the cases for which we have
ownership data for subsidiaries before and after listing, parent ownership typically falls by a
substantial margin at the time of listing. From our initial list, we exclude firms with more than
one blockholder that owns at least 20% of the equity at the time of listing, subsidiaries in
regulated sectors (utilities and financials), and subsidiaries for which we do not have stock
returns after listing.
Our account of how subsidiary listings are motivated by mispricing would make little
sense if the owners of the newly listed subsidiary were also the owners of the parent. Subsidiary
listings in Japan are new listings rather than spin-offs, so there is no mechanical reason why the
shareholders of the parent and the non-parent owners of the subsidiary would be the same. To
explore the potential overlap in ownership, we collect data on the largest owners of 55 randomly
selected subsidiaries and their parents from the first post-listing ownership information captured
in the Japan Company Handbooks. These books present information on the top 6-10 owners of 10 The 1987 handbook is the first handbook that provides information on firms listed on the second section of Tokyo Stock Exchange and on regional stock exchanges. One concern is that we may miss subsidiaries that are divested before we have the chance to observe a large blockholder. This does not appear to be much of a problem, however, as parent ownership tends to be stable over short time horizons. We have also cross checked our list with data from other sources: an analyst at Morgan Stanley and an analyst at a U.S. hedge fund independently provided us with lists of just over 300 firms that were still trading in late 2007 in which a parent controlled at least 50% of shares outstanding. Most of the extra firms on these lists were listed independently and later fell under the influence of a “parent” company and thus do not qualify under our methodology. We also scan the SDC database for new issues in which the ultimate parent is different from the listed firm. In all, we add only 25 firms from these sources. 11 La Porta, Lopez-de-Silanes, Shleifer and Vishny (1999) apply 20% to the number of votes controlled by the shareholder. Because dual class shares are extremely rare in Japan, cash flow and voting rights are equivalent measures.

16
both subsidiary and parent firms within a few months of subsidiary listings. On average, 1.1 of
the listed parent owners appears on the list of subsidiary owners, which provides 8 owners on
average. Entities that are listed as owners of parent equity own 3.1% of subsidiary equity on
average, or 7.1% of the equity that is not owned by the parent. Our data do not allow us to
identify small shareholders in the subsidiary. However, when restricting our analysis to the larger
shareholders, nearly all of the subsidiary equity sold by the parent is bought by investors who do
not also own the parent.
The ownership information we collect from the Japan Company Handbooks allows us to
select subsidiaries in which the parent maintains effective control yet owns a relatively small
percentage of the cash flows. Specifically, we identify subsidiaries in which the parent’s
ownership stake after listing is between 20% and 50%. We also use the handbooks to determine
whether the parent and subsidiary maintain a sales relationship. In most cases the handbooks
describe whether such a relationship exists. For example, NEC Fieldings’ description reads
“Ratio of sales to NEC group stands at around 70%.” Jalux is a “JAL-affiliated trading company
engaged in procurement of aircraft parts, sales of used aircraft and procurement of in-flight
goods-for-sale for JAL group.” Lawson Tickets “has outlets at Lawson stores nationwide.” In a
few cases we make subjective judgments about the nature and scope of these relationships.12
Data on market values and monthly stock returns are collected primarily from Datastream
and augmented with data from the Japan Securities Research Institute (JSRI), the Pacific Basin
Capital Markets (PACAP) Research Center and Bloomberg, which are useful for listings in the
1980s when Datastream coverage is sometimes sparse. Following other work on the post listing 12 For example, Nippon Steel Chemical is a chemical firm described as “Nippon Steel’s strategic subsidiary, with development work done jointly,” suggesting that it supplies chemicals and carries out R&D for its parent. Tokyo Kohtetsu is a producer of angle steel products; its parent, Mitsui, is a general trading company, with metals as its largest segment.

17
performance of equity issues, like Ritter (1991) and Brav and Gompers (1997), we compute
returns for up to 36 months following listing. We measure these returns from the beginning of
the month following listing because our data do not comprehensively cover returns beginning
after the first day of trading.13
For many of our tests, we calculate risk-adjusted returns using the standard Fama and
French (1993) risk factors. SMB is the value-weighted return of small stocks on the first section
of the Tokyo Stock Exchange minus the value-weighted return of large stocks. HML is the
value-weighted return of large high book-to-market stocks minus the value-weighted return of
large low book-to-market stocks; specifically, it is the Barra/Nikko Value return minus the
Barra/Nikko Growth return.
Last, our tests in section VI require daily returns around periods in which subsidiaries are
repurchased. We use Factiva and Bloomberg to identify repurchase announcement dates and to
collect daily returns for both parent and subsidiary firms around these announcements.
Our final database includes 431 subsidiaries, listed by 243 unique parent companies. Out
of these, 164 list just one subsidiary, 39 list two subsidiaries, and 19 list three subsidiaries. One
firm, Aeon, lists 13 subsidiaries.
Table 1 provides some descriptive statistics on subsidiary listings in our sample.
Subsidiaries are quite a bit smaller than their parents – the median subsidiary’s market equity at
listing is about 7% of its parent’s. For the typical listed subsidiary, the parent company retains
just over 50% of subsidiary equity after listing. In 39% of subsidiary listings, the parent retains
13 For notational simplicity, we refer to the price recorded at the end of the listing month as the listing price, even though it falls a few days or weeks after the first trade.

18
effective control but has a low cash flow stake because it owns 20-50% of the equity. Forty-two
percent of subsidiaries have a sales relationship with the parent firm.
Throughout our analysis, we assume that the listings are not primarily motivated by
financial constraints. Table 2 provides support for this assumption, detailing statistics on
financial constraints of the parent firms immediately before they listed a subsidiary. The table
presents means of firm characteristics that have been used in prior research like Kaplan and
Zingales (1997) to indicate financial constraints, including measures of firm cash flow, the
propensity to pay dividends and the amount of dividend payments, cash holdings, leverage, and
Tobin’s Q. The first column presents statistics for parent firms in the year before listing a
subsidiary. Parents appear to be financially healthy at this time: on average, they experience
positive cash flows, more than 90% pay a dividend, their holdings of cash and marketable
securities exceed 17% of their assets, and measures of book and market leverage are not very
high.
For purposes of comparison, the second column presents statistics for these firms in other
years. Parent firms do not appear to be more constrained in the year before listing a subsidiary
than in other years. The only measure that differs across the two columns by a statistically
significant amount is Tobin’s Q. Parent firms appear to have a higher Tobin’s Q in the year
before listing a subsidiary. This might reflect parents having better investment opportunities, but
it could also reflect parents timing the listing of subsidiaries to coincide with periods of high
market valuations.
The third column presents statistics for firms other than parent firms that are covered in
the PACAP database. These firms do exhibit some differences with parent firms in the year
before listing a subsidiary, but the differences do not systematically suggest that parents are

19
constrained. Other firms are less likely to pay a dividend than parent firms are in the year before
they list a subsidiary. They have lower book leverage but similar market leverage. Other firms
also have lower Tobin’s Q than parent firms immediately before listing a subsidiary.
V. Valuations and stock market performance of listed subsidiaries
Market and industry valuations
Figure 1 shows the number of subsidiary listings by year. The dashed line illustrates the
value of the TOPIX stock return index at the start of the year, measured on the left axis. The
solid line illustrates the number of subsidiary listings, measured on the right axis. Subsidiary
listings closely track the market, with the number of listings increasing following good stock
market performance. Although we focus primarily on forecasting the abnormal performance of
subsidiary listings, the figure also shows that when the number of subsidiary listings is high,
subsequent market performance is low.14
Table 3 presents mean industry market-to-book ratios for subsidiaries and other firms in
the listing year. The market-to-book ratio has been used by a variety of corporate finance studies
as a measure of overvaluation because of its well-known correlation with subsequent stock
returns.15 Because the market-to-book ratio is contaminated by growth opportunities, however,
we leave it to return-based tests to draw conclusions about mispricing.
For the full sample of subsidiary and non-subsidiary listings, the mean industry market-
to-book ratio is 2.47 in the year of listing. However, subsidiary listings’ average industry market-
14 This can also be verified by estimating a forecasting regression of stock market excess returns in year t+1 on the log of one plus the number of listings in year t. This yields a coefficient of 8.08 percent and a t-statistic of 2.60. We do not emphasize these results here because of the small number of observations. The correlation between equity listings and market-level stock returns is reminiscent of Baker and Wurgler (2000). 15 Baker and Wurgler (2002) and Rhodes-Kropf, Robinson, and Viswanathan (2005) use this measure as an ex ante valuation measure, and Fama and French (1992) and Daniel and Titman (1997) show that it predicts future returns.

20
to-book ratio of 2.73 is significantly higher than non subsidiary listings’ industry market-to-book
ratio of 2.41. Thus, subsidiaries tend to list at times when industry valuations are high, even
relative to non subsidiary listings. The table also shows that, consistent with our predictions,
minority owned subsidiaries have higher valuations, reflecting the logic that higher mispricing
encourages parent shareholders to list more equity, and thereby bear more agency costs. Last,
valuations tend to be slightly higher for subsidiaries which have a sales relationship with their
parent firm; these are subsidiaries for which the scope for agency problems at the time of listing
is high.
The underperformance of subsidiaries
Figure 2 and Table 4 summarize cumulative monthly returns earned by subsidiary and
non-subsidiary listings over the first thirty-six months following the IPO. We track monthly
returns starting at the end of the listing month. The dashed line in Figure 2 shows returns to non-
subsidiary listings. Their cumulative returns hover around zero; thirty-six months after listing
cumulative returns are just over 3 percent. By comparison, cumulative returns of subsidiaries are
negative. Table 4 summarizes the returns shown in the figure. The first two panels show results
for the full sample, with Panel A showing raw returns and Panel B showing industry-adjusted
returns. Both raw and industry-adjusted returns earned by subsidiaries are negative, with
industry-adjusted returns of -6.20%, -13.43%, and -13.98% over the one-, two-, and three-year
horizons after listing.16
The table also shows parent returns – both raw and adjusted for the return on the parent’s
stake in subsidiary. If investors do not fully anticipate the potential costs of expropriation from
16 Because we find both raw and industry-adjusted underperformance, it suggests that levels of mispricing are not common across all firms in the market or all firms in an industry.

21
the subsidiary’s perspective, it seems equally likely that they ignore the benefits of expropriation
from the perspective of the parent. Thus subsidiary underperformance in the stock market may
be accompanied by parent outperformance. When studying parent returns, we remove the
mechanical effect of the parent’s stake in the subsidiary: if a parent owns share 1 α− of a
subsidiary, we isolate the returns to investing in parent assets by hedging out the parent’s implied
position in the subsidiary:
(1 )Sub
PA Parent Subit it itParent
MVr r rMV
α⎛ ⎞
= − − ⎜ ⎟⎝ ⎠ (6)
The third column of Panel B shows that adjusted parent returns, after industry adjustment, are
positive but small, providing weak evidence that parent returns outperform.17
Because expropriation of minority shareholders constitutes a transfer of resources from
subsidiary to parent, we have the most power to detect it by looking at the difference between
parent and subsidiary returns. These are reported in the last two columns of Table 4 and are quite
large. When measured using adjusted parent returns, they are around 7-8% over the first year and
around 15-17% over the three-year period after listing.
We next isolate minority owned subsidiaries. Figure 2 and Panel C of Table 4 show that
minority owned subsidiaries perform much worse than the full sample of subsidiaries and other
new listings. Over the first three years after listing, these subsidiaries earn cumulative raw
returns of -20.19%. This underperformance is consistent with the idea that higher mispricing
17 When analyzing cumulative returns, as in Table 4, we measure the parent’s stake after listing and the market values of parent and subsidiary equity at the end of the listing month. When analyzing monthly returns, as in Tables 5 and 6, we measure the parent’s stake and the market values of parent and subsidiary equity as of the end of the previous month.

22
encourages parent firms to list a larger fraction of the subsidiary’s equity, in spite of the agency
costs that listing introduces.
Last, we isolate a group of subsidiaries for which the ex ante scope for expropriation by
the parent firm is high. Figure 2 and Panel D of Table 4 show that subsidiaries which maintain a
sales relationship with the parent firm earn cumulative raw returns of -19.50% in the first three
years after listing.
Both Figure 2 and Table 4 indicate that subsidiary stock market underperformance occurs
primarily over the first two years following listing. Cumulative returns over the three-year
horizon are only slightly lower than those over the two-year horizon.
Risk-adjusted returns
While event-time returns provide a flavor of our results, they are subject to a number of
critiques. First, most of the returns that we report in Figure 2 and Table 4 are not adjusted for
risk.18 Second, it is difficult to determine the statistical significance of cumulative returns. As
shown by Mitchell and Stafford (2000), conventional event-time approaches produce test
statistics that are too large because multi-year abnormal returns are falsely assumed to be
independent.19 We address these issues by calculating calendar-time risk-adjusted returns below.
Table 5 presents results of a panel analysis of monthly subsidiary and adjusted parent
stock returns:
1 2 3it t t t itr RMRF HML SMBα β β β ε= + ⋅ + ⋅ + ⋅ + (7)
18For example, newly listed subsidiaries have high market-to-book ratios, and their underperformance could reflect poor returns earned by high market-to-book firms more generally. 19 See also Brav and Gompers (1997), Lyon, Barber, and Tsai (1999), Brav (2000) and Hanson (2008) for discussions of statistical inference in long-horizon event studies.

23
where itr is the subsidiary or adjusted parent monthly return, net of the risk free rate, or
alternately, is the adjusted parent return minus the subsidiary return. The specifications include
the standard Fama and French (1993) risk factors: the market excess return tRMRF , the value-
weighted return of small stocks minus the value-weighted return of large stocks, tSMB , and the
value-weighted return of high book-to-market stocks minus the value-weighted return of low
book-to-market stocks, tHML . The constant term α in equation (7) denotes the risk-adjusted
abnormal performance. Standard errors are adjusted to allow for clustering by month. Our
procedure will pick up mispricing only if it has a component that is not common across all
firms.20
Our panel specification in equation (7) differs slightly from a calendar-time approach that
collapses events into a single time series of average returns in each period. This kind of calendar-
time approach weights each time period equally, and if firms respond to time-varying mispricing,
it produces biased test statistics that have low power. To obtain unbiased test statistics, Loughran
and Ritter (2000) advocate weighting each period by the number of observations in that period. It
is straightforward to show that our panel specification is equivalent to the weighting scheme
suggested by Loughran and Ritter (2000). Our panel approach also addresses the common
critique that event-study returns overstate statistical significance due to overlapping return
measurement. Furthermore, the panel specification allows for arbitrary correlation structure and
can be generalized to compare the returns of subsidiaries and other listings.
20 Our approach is consistent with the literature on the stock market performance of new issues, which demonstrates that newly listed firms underperform, even after controlling for the market and exposure to HML and SMB (e.g., Loughran and Ritter (1995)).

24
Panel A of Table 5 shows estimates from equation (7) based on the full sample of
subsidiaries. Over the two-year horizon following listing, subsidiary abnormal returns are -33
basis points per month, and adjusted parent abnormal returns are 14 basis points per month.
Thus, a portfolio that is long adjusted parent returns and short subsidiary returns earns 47 basis
points per month. Although economically large, these returns are not statistically distinguishable
from zero. Similar results are obtained over one- and three-year horizons, although the portfolio
described above earns slightly higher average returns over a one-year horizon and slightly lower
average returns over a three-year horizon. Not surprisingly, Table 5 shows that subsidiary returns
have a negative factor loading on HML and a positive factor loading on SMB, reflecting their
high market-to-book ratios and small size at the time of listing. Adjusted parent returns have a
smaller exposure to SMB and higher exposure to the market than subsidiary returns and an
insignificant loading on HML.
Panel B analyzes the subsample of minority owned subsidiaries. Over the two-year
horizon after listing, these subsidiaries earn abnormal returns of -60 basis points per month, and
these returns are statistically significant at the 10% level. There are correspondingly positive
abnormal returns to the portfolio that is long adjusted parent returns and is short subsidiary
returns.
Panel C analyzes the subsample of subsidiaries that maintain a sales relationship with the
parent. Over the two-year horizon after listing, these subsidiaries earn statistically significant
abnormal returns of -71 basis points per month. Adjusted parent returns exceed subsidiary
returns by 86 basis points per month over this horizon. Similar results obtain at one- and three-
year horizons. At each horizon, subsidiaries earn negative abnormal returns, and there are

25
positive abnormal returns to the portfolio that buys adjusted parent returns and is short subsidiary
returns.
Overall, results in Tables 4 and 5 support our hypotheses that listings in which the parent
owns a small share of the equity after listing and listings for which there is greater scope for
agency problems require significant overvaluation to support the listing. In particular, our two-
year horizon estimates in Panel C of Table 5 suggest that subsidiaries that maintain a sales
relationship with their parent are at least 24 0.71 17%× ≈ overvalued at the time of listing.
Ritter (1991), Loughran and Ritter (1995) and others document underperformance of
initial public offerings in the U.S. The poor performance of newly listed subsidiaries could be
symptomatic of a more general new listing effect, although the more pronounced
underperformance of subsidiaries with a sales relationship would not follow immediately from a
general listing effect. The returns for non-subsidiary listings in Figure 2 suggest that non-
subsidiary listings have not performed poorly relative to subsidiary listings. To test this more
formally, we pool our subsidiary listings with non-subsidiary listings into a single panel. We then
estimate whether subsidiaries have statistically distinguishable underperformance relative to this
control group. Table 6 shows results of regressions of the form:
1 2 3
4 5 6
it Sub i t i t t
i t t i t it
r Subsidiary RMRF Subsidiary RMRF HMLSubsidiary HML SMB Subsidiary SMB
α α β β ββ β β ε
= + ⋅ + ⋅ + ⋅ ⋅ + ⋅+ ⋅ ⋅ + ⋅ + ⋅ ⋅ + (8)
where rit is the return on new listings, net of the risk free rate, and Subsidiary is a dummy
variable indicating subsidiary listings. This specification allows subsidiary and non-subsidiary
26
listings to have different factor loadings.21 The constant term coefficient α is the realized average
abnormal return of non-subsidiary listings, and the coefficient on the Subsidiary dummy, Subα ,
measures the underperformance of subsidiaries relative to the other listings control group.
Panel A of Table 6 shows results for the full sample, which now includes subsidiary and
other listings. Non-subsidiary listings earn small and statistically insignificant abnormal returns
over one-, two-, and three-year horizons. The coefficient on the subsidiary dummy implies that
subsidiaries underperform other listings by 19-28 basis points per month over the first 3 years
after listing, but these coefficients are not statistically significant.
Panels B and C of Table 6 report results for minority owned subsidiaries and subsidiaries
that maintain a sales relationship with their parent. These subsidiaries underperform other new
listings by 52-87 basis points per month, depending on the horizon, with the differences in
returns being statistically significant at conventional levels. Thus, the performance of
subsidiaries that are subject to agency problems does not appear to reflect a general new listing
effect.
The existing literature emphasizes financial constraints as a motivation for listing equity
in the presence of agency problems. It is difficult to imagine how considerations related to
financial constraints could drive the results on returns, and the descriptive statistics in Table 2
suggest that parents are not financial constrained at the time subsidiaries are listed.
Notwithstanding, we have analyzed returns for subsets of our data in which the listing parent
21 With the exception of large subsidiaries’ loading on SMB, subsidiary and other listings have very similar factor loadings, which we do not report to preserve space. We get similar results when we assume that subsidiary and non-subsidiary listings have the same factor loadings.

27
appears more financially constrained.22 In such cases, the risk adjusted returns of subsidiaries
and portfolios that are long adjusted parent returns and short subsidiary returns are
indistinguishable from zero. Interestingly, one situation in which subsidiaries do perform poorly
is when parent firms hold high levels of cash at the end of the year prior to listing the subsidiary
(not tabulated), suggesting that mispricing is a more salient motivation for listing when financial
constraints seem particularly unlikely.
VI. Subsidiaries ownership changes after listing
Figure 2 and Table 4 indicate that the underperformance of subsidiaries with the most
severe agency problems lasts two or three years, suggesting that mispricing corrects over this
horizon. When valuations return to fundamental levels or overshoot, parent firms have an
incentive to repurchase their subsidiaries. If a parent repurchases all of the equity of a
subsidiary, it is likely to terminate activities that generate agency costs, such as actions taken to
disguise transfer pricing. The gains from eliminating these agency costs may be captured by
parent firms because minority shareholders have few powers to object to the terms of a
repurchase. Squeeze out laws and delisting rules yield considerable negotiating power to the
parent firm, enabling them to capture some of the gains associated with repurchases.23 If the
reacquisitions are not fully anticipated by the market, they should be associated with positive
announcement returns to the parent firm.
22 Specifically, cases in which we assume that the listing parent is most likely to be financially constrained are cases in which: the parent has a low ratio of cash flow to assets, a low ratio of dividends to assets, a low ratio of cash to asset, high book leverage, high market leverage, or high Tobin’s Q. For each measure of financial constraints, “low” (“high”) corresponds to the bottom (top) third of observations for parent firms in the year prior to listing. 23 Specifically, if a top shareholder owns more than 75% of shares for a year or if he holds more than 90% of shares at any time, the firm is subject to delisting. Minority shareholders fear delisting because of the illiquidity of unlisted equity.

28
We use Japan Company Handbooks through 2007 to track the ownership of each
subsidiary after listing. These outcomes are summarized in Table 7. The most common outcome
is that parents maintain approximately the same ownership share they held at listing.
Specifically, in 147 cases, parent ownership is within five percentage points of the stake held
right after the subsidiary was listed.
The next most common outcome is that the parent repurchases all of the subsidiary’s
public shares. This happens in 109 cases, which is a quarter of our sample. The number of
subsidiaries that are repurchased is considerably higher than the number of subsidiaries that are
divested by the parent. In only 64 cases does the parent firm sell its entire stake. Parents decrease
their ownership by 5 percentage points or more in 85 cases; in 63 of these they maintain a
controlling stake, and in 36 cases they keep a majority stake.
There is some evidence that repurchased subsidiaries are the ones with high agency costs.
Sixty-seven percent of reacquired subsidiaries are included in one of our groupings of
subsidiaries that are prone to agency problems. This compares to 61% for subsidiaries that are
not reacquired. This difference is explained by the higher probability of sales-relationship-
subsidiaries being reacquired. Forty-eight percent of reacquired subsidiaries have a sales
relationship with their parents, but only 40% of other subsidiaries do. Not surprisingly,
reacquisition is slightly more likely when the parent retains a majority stake post listing.
We now turn to the subsidiaries that were repurchased by their parents. Under the view
that parents list these firms when they are overvalued and repurchase them once mispricing
corrects, we should generally observe repurchases to occur at a discount to the listing price.
Figure 3 shows evidence consistent with this idea. The figure shows a histogram of the buy-and-
hold return of repurchased subsidiaries from the end of the listing month until the time of their

29
repurchase. In 78 out of 109 cases, the returns are negative. Although there are 14 cases in which
returns exceed 100%, median buy-and-hold returns are -41.5%. Thus, in the typical case, parents
repurchase their subsidiaries at a considerable discount to the listing price.
Are subsidiary reacquisitions perceived as good news for parent firm shareholders? Table
8 summarizes reacquisition announcement returns for parents and subsidiaries. In contrast to the
usually negative announcement returns for acquirers in the United States (Andrade, Mitchell,
Stafford (2001)), parent announcement returns are positive and statistically significant. Market-
adjusted returns during the five-day window around announcement are 1.76%, which is
equivalent to approximately 18% of the subsidiary’s stock market value because the average
market capitalization of repurchasing parent firms is much larger than that of subsidiaries. Panel
B shows that subsidiaries also experience positive announcement returns, with market-adjusted
returns during the five-day window around announcement of 9.49%, reflecting modest takeover
premia. Thus, consistent with our predictions, parent firms are able to capture some of the gains
from these transactions.
VII. Conclusion
In perfectly efficient markets, minority shareholders anticipate the full extent of agency
problems and form unbiased estimates of the cash flows they will receive. If the controlling
shareholder is expected to divert resources, minority shareholders price the equity accordingly,
and it is the controlling shareholder who ultimately bears all agency costs. Controlling
shareholders therefore sell shares to dispersed outside investors only when there are substantial
benefits to doing so. The existing literature focuses on motivations related to financial
constraints. Our findings suggest another possible, though not mutually exclusive, explanation:
equity is sold when it is overpriced. Stock mispricing offsets agency costs and induces a

30
controlling shareholder to raise capital. Higher misvaluations are required to support the creation
of ownership structures that give rise to more expropriation.
We test these ideas by studying the public listing of subsidiaries by Japanese
corporations. These listings are common in Japan, and in the instances we study, parent
companies retain effective control of their subsidiaries post listing, leaving open the possibility
that they may take advantage of minority shareholders in the future.
Our empirical evidence is consistent with our three main hypotheses. First, subsidiaries
in which the parent firm retains only a minority stake experience poor returns following their
listing. Among these subsidiaries, controlling shareholders have effective control but limited
cash flow rights, creating incentives for them to divert resources from the subsidiary. Second,
performance is poor among subsidiaries for which there is greater ex ante scope for agency
problems, namely those that maintain a sales relationship with the parent firm. These
subsidiaries earn risk-adjusted returns of -71 basis points per month in the two-year period after
listing. Third, a quarter of the subsidiaries listed during our sample period are repurchased by
their parent. When such repurchases are announced, shareholders in parent firms and subsidiaries
experience positive announcement returns. In the majority of these repurchases, the parent takes
the subsidiary private at a discount to the listing price. We interpret these findings as consistent
with the idea that controlling shareholders repurchase subsidiaries once mispricing reverts
because the costs of diversion are recurring.
Concerns about the mistreatment of minority shareholders of public subsidiaries have
recently attracted the attention of Japanese lawmakers and regulators. Partially in response to
pressure from investors, in 2007 the TSE clarified its position on subsidiary listings, which it
characterized as “not necessarily a desirable capital policy for various market players including

31
investors” (TSE Listing Examination 235, October 29, 2007). In 2008, the TSE released
guidelines enhancing disclosure requirements for companies with a controlling shareholder,
particularly around related-party transactions. In a survey released around the same time, the
TSE found that 32.4% of listed subsidiaries had essentially no policy ensuring fair treatment of
minority shareholders in related-party transactions (TSE-Listed Companies White Paper on
Corporate Governance 2009, p. 13). In December 2009, Tsutmu Okubo, a member of the Diet’s
upper house financial committee proposed legislation that would ban publicly listed subsidiaries
and force parent companies to sell off or buy full control of existing subsidiaries. In explaining
his motivation, Okubo referenced his concerns about diversion and the historical returns earned
by minority shareholders: “To stimulate Japan’s stock markets, we can’t allow policies that will
allow minority shareholders to be pushed around” (“Japan’s Ruling Party May Propose Ban on
Listed Subsidiaries,” by Finbarr Flynn and Shingo Kawamoto, Bloomberg, December 15, 2009).
Although we test our ideas by looking at subsidiary listings in Japan, the same
predictions should apply to other ownership structures that are prone to agency problems,
including pyramids, business groups, and dual class shares. Such ownership structures are
common around the world, especially in emerging markets. Although financing constraints are
likely to be more salient in these settings than in Japan, periods of stock market mispricing could
also contribute to the formation of these ownership arrangements.

32
References
Andrade, Gregor, Mark Mitchell, and Erik Stafford, 2001, New evidence and perspectives on mergers, Journal of Economic Perspectives 15, 103-120.
Almeida, Heitor, and Daniel Wolfenzon, 2006, A theory of pyramidal ownership and family business groups, Journal of Finance 61, 2637-2681.
Atanasov, Vladimir, Audra Boone, and David Haushalter, forthcoming, Is there shareholder expropriation in the United States? An analysis of publicly-traded subsidiaries, Journal of Financial and Quantitative Analysis.
Bae, Kee-Hong, Jun-Koo Kang and Jin-Mo Kim, 2002, Tunneling or value added: Evidence from mergers by Korean business groups, Journal of Finance 57, 2695-2740.
Baek, Jae-Seung, Jun-Koo Kang, and Inmoo Lee, 2006 Business groups and tunneling: Evidence from private securities offerings by Korean chaebols, Journal of Finance 61, 2415-2449.
Baker, Malcolm, and Jeffrey Wurgler, 2002, Market timing and capital structure, Journal of Finance 57, 1-32.
Bertrand, Marianne, Paras Mehta, and Sendhil Mullainathan, 2002, Ferreting out tunneling: An application to Indian business groups, Quarterly Journal of Economics 117, 121-148.
Brav, Alon, 2000, Inference in long-horizon event studies: A Bayesian approach with application to initial public offerings, Journal of Finance 55, 1979-2016.
Brav, Alon and Gompers, Paul, 1997. Myth or reality? The long-run underperformance of initial public offerings: Evidence from venture and non-venture-backed companies, Journal of Finance 52, 1791-1821.
Burkart, Mike, Denis Gromb, and Fausto Panunzi, 1998, Why higher takeover premia protect minority shareholders, Journal of Political Economy 106, 172–204.
Cain, Daylian M., George Loewenstein, and Don A. Moore, 2005, The dirt on coming clean: Perverse effects of disclosing conflicts of interest, Journal of Legal Studies 34, 1-25.
Claessens, Stijn, Simeon Djankov, Joseph Fan, and Larry Lang, 2002, Disentangling the incentive and entrenchment effects of large shareholdings, Journal of Finance, 57, 2741-2771.
D’Avolio, Gene, 2002, The market for borrowing stock, Journal of Financial Economics, 66, 271-306.

33
Daniel, Kent and Sheridan Titman, 1997, Evidence on the characteristics of cross-sectional variation in stock returns, Journal of Finance 52, 1-33.
Eckbo, Espen, and Karen Thorburn, 2008, Chapter 16, Corporate restructurings, in: Handbook of Corporate Finance: Empirical Corporate Finance Volume 2, ed. B. Espen Eckbo, (Elsevier B.V. ), 431-496.
Fama, Eugene F. and Kenneth R. French, 1992, The cross-section of expected stock returns, Journal of Finance 47, 427-465.
Fama, Eugene F. and Kenneth R. French, 1993, Common risk factors in the returns on stocks and bonds, Journal of Financial Economics 33, 3-56.
Foley, C. Fritz, Robin Greenwood and Jim Quinn, 2008, NEC Electronics, Harvard Business School Case, No. 209001.
Graham, John R., and Campbell Harvey, 2001, The theory and practice of corporate finance: Evidence from the field, Journal of Financial Economics 60, 187-243.
Hanson, Samuel, 2008, Simple approaches to event-time stock returns, Mimeo Harvard University .
Jensen, Michael C., and William Meckling, 1976, Theory of the firm: managerial behavior, agency costs, and ownership structure, Journal of Financial Economics 3, 305-360.
Johnson, Simon, Rafael La Porta, Florencio Lopez-de-Silanes, and Andrei Shleifer 2000, Tunneling, American Economic Review Papers and Proceedings 90, 22-27.
Kaplan, Steven, and Luigi Zingales, 1997, Do investment-cash flow sensitivities provide useful measures of financing constraints?, Quarterly Journal of Economics 112, 169-215.
Kamiyama, Naoki, 2008, Company-Shareholder Communication (13): Stocks of listed subsidiaries struggling, Morgan Stanley Research Japan, research memo.
Klein, April, James Rosenfeld, and Williams Beranek, 1991, Two stages of an equity carve-out and the price response of parent and subsidiary stock, Managerial and Decision Economics 12, 449-460.
LaPorta, Rafael, Florencio Lopes-De-Silanes, Andrei Shleifer, 1999, Corporate ownership around the world, Journal of Finance 54, 471-517
LaPorta, Rafael, Florencio Lopes-De-Silanes, Andrei Shleifer, and Robert Vishny, 2002, Investor protection and corporate valuation, Journal of Finance 58, 1147-1170.

34
Loughran, Timothy, and Jay R. Ritter, 1995, The new issues puzzle, Journal of Finance 50, 23-51.
Loughran, Timothy, and Jay R. Ritter, 2000, Uniformly least powerful tests of market efficiency, Journal of Financial Economics 55, 361-389.
Lyon, John D., Brad M. Barber and Chih-Ling Tsai, 1999, Improved methods for tests of long-run abnormal stock returns, Journal of Finance, 54 165-201.
Malmendier, Ulrike, and Devin Shantikumar, 2007, Are small investors naïve about incentives? Journal of Financial Economics 85, 457-489.
Mitchell, Mark, and Erik Stafford, 2000, Managerial decisions and long-term stock-price performance. Journal of Business 73, 287-329.
Morck, Randall, Daniel Wolfenzon, and Bernard Yeung, 2005, Corporate governance, economic entrenchment and growth, Journal of Economic Literature 43, 655-720.
Nanda, Vikram, 1991, On the good news in equity carve-outs, Journal of Finance 46, 1717-1737.
Nishiyama, K., 2007, Parent-subsidiary listings, Nomura Security Co. Ltd., research memo.
Perkins, Susan, Randall Morck, and Bernard Yeung, 2008, Innocents abroad: The hazards of international joint venture with pyramidal group firms, NBER Working Paper No. W13914.
Perotti, Enrico and Silvia Rossetto, 2007, Unlocking value: equity carve outs as strategic real options, Journal of Corporate Finance 13, 771-792.
Rhodes-Kropf, Matthew, David T. Robinson, S. Viswanathan, 2005, Valuation waves and merger activity: The empirical evidence, Journal of Financial Economics 77, 561-603.
Ritter, Jay, 1991, The long-run performance of initial public offerings, Journal of Finance 46, 3-27.
Schipper, Katherine, and Abbie Smith, 1986, A comparison of equity carve-outs and seasoned equity offerings: Share price effects and corporate restructuring, Journal of Financial Economics 15, 153-186.
Shleifer, Andrei, and Daniel Wolfenzon, 2002, Investor protection and equity markets, Journal of Financial Economics 66, 3-27.

35
Shleifer, Andrei, and Robert W. Vishny, 2003, Stock market driven acquisitions, Journal of Financial Economics 70, 295-311.
Shleifer, Andrei, 2010, Efficient Regulation, in Daniel Kessler, ed., Regulation vs. Litigation, NBER and University of Chicago Press, forthcoming.
Slovin, Myron B, and Marie E. Sushka, 1997, The implications of equity issuance decisions within a parent-subsidiary governance structure, Journal of Finance 52, 841-857.
Stein, Jeremy C., 1996, Rational capital budgeting in an irrational world, Journal of Business 69 429-455.
Vijh, Anand, 2002, The positive announcement-period returns of equity carveouts: Asymmetric information or divestiture gains? Journal of Business 75, 153-190.

Figure 1
Market Valuations and Subsidiary Listings
This figure shows the value of the TOPIX stock exchange index at the beginning of the year and the number of subsidiary listings during the year. A newly listed firm is considered to be a subsidiary if a publicly listed Japanese corporate parent owns at least 20% of the equity before and after listing. Listing information is from the Toyo Keizai Japan Company Handbooks.
0
5
10
15
20
25
30
35
40
45
50
0
500
1000
1500
2000
2500
3000
3500
4000
1980 1985 1990 1995 2000 2005
Num
ber
of S
ubsi
diar
y L
istin
gs
TO
PIX
at S
tart
of Y
ear
Market Index
Number of Listings
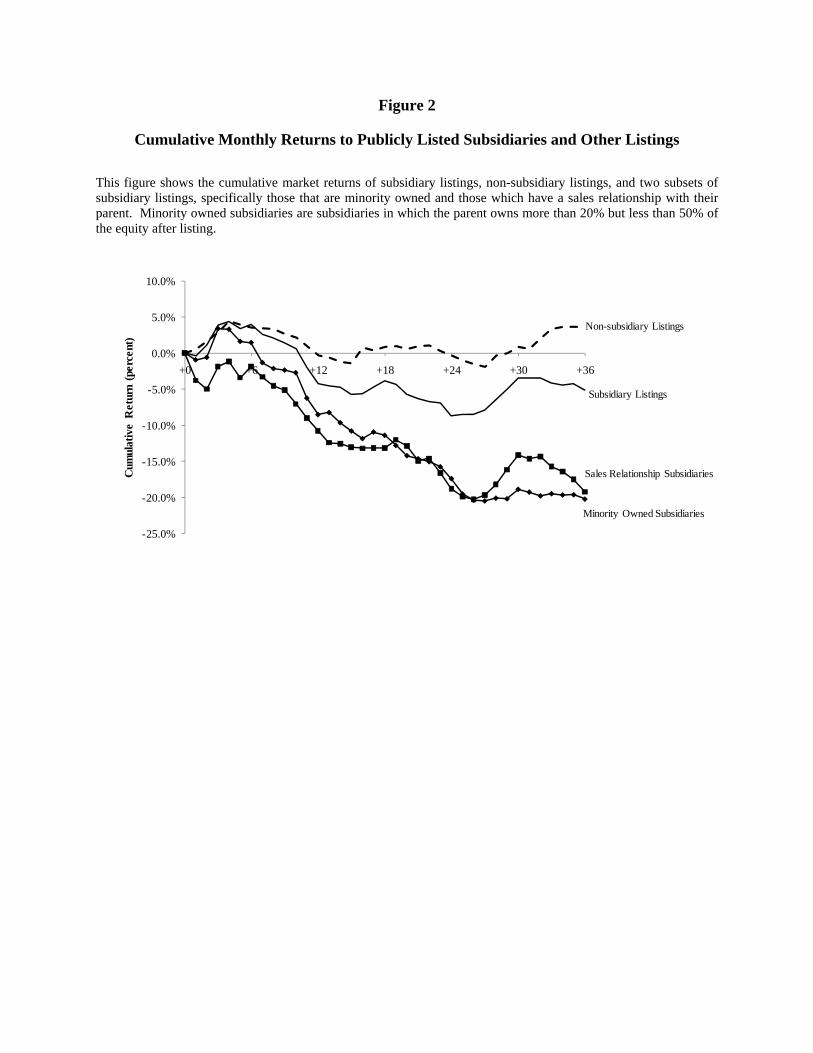
Figure 2
Cumulative Monthly Returns to Publicly Listed Subsidiaries and Other Listings
This figure shows the cumulative market returns of subsidiary listings, non-subsidiary listings, and two subsets of subsidiary listings, specifically those that are minority owned and those which have a sales relationship with their parent. Minority owned subsidiaries are subsidiaries in which the parent owns more than 20% but less than 50% of the equity after listing.
-25.0%
-20.0%
-15.0%
-10.0%
-5.0%
0.0%
5.0%
10.0%
+0 +6 +12 +18 +24 +30 +36
Cum
ulat
ive
Ret
urn
(per
cent
)
Subsidiary Listings
Sales Relationship Subsidiaries
Minority Owned Subsidiaries
Non-subsidiary Listings

Figure 3
Buy-and-Hold Returns to Repurchased Subsidiaries
This figure shows the distribution of buy-and-hold returns earned by subsidiaries that are repurchased by their parent firm or another affiliated entity. Returns are measured from the beginning of the month following the subsidiary listing until the repurchase date.

Table 1Characteristics of Subsidiary Listings
This table presents descriptive statistics for the sample of 431 subsidiaries that listed inJapan between 1980 and 2005. Listing information is from the Toyo Keizai Japan CompanyHandbooks. A newly listed firm is considered to be a subsidiary if a publicly listed Japanesecorporate parent owns at least 20% of the equity before and after listing. The sample excludesfirms with multiple 20% blockholders at the time of listing, firms in regulated sectors (utilities andfinancials), and firms with missing monthly stock returns after listing. Market value of equity atlisting is measured in billions of yen at the end of the listing month. Sales relationship subsidiariesare subsidiaries which have a sales relationship with their parent. Minority owned subsidiariesare subsidiaries in which the parent owns more than 20% but less than 50% of the equity afterlisting. Reacquired by parent or related entity is a binary variable equal to one if the subsidiary isreacquired by its parent or a related entity follows its listing.
N Mean Median SD Min MaxInitial stake 431 0.50 0.52 0.16 0.20 0.85Market value of subsidiary equity at listing 431 66 17 447 1 9000Market value of parent equity at listing 431 757 294 1370 3 14639Sales relationship subsidiaries 431 0.42 0.00 0.49 0.00 1.00Minority owned subsidiaries 431 0.39 0.00 0.49 0.00 1.00Reacquired by parent or related entity 431 0.26 0.00 0.44 0.00 1.00

Table 2Measures of Parent Firms Financial Constraints
This table compares the characteristics of parent firms in the year before listingwith the characteristics of parents in other years and with the characteristics of otherfirms. The sample includes all firms in PACAP Japan during the 1980-2005 period.Cash flow is net income before extraodinary items plus depreciation. Dividend payeris a binary variable that is measured annually and is equal to one for firms thatpay dividends. Dividends are cash dividends on common stock. Cash is cash plusmarketable securities. Book leverage is the sum of short-term loans, long-term loans,and debentures, divided by total debt plus the book value of stockholders’ equity.Market leverage is defined similarly except that the market value of stockholders’equity is used. Tobin’s Q is the market value of common stock plus book assets andminus book equity, divided by book assets. *, **, and *** indicate that the differencewith parents in the year before listing subsidiary is statistically significant at 10%, 5%,and 1%, respectively. Standard errors are adjusted for clustering by firm.
Parents in Year Before Parents in Other Other FirmsListing Subsidiary Years
Cash Flow/Assets 0.0337 0.0339 0.0374Dividend Payer 0.9060 0.8903 0.8394∗∗∗
Dividends/Assets 0.0073 0.0073 0.0070Cash/Assets 0.1740 0.1815 0.1854Book Leverage 0.4694 0.4567 0.4014∗∗∗
Market Leverage 0.3319 0.3395 0.3069Tobin’s Q 1.6207 1.4953∗∗∗ 1.4331∗∗∗

Table 3Industry Market-to-Book of New Listings
This table reports the industry market-to-book ra-tio, as measured at the end of the listing year, for alllistings, non-subsidiary listings, and two subsets of sub-sidiary listings. The sample consists of 431 subsidiary and1,825 non-subsidiary listings during the 1980-2005 period.To compute these ratios, we first calculate equal-weightedaverages of market-to-book ratios of all publicly tradedfirms in a given industry. The table shows equal-weightedaverages of industry market-to-book ratios of subsidiaryand non-subsidiary listings.
All Listings 2.47Non-Subsidiary Listings 2.41Subsidiary Listings 2.73
Sales Relationship 2.78Minority Owned 2.74

Table 4Cumulative Returns Following Subsidiary Listing
This table reports cumulative monthly returns over 1-, 2-, and 3-year horizons followinglisting for all subsidiaries and for two subsets of subsidiaries. Adjusted parent returns capturethe return on parent company equity adjusted for the return on parent’s stake in the subsidiary.Adjusted parent returns are equal to
radjustedparentit = rparent
it − (1 − α)(
MV sub
MV parent
)rsubit
where the parent’s stake in subsidiary, 1−α, and market values of parent, MV parent, and subsidiaryequity, MV sub, are measured at the end of the listing month. Industry-adjusted returns are netof matched industry returns. Minority owned subsidiaries are subsidiaries in which the parentowns more than 20% but less than 50% of the equity after listing. Sales relationship subsidiariesare subsidiaries which have a sales relationship with their parent. Standard errors are reported inparentheses. *, **, and *** denote statistical significance at 10%, 5%, and 1%, respectively.
AdjustedHolding Adjusted Parent - Parent -Period Subsidiary Parent Parent Subsidiary Subsidiary
Panel A: Full Sample (N = 431)1 year −4.32 1.32 3.03 5.65∗∗ 7.35∗∗
(2.73) (3.00)2 years −9.02 2.36 5.37 11.38∗∗∗ 14.39∗∗∗
(3.42) (3.85)3 years −5.49 7.20 10.00 12.70∗∗∗ 15.50∗∗∗
(3.97) (4.45)Panel B: Full Sample Industry-Adjusted (N = 431)
1 year −6.20 −0.15 1.56 6.05∗∗ 7.76∗∗
(2.85) (3.11)2 years −13.43 −1.24 1.76 12.19∗∗∗ 15.19∗∗∗
(3.50) (3.89)3 years −13.98 −0.00 2.80 13.98∗∗∗ 16.78∗∗∗
(4.03) (4.48)Panel C: Minority Owned Subsidiaries (N = 168)
1 year −8.51 2.75 5.00 11.26∗∗ 13.51∗∗∗
(4.46) (4.86)2 years −17.36 −1.99 2.17 15.37∗∗∗ 19.52∗∗∗
(5.16) (5.82)3 years −20.19 3.36 7.49 23.55∗∗∗ 27.68∗∗∗
(5.63) (6.39)Panel D: Sales Relationship Subsidiaries (N = 179)
1 year −10.59 −1.14 1.83 9.46∗∗ 12.42∗∗∗
(3.76) (4.20)2 years −18.89 0.83 5.18 19.73∗∗∗ 24.07∗∗∗
(4.94) (5.70)3 years −19.50 1.85 6.62 21.35∗∗∗ 26.12∗∗∗
(5.97) (6.96)

Table 5Risk-Adjusted Returns
This table reports monthly risk-adjusted returns for the full sample of subsidiaries and fortwo subsets of subsidiaries. Monthly risk-adjusted returns are calculated using the following panelregression
rit = α+ β1 ·RMRFt + β2 ·HMLt + β3 · SMBt + εit
where rit is subsidiary or adjusted parent return, net of the risk free rate, or alternately, is theadjusted parent return minus subsidiary return. Adjusted parent returns capture the return onparent company equity adjusted for the return on parent’s stake in subsidiary. Adjusted parentreturns are equal to
radjustedparentit = rparent
it − (1 − αi,t−1)
(MV sub
i,t−1
MV parenti,t−1
)rsubit
where 1−αi,t−1 is parent’s stake in subsidiary at time t− 1. RMRF is the Topix return net of therisk-free rate. HML is the Barra/Nikko Value return minus the Barra/Nikko Growth return. SMBis the value-weighted return of small stocks on the first section of the Tokyo Stock Exchange minusthe value-weighted return of large stocks. N is the average number of subsidiaries in each monthlycross section. Minority owned subsidiaries are subsidiaries in which the parent owns more than20% but less than 50% of the equity after listing. Sales relationship subsidiaries are subsidiarieswhich have a sales relationship with their parent. Standard errors, reported in parentheses belowthe coefficients, are adjusted for clustering by month. *, **, and *** denote statistical significanceat 10%, 5%, and 1%, respectively.
HoldingPeriod Return Alpha RMRF HML SMB N Adjusted R2
Panel A: Full SampleSubsidiary - Risk Free −0.40 0.77∗∗∗ −0.56∗∗∗ 0.81∗∗∗ 426 0.12
(0.45) (0.08) (0.19) (0.10)1 year Adjusted Parent - Risk Free 0.14 1.04∗∗∗ −0.10 0.41∗∗∗ 426 0.28
(0.19) (0.04) (0.09) (0.06)Adjusted Parent - Subsidiary 0.54 0.28∗∗∗ 0.47∗∗ −0.40∗∗∗ 426 0.01
(0.47) (0.08) (0.20) (0.11)Subsidiary - Risk Free −0.33 0.82∗∗∗ −0.44∗∗∗ 0.78∗∗∗ 423 0.13
(0.35) (0.06) (0.15) (0.09)2 years Adjusted Parent - Risk Free 0.14 1.04∗∗∗ 0.03 0.33∗∗∗ 423 0.24
(0.17) (0.03) (0.08) (0.05)Adjusted Parent - Subsidiary 0.47 0.22∗∗∗ 0.47∗∗∗ −0.44∗∗∗ 423 0.01
(0.34) (0.06) (0.15) (0.09)Subsidiary - Risk Free −0.15 0.82∗∗∗ −0.39∗∗∗ 0.77∗∗∗ 416 0.14
(0.31) (0.06) (0.12) (0.08)3 years Adjusted Parent - Risk Free 0.17 1.02∗∗∗ 0.05 0.37∗∗∗ 416 0.24
(0.15) (0.03) (0.07) (0.05)Adjusted Parent - Subsidiary 0.32 0.20∗∗∗ 0.44∗∗∗ −0.40∗∗∗ 416 0.01
(0.32) (0.06) (0.13) (0.09)(continued)

Table 5 - Continued
HoldingPeriod Return Alpha RMRF HML SMB N Adjusted R2
Panel B: Minority Owned Subsidiaries
Subsidiary - Risk Free −0.73 0.68∗∗∗ −0.62∗∗∗ 0.76∗∗∗ 166 0.12(0.47) (0.07) (0.24) (0.11)
1 year Adjusted Parent - Risk Free 0.32 0.97∗∗∗ −0.17 0.53∗∗∗ 166 0.30(0.23) (0.04) (0.11) (0.07)
Adjusted Parent - Subsidiary 1.06∗∗ 0.30∗∗∗ 0.46∗ −0.23∗∗ 166 0.01(0.51) (0.08) (0.25) (0.12)
Subsidiary - Risk Free −0.60∗ 0.74∗∗∗ −0.40∗∗ 0.71∗∗∗ 165 0.13(0.36) (0.07) (0.18) (0.09)
2 years Adjusted Parent - Risk Free 0.05 0.97∗∗∗ 0.07 0.44∗∗∗ 165 0.25(0.19) (0.04) (0.08) (0.06)
Adjusted Parent - Subsidiary 0.65∗ 0.23∗∗∗ 0.47∗∗∗ −0.28∗∗∗ 165 0.01(0.38) (0.07) (0.18) (0.10)
Subsidiary - Risk Free −0.51∗ 0.73∗∗∗ −0.34∗∗ 0.69∗∗∗ 164 0.12(0.30) (0.05) (0.14) (0.07)
3 years Adjusted Parent - Risk Free 0.14 0.96∗∗∗ 0.13∗ 0.46∗∗∗ 164 0.25(0.17) (0.03) (0.07) (0.05)
Adjusted Parent - Subsidiary 0.65∗ 0.24∗∗∗ 0.47∗∗∗ −0.23∗∗∗ 164 0.01(0.33) (0.06) (0.16) (0.09)
Panel C: Sales Relationship Subsidiaries
Subsidiary - Risk Free −0.98∗∗ 0.80∗∗∗ −0.49∗∗∗ 0.87∗∗∗ 177 0.16(0.46) (0.10) (0.18) (0.12)
1 year Adjusted Parent - Risk Free 0.03 1.05∗∗∗ −0.26∗∗ 0.36∗∗∗ 177 0.30(0.25) (0.05) (0.11) (0.08)
Adjusted Parent - Subsidiary 1.01∗∗ 0.26∗∗∗ 0.23 −0.51∗∗∗ 177 0.02(0.46) (0.08) (0.18) (0.12)
Subsidiary - Risk Free −0.71∗∗ 0.81∗∗∗ −0.43∗∗∗ 0.83∗∗∗ 176 0.16(0.36) (0.08) (0.15) (0.09)
2 years Adjusted Parent - Risk Free 0.14 1.03∗∗∗ −0.08 0.25∗∗∗ 176 0.23(0.22) (0.04) (0.09) (0.07)
Adjusted Parent - Subsidiary 0.86∗∗ 0.22∗∗∗ 0.35∗∗ −0.58∗∗∗ 176 0.02(0.37) (0.07) (0.15) (0.10)
Subsidiary - Risk Free −0.50 0.81∗∗∗ −0.32∗∗ 0.81∗∗∗ 174 0.16(0.31) (0.07) (0.13) (0.08)
3 years Adjusted Parent - Risk Free 0.17 1.01∗∗∗ −0.05 0.28∗∗∗ 174 0.23(0.19) (0.03) (0.07) (0.06)
Adjusted Parent - Subsidiary 0.67∗∗ 0.20∗∗∗ 0.27∗∗ −0.52∗∗∗ 174 0.02(0.33) (0.07) (0.13) (0.10)

Table 6Risk-Adjusted Returns of Subsidiary versus Non-Subsidiary Listings
This table reports monthly risk-adjusted returns of subsidiary and non-subsidiary listings.Monthly risk-adjusted returns are calculated using the following panel regression
rit = α+ αsub · Subsidiary + β1 ·RMRFt + β2 · Subsidiary ·RMRFt+
β3 ·HMLt + β4 · Subsidiary ·HMLt + β5 · SMBt + β6 · Subsidiary · SMBt + εit
The full sample consists of all listings during the 1980-2005 period. The samples in panels B andC consist of all non-subsidiary listings and one of two subsets of subsidiary listings. Subsidiaryis a binary variable equal to one for subsidiary listings. RMRF is the Topix return net of therisk-free rate. HML is the Barra/Nikko Value return minus the Barra/Nikko Growth return. SMBis the value-weighted return of small stocks on the first section of the Tokyo Stock Exchange minusthe value-weighted return of large stocks. N is the average number of firms in each monthly crosssection. Minority owned subsidiaries are subsidiaries in which the parent owns more than 20% butless than 50% of the equity after listing. Sales relationship subsidiaries are subsidiaries which have asales relationship with their parent. Standard errors, reported in parentheses below the coefficients,are adjusted for clustering by month. *, **, and *** denote statistical significance at 10%, 5%, and1%, respectively.
Holding RMRF HML SMBPeriod αsub α RMRF · Sub HML · Sub SMB · Sub N Adjusted R2
Panel A: Full Sample1 year −0.28 −0.11 0.78∗∗∗ −0.01 −0.57∗∗∗ 0.01 0.80∗∗∗ 0.01 1864 0.09
(0.28) (0.51) (0.09) (0.05) (0.21) (0.11) (0.13) (0.07)2 years −0.25 −0.08 0.83∗∗∗ −0.01 −0.46∗∗∗ 0.02 0.80∗∗∗−0.02 3767 0.09
(0.23) (0.44) (0.08) (0.05) (0.17) (0.08) (0.12) (0.06)3 years −0.19 0.04 0.89∗∗∗ −0.06 −0.41∗∗∗ 0.02 0.79∗∗∗−0.02 5613 0.10
(0.19) (0.40) (0.08) (0.04) (0.15) (0.07) (0.11) (0.06)Panel B: Minority Owned Subsidiaries
1 year −0.62 −0.11 0.78∗∗∗ −0.10 −0.57∗∗∗−0.05 0.80∗∗∗−0.04 1605 0.08(0.41) (0.51) (0.09) (0.07) (0.21) (0.14) (0.13) (0.10)
2 years −0.52∗ −0.08 0.83∗∗∗ −0.09 −0.46∗∗∗ 0.06 0.80∗∗∗−0.08 3252 0.09(0.31) (0.44) (0.08) (0.06) (0.17) (0.11) (0.12) (0.08)
3 years −0.55∗∗ 0.04 0.89∗∗∗ −0.16∗∗∗ −0.41∗∗∗ 0.07 0.79∗∗∗−0.10 4858 0.10(0.27) (0.40) (0.08) (0.05) (0.15) (0.10) (0.11) (0.07)
Panel C: Sales Relationship Subsidiaries1 year −0.87∗∗−0.11 0.78∗∗∗ 0.02 −0.57∗∗∗ 0.08 0.80∗∗∗ 0.07 1616 0.09
(0.40) (0.51) (0.09) (0.09) (0.21) (0.15) (0.13) (0.10)2 years −0.63∗∗−0.08 0.83∗∗∗ −0.02 −0.46∗∗∗ 0.03 0.80∗∗∗ 0.03 3273 0.09
(0.32) (0.44) (0.08) (0.06) (0.17) (0.11) (0.12) (0.08)3 years −0.54∗∗ 0.04 0.89∗∗∗ −0.08 −0.41∗∗∗ 0.09 0.79∗∗∗ 0.01 4888 0.10
(0.27) (0.40) (0.08) (0.05) (0.15) (0.09) (0.11) (0.07)

Table 7Subsidiary Outcomes
This table reports information about how parent own-ership of subsidiaries changes from the time subsidiarieslist until their last appearance in the data.
Total number of subsidiaries observed 431Parent stake within 5% of listing stake 147Parent increases stake by at least 5%
but does not buy back subsidiary 26Parent buys back subsidiary 109Parent decreases stake by at least 5%
but does not sell entire stake 85of which maintain at least 20% 63of which maintain at least 50% 36
Parent sells entire stake 64

Table 8Reacquisition Announcement Returns
This table reports buyer and target abnormal announcementreturns for subsidiaries reacquired by the parent company or byanother entity affiliated with the parent. Market-adjusted returnscalculated over four different event time windows are reported. Outof 109 reacquisitions in the sample, two have missing announcementdates. In eighteen cases the buyer announces multiple acquisitionson the same day. Four observations of buyer and target returnsare lost due to missing price data. In calculating buyer announce-ment returns, only one observation per announcement is included.Standard errors are reported in parentheses. *, **, and *** denotestatistical significance at 10%, 5%, and 1%, respectively.
[0,0] [-1,0] [-1,1] [-2,2]Panel A: Buyer
0.835∗∗ 0.649∗ 1.803∗∗∗ 1.762∗∗
(0.318) (0.364) (0.616) (0.774)Panel B: Target
1.611∗ 2.492∗∗ 8.561∗∗∗ 9.486∗∗∗
(0.869) (0.956) (1.830) (2.052)