agri benchmark report 2014-1-rice-fao
TRANSCRIPT
Economics of Southeast Asian Rice Production
Bernhard Liese, Somporn Isvilanonda, Khiem Nguyen Tri,
Luan Nguyen Ngoc, Piyatat Pananurak, Romnea Pech, Tin Maung Shwe, Khamsavang Sombounkhanh, Tanja
Möllmann, Yelto Zimmer
Report
2014/1


Summary i
Summary
The purpose of this report is to present and analyze the results from the first round of data
collection in the “Southeast Asian agri benchmark Rice project”. The initial phase of this
initiative was funded and supported by the Food and Agriculture Organization. National agri
benchmark partner research institutions in the participating countries established typical farms
in major rice producing regions of Cambodia, Laos PDR, Myanmar, Thailand and Vietnam.
The report contains basically three main parts: In chapter 2 the frame work conditions for
producing rice in individual countries are presented as well as the key characteristics of the
typical farms which have been established. Chapter 3 is devoted to a cross-country comparison
of key economic parameter while in chapter 4 main conclusions are drawn.
Substantial differences occurred with regard to rice farm gate prices. This is driven mainly by
three factors. First, the price of rice is very much dependent on the variety that is grown.
Second, the technical rice quality has a major impact on the price. Differences in the technical
quality are caused by moisture content of rice at harvest, related infections with fungi time of
harvest and harvest - and threshing techniques. Finally, the location of the typical farm relative
to markets has of course an impact on farm gate prices.
The typical farm data show significant differences within rice production systems. While
Thailand and Vietnam produce more intensively with high yields and high input levels – in
particular as far as the use of fertilizers and seeds is concerned - farms in Cambodia and
Myanmar grow rice more extensively while Laos seems to be in an intermediate level. Most
farms are performing well from an economical point of view.
With regard to the competition on international rice markets the following conclusion can be
drawn: total cost per ton is the lowest in Myanmar and Laos, followed by Vietnam. The Thai
farms are the most expensive one on a per ton basis. Whether or not this advantage in cost of
production implies a competitive edge on international rice markets or not mainly depends on
the quality issues mentioned above. This is because this finding coincides with low farm gate
prices for those farms which are low in cost of production. To the degree the low farm gate
prices reflect quality issues (be it because of taste or technical quality) the low cost of
production is not an immediate advantage. In the course of the research for this project
anecdotal information was received that the quality issues can be that bad that the produce
cannot be sold on international markets at all. Vice versa, the high cost of production for the
Thai farms are less important since – at least up until now – farm gate prices are by far the
highest in this comparison.
The comparison of return to land indicates that the on-farm competitiveness of rice is already
now a very relevant issue. The return to land in corn is as high as for the two rice crops grown
together on one of the Vietnamese farms. A similar situation can be found on the farm in
ii Summary
Myanmar when comparing mung beans with rice. Whether or not this situation may eventually
lead to major and lasting shifts in cropping pattern not only depends on the agronomic
feasibility (is it possible to grow for example corn throughout the year?) and respective political
interventions. In any case it seems to be very important for the growers and institutions in
Vietnam to closely monitor and analyze this issue further. Given the likelihood of increasing rice
surpluses in the entire region the issue of on-farm competitiveness of rice will become even
more important. This is why the Southeast Asian agri benchmark rice network will further invest
in improving the knowledge of the topic.
When looking at return to labor relative to average labor cost it appears that already today this
is a burning issue for the typical farms in Vietnam, Myanmar, and Cambodia. In all these cases
the hourly return to labor is in the same range as current labor cost. This implies that the current
farming structures and systems will have a rather hard time to compete on labor market in
future. This assessment is based on the assumption that the industrial developments in these
countries will lead to ongoing increases in wage rates. In terms of return to labor relative to
wage rates Thai farms performed outstanding, mainly caused by the governmental rice pledging
program.
In order to stay profitable against the background of increasing wage rates it becomes
increasingly important to enhance labor productivity for many Southeast Asian rice producers.
This topic is of high interest for the agri benchmark network and we are going to improve our
knowledge and insights in this topic. In particular the issue of possible obstacles for increased
use of contractor services and options to overcome will become a focal point for us.
The report highlights the fact that all conclusions are preliminary because respective data has
been collected just for the year 2012. Annual farm updates will be conducted in the years to
come and thereby provide the foundation of a more long-term based analysis. Furthermore,
based on the cooperation between GIZ and agri benchmark typical farm data from Indonesia
and the Philippines will be included in this international comparison from 2014 onwards.
Table of content I
Table of content
Summary i
1 Introduction 1
2 Method: The agri benchmark Standard operating procedure 3
3 Farm overview 5
3.1 Thailand – Typical rice production systems 7
3.1.1 Rice in Thailand Economy 7
3.1.2 Rice Farming 7
3.1.3 Socio-economic background 9
3.1.4 Market access 9
3.1.4.1 Market for farm inputs and access to credits 9
3.1.4.2 Domestic paddy and rice markets 10
3.1.5 Price policy measures 11
3.1.6 The selected typical farms 11
3.1.7 Organization and management 12
3.1.8 Production system 12
3.1.8.1 Typical rain-fed rice farm 12
3.1.8.2 Typical irrigated rice farm 14
3.1.9 Cost structure, revenue and economic performance 16
3.1.9.1 Typical rain-fed rice farm 16
3.1.9.2 Typical irrigated rice farm 17
3.2 Vietnam: Typical rice production systems 18
3.2.1 The selected region 18
3.2.2 Social-economic background 20
3.2.3 Market linkages 21
3.2.4 Policy measures 21
3.2.5 The typical farm 22
3.2.6 Organization and management 23
3.2.7 Cropping and production system 24
3.2.8 Cost structure and economic performance 26
3.3 Cambodian Rice Production System: A typical farm analysis 28
3.3.1 The selected region 28
3.3.2 Social-economic background 28
3.3.3 Policy measures 29
3.3.4 The typical farm 29
3.3.5 Organization and management 30
3.3.6 Cropping and production system 30
3.3.7 Cost structure and economic performance 30
II Table of content
3.4 Lao PDR: Typical rice production systems 32
3.4.1 The selected region 32
3.4.2 Socio-economic background 33
3.4.3 Market linkages 33
3.4.4 Policy measures 35
3.4.5 The typical farm 35
3.4.6 Organization and management 35
3.4.7 Cropping and production system 35
3.4.8 Cost structure and economic performance 36
3.5 Myanmar Rice Production System: A typical farm analysis 37
3.5.1 The selected region 37
3.5.2 Social-economic background 39
3.5.3 Market linkages 39
3.5.4 Policy measures 40
3.5.5 The typical farm 41
3.5.6 Organization and management 42
3.5.7 Cropping – and production system 42
3.5.8 Cost structure and economic performance 43
4 Cross country farm comparison 45
5 Conclusion and outlook 57
6 References 59
7 Published agri benchmark Working Papers 61

List of Tables III
List of Tables
Table 1: Typical farms in the selected countries and their production systems 5
Table 2: Thailand: Areas planted with rice and production by crop seasons in 1967,
1987 and 2012 7
Table 3: Thailand: Total labor force in agriculture and rice labor force in 1973-1977
and 2003-2007 9
Table 4: Thailand: Components of small scale household income in 2009 9
Table 5: Thailand: Characteristics of the typical rain-fed rice farm 13
Table 6: Thailand: Field work in a crop season of the typical rain-fed rice farm 13
Table 7: Thailand: Characteristics of irrigated typical rice farm 14
Table 8: Thailand: Field work in a crop season of the typical irrigated rice farm 15
Table 9: Thailand: Cost structure and economic performance of the typical rain fed
farm in 2012 16
Table 10: Thailand: Cost structure and economic performance of the typical irrigated
farm in 2012 17
Table 11: Vietnam: Main crops in Southeast region in 2012. Planted area in thousand ha 20
Table 12: Vietnam: Farmers' income from different sources − Survey results (n=117) in
Mekong River Delta in VND per month and person; Exchange rate: 16700
VND = 1 $ USD 23
Table 13: Vietnam: Cropping schedule at the typical farm VN3LM for wet season rice
in 2012 25
Table 14: Vietnam: Cost structure and economic performance of the typical farm in
Dong Nai province in 2012 26
Table 15: Vietnam: Cost structure and economic performance of the typical farm in
Mekong Delta region in 2012 27
Table 16: Cambodia: Cost structure and economic performance of the typical farm in
2012 31
Table 17: Lao PDR: Cost structure and economic performance of the typical farm in
2012 36
Table 18: Myanmar: Cost structure and economic performance of the typical farm in
2012 43
Table 19: Return to labor and average wages in USD per h 55

List of Figures IV
List of Figures
Figure 1: Economic terms agri benchmark 4
Figure 2: Overview of the selected SEA countries and the location of the selected
typical farms 6
Figure 3: Thailand: Overview of Thailand and the two selected typical farms 8
Figure 4: Thailand: The rice marketing channels 11
Figure 5: Vietnam: Schematic map of agro-ecological zones and development of rice
areas. Typical rice farm are established in Southeast region (No 5) and
Mekong River Delta (No 6) 19
Figure 6: Vietnam: Rising MKD output equals rising export in thousand tons 20
Figure 7: Vietnam: Overview of Vietnam and the two selected typical farms 22
Figure 8: Vietnam: Rice based cropping pattern for Southeast - and Mekong Delta
regions including annual rainfall and temperature 24
Figure 9: Cambodia: Overview of Cambodia and the selected typical farm 29
Figure 10: Lao PDR: Overview of Lao PDR and the selected typical farm 32
Figure 11: Lao PDR: Rice value chain 34
Figure 12: Myanmar: Overview of Myanmar and the selected typical farm 38
Figure 13: Myanmar: Rice value chain 40
Figure 14: Yield in t per ha in 2012 45
Figure 15: Crop establishment cost in USD per ha in 2012 46
Figure 16: Fertilizer applied in kg per ha in 2012 47
Figure 17: Operating cost in USD per ha in 2012 48
Figure 18: Key cost elements in USD per ha in 2012 50
Figure 19: Total cost and gross revenue in USD per t in 2012* 51
Figure 20: Return to land (profit plus land cost) in USD per ha in 2012 53
Chapter 1 Introduction 1
1 Introduction
Recently, the Association of Southeast Asian Nations (ASEAN) has been heading towards a free
trade agreement with regard to goods, service and capital. The ASEAN Economic Community
(AEC) aims to create a single market and production base between the highly competitive
economic regions to integrate markets fully into the global economy.
Those objectives imply major changes in the economic framework conditions. In the sector of
farm products and crops, they will lead to increased competition and trade between AEC
countries. AEC is going to have a significant impact on local farms. This includes opportunities as
well as threats to farmers.
The most important crop grown in Southeast Asia is rice. For a large proportion of the
population it is their staple food. In less developed countries many rural households depend on
rice farming as their main source of income and as their livelihood. As alternative employment
and income in the countryside are scarce growing rice on a small farm provides a basic nutrition
level for the whole family and thus survival instead of starvation. Luckily, things are changing. In
many countries some family members have other jobs and provide additional income for the
family. Examples are Thailand and Vietnam, where usually more than 50 % of the household’s
income is provided through off-farm earnings. Especially modern machinery and techniques
used in export nations, as latter countries, result in high productivity.
Understanding key factors, driving forces, and limitations of rice production under the dynamics
of the global rice markets are the objective of the established “Southeast Asian agri benchmark
rice network”.
The Food and Agriculture Organization of the United Nations (FAO) commissioned the Thünen
Institute of Farm Economics (TI) to connect institutions from Thailand, Vietnam, Cambodia,
Myanmar and Laos to build up an expert network of rice production economists. The first aim of
the network is to establish a data base of economic indicators and production figures from
typical rice farms in the countries. The data base will serve as a basis for economic analysis and
cross country comparisons.
To improve decision making for farmers, agribusiness and policy makers, it is necessary to
understand the key forces driving regional rice production. This requires further annual updates
of the data base and more detailed analysis and strategic discussions with the local experts and
farmer groups.
With this report the agri benchmark SEA rice network supplies the typical farm data set (2012)
and initial analysis as a basis for detailed understanding of different production systems, cost
structures and characteristics of main rice producing regions.


Chapter 2 Method 3
2 Method: The agri benchmark Standard operating procedure
The process of data collection has been done in all countries according to agri benchmark’s
“Standard operating procedure”:
Partner, who were conducting the data set for the first time (Myanmar, Laos, Cambodia) got
support and assistance from the Asian coordinator of the agri benchmark rice network during
the entire data collection process. Data collection has been done together with local advisors
and or representatives from the extension centers in the selected regions as well as farmers
knowing the region, the farms and the production systems. agri benchmark uses the so-called
‘panel’ (focus group) consisting of the responsible scientist, an advisor and one to ten farmers.
The panel is a round table meeting where all required farm data are collected based on a
standard questionnaire respectively an ACCESS based data tool (TYPICROP). The panel creates a
consensus on each figure to properly describe how a typical farm looks like. The most frequent
question raised in the panel is: „Can this figure be considered typical for the type of farm we
want to describe?”. Depending on the status of the farm data set and the quality of the provided
data, one to two focus group meetings are necessary to edit the full farm data set. Farmers
involved have to run farms themselves which are similar to the envisaged typical farm.
The typical farm data sets were discussed and checked carefully with the partners and local
experts. However, the improvement and validation of the farm data is an ongoing process,
particularly for the newly established typical farms in Cambodia, Myanmar, and Laos.
Detailed information about the “Standard operating procedure (SOP)” of establishing typical
farm data sets can be found on the agri benchmark webpage
(http://www.agribenchmark.org/agri-benchmark/value-and-approach.html).
In order to be able to come up with a figure for total cost of production for individual crops, a
number of economic assumptions and definitions are relevant:
Depreciation is calculated by using repurchase prices for machinery and buildings, which is how
much a certain item would cost when bought today. The depreciation period is defined by the
national partners by applying usual economic lifetimes of capital goods. The depreciation for tax
reasons does play no role. The depreciation is calculated straight linear.
Working hours for permanent staff include field work as well as other farm activities and added
up to annual working hours per worker. Family labor is valued according to estimated
opportunity cost: what would a typical grower be able to earn outside his farm if he/she would
decide to quit farming? Cost for hired labor is including social security payments as well as any
insurance directly related to the individual labor force.
4 Chapter 2 Method
Land cost equals the sum of land rents actually paid per hectare times the share of rented land
in total arable land plus the average opportunity cost for family owned land times the share of
owned land in total arable land. Economic cost of family owned land is priced according to the
most recent land rents in the typical region
Fix costs such as labor cost or machinery cost is allocated in two ways: (a) when production
system data is available, machine runtime-hours are used to allocate this cost to individual
crops; (b) for data sets without production system information, allocation is done by using
return shares of the crops. The latter concept is always used in order to allocate overhead cost
such as building cost or accounting.
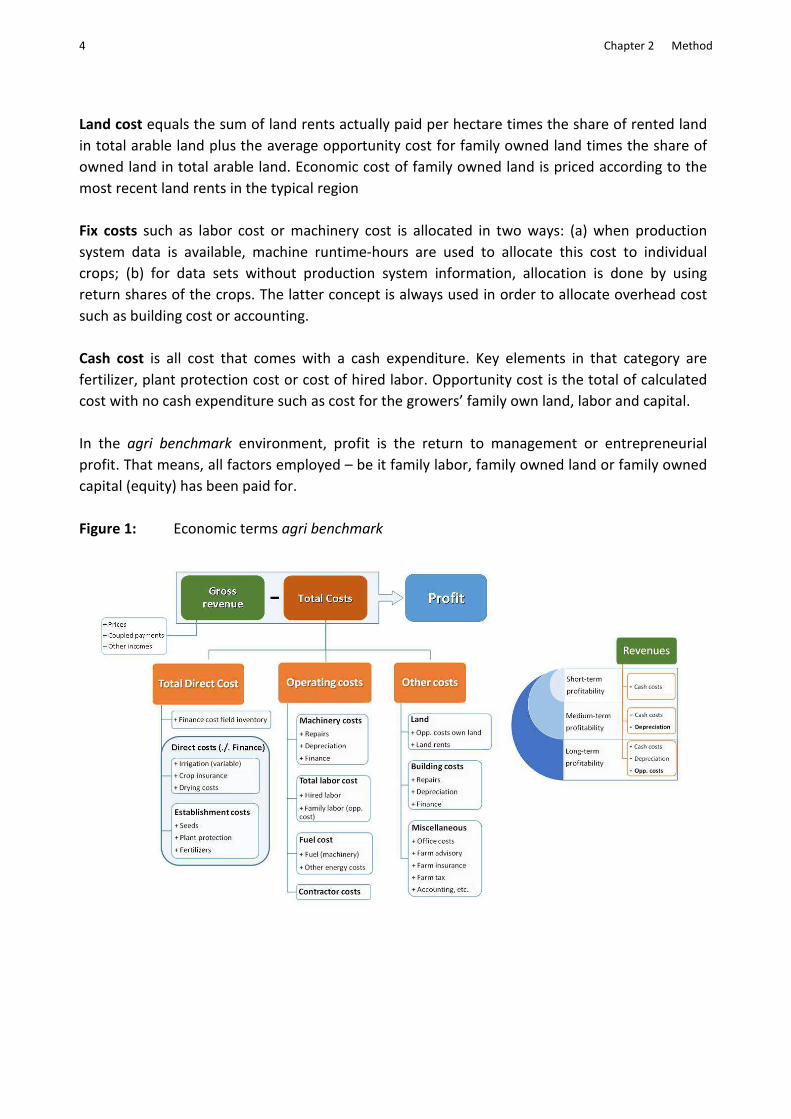
Cash cost is all cost that comes with a cash expenditure. Key elements in that category are
fertilizer, plant protection cost or cost of hired labor. Opportunity cost is the total of calculated
cost with no cash expenditure such as cost for the growers’ family own land, labor and capital.
In the agri benchmark environment, profit is the return to management or entrepreneurial
profit. That means, all factors employed – be it family labor, family owned land or family owned
capital (equity) has been paid for.
Figure 1: Economic terms agri benchmark
Chapter 3 Farm overview 5
3 Farm overview
With the help of the regional FAO office for Asia and the Pacific, a cooperation of rice economists
from Cambodia, Laos, Myanmar, Thailand, and Vietnam was established. Together with the
national partner statistics were inspected to gather knowledge about regional average farm data
as a basis for the design of the regional typical farms. Depending on the length of the partnership
one or two typical farms have been established and the respective data set has been collected.
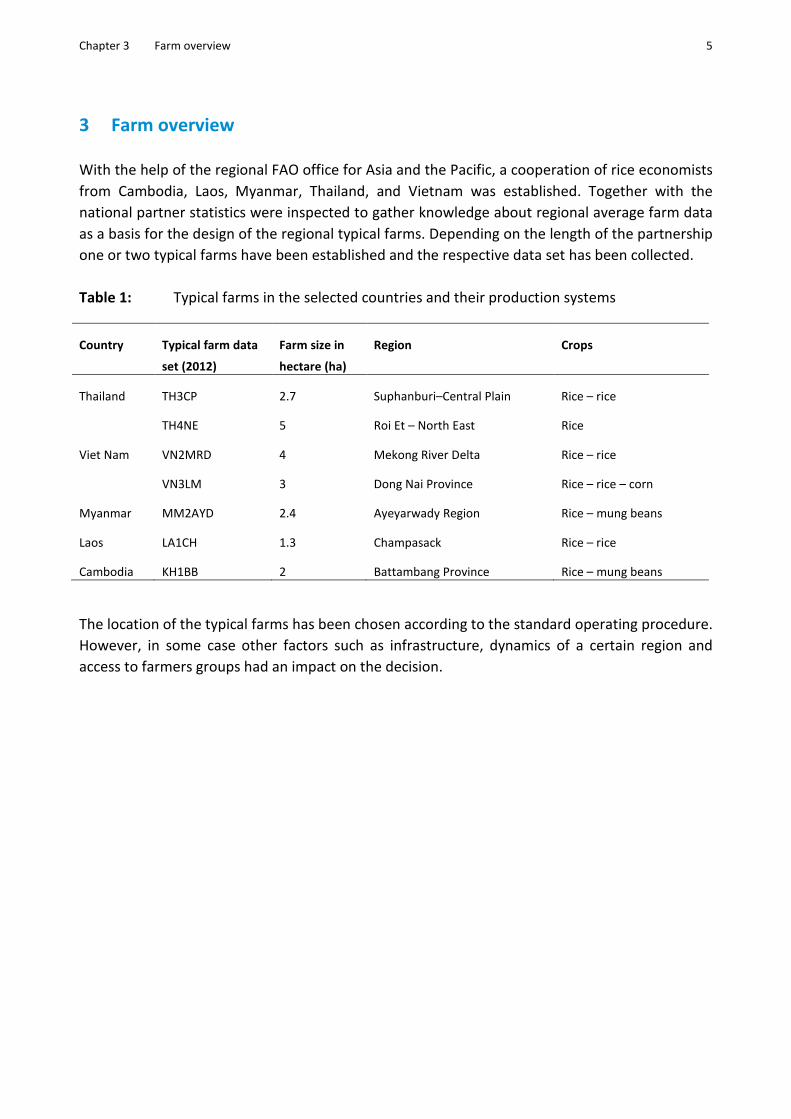
Table 1: Typical farms in the selected countries and their production systems
Country Typical farm data
set (2012)
Farm size in
hectare (ha)
Region Crops
Thailand TH3CP 2.7 Suphanburi–Central Plain Rice – rice
TH4NE 5 Roi Et – North East Rice
Viet Nam VN2MRD 4 Mekong River Delta Rice – rice
VN3LM 3 Dong Nai Province Rice – rice – corn
Myanmar MM2AYD 2.4 Ayeyarwady Region Rice – mung beans
Laos LA1CH 1.3 Champasack Rice – rice
Cambodia KH1BB 2 Battambang Province Rice – mung beans
The location of the typical farms has been chosen according to the standard operating procedure.
However, in some case other factors such as infrastructure, dynamics of a certain region and
access to farmers groups had an impact on the decision.
6 Chapter 3 Farm overview
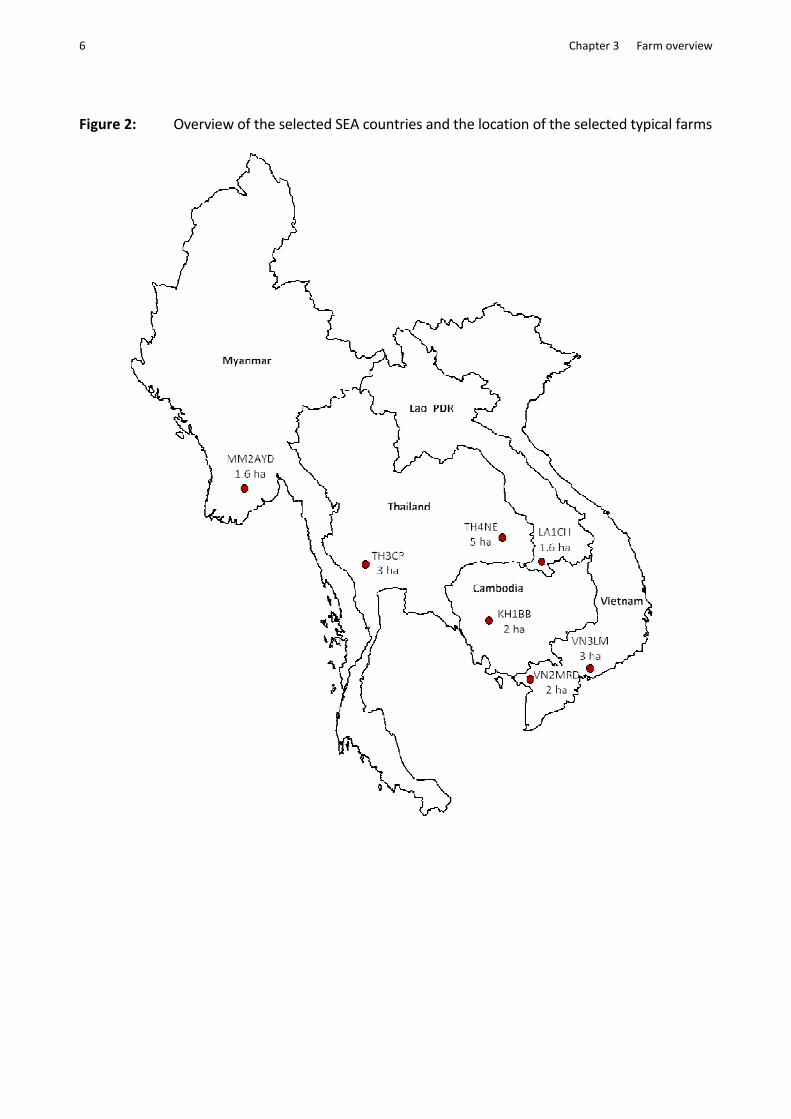
Figure 2: Overview of the selected SEA countries and the location of the selected typical farms

Chapter 3 Farm overview 7
3.1 Thailand – Typical rice production systems
3.1.1 Rice in Thailand Economy
Rice is a dominant sub-sector of Thailand’s agricultural economy and has also long been an
important source of the country’s export earnings. With a rapid economic progress in non-
agricultural sectors over the past few decades, the importance of rice has been declining along
with the agricultural sector. But agriculture, particularly the rice sub-sector, is still the dominant
economic activity in rural Thailand. Rural resources, particularly land and labor, are mainly used
in rice production. Recently, rice crop accounts for almost one-third of the total value from crop
production. Other important crops are sugarcane, cassava, and para-rubber. Nowadays, the
annual rice production is about 24 million tons of milled rice. One third of the production was
exported. As a consequence, Thailand is one of the major exporters in the international rice
market. In 2012, it generated an export of around 147 billion THB (1 USD = 32 THB) (Office of
Agricultural Economic, 2013).
3.1.2 Rice Farming
Thailand’s rice production area is 13.28 million ha or about 55.6% of the total agricultural area.
From 1967 to 2012, rice production nearly quadrupled. Progress in irrigation in combination with
a dissemination of modern rice varieties (MVs) has improved Thailand rice productivity and rice
cropping intensity.
Table 2: Thailand: Areas planted with rice and production by crop seasons in 1967, 1987
and 2012
year Planted area (million ha) Production (million ton of paddy)
Wet season Dry season Total Wet season Dry season Total
1967 7.43 0.04 7.47 13.73 0.06 13.79
1987 9.27 0.58 9.85 16.27 2.77 19.04
2012 10.40 2.88 13.28 25.87 12.22 38.09
Source: Data from Agricultural Statistic of Thailand Year Book 1967, 1987, and 2012, Office of Agricultural Economic,
Ministry of Agriculture and Cooperative
Geographically, Thailand is divided into 4 main regions, North, Northeast, Center, and South. Rice
is grown throughout the country, but Northeast, North, and Central Plain are the most important
rice growing regions with shares of 49.1 %, 25.4 %, and 22.3 %, respectively (Table 2). In terms of
rice production systems, the rain-fed system is the most common. It accounts for nearly 74 % of
the total rice area. Water scarcity has prevented the development of irrigation system,
particularly in the Northeast region. In the Northeast, subsistent farming is commonly found in
this production environment with one annual rice crop. Frequently, traditional varieties,

8 Chapter 3 Farm overview
particularly Jasmine or KDML 105, are used. Even though the quality is high, the rice yield is low,
it amounts only to approximately 2 tons per ha.
Commercial rice production is mostly concentrated in the irrigated areas of the Central Plain and
lower northern regions. Modern rice varieties are commonly grown in this environment. At least,
two crops of rice or five crops in 2 years are largely found in the regions with high yield (4 ton per
ha), as it is the case in the location of the two selected typical farms in the Central Plain (TH3CP)
and the North East (TH4NE).
Figure 3: Thailand: Overview of Thailand and the two selected typical farms
Progress in non-farm sector development over the past few decades has improved employment
opportunities and induced rural labor migration from farms to the cities and sent-home
remittances. Table 3 shows that the labor force in rice production has significantly declined from
47.5% to 27.1%.
Chapter 3 Farm overview 9
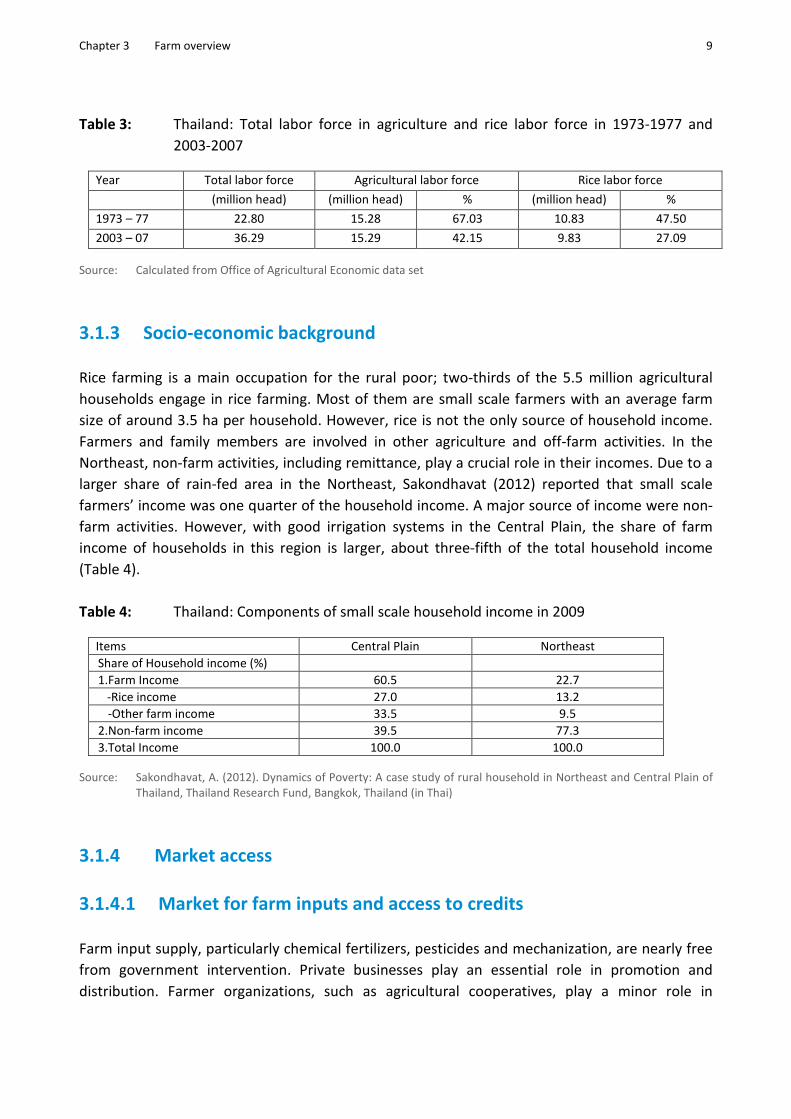
Table 3: Thailand: Total labor force in agriculture and rice labor force in 1973-1977 and
2003-2007
Year Total labor force Agricultural labor force Rice labor force
(million head) (million head) % (million head) %
1973 – 77 22.80 15.28 67.03 10.83 47.50
2003 – 07 36.29 15.29 42.15 9.83 27.09
Source: Calculated from Office of Agricultural Economic data set
3.1.3 Socio-economic background
Rice farming is a main occupation for the rural poor; two-thirds of the 5.5 million agricultural
households engage in rice farming. Most of them are small scale farmers with an average farm
size of around 3.5 ha per household. However, rice is not the only source of household income.
Farmers and family members are involved in other agriculture and off-farm activities. In the
Northeast, non-farm activities, including remittance, play a crucial role in their incomes. Due to a
larger share of rain-fed area in the Northeast, Sakondhavat (2012) reported that small scale
farmers’ income was one quarter of the household income. A major source of income were non-
farm activities. However, with good irrigation systems in the Central Plain, the share of farm
income of households in this region is larger, about three-fifth of the total household income
(Table 4).
Table 4: Thailand: Components of small scale household income in 2009
Items Central Plain Northeast
Share of Household income (%)
1.Farm Income 60.5 22.7
-Rice income 27.0 13.2
-Other farm income 33.5 9.5
2.Non-farm income 39.5 77.3
3.Total Income 100.0 100.0
Source: Sakondhavat, A. (2012). Dynamics of Poverty: A case study of rural household in Northeast and Central Plain of
Thailand, Thailand Research Fund, Bangkok, Thailand (in Thai)
3.1.4 Market access
3.1.4.1 Market for farm inputs and access to credits
Farm input supply, particularly chemical fertilizers, pesticides and mechanization, are nearly free
from government intervention. Private businesses play an essential role in promotion and
distribution. Farmer organizations, such as agricultural cooperatives, play a minor role in
10 Chapter 3 Farm overview
providing and distributing those inputs. Even if input supply availability is at the district level,
traders may offer short term loans to promote their goods.
In the past, the farm credit market was dominated by informal lenders, particularly middlemen,
rice millers, and land owners, charging very high interest rates. Government policy on improving
formal farm credit was implemented in 1975. In order to increase formal lending institutions and
credit availability, the Bank of Thailand (BOT) instructed all commercial banks to allocate 5% of
their available loan supply for agricultural credits at the government announcing interest rate,
which is lower than the market rate. Since then, supply rates have increased every year. By this
policy, the amount of formal agricultural credit supply raised from 2,893 million THB (or US$93
million) in 1975 to 55,523 million THB (or US$ 1,735 million) in 1984 (Isvilanonda and
Poapongsakorn, 1995). Presently, the Bank of Agricultural and Agricultural Cooperative (BAAC)
plays a major role in providing farm credits. Throughout the country, they establish 2,098
branches and provide credits of about US$ 20 million covering 4.7 million farm households and
1,097 agricultural cooperatives. The interest rate for farmer loans is 7%.
3.1.4.2 Domestic paddy and rice markets
Before a massive intervention of the paddy market by the government in October 2011, the
domestic price trend broadly followed the world rice market. Since October 2011 the
government had implemented a rice pledging program, where farmers obtained prices which
were 40% above market price.
After harvesting, paddy is distributed through farmer institutions, central paddy markets, and
local assemblers before it is channeled to the rice mills for milled rice. In Thailand, small scale rice
mills are mostly established in the villages or communities. Nonetheless, medium and large rice
mills are located in districts or trading routs. Most medium and large rice mills belong to the
private sector with a high milling capacity of at least 200 tons a day (Isvilanonda, 2010).
Agricultural cooperatives in some areas also own rice mills, but their capacities are small, about
20-60 tons a day (Figure 4 is modified from Isvilanonda, 2010).
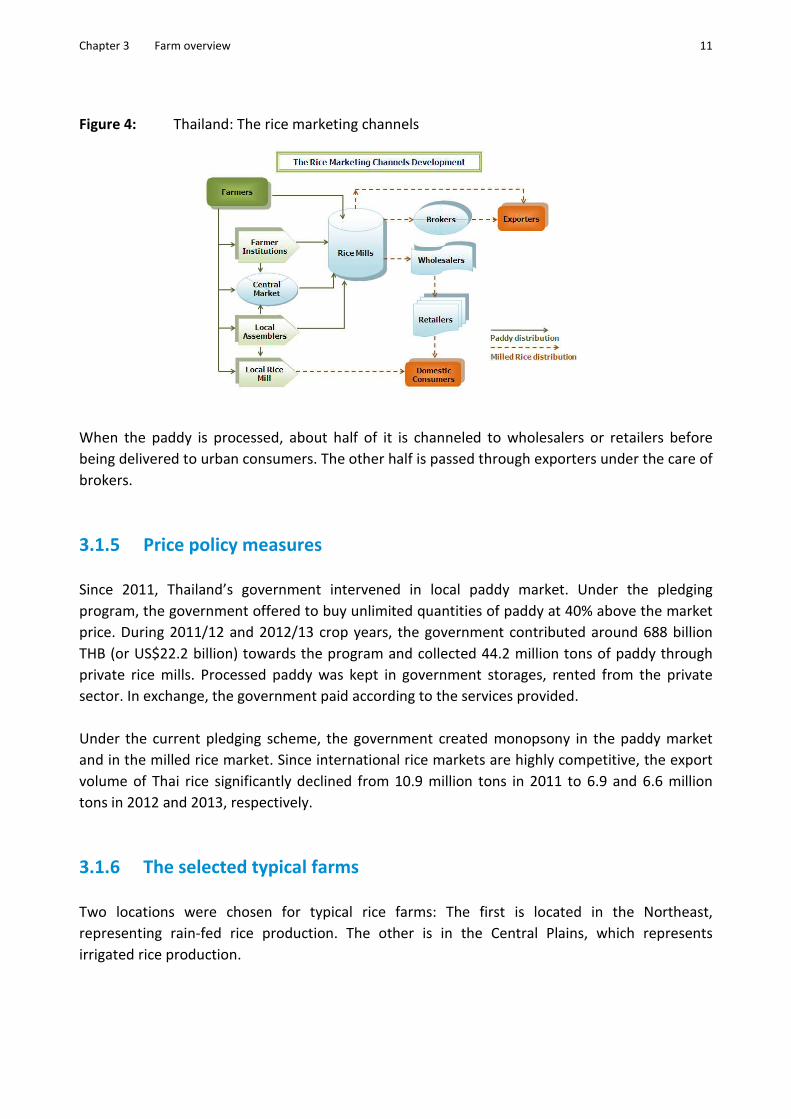
Chapter 3 Farm overview 11
Figure 4: Thailand: The rice marketing channels
When the paddy is processed, about half of it is channeled to wholesalers or retailers before
being delivered to urban consumers. The other half is passed through exporters under the care of
brokers.
3.1.5 Price policy measures
Since 2011, Thailand’s government intervened in local paddy market. Under the pledging
program, the government offered to buy unlimited quantities of paddy at 40% above the market
price. During 2011/12 and 2012/13 crop years, the government contributed around 688 billion
THB (or US$22.2 billion) towards the program and collected 44.2 million tons of paddy through
private rice mills. Processed paddy was kept in government storages, rented from the private
sector. In exchange, the government paid according to the services provided.
Under the current pledging scheme, the government created monopsony in the paddy market
and in the milled rice market. Since international rice markets are highly competitive, the export
volume of Thai rice significantly declined from 10.9 million tons in 2011 to 6.9 and 6.6 million
tons in 2012 and 2013, respectively.
3.1.6 The selected typical farms
Two locations were chosen for typical rice farms: The first is located in the Northeast,
representing rain-fed rice production. The other is in the Central Plains, which represents
irrigated rice production.

12 Chapter 3 Farm overview
Soil characteristics of the rain-fed rice typical farm are mostly sandy soils with poor endowed soil
fertility and with limited capacity to retain water. Moreover rainfall is erratic with a high annual
variability. A selected typical farm in the region is more subsistent, than business farms. Rice is
not only grown for household income, but also for its food security. Other crops grown on farm
are backyard gardened vegetables and fruit trees. Swine and poultry are found in households to
supplement income. Other sources of household income come from non-farm employments and
remittances from family members, who work in cities.
For the typical irrigated rice farm, the soil characteristic is loamy with a good irrigation system, as
water is abundant throughout the whole year. Rice farming in this production region is relatively
more commercial than that in the rain-fed region, which means that the rice is almost directly
sold after the harvest to the market and only a little share is kept for the household food
consumption. Besides rice, fruit trees, such as mango and coconut trees, are grown as a backyard
garden for household food and income. Off-farm and remittance incomes are other components
of household incomes.
3.1.7 Organization and management
A farmer in rain-fed rice typical farm owns the land with a title deed. While only half of the total
farm land is owned on the typical irrigated rice farm, some further plots are rented. Both, heads
and family members of the households of rain-fed and irrigated farms, who participate on the
full-time work in the rice fields, sometimes work as a part-time laborer. Due to urban area
expansion, most of their family members were employed in non-farm sector.
With regard to farm credit, the rain-fed rice typical farm received a smaller loan of 50,000 THB
from BAAC at an interest rate of 7 %. The farmer also obtained a short term loan from the village
fund of 11,000 THB, with an interest rate of 6 %. Whereas, the typical irrigated rice farm has a
total debt of 250,000 THB. One-fifth of this debt was borrowed, at an 8.5 % interest rate from
BAAC to buy farm input. The major debt was an intermediate term obtained from an agricultural
cooperative. The farmers use this loan for instance to buy a pick up for both farm and household
transportations.
3.1.8 Production system
3.1.8.1 Typical rain-fed rice farm
The newly established typical farm depends on precipitation. The farm size is about 5 ha. Usually,
photoperiod sensitive varieties are grown in the region, particularly KDML 105 and RD15, which
are aromatic high quality rice. The average yield of these varieties is comparatively low with 2.86
ton per ha (Table 5). Land preparation is done by a hired contractor with a 4-wheel tractor for the
Chapter 3 Farm overview 13
first plowing. The second plowing is done by family labor with their own power tiller. To save
production cost, farmers usually keep their seed from the previous year. Most local farmers use
the dry direct seeding method. In a crop season, chemical fertilizer is applied three times: before
broadcasting, 40 days after broadcasting, and 90 days after broadcasting.
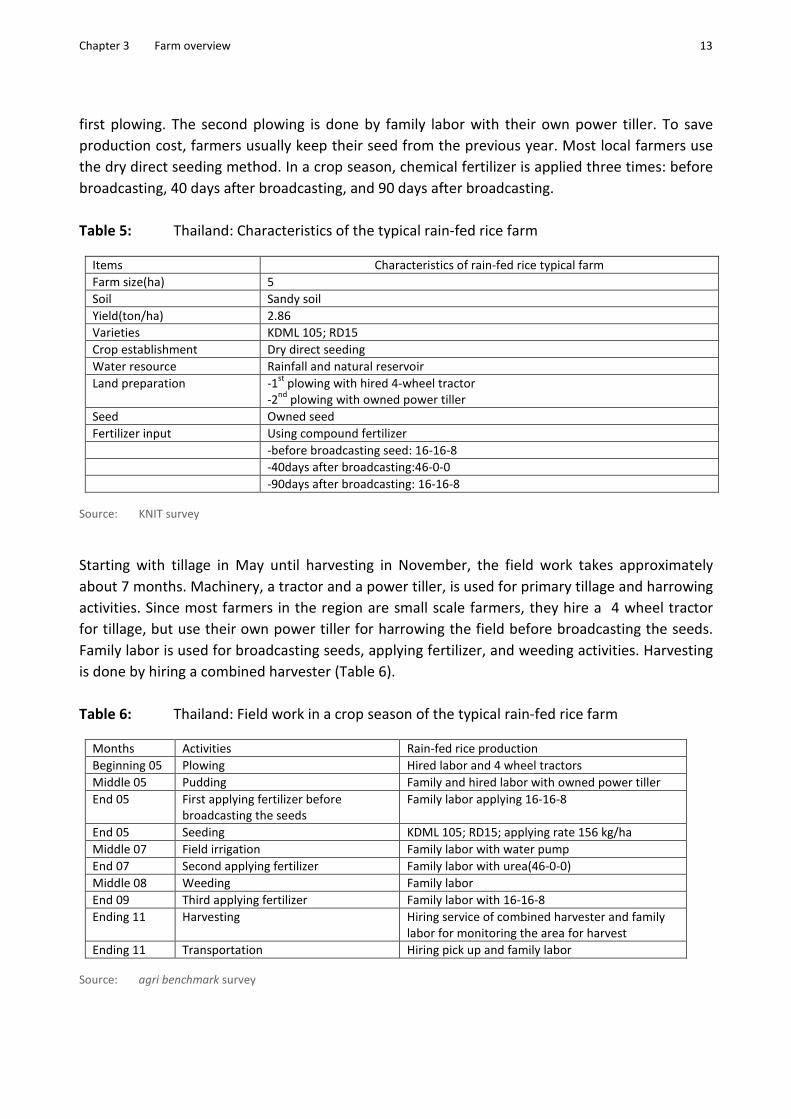
Table 5: Thailand: Characteristics of the typical rain-fed rice farm
Items Characteristics of rain-fed rice typical farm
Farm size(ha) 5
Soil Sandy soil
Yield(ton/ha) 2.86
Varieties KDML 105; RD15
Crop establishment Dry direct seeding
Water resource Rainfall and natural reservoir
Land preparation -1st
plowing with hired 4-wheel tractor
-2nd
plowing with owned power tiller
Seed Owned seed
Fertilizer input Using compound fertilizer
-before broadcasting seed: 16-16-8
-40days after broadcasting:46-0-0
-90days after broadcasting: 16-16-8
Source: KNIT survey
Starting with tillage in May until harvesting in November, the field work takes approximately
about 7 months. Machinery, a tractor and a power tiller, is used for primary tillage and harrowing
activities. Since most farmers in the region are small scale farmers, they hire a 4 wheel tractor
for tillage, but use their own power tiller for harrowing the field before broadcasting the seeds.
Family labor is used for broadcasting seeds, applying fertilizer, and weeding activities. Harvesting
is done by hiring a combined harvester (Table 6).
Table 6: Thailand: Field work in a crop season of the typical rain-fed rice farm
Months Activities Rain-fed rice production
Beginning 05 Plowing Hired labor and 4 wheel tractors
Middle 05 Pudding Family and hired labor with owned power tiller
End 05 First applying fertilizer before
broadcasting the seeds
Family labor applying 16-16-8
End 05 Seeding KDML 105; RD15; applying rate 156 kg/ha
Middle 07 Field irrigation Family labor with water pump
End 07 Second applying fertilizer Family labor with urea(46-0-0)
Middle 08 Weeding Family labor
End 09 Third applying fertilizer Family labor with 16-16-8
Ending 11 Harvesting Hiring service of combined harvester and family
labor for monitoring the area for harvest
Ending 11 Transportation Hiring pick up and family labor
Source: agri benchmark survey

14 Chapter 3 Farm overview
3.1.8.2 Typical irrigated rice farm
The size of the irrigated farm is slightly smaller than of the rain-fed farm. The varieties grown in
the irrigated area are mostly non-photoperiod sensitive varieties, such as RD 47 and Pathumthani
1. Due to good water control in irrigated areas, the yield is about 5.6 ton per ha, which is nearly
double of that in rain-fed rice typical farm (Table 7). Land preparation is done by hiring a 4-wheel
tractor for the first plowing. The second plowing is done by family with owned power tiller.
Farmers in this area prefer to buy seeds instead of keeping seeds from the previous crop-cycle to
avoiding mixing-up of different varieties. Dry direct seeding method is widely used by most of the
farmers in the region. During the crop season three fertilizer applications are done: before
broadcasting, 30 days after broadcasting and 65 days after broadcasting.
Table 7: Thailand: Characteristics of irrigated typical rice farm
Items Characteristics of irrigated rice typical farm
Farm size(ha) 4.3
Soil Loamy soils
Yield(ton/ha) 5.6
Varieties RD 47 and Pathumthani 1
Crop establishment Pre-germinated direct seeding
Water resource Irrigation system by gravitation
Land preparation -1st
plowing with hired small tractor
- plowing with owned power tiller
Seed Buying seed
Fertilizer input Using compound fertilizer
-30 days after broadcasting the seeds: 46-0-0 and 16-20-0
-65 days after broadcasting:16-20-0
Source: KNIT survey
The wet season crop cycle in the irrigated area starts in October and ends in January of the next
calendar year. After that the dry season starts in May and harvest takes place in August. A small
tractor is hired for plowing, followed by a second tillage operation using the own power tiller.
Family and hired labor are used for broadcasting the seeds, applying fertilizer, spraying
insecticide and fungicide and weeding activities. Harvesting is done by hiring a combined
harvester (Table 8).

Chapter 3 Farm overview 15
Table 8: Thailand: Field work in a crop season of the typical irrigated rice farm
Months
wet season
Activities Irrigated rice production Months dry
season
Beginning 10 Tillage Hired labor with small tractor Beginning 05
Beginning10 Harrowing and puddling Family with owned power tiller Beginning05
Middle 10 Seeding RD47 and PathumThani 1; 174kg/ha Middle 05
Middle 10 Herbicide #1 Hired labor Middle 05
Ending 10 Herbicide #2 Family labor Ending 05
09-10 Field irrigation Family labor with water pump 05-06
Middle 11 Insecticide+ fungicide #1 Hired labor Middle 06
Middle 11 Fertilizer #1 Hired labor applying 46-0-0 and 16-20-0 Middle 06
Beginning 12 Fertilizer #2 Hired labor applying 16-20-0 Beginning 07
Middle 12 Insecticide+ fungicide #2 Family labor Middle 07
Middle 01 Insecticide+ fungicide
+hormone#3
Family labor Middle 08
Middle 01 Weeding Hired labor Middle 08
Ending 01 Harvesting + transportation Hired labor with combined harvester and
truck
Ending 08
Source: agri benchmark survey

16 Chapter 3 Farm overview
3.1.9 Cost structure, revenue and economic performance
3.1.9.1 Typical rain-fed rice farm
The following table gives an overview of basic farm cost structures and related economic
performance in the national currency ‘Thai Baht’.
Table 9: Thailand: Cost structure and economic performance of the typical rain fed farm in
2012
Farm: TH4NE
Year: 2012
Exchange rate in 2012: 1 USD = 32 THB
Unit Total Wet Season Rice
Acerage ha 5 5
Yield t/ha --- 2.86
Market price THB/t --- 20,000
Market revenue THB/ha --- 57,140
other revenues THB/ha --- 0
Gross Revenue THB/ha 283,414 57,140
Seed total THB/ha 15,500 3,125
Fertilizer total THB/ha 56,696 11,431
Plant protection total THB/ha 0 0
Contract worker (crop related) THB/ha 28,902 5,827
Total direct costs THB/ha 101,098 20,383
Total number of workers --- 2 (including family labor)
Work volume per year h 1,000 (including family labor)
Machinery Quantity Purchase value Depriciation p.a.
2-wheeled tractor 1 48,000 1,759
Selfpropelled machinery 3 69,000 4,629
Buildings 2 25,000 2,000
Annual depreciation THB 8,388
On the farm TH4NE only one crop is grown per year, as it is dependent on precipitation. The rice
variety used is of excellent quality, but is low yielding and takes a long time to grow. Despite that,
it can be sold for a high price. The applied amounts of fertilizer were around 75 kg pure nitrogen,
25 kg pure phosphorus and 10 kg potassium per ha. Instead of using herbicides against weeds,
weeding was done manually by the farmers. Contractors were used for the operations ploughing,
seedbed preparation, harvesting and transporting. Only two family workers were engaged with
on farm work resulting in a workload of 1.000 h per year. The three self-propelled machines were

Chapter 3 Farm overview 17
a water pump, sprayer and, motorcycle for transportation. The two buildings are storage
facilities.
3.1.9.2 Typical irrigated rice farm
After having a look at the rainfed typical farm, the following table provides an overview of the
irrigated farm and its related cost structures and economic performance in the national currency
‘Thai Baht’.
Table 10: Thailand: Cost structure and economic performance of the typical irrigated farm in
2012
Farm: TH3CP
Year: 2012
Exchange rate in 2012: 1 USD = 32 THB
Unit Total Dry Season Rice Wet Season Rice
Acerage ha 5,4 2,7 2,7
Yield t/ha --- 5,60 5,56
Market price THB/t --- 12.000 13.000
Market revenue THB/ha --- 67.200 72.280
other revenues THB/ha --- 0 0
Gross Revenue THB/ha 376.596 67.200 72.280
Seed total THB/ha 22.426 4.153 4.153
Fertilizer total THB/ha 42.004 7.779 7.779
Plant protection total THB/ha 17.560 3.252 3.252
Contract worker (crop related) THB/ha 28.377 5.255 5.255
Total direct costs THB/ha 110.367 20.438 20.438
Total number of workers --- 20 (including family labor)
Work volume per year h 1.583 (including family labor)
Machinery Quantity Purchase value Depriciation p.a.
Selfpropelled machinery 6 248.000 22.265
Buildings 1 2.000 1.000
Annual depreciation THB 23.265
On the farm TH3CP rice is grown twice a year. The direct cost for both crops were identical, as
the same amounts of fertilizers and chemicals were applied and contract worker were hired to
perform the same operations. Around 70 kg pure nitrogen and 45 kg pure phosphorus were
applied per ha. Operations done by contractors included plowing, harvesting and transportation.
Of the total number of 20 workers, 19 were only hired seasonal during different operations, such
as weeding, seeding and during the application of fertilizers and chemicals. The farmer owned six
18 Chapter 3 Farm overview
different self-propelled machines: a sprayer machine, a plow with two wheels, a fertilizer sprayer,
a pickup, a water pump, and a motorcycle. The building is used to store equipment.
When comparing the two farms in Thailand, the differences in yield and market price per ton
strike the eye. Market prices of the low yielding variety on the TH4NE farm are one third higher
than on the TH3CP farm. Ten times more workers were hired on the TH3CP farm compared to
TH4NE. This results in an approximately 50 % higher work volume per year. The reason for this
substantial volume of work was that the TH3CP farm applied chemicals and fertilizers more than
once and in addition weeding was done manually, even though herbicides had earlier been
applied during the growth phases of both crops. But, with regard to the two grown crops on the
TH3CP farm and the resulting yield of both crops, it is necessary to mention that the labor
productivity (product per h work) is higher on this farm than on TH4NE.
3.2 Vietnam: Typical rice production systems
3.2.1 The selected region
Rice is the most important crop in Vietnam with a growing area of 7.4 million ha and an average
productivity of 5.6 ton per ha. Figure 5 shows the six different agro-ecological regions throughout
the country and the development of rice growing areas in each region during the years from 2000
to 2011. Two typical farms are already established. One is located in the Southeast region (No. 5)
and one in the Mekong River Delta (No. 6) (Figure 5).
Vietnam’s Southeast region is suitable for industrial crops such as rubber, coffee, cashew and
black pepper, which have been promoted as major export crops for the country (Table 11).
Although the planted area of rice in the region is the second largest after rubber, its share in total
rice area of the country is small (5th rank). Rice production is dominated by smallholder farmers,
which account for 100 % of the overall production of the region. Around 80 % of farmers in the
region possess farm sizes ranging from 0.5 ha to 2.5 ha. As irrigation systems are available, three
crop cycles per year are possible. Many rice based cropping systems, such as rice-rice-rice, rice-
rice-corn, corn-rice-corn, rice-rice-peanut and rice-rice-vegetable exist in the region.
Mekong River Delta (MKD) covers an area of 4 million ha with a population of 17 million people.
Due to its mostly flat land and few forested coastal areas, almost two thirds of the total land is
used for agriculture. The region is both - the rice bowl and the most important aquaculture
region of Vietnam. Around 30 % of the area is fertile alluvial soil with abundant water resources.
Rice is the dominant crop of the Mekong Delta, planted on 2.1 million ha, contributing more than
50 % of the rice production and 80 % of rice export of the country. Figure 6 illustrates the very
close correlation between MKD paddy production and national rice exports over the past decade.
Rice from the MKD also feeds the nearby Southeast and Central Highland regions which are
Vietnam’s leading industrial - and perennial crop areas. The rice-based farming systems in the

Chapter 3 Farm overview 19
MKD underwent a rapid process of intensification and commercialization. The investments in
water control in the MKD allowed farmers to transition from the traditional single cropping rice
to two or three irrigated lowland rice crops. Due to increasing input costs and fluctuating
international market prices, which began to decline in the later part of the 1990s, rice farming
incomes are stagnant or even declining. These farmers income could be improved by fishery
products, fruits, vegetables, and animal products. Agriculture is the main source of income of 72
% of the 2.2 million households. The cultivated area per farm household averages around
1.30 ha.
The average exchange rate of the Vietnamese Dong for 2012 was 1 $ = 20,000 VND.
Figure 5: Vietnam: Schematic map of agro-ecological zones and development of rice areas.
Typical rice farm are established in Southeast region (No 5) and Mekong River
Delta (No 6)
6
13
2
5 4
Source: General Statistical Office (GSO)

20 Chapter 3 Farm overview
Table 11: Vietnam: Main crops in Southeast region in 2012. Planted area in thousand ha
Crop South East VietnamPercent of
total
Production
rank in VN
Rubber 511000 910000 56.2 1
Coffee 42000 622000 6.8 2
Black pepper 26900 58900 45.7 1
Cashew 195000 325900 59.8 1
Sugarcane 38400 297900 12.9 4
Rice 294800 7753200 3.8 5
Corn 79000 1118300 7.1 5
Planted area (ha)
Source: GSO
Figure 6: Vietnam: Rising MKD output equals rising export in thousand tons
Source: Worldbank, 2011
3.2.2 Social-economic background
The size of a family in the region varies from 4 to 6. Husband and wife are typically the primary
labors carrying out all farm activities. With increasing economic growth, younger generations
tend to move to the big cities and industrial zones to find better jobs. In the traditional
households in Vietnam, the principal male is culturally perceived as the head, the only
breadwinner, and the major decision maker in the household. However, the absence of principal
men due to seasonal or long-term migration increases the work burden and farm management
responsibilities of the principal women left behind. Women’s wages are on average about 85 % of
men’s. Decision-making structures at all levels are male dominated. Around 64 % of working
women in rural areas work in agriculture, compared to 53 % of working men.

Chapter 3 Farm overview 21
In the Southeast region, households are highly dependent on at least two crops for both self-
consumption and selling. In rice production, approximately 20 % of the households are self-
sufficient and 80 % of them are net buyers of rice. In contrast, 98 % of households are net sellers
of corn, selling almost their whole harvest.
3.2.3 Market linkages
To obtain cash for their daily needs and to pay back loans, farmers have to sell their paddy soon
after the harvest to avoid severe post-harvest losses. When rice or other crops are harvested
during the dry season, farmers can easily dry them in the sunlight and sell them later in the
season when prices increase. Since traders come to villages, almost all farmers can negotiate with
several traders and can therefore choose to wait for an acceptable price.
Because the rice market is strongly influenced by the export market, the net farm income and
profit depends on the fluctuation of the rice price in international market. Recent year’s strong
increase of petrol prices in international markets put remarkable pressure on rice farm income as
well as competitiveness of rice production in comparison to other alternative cash crops and off-
farm activities.
In both regions, the total post-harvest losses of rice crops were between 10 % and 14 %, while
the average losses of drying and storage account for 4.2 % and 3 %, respectively. During the rainy
season harvested rice (paddy) has a high moisture content of 25 % to 26 %. Delayed drying of
paddy can cause severe quantitative and qualitative losses due to high respiration rates at high
moisture contents and the attacks of micro-organisms. Therefore harvested paddy must be dried
within 24 hours to 14 % for safe storage and milling or at least to 18 % for temporary storage of 2
weeks when it is not possible to dry any faster. Lack of drying and storage facilities at farm
household level is among the major reasons for the high post-harvest losses. That is one of the
reasons why farmers have to sell paddy right after the harvest, even when the prices during the
peak harvesting time are low.
3.2.4 Policy measures
Land and market reforms in agriculture began in the early 1990s, triggering a rapid growth in
agricultural production, particularly in the rice sector. These reforms were pervasive, moving the
system of rice production from commune-based public ownership and control to one with
effective private property rights over land and farm assets, amplifying competitive domestic
markets and individual decision making over a wide range of agricultural activities. The
substantial incentive effects created by policy measures, induced farmers to work harder and use
their land more efficiently, have strongly increased both land and labor productivity during the
peak of reform period (1990 – 2005). Overall, given these reforms, Vietnam has gone from being

22 Chapter 3 Farm overview
a large importer of rice from 1976 to 1980, to now being the second largest exporter of rice in
the world with considerable increases in farm productivity and rural incomes and decreases in
rural poverty rates by over 40 % from 1994 to 2004. Increased rice production was also achieved
through policies encouraging expansion of the farmland area, supporting higher yields through
greater use of inputs, mechanization and investing in infrastructure for irrigation and rural
transportation. During the 1990's, investment for irrigation was about 70 % of the total
investment for agriculture.
3.2.5 The typical farm
Figure 7: Vietnam: Overview of Vietnam and the two selected typical farms

Chapter 3 Farm overview 23
The locations of the two typical farms can be seen in Figure 7. The established typical farm
VN3LM is located at Lang Minh commune, Xuan Loc district, in the Dong Nai province is about
100 km away from Ho Chi Minh City. The second typical farm VN2MRD lies in the ‘rice core belt’
of Mekong River Delta. Both farms are well-connected to a main road, an electricity grid and have
an irrigation system. Annual rainfall is around 2,000 mm with 92 % of precipitation distributed
from May to October. Average temperature ranges from 23°C to 32°C, which is suitable for cereal
cultivation all year round.
3.2.6 Organization and management
In the Southeast, family farms have an average farm size of 0.5 ha to 3 ha, while in Mekong Delta
55 % of rice growers have between 0.5 ha and 2 ha. Farms are run by family labor. Some
operations, such as land preparation and harvesting, are done mechanically by contractors.
Farmers usually get a loan to purchase farm inputs including seeds, chemicals and fertilizers at
high interest rates ranging from 12 % to 15 %. Most farmers invest in their own pumping system
and storage facilities.
Table 12 summarizes the aggregated and distinct sources of household incomes. While the
sample survey was relatively small (i.e. 120 farmers), the results seem to suggest that MKD
farmers with very small holdings make extremely little money from rice and are heavily
dependent upon non-crop and non-farm income. Even the medium-scale growers are
predominantly dependent upon income from non-rice sources. Only the larger rice growers can
earn a reasonably good livelihood from rice production and sales, although they, too, derive one-
third of household income from non-rice sources.
Table 12: Vietnam: Farmers' income from different sources − Survey results (n=117) in
Mekong River Delta in VND per month and person; Exchange rate: 16700 VND = 1
$ USD
Farm size Total Income
Per Capita
Rice Income
Per Capita
Other Crop
Income Per
Capita
Animal and
Aquatic Income
Per Capita
Off/Non-Farm
Income Per
Capita
<1 ha Mean % 849
100
151
18
84
10
82
10
533
63
1- 2 ha Mean % 1165
100
284
24
72
6
359
31
449
39
2.01 – 3 ha Mean % 1901
100
658
35
26
1
728
38
490
26
>3 ha Mean % 1933
100
1296
67
10
0
88
5
540
28
Total Mean % 1312
100
535
41
56
4
209
16
512
39
Source: Worldbank, 2009

24 Chapter 3 Farm overview
Unfortunately, there is no statistical data related to farmers’ income in the Southeast region.
However, it is supposed that farmers in this region have a higher non-farm income than those in
Mekong Delta, as industrialization and urbanization are more established in the Southeast region.
3.2.7 Cropping and production system
Land use and cropping pattern in Southeast and Mekong Delta are strongly influenced by climatic
conditions. The average rainfall distribution in both regions presented in Figure 8 indicates a
typical monsoonal climate with distinct wet and dry seasons. Traditionally, S-A (Summer-Autumn)
rice crop (Wet season rice) is predominant in both regions. It is grown from May to July-
depending on rainfall and floods in rainy season. The strong investments in water control during
the last decades allowed farmers, to develop from traditional single cropping rice to two or three
irrigated rice crops. Nowadays, double cropping of rice is widely practiced in Mekong Delta with
the combination of wet season – and dry season rice. Triple cropping rice pattern was first
introduced in the 1990s. However, the third rice crop after dry season rice is not encouraged by
the government, because of the increase of pest damage deriving from year-round continuous
cropping of rice. Farmers tend to plant a third rice crop in locations where the environmental
conditions make a growth possible.
Figure 8: Vietnam: Rice based cropping pattern for Southeast - and Mekong Delta regions
including annual rainfall and temperature
W-S: Winter-Spring, S-S: Spring-Summer, S-A: Summer-Autumn
S-S S-A W-SW-S

Chapter 3 Farm overview 25
With the introduction of triple cropping, farming techniques had to be transformed. The method
of planting rice was converted from transplanting to broadcasting in response to labor shortage
at the overlapping time between harvesting the existing crop and planting the third crop. Manual
rice transplanting requires about 20 to 30 work-days/ha, broadcasting needs only 2 work-
days/ha.
A very important characteristic of rice farmers in the Southeast and Mekong River Delta regions is
the combination of manual labor and mechanization in response to economic and technical
conditions. Competition from urban and non-agricultural development has made labor in
agriculture scarce and expensive. This development is one of the driving forces towards
mechanization as well as the emergence of a new service sector. Table 13 shows the different
steps of rice crop cultivation during the wet season at the typical farm VN3LM in 2012, in which
the most power-intensive stages of rice farming, such as land preparation and harvest, were
outsourced to special service providers.
Table 13: Vietnam: Cropping schedule at the typical farm VN3LM for wet season rice in 2012
DAS* Working steps Performance
-7 Plowing Contractor
0 Seeding (broadcasting) OM 4218, 110 kg/ha
5 - 9 Herbicide Hired labor
7 - 10
1st and 2nd Fertilizer
application Family labor
15 - 25 1st Plant protection Hired labor
15 - 18 Growth regulator Family labor
30 - 35 3rd Fertilizer Family labor
45 - 50 2nd Plant protection Hired labor
90 - 95 Harvest Contractor
* DAS = Days after sowing
The contractor for plowing earned 1.54 mill VND per ha and contractor costs for harvesting were
2.5 mill VND per ha. The first and second application of fertilizer consisted of 70 kg DAP (18-24-
0 % NPK) and 250 kg urea (46-0-0 % NPK) per ha. The third application was 75 kg KCl (0-0-52 %
NPK) per ha. The costs for herbicide application was 600,000 VND per ha. For first plant
protection application fungicides and insecticides were sprayed, resulting in costs of 500,000 VND
and 350,000 VND per ha. The second plant protection application contained only fungicides and
cost 500,000 VND per ha.
26 Chapter 3 Farm overview
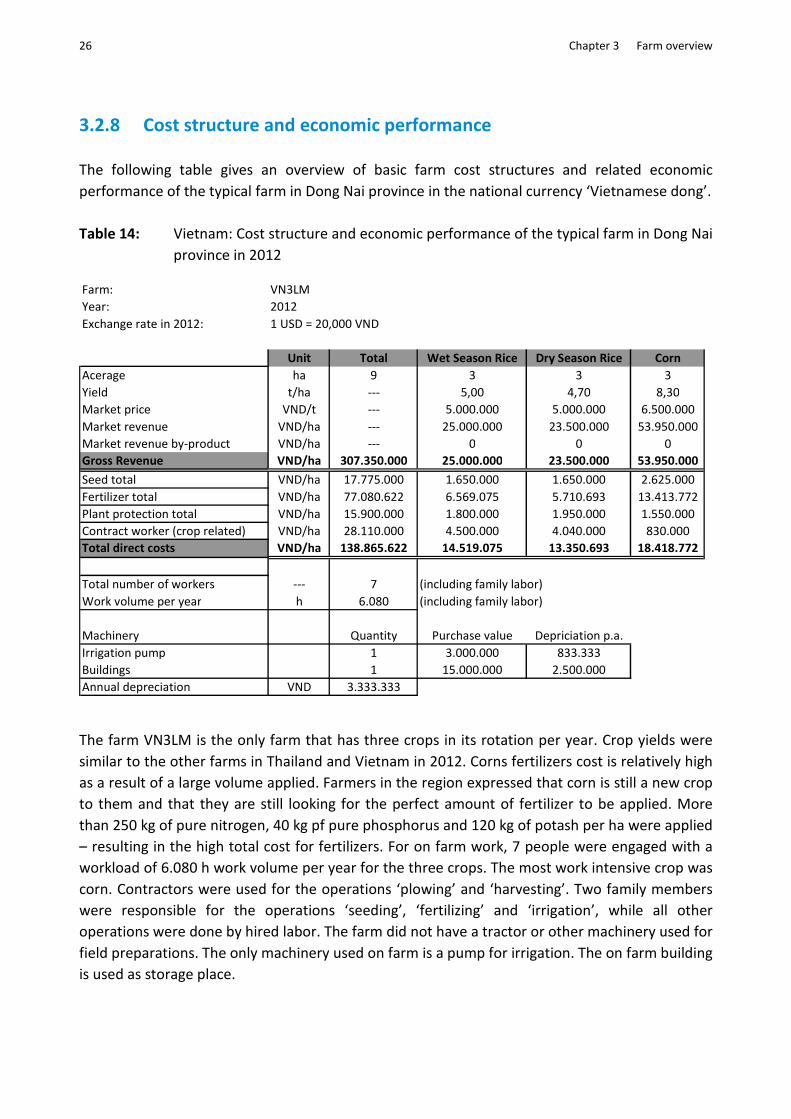
3.2.8 Cost structure and economic performance
The following table gives an overview of basic farm cost structures and related economic
performance of the typical farm in Dong Nai province in the national currency ‘Vietnamese dong’.
Table 14: Vietnam: Cost structure and economic performance of the typical farm in Dong Nai
province in 2012
Farm: VN3LM
Year: 2012
Exchange rate in 2012: 1 USD = 20,000 VND
Unit Total Wet Season Rice Dry Season Rice Corn
Acerage ha 9 3 3 3
Yield t/ha --- 5,00 4,70 8,30
Market price VND/t --- 5.000.000 5.000.000 6.500.000
Market revenue VND/ha --- 25.000.000 23.500.000 53.950.000
Market revenue by-product VND/ha --- 0 0 0
Gross Revenue VND/ha 307.350.000 25.000.000 23.500.000 53.950.000
Seed total VND/ha 17.775.000 1.650.000 1.650.000 2.625.000
Fertilizer total VND/ha 77.080.622 6.569.075 5.710.693 13.413.772
Plant protection total VND/ha 15.900.000 1.800.000 1.950.000 1.550.000
Contract worker (crop related) VND/ha 28.110.000 4.500.000 4.040.000 830.000
Total direct costs VND/ha 138.865.622 14.519.075 13.350.693 18.418.772
Total number of workers --- 7 (including family labor)
Work volume per year h 6.080 (including family labor)
Machinery Quantity Purchase value Depriciation p.a.
Irrigation pump 1 3.000.000 833.333
Buildings 1 15.000.000 2.500.000
Annual depreciation VND 3.333.333
The farm VN3LM is the only farm that has three crops in its rotation per year. Crop yields were
similar to the other farms in Thailand and Vietnam in 2012. Corns fertilizers cost is relatively high
as a result of a large volume applied. Farmers in the region expressed that corn is still a new crop
to them and that they are still looking for the perfect amount of fertilizer to be applied. More
than 250 kg of pure nitrogen, 40 kg pf pure phosphorus and 120 kg of potash per ha were applied
– resulting in the high total cost for fertilizers. For on farm work, 7 people were engaged with a
workload of 6.080 h work volume per year for the three crops. The most work intensive crop was
corn. Contractors were used for the operations ‘plowing’ and ‘harvesting’. Two family members
were responsible for the operations ‘seeding’, ‘fertilizing’ and ‘irrigation’, while all other
operations were done by hired labor. The farm did not have a tractor or other machinery used for
field preparations. The only machinery used on farm is a pump for irrigation. The on farm building
is used as storage place.

Chapter 3 Farm overview 27
In the following table an overview of basic farm cost structures and related economic
performance of the typical farm in the Mekong Delta region in the national currency ‘Vietnamese
dong’ is given.
Table 15: Vietnam: Cost structure and economic performance of the typical farm in Mekong
Delta region in 2012
Farm: VN2MRD
Year: 2012
Exchange rate in 2012: 1 USD = 20,000 VND
Unit Total Wet Season Rice Dry Season Rice
Acerage ha 4 2 2
Yield t/ha --- 6.20 6.50
Market price VND/t --- 5,600,000 5,800,000
Market revenue VND/ha --- 34,720,000 37,700,000
Market revenue by-product VND/ha --- 20,000 24,000
Gross Revenue VND/ha 144,928,000 34,740,000 37,724,000
Seed total VND/ha 12,150,000 4,050,000 2,025,000
Fertilizer total VND/ha 23,322,720 5,830,680 5,830,680
Plant protection total VND/ha 16,360,000 3,880,000 4,300,000
Contract worker (crop related) VND/ha 15,020,000 5,110,000 2,400,000
Total direct costs VND/ha 66,852,720 18,870,680 14,555,680
Total number of workers --- 1 (including family labor)
Work volume per year h 560 (including family labor)
Machinery Quantity Purchase value Depriciation p.a.
2-wheeled tractor 1 50,000,000 4,500,000
Buildings 1 5,000,000 1,200,000
Annual depreciation VND 5,700,000
Two crops of rice were grown in 2012. The yields on this farm were above the previous
Vietnamese farm. This was the only farm from the newly established typical rice farms that sold
the rice by-product straw. Another unique aspect of this was that the farmer was the only person
working on farm, working only 560 h per year. Contractors were hired for the operations
‘plowing’, ‘seedbed preparation’ and ‘harvesting’. Although the farmer had a 2-wheeled tractor,
there is now towed machinery that could be used for field work. The building is used as storage
shed.
When comparing the two Vietnamese farms the first thing to look at is the difference in rice yield
and market price. VN2MRD sold the grown variety for 30 to 40 USD more per ton, due to higher
quality rice. Another big difference is the number of on-farm workers and their related work
volume. A large amount of the VN3LM’s work volume is due to producing corn as a third crop.
Growing corn was very labor intensive, while the farmer on the VN2MRD farm used only

28 Chapter 3 Farm overview
contractors or did the task by himself. Another interesting disparity is the use of owned
machinery, which is lower than in the other countries. These operations are outsourced to
contractors equipped with modern and efficient machinery in Vietnam.
3.3 Cambodian Rice Production System: A typical farm analysis
3.3.1 The selected region
Cambodia can be divided into four geographical regions; the Mekong Plain Delta, Tonle Sap Plain
Delta, North and North-Eastern mountainous region and the coastal region. The total land mass is
~181,000 km² with a population of ~15 mill. The annual temperature ranges from 21 to 35 °C
with an average rainfall of 1,500 mm per year. Cambodia’s climate is dominated by monsoons
and the rainy season is from May to October.
Most rural households depend on agriculture and the related sub-sectors. Rice is the most
important staple crop. In 2013 rice was cultivated on 2,980,297 hectares, which represent 77.6 %
of the total cultivation area, while maize and cassava, with a dramatic increase of production
during the last 10 years, have 4.6 % and 10.2 % respectively. The selected typical farm is located
in the region Tonle Sap Plain Delta which is the most fertile agricultural region in Cambodia. This
region produces typical farm products such as rice, maize, cassava, peanuts, sesame, soy bean
and green bean. In Tonle Sap Plain Delta’s agriculture rice is dominant. Fruit and vegetable have
lower priority in this region, but are, due to an increase demand, on a rising share.
3.3.2 Social-economic background
Battambang province has an area of ~11,700 km² and a population of around 1 mill. Most farms
of the Battambang province are run by families. They hire additional seasonal worker, but many
young people migrate to cities or overseas, resulting in an increasing shortage of labor. The
average farm size is 2.5 ha/family. With regard to land tenure, 85 % is owned and 15 % are
rented.
With regard to farm inputs, there is no restriction concerning chemical fertilizers as long as the
usage follows the recommendation of research – or technical institutions.
Rice productivity has increased from 2.1 tons/ha in year 2001 to 3.1 tons/ha in 2013, an actual
growing rate of 4.2 % per year. The sharp increase of rice productivity is closely related to the
expansion of irrigation facilities, technology improvement and the rice price increase at the global
market.

Chapter 3 Farm overview 29
Still many farms lack the capital and money to improve their farm productivity. Micro finance
enterprises exist, but the interest rates are high. Borrowing money from private actors is even
more expensive.
3.3.3 Policy measures
The Cambodian government does not subsidize any crops that are domestically consumed. Tax
exemptions only exist for agricultural goods which are exported from Cambodia, thus helping to
maintain low and attractive prices.
Taxes for agricultural land do not exist. Taxes have to be paid when the government identifies the
land as economic land. The land market depends on market priced and on the governmental
identification of the land-use type.
3.3.4 The typical farm
The typical farm is located in Kan Teu II commune in Banon district in Battambang province. The
farm is located near the main road and has access to electricity. The farm family consists of a
family with 7 persons. Other farm enterprises include raising cow calf with revenue of 3,000,000
KHR/year (~5000 KHR = 1$ in 2012). Additional off-farm income is provided. The average market
distance is 12 km away.
Figure 9: Cambodia: Overview of Cambodia and the selected typical farm

30 Chapter 3 Farm overview
3.3.5 Organization and management
The farm has 2 ha of arable land and the average field size is 0.4 ha with an average distance of 4
km from farm to field. Field work is mainly done by the family. Only during harvest time help is
provided by a contractor. The farm owns a power tiller with a plough, a harrow and a trailer as
towed machinery. Spraying is done with a sprayer. There is no storage building on farm to store
harvested crops.
Short term loans are available, but with 36 %, the interest rate is very high. Long term loans with
a duration of 3 years have an interest rate of 24 %. The interest rate for short and long term
deposits is 3 % and 10 %.
3.3.6 Cropping and production system
The cropping system contains a double cropping rotation of mung beans and rice with a
turnaround time of 1 year. In 2012 the yield for mung beans was 0.18 t/ha and for rice 2.5 t/ha.
Both products had to be dried after harvest. No certified seeds were used. Direct seeding was
used to cultivate the crops.
Before seeding rice, the fields were ploughed twice at the end of July. Fields were harrowed after
ploughing and afterwards seeding of 200 kg seeds/ha was done. In the beginning of August
herbicides were applied to the fields. At the end of August fertilizer and herbicides were applied
twice. The first application of fertilizer contained 50 kg/ha NPK (15:15:15) and the second
application 50 kg/ha urea containing 46 % Nitrogen. All those tasks were performed by family
labor. Only during harvest at the end of November a contractor helped in addition to family
labor.
Field preparations for mung beans were made in the beginning of April by plowing the field. At
the end of April mung bean were sown using 20 kg seeds/ha. In the middle of June insecticides
were sprayed for plant protection. A contractor harvested the mung beans in the middle of July
3.3.7 Cost structure and economic performance
The following table gives an overview of basic farm cost structures and related economic
performance of the typical farm in the national currency ‘riel’.

Chapter 3 Farm overview 31
Table 16: Cambodia: Cost structure and economic performance of the typical farm in 2012
Farm: KH1BB
Year: 2012
Exchange rate (2012) 1 USD = 5000 KHR
Unit Total Mung beans Wet season rice
Acerage ha 4 2 2
Yield t/ha --- 0.18 2.50
Market price KHR/t --- 2,500,000 1,200,000
Market revenue KHR/ha --- 450,000 3,000,000
other revenues KHR/ha --- 0 0
Gross Revenue KHR/ha 6,900,000 450,000 3,000,000
Seed total KHR/ha 1,160,000 80,000 500,000
Fertilizer total KHR/ha 513,837 0 256,919
Plant protection total KHR/ha 639,000 24,000 295,500
Contract worker (crop related) KHR/ha 1,350,000 220,000 455,000
Total direct costs KHR/ha 3,662,837 324,000 1,507,419
Total number of workers --- 3 (including family labor)
Work volume per year h 584 (including family labor)
Machinery Quantity Purchase value Depriciation p.a.
2-wheeled tractor 1 7,600,000 666,667
Towed machinery 3 4,000,000 889,000
Selfpropelled Machinery 1 400,000 82,500
Annual depreciation KHR 1,638,167
The yields of the farm KH1BB were very low. Due to a very low amount of fertilizer applied the
rice yield was correspondingly low. Around 30 kg of pure nitrogen and approximately 5 kg of
phosphorus and potash were applied per ha. Because mung beans are legume crops, able to fix
nitrogen from the air, the farmer did not apply any fertilizer. It is probable that a nutrient
deficiency is responsible for the low yields in mung beans and rice.
Two family workers and one seasonal worker were engaged on farm with a work volume of only
584 h per year. A contractor was only used during harvest in both crops. Land preparations were
done by the farmer with on farm machinery consisting of a power tiller, a plough, a harrow, a
trailer and a sprayer. Latter is the self-propelled machinery in the table.

32 Chapter 3 Farm overview
3.4 Lao PDR: Typical rice production systems
3.4.1 The selected region
Lao PDR is an agriculture country. Lao territory occupies ~23.68 mill ha. Till 2030 it is planned to
grow rice on 2 mill ha of which 1 mill ha will be irrigated. To enhance the amount of rice
produced the area along the Mekong and its tributaries, a more intensified production system is
needed to increase the surplus and export to neighboring countries. The yield of wet season rice
is 3 t per ha and the yield of irrigated fields during dry season is around 4 t per ha, which result in
a production of 3.6 mill tons. The surplus production is 1.15 mill tons per year. Currently 2.45 mill
tons of rice per year are consumed by 7 mill people, which corresponds to 350kg paddy rice per
person and year. Around 80 % of the population is relying on agriculture. Agriculture is
considered as of cultural and traditional value, especially rice farming. It is in an interim phase
from subsistence agriculture towards a more intensive system. Lao PDR is a diverse country.
People belong to many different ethical factions. . In some rural areas rice is considered as a
‘second currency’ next to money. It is commonly used in exchange with other commodities.
Figure 10: Lao PDR: Overview of Lao PDR and the selected typical farm

Chapter 3 Farm overview 33
Champasak province, the region where the typical farm is located, lies in the south western part
of Laos PDR. To the south there is the border to Cambodia, to the west Thailand, to the east is
the province Attapue , Saravan province is located to the north. Total land area of Champasak
accounts for 1,535,000 ha. Elevation ranges between 100 and 1200 m asl. Temperature is within
a magnitude of 15 to 38 °C and the average rainfall per year is approximately 1,800 mm.
Champasak province can be divided in upland and lowland areas. The uplands represent
mountainous regions, slopes, and valley. The upland covers approximately 60 % of the area.
These areas are difficult to access by roads and few trading facilities are established. In
agriculture there, mechanizations are low and only few technologies are used. The peripheral
regions of those uplands cover an area of around 10 %. They are suitable for cash crops like
coffee, rubber, corn and cassava and house ruminant livestock. Around the plantations of latter
crops, infrastructure has started to develop. Factories that need raw materials as inputs from
surrounding plantations are increasing their production and provide jobs for dwellers. The
lowland area of Lao PDR covers an area of approximately 30 %. This land is used for rice
production as well as for other crops and livestock production. Most fields are rain-fed. Only ~10
% of the area is irrigated, which sums up to 150,000 ha. This irrigated area is mainly used for rice
production.
3.4.2 Socio-economic background
The population of Champasak amounts to 612,800 heads. Within the national economy of
agriculture 30.5 % of all commodities are produced in this area. The gross domestic value per
capita is 1,399 USD (2013). Approximately 80 % of the population is occupied in rice production.
Due to recent socio-economic changes - a development from agricultural sectors towards
industry and services, the costs for on farm labor have increased. Rice is not competitive,
because, due to a lack of knowledge and management shortcomings, the quality is low. Farmers
have the opportunity to work off-farm, e.g. during dry season, in different local industries. This
way an additional income is provided for the big farming community and latter farmers are
integrated into the modern society. However, the remote upland farmers on the fringe of
civilization cannot participate. Land ownership in Laos is dependent on generation farmers that
have inherited the land from their parents. Additional farm land can also be purchased.
3.4.3 Market linkages
It is seen as an advantage that Champasak province is surrounded by large rice producing
countries, such as Vietnam and Thailand. Collaboration with Cambodia and Vietnam was
established and called ‘Triangle Economic Development’ (CLV). For example, contract farming
and business matches were established between Champasak and Ubon Ratchathani, a province

34 Chapter 3 Farm overview
in Eastern Thailand next to the boarder of Laos and Cambodia. Small, but modern rice mills and
grading factories provide rice for export to China and Japan and for domestic usage.
Figure 11: Lao PDR: Rice value chain
Farmers have different options on how to proceed with their harvest. Often, the paddy is
collected by local rice traders. Another option for the farmer is to sell the paddy directly to a local
rice mill. After husking and polishing, the rice is sold for local and domestic consumption. The
local rice trader can also sell the paddy to a modern rice mill. The modern rice mills include a
grading and a packing process, the product is sold to retailers. High quality rice is exported to
neighboring countries. The rest is sold for domestic consumption and to niche markets for some
special rice varieties.
Exporting rice is still a challenge as Lao PDR’s farmers mainly produce for subsistence. Rice
surplus is around 1 mill ton of paddy rice per year. Another challenge is the rice quality, as
different varieties often got mixed in the older rice mills. Improvement of the farming system, the
farmers’ knowledge, skill and attitude is needed to improve overall rice quality in order to meet
market requirements.

Chapter 3 Farm overview 35
Small and irregular plots are still found regularly and used by farmers, making the use of
machinery difficult. For the next decade, the government has planned to strengthen farmer
associations and cooperatives so that it will be easier to use machinery, resulting in less human
labor and a better rice quality for the export.
3.4.4 Policy measures
When Laos PDR is able to join the Asian Economic Community (AEC), free trade between 10 Asian
countries will be possible and open up a huge new potential market. To be prepared the
government has started an initiative to boost agricultural production by modern technology,
reducing human labor through long term investments. This includes a switch in the rice
cultivation system from a labor intensive rice nursery to a less labor intensive broadcasting and
direct seeding. The initiative also includes new technologies in the post-harvest processes, such
as modern mills for processing and grading, as well as land consolidation, land development, an
adjusted loan interest rate for agricultural investments and irrigation systems.
3.4.5 The typical farm
The selected typical farm represents a household with rice farming and horticulture as an
additional farm enterprise. It is located in Sapai village, in Sanasomboun district. The main
enterprise of this farm is rice production and rice is harvested twice a year, once during the rainy
season (autumn rice) and during the dry season (spring rice). The farm size is 1.6 ha of which 0.3
ha are used to produce watermelons. The farmland has an irrigation system and a good access to
the main road. The average market distance is 5 km.
3.4.6 Organization and management
The farmer owns and cultivates the land. To run the farm, three hired labors are needed as well
as four family members. The farm owns a tractor with a plough, a harrow and a trailer. They have
sufficient capital to run their enterprise without any loan, although they would have access to
credits.
3.4.7 Cropping and production system
The crop rotation is a double cropping of rice. The yield of the wet season rice is 5 t/ha (2012)
and the yield of the dry season rice is 5.5 t/ha. Wet season rice is grown from June to November
and dry season rice from late November to April. The rice straw is used to feed the neighbor’s
cattle. They use the manure on the rice field and apply it before first plowing during autumn as

36 Chapter 3 Farm overview
organic fertilizer in late May (500 kg cattle – and 300 kg chicken manure). At the beginning of
June the fields are ploughed twice using a two-wheeled tractor, owned by the farmer, and
harrowed afterwards. The grown rice variety is called ‘Rice TDK 11’. They need 60 kg seeds per ha
for the nursery. In the nursery 150 kg of fertilizer are applied (16-20-0). After the seedbed
preparation, the pre-grown seedlings are transplanted at the beginning of July. The transplanting
of seedlings requires 30 additionally hired workers. During August, 50 kg urea is applied twice
containing 46 % Nitrogen (=23 kg pure Nitrogen). Twenty seasonal workers are hired during the
harvest in the middle of November. Threshing is contracted out for 548,000 LAK/ha (~70 $). The
same procedures are used for spring rice, with the exception that ploughing is performed only
once and no organic fertilizers are added. During the growing season 2012 no chemicals were
used.
3.4.8 Cost structure and economic performance
The following table gives an overview of basic farm cost structures and related economic
performance of the typical farm in the national currency ‘kip’.
Table 17: Lao PDR: Cost structure and economic performance of the typical farm in 2012
Farm: LA1CH
Year: 2012
Exchange rate in 2012: 1 USD =8500 LAK
Unit Total Wet Season Rice Dry Season Rice
Acerage ha ~3 1.3 1.3
Yield t/ha --- 5.00 5.50
Market price LAK/t --- 1,800,000 1,800,000
Market revenue LAK/ha --- 9,000,000 9,900,000
other revenues LAK/ha --- 0 0
Gross Revenue LAK/ha 24,570,000 9,000,000 9,900,000
Seed total LAK/ha 676,000 240,000 280,000
Fertilizer total LAK/ha 3,699,488 1,675,690 1,170,070
Plant protection total LAK/ha 0 0 0
Contract worker (crop related) LAK/ha 1,496,300 548,000 603,000
Total direct costs LAK/ha 5,871,788 2,463,690 2,053,070
Total number of workers --- 57 (including family labor)
Work volume per year h 4,800 (including family labor)
Machinery Quantity Purchase value Depriciation p.a.
2-wheeled tractor 1 15,000,000 1,700,000
towed machinery 3 4,500,000 551,992
Annual depreciation LAK 2,251,992
Chapter 3 Farm overview 37
Yields on the LA1CH farm were comparable to farms in Thailand and Vietnam. The degree of
applied fertilizer is similar to Thailand and Vietnam, but the amount of on farm workers and their
related work volume differs. Within the region of the selected farm it is still common to pregrow
the rice seedlings in a nursery and transplant them to the fields afterwards. Compared to direct
seeding, this operation is very work intensive. Weeding and harvesting was done manually, too.
All these operations are responsible for a very high work volume per year. Contractors were only
used for threshing. Tillage and seedbed preparation was done with their own machinery
comprising a power tiller, a plough, a harrow and a trailer.
3.5 Myanmar Rice Production System: A typical farm analysis
3.5.1 The selected region
The Ayeyarwady Region, where the typical farm is located, is bounded by the Central Dry zone
and Transition Zone in the north, Sittoung-Thanlwin Plain in the east, Hilly Region in the west and
Andaman Sea in the south and southwest. Total area of the region is 35,137 km² and the
dominant land use of the region is agriculture which covers 56 % of the region’s area. Most of the
areas are covered by the alluvial soils (Fluvisol – 71 %) and forest soils (Ferrasol – 22 %).
Approximately 8 million people live in this region, resulting in a population density of 220
inhabitants per km². Topography of the land in the Ayeyarwady region is mostly flat. The main
river of the region is Ayeyarwady river and many streams and rivulets are stretching out of this
river into the low land which is plain and flooded regularly.
Average annual rainfall of the delta region ranges from 1,100 mm to 2,800 mm with
temperatures between maximum 32.8 C and minimum 22.3 C, accounting semi-tropic to tropic
climatic condition. Usually, tropical storms occur between May and November with high intensity
rainfall. The region is frequently affected by severe floods
Rice is the main crop of the country and important for food security as well as for export.
Ayeyarwady region is designated as rice bowl of the country and occupies the largest rice
production area of 5 million acres (2.02 mil ha) which is representing 26 % of the total rice area of
Myanmar. In addition to rice, pulses crop, particularly mung bean and green gram, are commonly
grown as second crops after rice. Ayeyarwady region plays an important role in pulse production
in the country as 20 % of all pulses are grown here.
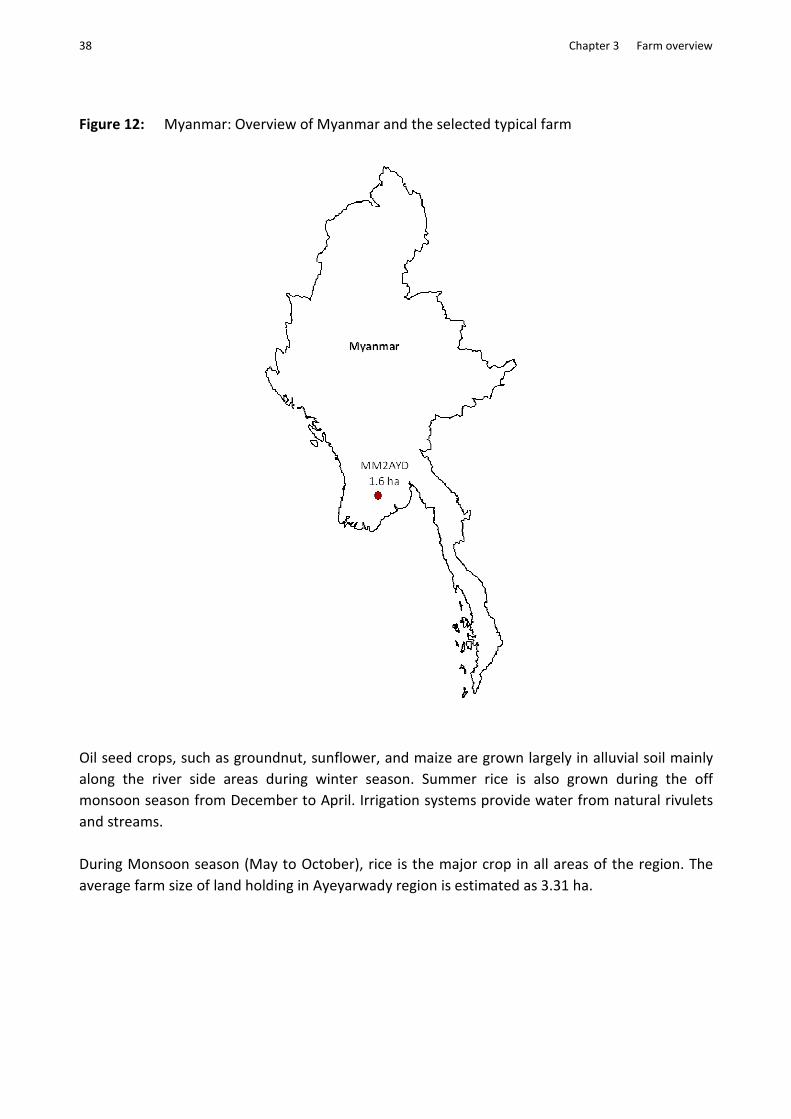
38 Chapter 3 Farm overview
Figure 12: Myanmar: Overview of Myanmar and the selected typical farm
Oil seed crops, such as groundnut, sunflower, and maize are grown largely in alluvial soil mainly
along the river side areas during winter season. Summer rice is also grown during the off
monsoon season from December to April. Irrigation systems provide water from natural rivulets
and streams.
During Monsoon season (May to October), rice is the major crop in all areas of the region. The
average farm size of land holding in Ayeyarwady region is estimated as 3.31 ha.
Chapter 3 Farm overview 39
3.5.2 Social-economic background
Due to a high density of population and limited land resources in the selected area transferring
and sharing land holdings among rural households is complicated.
Production of quality rice, green gram and mung beans can be increased by providing certified
seeds and optimal fertilizer inputs. Post-harvest losses occur, but could be minimized by using
threshers and mobile dryers at paddy harvest season. Expansion of micro credits will support
small farmers out of debt cycle.
With a growing economy, job opportunities are increasing especially in major cities and towns.
Increasing hard infrastructure development such as the construction of roads, bridges, dams and
buildings throughout the country created job opportunities for the poor who are mostly
temporary migrants from rural areas during the last decade. Getting access to farm land, creating
jobs while the population is increasing and land development is limited in rural areas, is a big
challenge.
Temporary migration of labor from the central dry zone is nowadays a regular occurrence - from
Rakhine state and Ayeyarwaddy regions to other areas, particularly in the Tanintharyi region,
Kacin. In Kacin the government allowed the private sector to reclaim abandoned land for major
crops, such as sugarcane, tapioca, rubber and oil palm plantations. Temporary migration of labor
to abroad, particularly Thailand and Malaysia is increasing. Hence scarcity of farm labor for
agricultural activities in Myanmar is becoming a problem. It is noted that the proportion of rural
population is decreasing from 75 % in 1983 to 69 % in 2009/10. The trend is the same for whole
Myanmar. It indicates that labor force in agriculture is decreasing mostly due to urbanization and
increased employment in off-farm jobs. The differentiation of labor price between on-farm
(2500-3000 kyats/day) and off-farm work (4000-4500 kyats/day) is one of the factors of labor
migration to off-farm activities.
3.5.3 Market linkages
The dominating marketing system for rice in the selected region is illustrated in Figure 13. All
farmers sell their crop as paddy or milled rice to the nearest mills and brokers. Many farmers
save some of their milled harvest for subsistence needs, whereas a few farmers need to sell
almost all of their products to pay back borrowed loans with a high interest rate. The volume of
saved seeds for the next cropping period differs from farmer to farmer. Market prices depend on
the quality of paddy. The rice market information comes from various sources such as the
company notice board, traders and millers. Only some farmers sell their products at the town.
Together with the technology advancement farmers know the right market price of the product
set by township level traders, so they can obtain the best price.

40 Chapter 3 Farm overview
Figure 13: Myanmar: Rice value chain
Brokers are the primary collectors within the villages. Millers pay the brokers in advance to bring
the paddy to the millers. Half of the harvest is sold as paddy to millers and traders, and the rest is
sold as milled rice. Storage of paddy rice is free, as millers receive the charge for milling rice.
Brokers deliver milled rice to the wholesalers in their township if there is a demand. Otherwise,
the rice is sold directly to Yangon or other deficit areas. Paddy is sold to local rice mills, rice
processing companies and traders. Most of the millers store paddy and sell it afterwards as milled
rice. All the large mills have a warehouse attached. Millers store good quality paddy for their
regular use of rice mills. Some traders in respective towns have their own rice mill. They sell rice
throughout the year. Each trader has a warehouse and stores paddy.
Market prices for rice depend on domestic and international market supply and demands. The
peak seasons for rice prices are August and September, due to paddy shortages during these
months. The lowest paddy prices occur during harvest season in December, January, April, and
May. Traders buy high quality rice and export rice for local markets and for export.
3.5.4 Policy measures
In the past the rice export market was a monopoly of Myanmar Agriculture Produce Trading
(MAPT), an agency owned by the government until 2003. The volume of rice exports was
unstable due to the low production quality, high local consumption and export policy. The
Chapter 3 Farm overview 41
volume of export rice was occasionally controlled in order to maintain local market prices and to
ensure local consumption. Only surpluses were exported. However, since 2003 the volume of rice
export has increased, as well as production and sowed acres.
Land is owned by the state and land rights are only issued to farmers. Land taxes are minimal,
amounting to an average of 3 Kyats/acre (1 USD = 910 Kyats). Taxes are paid to state collectors by
the farmers who hold land right certificates. It was observed that there is no case of land
borrowing or lending in the typical farm area. The farmers usually own their own ware house
(barn) for storage of their farm products before selling or using them for household consumption.
However, most farmers need to sell their crop products right after the harvest to pay back credits
and borrowed money.
As the availability of adequate water for agriculture is a critical factor and remains crucial in
enhancing crop productivity, the government has made great efforts to construct large scale
irrigation systems requiring large investments of capital. Apart from these established programs,
sinking tube-wells, artesian wells, pumps used on rivers, streams and lakes and barrages of
streams and creeks were installed, providing sufficient irrigation water to increase yields, overall
production and production intensity. The net irrigation area increased from 1.76 mill ha in 1995-
96 to 2.12 mill ha in 2011-12, while the rice production area increased from 6.13 mill ha to 7.59
mil ha during latter period.
In the past, local exporters were required to pay a 10 % tax to export their agricultural
commodities. In 2011 the export tax was reduced to 2 %. As a result rice export volume increased
from 106.31 thousand metric tons in 2003 to 1.25 million metric tons in 2013.
Peas and beans as a second crop after rice play an important role in generating farm income for
rice farmers in the selected region. National production of pulses (peas and beans) increased
dramatically due to a high market demand for export and domestic consumption. Myanmar is
one of the leading countries of pea and bean production among ASEAN member countries. About
17 species of peas and beans are cultivated in the country. Major exportable species are green
gram, black gram, pigeon pea, chickpea and soybean. Black gram (mung bean) and green gram
are mainly grown in Ayeyarwady region. The cultivated area of peas and beans has been
increased substantially from 0.73 million hectares in 1989 to 4.42 million hectares in 2012,
producing over 5 million metric tons. The export of pulses grew from 0.19 million metric tons in
1991 to 1.3 million metric tons in 2011.
3.5.5 The typical farm
The typical farm is located in Pantanaw Township, 75 kilometers away from Yangon, in the upper
part of Ayeyarwady’s delta region. The farm has access to a road, but presently there is no
electricity available and the irrigation capacity is limited. The typical farm produces rice during
42 Chapter 3 Farm overview
the monsoon season and peas, and beans as a second crop after rice in late monsoon season.
Although a small stream is passing near the village, water scarcity in late monsoon season made
the irrigation of the second crop impossible. During monsoon season the waterway along the
stream is used to transport commodities to nearby villages. The average household contains 4 -5
people, 2 of which are engaged in farming activities.
3.5.6 Organization and management
The typical farm resides on 2.4 ha, in which the farmer usually works his own land. Interviews
with neighbor farmers revealed that renting land is not a common practice. Farm laborers are
scarce, particularly in peak the seasons of transplanting and harvesting. Farm laborers typically
consist of at least two family members who work as permanent (or perhaps full time) farm
laborers. In addition, one permanent laborer is hired for year round not only for on-field activities
but also for supplementary work in the farm enterprise such as farm land plot maintenance, sun
drying, packaging products, taking care of farm implements, water management, drainage and
others.
The average plot size of the farm is about 0.2 ha. A power tiller is used for land preparation. The
towed machinery consists of a plough and a harrow. In the whole typical farm village, there is
only one tractor (45 HP). Threshing machines are widely utilized in the village for paddy and
pulses to save the time and reduce post-harvest loss. However, harvesting is done manually.
Seasonal loan for rice supplements is supplied by the Myanmar Agricultural Development Bank
(MADB), a state owned bank and the only source of credit for farmer. The available credit from
MADB for one acre of rice is 100,000 Kyats (1 $ = ~910 Kyats) and eligible for up to 10 acres (=~4
ha) per farmer. Credit amount for pulses is only 20,000 kyats (= 21.9 USD) per acre. Interest rate
of credit from MADB is 8.5 % and farmers have to pay back after crop season. There is no credit
arrangement for buying farm machineries. There are no services for hiring machineries. Instead
farmers help each other when needed on a mutual agreement and take care for provisions and
used diesel.
3.5.7 Cropping – and production system
Paddy rice is the main crop of the typical farm. It is grown during the monsoon season from mid-
May to end October. The plants are pregrown in a nursery and 31.7 kg of seeds per acre (= 78
kg/ha) are used. Pulses, particularly mung beans and green gram crop are sown in the winter
season after paddy, from mid-November to March with residual soil moisture. This cropping
system has been practiced for more than three decades. In this cropping system, soil nutrients
are replenished through nitrogen fixing bacteria of pulses. This improves the soil nutritional
status for the monsoon season paddy and can reduce fertilizer costs.

Chapter 3 Farm overview 43
Land preparation for crops is performed by farm machinery, as the market price of one draught
cattle is worth as 600,000 kyats (= 659 USD), a pair of cattle 1,200,000 kyats (= 1318 USD) which
is close to the price of a power tiller. Maintaining the burning of paddy fields before paddy
cultivation and drainage during paddy growing season is taken care of by farmers with the help of
the permanent laborer. Tasks in the seedling nursery, seeding of pulses, fertilizer application, and
pest control activities are mainly carried out by two family laborers and one permanent laborer.
Seventy lb rice seeds per acre are used and the applied fertilizer during rice consists of two
applications. One is NPK (100 lb/acer) and the second application is urea (35 lb/acre).
Transplanting, harvesting and threshing activities are mostly done on contract basis. Sun drying,
handling, storage and packaging of the crop products are the activities normally done by the
family laborers and permanent labor. The yield of monsoon paddy is 3.6 tons per ha and 1.16
metric tons per ha for mung beans. There were no pest or disease incidents in either crop during
the assessment year.
3.5.8 Cost structure and economic performance
The following table gives an overview of basic farm cost structures and related economic
performance of the typical farm in the national currency ‘kyat’ and acre.
Table 18: Myanmar: Cost structure and economic performance of the typical farm in 2012
Farm: MM2AYD
Year: 2012
Exchange rate in 2012: 1 USD = 910 MMK
Unit Total Wet Season Rice Mung beans
Acerage acre 12 6 6
Yield t/acre --- 1.40 0.47
Market price MMK/t --- 182,000 550,000
Market revenue MMK/acre --- 254,800 258,500
other revenues MMK/acre --- 0 0
Gross Revenue MMK/acre 3,079,800 254,800 258,500
Seed total MMK/acre 65,310 910 9,975
Fertilizer total MMK/acre 521,593 86,932 0
Plant protection total MMK/acre 0 0 0
Contract worker (crop related) MMK/acre 96,000 6,000 10,000
Other direct cost (excl. Drying) MMK/acre 147,840 0 24,640
Total direct costs MMK/acre 830,743 93,842 44,615
Total number of workers --- 28 (including family labor)
Work volume per year h 3,860 (including family labor)
Machinery Quantity Purchase value Depriciation p.a.
2-wheeled tractor 1 1,500,000 65,000
Towed machinery 2 50,000 4,333
Buildings 1 200,000 14,000
Annual depreciation MMK 83,333

44 Chapter 3 Farm overview
The yields on the farm MM2AYD were low, but better than in Cambodia. The amounts of fertilizer
applied were as low as in Cambodia. This is a result of no fertilizers being added for mung bean
growth on MM2AYD. Other direct cost for mung beans are for the applied foliar fertilizer.
Threshing was the only operation that was done by contractors. Owned on-farm machinery was
used for field work. The equipment comprises a power tiller, a plough and a harrow. A barn for
storage represents the building.

Chapter 4 Cross Country Comparison 45
4 Cross country farm comparison
While the previous chapters analyzed country specific facts and details of the newly established
typical farms, the chapter below focuses on a comparison of the farm data between both,
different farms and countries.
At the beginning, yields are compared, afterwards crop establishment cost are shown to
demonstrate the differences between countries. The volume of applied fertilizer and the related
cost are analyzed. With the comparison of operating cost, the existing differences with regard to
labor and used machinery on-farm are shown. Then a closer look at direct and operating cost is
given. After this, key cost elements are in the focus of attention, which include direct, operating
and land cost. The last points of this chapter is focusing on are “total cost and gross revenue”,
“profits and losses” and “return to labor” of the typical farms.
Figure 14: Yield in t per ha in 2012
0.0
1.0
2.0
3.0
4.0
5.0
6.0
7.0
8.0
9.0
Wet
Sea
so
n R
ice
Mu
ng
Bea
ns
Mu
ng
Bea
ns
Wet
Sea
so
n R
ice
Wet
Sea
so
n R
ice
Dry
Sea
so
n R
ice
Wet
Sea
so
n R
ice
Dry
Sea
so
n R
ice
Wet
Sea
so
n R
ice
Wet
Sea
so
n R
ice
Dry
Sea
so
n R
ice
Wet
Sea
so
n R
ice
Dry
Sea
so
n R
ice
Co
rn
KH1BB MM2AYD LA1CH TH3CP TH4NE VN2MRD VN3LM
2012
The farms in Laos PDR, Thailand and Vietnam were on one level with regard to rice yields. Only
the farm TH4NE was out of line, caused by growing a high quality, but low yielding variety of
rice. On the farms in Cambodia and Myanmar the rice yields were significantly lower. This might
be caused by the low amount of fertilizer applied (see Figure 16). With regard to other cash
crops grown in the rotation, corn yielded 8.3 t.
When the yield of wet and dry season rice is compared in the typical farm regions in Laos
(LA1CH), Thailand (TH3CP) and Vietnam (VN2MRD), one can see that the yield of dry season rice
is slightly higher than of wet season rice. Yields of the dry season rice are often higher due to a
lower cloud cover and a higher radiation during dry season, provided that water, nutrients and
other factors are not limiting.

46 Chapter 4 Cross Country Comparison
The following figure shows the crop establishment cost, which includes the cost of seeds,
fertilizers, and chemicals used. Here, one can distinguish between the intensive farms in
Thailand and Vietnam and the extensive farms in Cambodia, Myanmar and Laos PDR on the
edge to an intensive farming system.
Figure 15: Crop establishment cost in USD per ha in 2012
0
100
200
300
400
500
600
700
800
900
1,000
We
t S
eas
on
Ric
e
Mu
ng
Be
an
s
Mu
ng
Be
an
s
We
t S
eas
on
Ric
e
We
t S
eas
on
Ric
e
Dry
Sea
so
n R
ice
We
t S
eas
on
Ric
e
Dry
Sea
so
n R
ice
We
t S
eas
on
Ric
e
We
t S
eas
on
Ric
e
Dry
Sea
so
n R
ice
We
t S
eas
on
Ric
e
Dry
Sea
so
n R
ice
Co
rn
KH1BB MM2AYD LA1CH TH3CP TH4NE VN2MRD VN3LM
Seeds Nitrogen Phosphorus Potash Herbicides Fungicides Insecticides
Crop establishment cost for rice on the typical farms in Cambodia, Myanmar and Laos PDR is
approximately one order of magnitude, but differs strongly in their composition. In Cambodia,
farm KH1BB’s seed and herbicide costs are the main expenses, while fertilizer costs are low. The
opposite is true for the typical farm MM2AYD in Myanmar. The main driver for establishment
costs are the applied fertilizer, as farmers used their own seeds. The seed cost is opportunity
cost based on market prices for rice. No chemicals were applied, because weeding was done by
hand. This applies to LA1CH, too.
The rice establishment costs in Thailand and Vietnam are similar, and seed costs are
comparable. Minor differences occur in the use of fertilizer. Chemicals against pests and
diseases were not applied on the TH4NE farm in 2012. Instead, weeding was done manually.
Crop establishment cost for corn was very high as relatively high amounts of fertilizer were
applied, as it is shown in Figure 16 in detail.
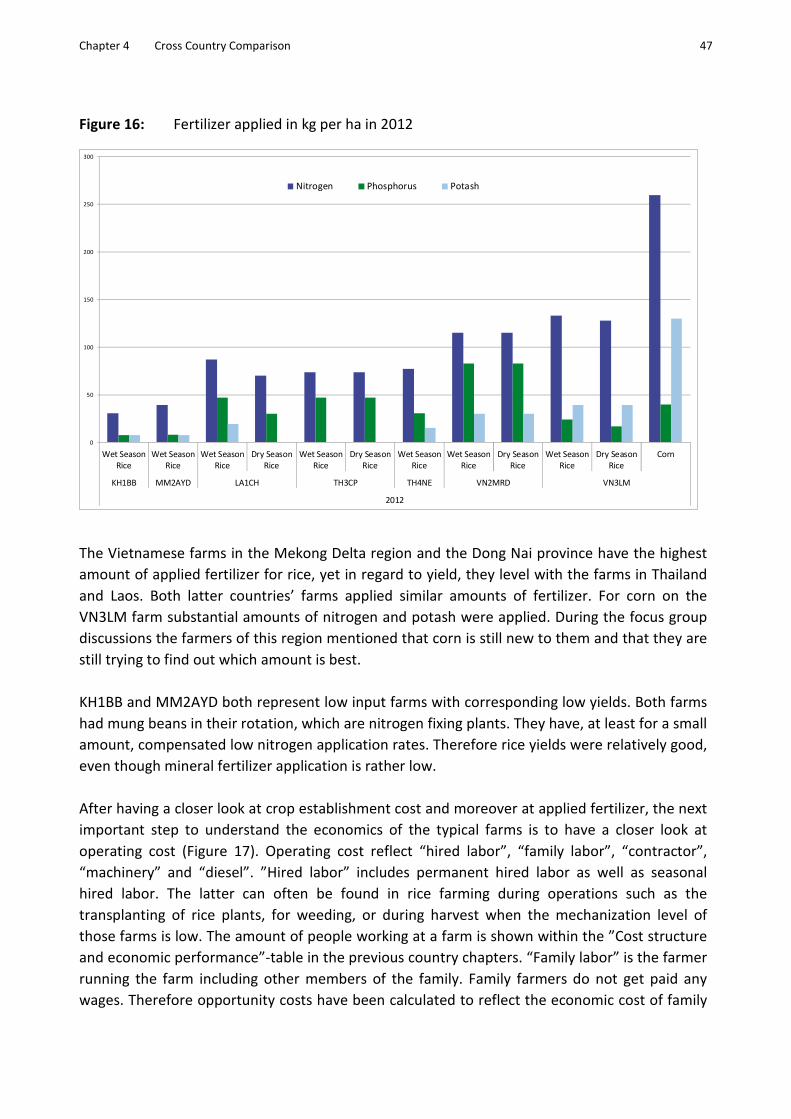
Chapter 4 Cross Country Comparison 47
Figure 16: Fertilizer applied in kg per ha in 2012
0
50
100
150
200
250
300
Wet Season
Rice
Wet Season
Rice
Wet Season
Rice
Dry Season
Rice
Wet Season
Rice
Dry Season
Rice
Wet Season
Rice
Wet Season
Rice
Dry Season
Rice
Wet Season
Rice
Dry Season
Rice
Corn
KH1BB MM2AYD LA1CH TH3CP TH4NE VN2MRD VN3LM
2012
Nitrogen Phosphorus Potash
The Vietnamese farms in the Mekong Delta region and the Dong Nai province have the highest
amount of applied fertilizer for rice, yet in regard to yield, they level with the farms in Thailand
and Laos. Both latter countries’ farms applied similar amounts of fertilizer. For corn on the
VN3LM farm substantial amounts of nitrogen and potash were applied. During the focus group
discussions the farmers of this region mentioned that corn is still new to them and that they are
still trying to find out which amount is best.
KH1BB and MM2AYD both represent low input farms with corresponding low yields. Both farms
had mung beans in their rotation, which are nitrogen fixing plants. They have, at least for a small
amount, compensated low nitrogen application rates. Therefore rice yields were relatively good,
even though mineral fertilizer application is rather low.
After having a closer look at crop establishment cost and moreover at applied fertilizer, the next
important step to understand the economics of the typical farms is to have a closer look at
operating cost (Figure 17). Operating cost reflect “hired labor”, “family labor”, “contractor”,
“machinery” and “diesel”. ”Hired labor” includes permanent hired labor as well as seasonal
hired labor. The latter can often be found in rice farming during operations such as the
transplanting of rice plants, for weeding, or during harvest when the mechanization level of
those farms is low. The amount of people working at a farm is shown within the ”Cost structure
and economic performance”-table in the previous country chapters. “Family labor” is the farmer
running the farm including other members of the family. Family farmers do not get paid any
wages. Therefore opportunity costs have been calculated to reflect the economic cost of family

48 Chapter 4 Cross Country Comparison
labor. Such calculated opportunity costs reflect the potential incomes that farmers could
theoretically collect from region work besides farming. ”Contractor” means that the farmer hires
an external laborer including corresponding machinery such as a harvester or a machine for
threshing. “Machinery” is related to all on-farm machinery owned and used by the farmer and
their annual depreciation, finance and repairs. ”Diesel” is the expenditure for fuel used for own
machinery.
Figure 17: Operating cost in USD per ha in 2012
0
200
400
600
800
1,000
1,200
1,400
We
t S
eas
on
Ric
e
Mu
ng
Be
an
s
Mu
ng
Be
an
s
We
t S
eas
on
Ric
e
We
t S
eas
on
Ric
e
Dry
Sea
so
n R
ice
We
t S
eas
on
Ric
e
Dry
Sea
so
n R
ice
We
t S
eas
on
Ric
e
We
t S
eas
on
Ric
e
Dry
Sea
so
n R
ice
We
t S
eas
on
Ric
e
Dry
Sea
so
n R
ice
Co
rn
KH1BB MM2AYD LA1CH TH3CP TH4NE VN2MRD VN3LM
Hired labor Family labor Contractor Machinery Diesel
The farms TH4NE, VN2MRD and VN3LM had lower operating cost when growing rice compared
to LA1CH or MM2AYD, although wages within Thailand and Vietnam are higher. Given the fact
that yields of the two Vietnamese farms were rather high - this suggests that the Vietnamese
farmers were able to use labor rather efficiently. As far as the Thai farm TH4NE is concerned,
revenues are rather high. Therefore this farm can be considered to be able to achieve relatively
high labor productivity. A more detailed look at labor productivity will be given further below.
When farming operations on the Thai or Vietnamese farms are done by hired laborers, instead
of using contractors and their related machinery, operating cost increase due to high labor costs.
This is illustrated in Figure 17 on the TH3CP farm and on the VN3LM farm in corn production.
Costs for hired labor account for more than 1,000 USD per hectare, far more than 50 % of the
operating cost.
Wage rates are still relatively low on the Cambodia, Laos and Myanmar farms. Therefore labor
intensive operations, such as transplanting and harvesting, are often done manually instead of

Chapter 4 Cross Country Comparison 49
using contractor services. As the farm KH1BB is relatively small, most work was done by the
farmer, except harvesting, which was done by a contractor.
In countries with high labor wage rates, farmers tend to outsource operations to contractors.
The contractors often use machinery which has a capacity larger than the average farm
machinery in these regions (for example a four-wheel tractor instead of a two wheeled one).
Therefore, some farmers purchase such machinery with the intent to offer contract services to
others. This situation can be found at the VN3LM farm in Vietnam, which does not have its own
farm machinery at all. By the use of contract services, this type of grower is able to benefit from
labor productivity enhancing machinery without being forced to make respective investments
himself. Given high wage rates – and respectively high opportunity cost - using small own
machinery (for example a two-wheel tractor) seems to be not economically.
Figure 18 shows the key cost elements in USD per ha for the selected typical farms. Key cost
elements include “direct cost”, “operating cost” and “land cost”. “Land cost” equals the cost of
renting an additional ha of arable land – it is calculated for rented land as well as for owned
land. In the latter case this cost reflects opportunity cost of using this land by the grower rather
than renting it out to others. When comparing land cost across the samples one realizes that
farms in Thailand and Vietnam have to pay significant land rents (or respective opportunity cost
when they farm on their own land). Contrary, farms in Myanmar, Laos and Cambodia can use
the land almost for free. This finding reflects the fact that in the first two countries dynamic land
markets exist with respective ownership rights. In the latter group, however, the commercial
land markets either do not exist at all – as it is the case in Myanmar, where the state owns the
land and rents it out to growers – or as in the case of Laos and Cambodia it can be assumed that
land lords have not yet been able to capture significant value from growers by realizing
significant land rents. Of course this hypothesis is based on the assumption that economic land
productivity is at least comparable to the farms in Vietnam and Thailand.
Key cost elements on the farms in Thailand and Vietnam are higher than on the farms in the
other countries, due to of higher direct cost and land cost, while operating cost on the farms in
Thailand and Vietnam were in most cases relatively low, except on TH3CP. On the VN3LM farm
key cost elements while growing corn were high on a “per ha” base, as was the corn yield.
On the typical farms in Cambodia, Myanmar and Laos PDR operating cost were responsible for
the largest share of the cost, as land cost were not important and relative few inputs were used,
resulting in low direct cost.
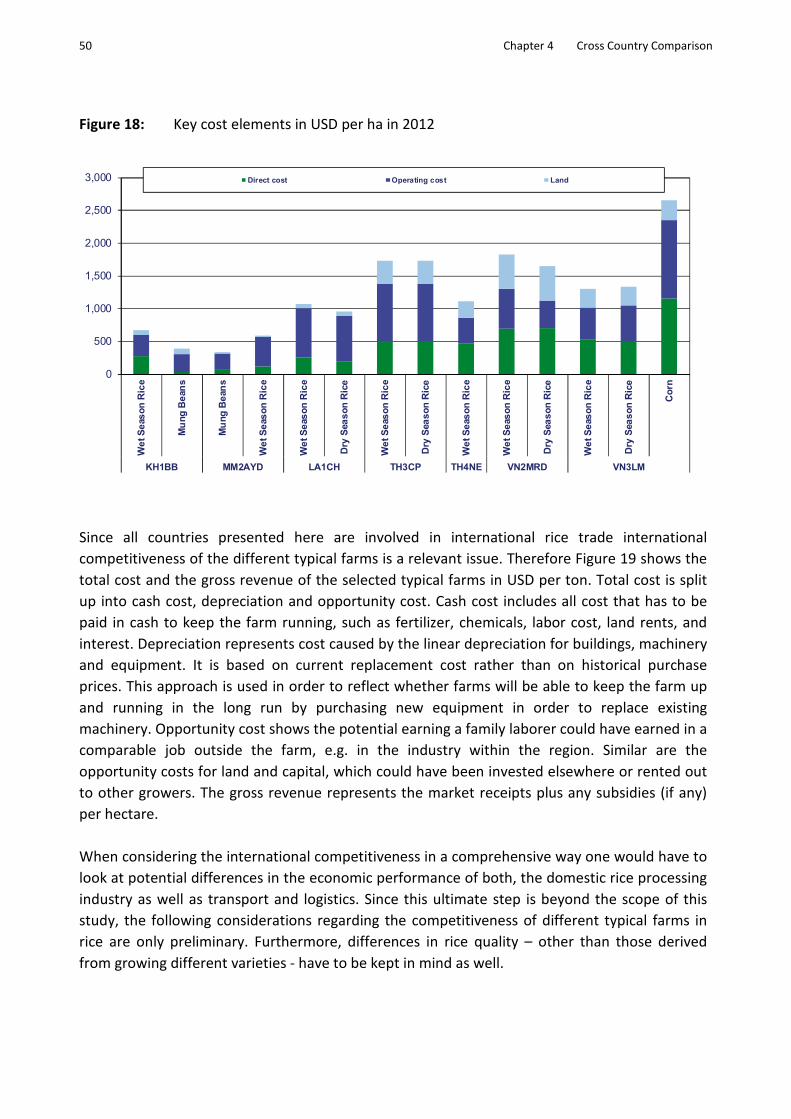
50 Chapter 4 Cross Country Comparison
Figure 18: Key cost elements in USD per ha in 2012
0
500
1,000
1,500
2,000
2,500
3,000
We
t S
eas
on
Ric
e
Mu
ng
Be
an
s
Mu
ng
Be
an
s
We
t S
eas
on
Ric
e
We
t S
eas
on
Ric
e
Dry
Sea
so
n R
ice
We
t S
eas
on
Ric
e
Dry
Sea
so
n R
ice
We
t S
eas
on
Ric
e
We
t S
eas
on
Ric
e
Dry
Sea
so
n R
ice
We
t S
eas
on
Ric
e
Dry
Sea
so
n R
ice
Co
rn
KH1BB MM2AYD LA1CH TH3CP TH4NE VN2MRD VN3LM
Direct cost Operating cost Land
Since all countries presented here are involved in international rice trade international
competitiveness of the different typical farms is a relevant issue. Therefore Figure 19 shows the
total cost and the gross revenue of the selected typical farms in USD per ton. Total cost is split
up into cash cost, depreciation and opportunity cost. Cash cost includes all cost that has to be
paid in cash to keep the farm running, such as fertilizer, chemicals, labor cost, land rents, and
interest. Depreciation represents cost caused by the linear depreciation for buildings, machinery
and equipment. It is based on current replacement cost rather than on historical purchase
prices. This approach is used in order to reflect whether farms will be able to keep the farm up
and running in the long run by purchasing new equipment in order to replace existing
machinery. Opportunity cost shows the potential earning a family laborer could have earned in a
comparable job outside the farm, e.g. in the industry within the region. Similar are the
opportunity costs for land and capital, which could have been invested elsewhere or rented out
to other growers. The gross revenue represents the market receipts plus any subsidies (if any)
per hectare.
When considering the international competitiveness in a comprehensive way one would have to
look at potential differences in the economic performance of both, the domestic rice processing
industry as well as transport and logistics. Since this ultimate step is beyond the scope of this
study, the following considerations regarding the competitiveness of different typical farms in
rice are only preliminary. Furthermore, differences in rice quality – other than those derived
from growing different varieties - have to be kept in mind as well.
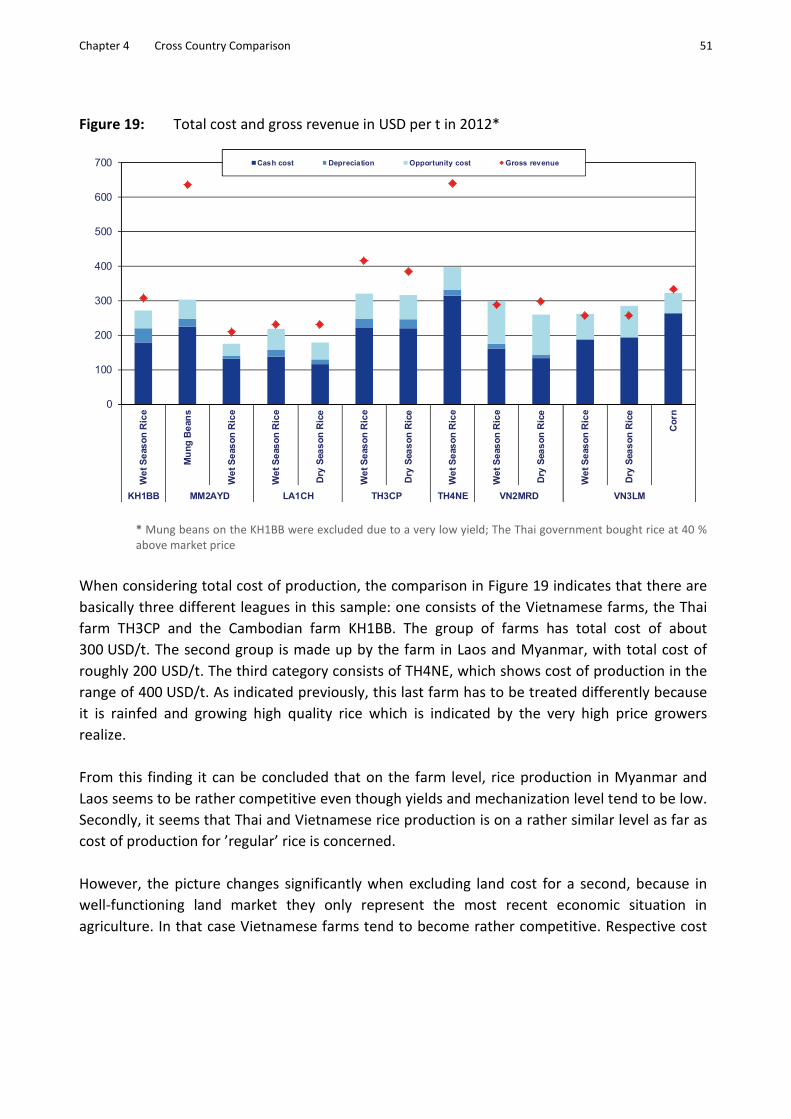
Chapter 4 Cross Country Comparison 51
Figure 19: Total cost and gross revenue in USD per t in 2012*
0
100
200
300
400
500
600
700
We
t S
eas
on
Ric
e
Mu
ng
Be
an
s
We
t S
eas
on
Ric
e
We
t S
eas
on
Ric
e
Dry
Sea
so
n R
ice
We
t S
eas
on
Ric
e
Dry
Sea
so
n R
ice
We
t S
eas
on
Ric
e
We
t S
eas
on
Ric
e
Dry
Sea
so
n R
ice
We
t S
eas
on
Ric
e
Dry
Sea
so
n R
ice
Co
rn
KH1BB MM2AYD LA1CH TH3CP TH4NE VN2MRD VN3LM
Cash cost Depreciation Opportunity cost Gross revenue
* Mung beans on the KH1BB were excluded due to a very low yield; The Thai government bought rice at 40 %
above market price
When considering total cost of production, the comparison in Figure 19 indicates that there are
basically three different leagues in this sample: one consists of the Vietnamese farms, the Thai
farm TH3CP and the Cambodian farm KH1BB. The group of farms has total cost of about
300 USD/t. The second group is made up by the farm in Laos and Myanmar, with total cost of
roughly 200 USD/t. The third category consists of TH4NE, which shows cost of production in the
range of 400 USD/t. As indicated previously, this last farm has to be treated differently because
it is rainfed and growing high quality rice which is indicated by the very high price growers
realize.
From this finding it can be concluded that on the farm level, rice production in Myanmar and
Laos seems to be rather competitive even though yields and mechanization level tend to be low.
Secondly, it seems that Thai and Vietnamese rice production is on a rather similar level as far as
cost of production for ’regular’ rice is concerned.
However, the picture changes significantly when excluding land cost for a second, because in
well-functioning land market they only represent the most recent economic situation in
agriculture. In that case Vietnamese farms tend to become rather competitive. Respective cost

52 Chapter 4 Cross Country Comparison
add up to around 200 USD/t1 similar to the farms in Myanmar and Laos, which run at around
200 USD/t when excluding land cost. This means, the overall management of rice production in
Vietnam is done very efficient.
This fact is rather relevant in case of rice prices – as other agricultural commodity prices – they
will go down again as projected by some experts (see: Baldos and Hertel, 2014; FAPRI, 2014;
Zimmer, 2014). Whether in such a scenario the Vietnamese farms will continue to produce rice
very much depends on (a) whether there are other more profitable crops available and (b) to
what degree the currently high land prices are the outcome of recently high rice prices. One
example for an attractive alternative crop present in this comparison is corn. As can be seen in
Figure 19, contrary to rice, corn was slightly profitable on the farm VN3LM.
With regard to the profitability of rice it seems that only two farms could not achieve full cost
coverage. These farms are VN3LM and VN2MRD, while growing wet season rice. Cash cost and
depreciation are fully covered, only opportunity costs are not. In the short term this loss will not
have any effects on the farmer’s choice of growing rice. In the long term, however, it might have
an effect, because growers may ask themselves whether other crops and/or quitting farming at
all might be more profitable to them. The latter option of course does not imply that land will
fall idle but rather that farm sizes will increase as a result of a structural change.
Major differences occur when looking at gross revenue per ton of rice. This is a result of the
different varieties grown and due to differences in rice quality. TH4NE’s gross revenue is
outstanding because of the high quality rice being produced. When considering the result for
Thai farms it has to be kept in mind that farmers can sell their products about 40 % above
market price due to the government’s rice pledging. If the 40 % would be deducted from the
gross revenue, Thailand’s typical farms would perform slightly above cash - and depreciation
cost, but not covering total opportunity cost. Similar to the issues discussed regarding the
Vietnamese farms above in such a situation more profitable alternative crops will most likely be
considered more seriously by growers. As has been shown by Weerathaworn (2014) in some
regions in Thailand sugar cane might be such an alternative.
The low gross revenue on the farm in Laos PDR can likely be explained by the lower rice quality
compared to Vietnam’s and Thailand’s selected typical farm in the respective regions. If the rice
quality could be enhanced, while keeping the yield at the same level, the farm LA1CH would
have an excellent performance as labor costs are still relatively low in Laos.
After looking at the rice farm performance the following two paragraphs are focusing on the
intra-farm competitiveness of rice relative to other crops grown in the rotations. Mung beans on
the MM2AYD farm performed outstanding in economic terms, while having a moderate yield
1 The respective figure has been calculated by dividing land cost as displayed in figure 17 by the yield data from
figure 13. It shows that ‘land cost’ per ‘ton of rice’ account for app. 75 to 100 USD/t.

Chapter 4 Cross Country Comparison 53
per ha to put it into perspective, which can still be enhanced. On the farm KH1BB on the other
hand the yield was very low and did not even enable growers to cover cash cost, resulting in a
significant loss. It needs to be seen in upcoming analysis whether this was the outcome of a
particular conditions in 2012 or whether those low yields are typical under the prevailing
agronomic conditions and production systems applied in this region. Under regular weather
conditions and with proper management mung beans yield up to 1.25 t/ha in rainfed areas and
up to 2.75 t/ha when irrigated.
Corn seems to be an alternative to rice as well. Growing corn on the VN3LM farm was profitable
compared to the wet and dry season rice. It was the only crop grown at the VN3LM farm in 2012
which could defray cost and still there was a gap to reach the gross revenue value. If contractor
services could be used to reduce the need of relative expensive hired workers, this could result
in a reduction of establishment cost and would enhance corns’ competitiveness. If farmers
within this region could repeat or increase the yield in coming years, it could result in a changing
growing pattern, given market prices do not drop drastically. As Vietnam was importing around
800.000 t of corn in 2011 there seems to be plenty of space to increase domestic production,
although the peak of importing corn from 2010 (1.6 mill. tons) seems to be exceeded (FAOSTAT,
2014).
After looking at total cost and the gross revenue, Figure 20 provides an overview of returns to
land per crop and ha. This figure does inform about two things: (1) how do individual crops
compare on the farm – indicating whether shifts in cropping pattern might be happening and (2)
to what degree current land rents are capturing the land value.
Figure 20: Return to land (profit plus land cost) in USD per ha in 2012
-400
-200
0
200
400
600
800
1,000
1,200
We
t S
eas
on
Ric
e
Mu
ng
Be
an
s
Mu
ng
Be
an
s
We
t S
eas
on
Ric
e
We
t S
eas
on
Ric
e
Dry
Sea
so
n R
ice
We
t S
eas
on
Ric
e
Dry
Sea
so
n R
ice
We
t S
eas
on
Ric
e
We
t S
eas
on
Ric
e
Dry
Sea
so
n R
ice
We
t S
eas
on
Ric
e
Dry
Sea
so
n R
ice
Co
rn
KH1BB MM2AYD LA1CH TH3CP TH4NE VN2MRD VN3LM

54 Chapter 4 Cross Country Comparison
On Thailand’s selected typical farms the highest return to land occurred, which was mainly
caused by the governmental pledging program, accounting for additional revenue of around 800
USD per ha on average per crop at the TH3CP farm and around 950 USD per ha on the TH4NE
farm. In other words, without this additional revenue return to land at the two Thai farms would
be almost zero and the lowest in this sample.
When comparing the typical farms in the two regions of Vietnam one wonders why the return to
land on the farm in the Mekong Delta region (VN2MRD) is almost twice as high as on the farm
VN3LM. This is resulting due to multiple reasons. First, yields were 1 to 1.5 tons higher per ha.
Second, a higher price was achieved when selling the harvested rice. Third, overall costs on the
VN2MRD farm were lower (see Figure 19). It seems that this situation is reflected in land rents as
well. When looking at figure 17 it shows that land rents in the Mekong Delta region were around
300 USD/ha higher than close to the Lang Minh village. However, an ultimate statement about
this situation would need to take into account the profitability of other competing types of land
use in those regions.
Mung beans, when grown successfully, seemed to be an alternative to rice. On the typical farm
in Myanmar the return to land for mung beans was twice as high as for rice. When considering
that the yield for mung beans can further be increased from 1 ton per ha, it becomes obvious
that mung beans have potential competitive gains to be obtained on farm. On the other hand,
the example of the typical farm in Cambodia indicates that mung bean production is faced with
some significant yield risks. Finally, whether and to what degree mung bean production can be
considered to be an alternative to rice needs to be checked more carefully because it is possible
that rotational constraints and/or climatic conditions limit the ability of growers to switch to this
crop. Of course the same would be true when looking at corn as an alternative crop to rice.
The return to land per ha for corn on the farm VN3LM was as high as for both rice crops
together, therefore at least in 2011 performing outstanding compared to rice. It was the only
crop on the VN3LM farm that could defray all costs. If inputs could be reduced in years to come
the return to land would even increase further, provided market prices stay the same.
Finally, the figures on return to land in this comparison are in line with the differences in land
rents. While land rents tend to be relatively high in Vietnam and Thailand they are rather low in
Myanmar, Laos and Cambodia (see Figure 18). This analysis also suggests that the position of
land lords in the latter three countries are rather weak, as land rents range around 95 USD per
ha, while the return to land is three to four times greater.
Due to economic growth in industry and service sector wages rates have gone up in recent years
in the countries subject to this analysis. In order to get an understanding to what degree current
production systems and farm types will be able to compete in the labor markets “return to
labor” will be calculated and compared to wage rates which farms have to pay or which farmers
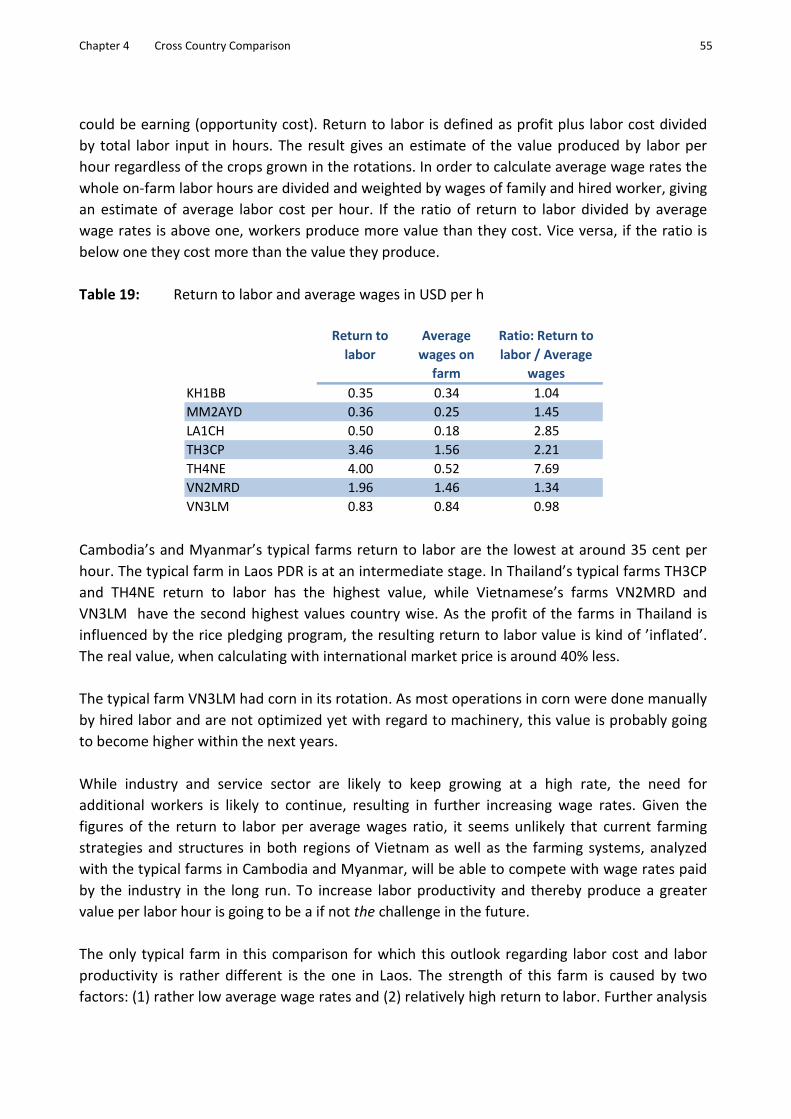
Chapter 4 Cross Country Comparison 55
could be earning (opportunity cost). Return to labor is defined as profit plus labor cost divided
by total labor input in hours. The result gives an estimate of the value produced by labor per
hour regardless of the crops grown in the rotations. In order to calculate average wage rates the
whole on-farm labor hours are divided and weighted by wages of family and hired worker, giving
an estimate of average labor cost per hour. If the ratio of return to labor divided by average
wage rates is above one, workers produce more value than they cost. Vice versa, if the ratio is
below one they cost more than the value they produce.
Table 19: Return to labor and average wages in USD per h
Return to
labor
Average
wages on
farm
Ratio: Return to
labor / Average
wages
0.35 0.34 1.04
0.36 0.25 1.45
0.50 0.18 2.85
3.46 1.56 2.21
4.00 0.52 7.69
1.96 1.46 1.34
0.83 0.84 0.98
TH3CP
TH4NE
VN2MRD
VN3LM
KH1BB
LA1CH
MM2AYD
Cambodia’s and Myanmar’s typical farms return to labor are the lowest at around 35 cent per
hour. The typical farm in Laos PDR is at an intermediate stage. In Thailand’s typical farms TH3CP
and TH4NE return to labor has the highest value, while Vietnamese’s farms VN2MRD and
VN3LM have the second highest values country wise. As the profit of the farms in Thailand is
influenced by the rice pledging program, the resulting return to labor value is kind of ’inflated’.
The real value, when calculating with international market price is around 40% less.
The typical farm VN3LM had corn in its rotation. As most operations in corn were done manually
by hired labor and are not optimized yet with regard to machinery, this value is probably going
to become higher within the next years.
While industry and service sector are likely to keep growing at a high rate, the need for
additional workers is likely to continue, resulting in further increasing wage rates. Given the
figures of the return to labor per average wages ratio, it seems unlikely that current farming
strategies and structures in both regions of Vietnam as well as the farming systems, analyzed
with the typical farms in Cambodia and Myanmar, will be able to compete with wage rates paid
by the industry in the long run. To increase labor productivity and thereby produce a greater
value per labor hour is going to be a if not the challenge in the future.
The only typical farm in this comparison for which this outlook regarding labor cost and labor
productivity is rather different is the one in Laos. The strength of this farm is caused by two
factors: (1) rather low average wage rates and (2) relatively high return to labor. Further analysis

56 Chapter 4 Cross Country Comparison
will be conducted in order to verify these rather low wage rates. At the first sight it seems to be
not extremely plausible that wage rates in Laos are lower than in Cambodia and Myanmar2. This
issue needs further investigation.
As of 2012 the situation in Thailand seems to be much better: current wage rates are
significantly lower than return to labor figures. However, given the enormous problems to
finance the current pledging program from a strategic standpoint, the challenge to increase
labor productivity seems to be comparable. Assuming rice prices in Thailand would go down by
40 % the ratio calculated in table 19 would plunge drastically below 1.
2 The Gross Domestic Product per capita in Myanmar is 1.700 USD, in Cambodia 2.600 USD and in Laos 3.100 USD.
Source: CIA Database, 2014.

Chapter 5 Conclusion and outlook 57
5 Conclusion and outlook
As this project is the starting point for agri benchmark rice farms analysis, yearly updates need
to be done in order to manifest and validate the collected data, and to observe ongoing changes
within the countries and regions. This in turn implies that all findings and results from this report
should be treated with some care. Furthermore, for 2014, it is planned that the Philippines and
Indonesia will join the network.
Substantial differences occurred with regard to rice farm gate prices. This is driven mainly by
three factors. First, the price of rice is very much dependent on the variety that is grown.
Second, the technical rice quality has a major impact on the price. Differences in the technical
quality are caused by moisture content of rice at harvest, related infections with fungi time of
harvest and harvest - and threshing techniques. Finally, the location of the typical farm relative
to markets has of course an impact on farm gate prices. Additional losses - both quantitative and
qualitative – occur post-harvest, especially during the milling process. The agri benchmark
partners in Southeast Asia stated that the rice value chain often needs to be improved in order
to minimize harvest and post-harvest losses and enhance rice quality and thereby increasing
revenues and profits of farms. The findings from this report regarding differences in farm gate
prices provide some evidence to this hypothesis. Therefore agri benchmark has further initiative
to analyze the comparative performance of the entire value chain.
The typical farm data from the selected regions in Thailand, Vietnam, Cambodia, Laos, and
Myanmar show significant differences within rice production systems. While Thailand and
Vietnam produce more intensively with high yields and high input levels – in particular as far as
the use of fertilizers and seeds is concerned - farms in Cambodia and Myanmar grow rice more
extensively while Laos seems to be in an intermediate level. The striking differences in seed cost
raise the question, whether low yields and low prices could be overcome by the farms in
Myanmar and Cambodia by investing more in seeds and fertilizers. Still most farms are
performing well from an economical point of view.
With regard to the competition of international rice markets the following conclusion can be
drawn: total cost per ton is the lowest in Myanmar and Laos, followed by Vietnam. Whether or
not this advantage in cost of production implies a competitive edge on international rice
markets or not mainly depends on the quality issues mentioned above. This is because this
finding coincides with low farm gate prices for those farms which are low in cost of production.
To the degree the low farm gate prices reflect quality issues (be it because of taste or technical
quality) the low cost of production is not an immediate advantage. In the course of the research
for this project anecdotal information was received that the quality issues can be that bad that
the produce cannot be sold on international markets at all.
The comparison of return to land indicates that the on-farm competitiveness of rice is already
now a very relevant issue. The return to land in corn is as high as for the two rice crops grown

58 Chapter 5 Conclusion and Outlook
together on the VN3LM Vietnamese farm. A similar situation can be found on the farm in
Myanmar.
As far as the corn case on the Vietnamese farm is concerned a main driver is most likely due to
price ratios because of the trade positions of Vietnam. While Vietnam is a rice net exporter they
are also a net importer of corn. Therefore, domestic farm gate rice prices are driven by the so-
called “export parity” which is world market price minus domestic transport and logistic costs.
On the other hand, corn farm gate prices are derived from calculating world market prices plus
transport and logistic costs. In the case of the typical farm corn farm gate prices received are
higher than farm gate prices for rice. However, on world markets – when looking at milled rice
equivalent - the opposite is true. The currently low level of mechanization in corn production on
the Vietnamese farm – contrary to rice - leads to high operating cost. Therefore it might be the
case that better mechanization in corn will reduce cost of production and hence result in further
strengthening the competitive edge of corn over rice.
Whether or not this situation may eventually lead to major and lasting shifts in cropping pattern
not only depends on the agronomic feasibility (is it possible to grow for example corn
throughout the year?) and respective political interventions. In any case it seems to be very
important for the growers and institutions in Vietnam to closely monitor and analyze this issue
further. Given the likelihood of increasing rice surpluses in the entire region the issue of on-farm
competitiveness of rice will become even more important. This is why the Southeast Asian agri
benchmark rice network will further invest in improving the knowledge of the topic.
When looking at return to labor relative to average labor cost it appears that already today this
is a burning issue for the typical farms in Vietnam, Myanmar, and Cambodia. In all these cases
the hourly return to labor is in the same range as current labor cost. This implies that the current
farming structures and systems will have a rather hard time to compete on labor market in
future. This assessment is based on the assumption that the industrial developments in these
countries will lead to ongoing increases in wage rates.
In terms of return to labor relative to wage rates Thai farms performed outstanding, mainly
caused by the governmental rice pledging program. What superficially seems to be a big
advantage for local Thai farmers might have a negative impact on economic farm performance
in the long run; as it might depressurize the economic pressure to increase labor productivity.
This could explain why Thailand’s farmers have fewer operations performed by contractors than
farmers in the selected regions in Vietnam although both countries are leading rice exporters.
In order to stay profitable against the background of increasing wage rates it becomes
increasingly important to enhance labor productivity. One option to do so is (additional)
outsourcing of labor intensive tasks to contractors. This topic is of high interest for the agri
benchmark network and we are going to improve our knowledge and insights in this topic. In
particular the issue of possible obstacles for increased use of contractor services and options to
overcome will become a focal point for us.
Chapter 6 References 59
6 References
Baldos UL, Hertel T (2014): Bursting the Bubble: A Long Run Perspective on Crop Commodity Prices; GTAP
Working Paper No. 80
FAPRI (Food and Agricultural Policy Research Institute) (2014): August 2014 Baseline Update for U.S.
Agricultural Markets; FAPRI-MU Report #4-14
Isvilanonda S (2010): Thai Rice: A Change in Production Structure and Distribution Channel. Knowledge
Network Institute of Thailand, Bangkok, Thailand, ISBN: 978-616-202-198-5 (in Thai)
Isvilanonda S, Poapongsakorn N (1995): Rice Supply and Demand in Thailand, Thailand Development
Research Institute, Bangkok, Thailand
Weerathaworn P (2014): Sugarcane production in Thailand; Presentation at the Cash Crop Conference
2014, Des Moines (unpublished)
Zimmer Y (2014): Global ag markets – game changer for an era of higher commodity prices?;
Presentation at the Cash Crop Conference 2014, Des Moines (unpublished)


Chapter 7 Published agri benchmark Working Papers 61
7 Published agri benchmark Working Papers
Leasing and purchasing arable land - framework conditions, profitability and investor’s view
Working Paper 2014/5, Zimmer, Y.
http://www.agribenchmark.org/fileadmin/Dateiablage/B-Cash-Crop/Working-Paper/cc-1406-
land-markets-YZ.pdf
German rapeseed on the verge of collapse? Consequences of a new EU biofuel policy
Working Paper 2013/4, Zimmer Y. http://www.agribenchmark.org/fileadmin/Dateiablage/B-
Cash-Crop/Working-Paper/cc-1304-EU-biofuel-YZ.pdf
China ́s Corn Production - Where to establish agri benchmark farms in corn?
Working Paper 2013/3, Hu X; Zimmer Y. www.agribenchmark.org/fileadmin/Dateiablage/B-
Cash-Crop/Working-Paper/cc-1303-China-XH-YZ.pdf
Speciality crops - A perspective for Kazakh arable producers?
Working Paper 2013/2, Zimmer Y; Börsch M.
www.agribenchmark.org/fileadmin/Dateiablage/B-Cash-Crop/Working-Paper/cc-1302-
Kazakhstan-YZ.pdf (English Version);
www.agribenchmark.org/fileadmin/Dateiablage/B-Cash-Crop/Working-Paper/cc-1302-
Kazakhstan-YZ-rus.pdf (Russian Version)
Rapeseed in Central and Eastern Europe - A lot of room for growth
Working Paper 2012/1, Zimmer Y. www.agribenchmark.org/fileadmin/Dateiablage/B-Cash-
Crop/Working-Paper/cc-1201-rapeseed-YZ-en.pdf (English Version);
www.agribenchmark.org/fileadmin/Dateiablage/B-Cash-Crop/Working-Paper/cc-1201-
rapeseed-YZ-rus.pdf (Russian Version)