agri-food trade in 2020: map 2021
TRANSCRIPT

%
page 1
Agriculture
and Rural
Development
M
on
ito
rin
g A
gri-
trad
e P
olic
y
MA
P 2
02
1–2
Contents
Foreword 1
Summary 2
1. International setting 4
2. World trade in agri-food 5
3. EU performance in agri-food trade 7
3.1 EU agri-food trade development 8
3.2. EU agri-food export products 11
3.3. EU agri-food import products 14
3.4. EU agri-food trade under 16 preferential agreements
4. Agri-food trade with key partners 17
4.1. United Kingdom 17
4.2. United States 20
4.3. China 23
4.4. Brazil 27
4.5. Africa 30
Annexes 33
Agri-food trade in 2020:
2020 has proved to be difficult but successful year for EU agri-food trade which reached a value of €306 billion: €184 billion of exports and €122 billion of imports. This means that we confirm for yet another year our position as the largest global exporter and we became the third biggest importer of agri-food products.
Trade is a political priority for the European Commission, a priority that I have strongly supported myself. The EU is the largest trading bloc and a wide-ranging network of free trade agreements (FTAs) underpins its position in world trade. In our trade agenda, we have sought to gain new market share for our wide range of agri-food products and preserve the appropriate level of market opening for our sensitive sectors. International trade has played a crucial role in mitigating devastating economic impact of the COVID pandemic and proved to be a central tool in enhancing our resilience.
The success of agricultural trade is clearly linked to the Common Agricultural Policy, supporting competitiveness and innovation, and to the excellent reputation of our products as being safe, sustainably produced, nutritious and of high quality.
This report provides an overview of the development of EU and global agricultural trade in 2020. Enjoy, it's from Europe!
Janusz Wojciechowski European Commissioner for Agriculture
%
page 2
Agriculture
and Rural
Development
Executive summary
The year 2020 marked one of the biggest recessions in global economic activity and world trade. During this period, the EU economy contracted by 6% and its international trade followed a similar downward trend - EU exports of goods decreased by 9% and imports by 12%, compared to 2019.
By contrast, EU international trade in agri-food reported a slight growth. Over the course of 2020, the value of EU agri-food exports increased to € 184.3 billion (a growth of 1.4% compared to 2019), while the value of imports rose to € 122.2 billion (a growth of 0.5%).
As a result, the EU further reinforced its leading position among the world’s biggest exporters. On the import side, the EU has become the third largest importer after the US and China.
The contraction in global trade was accompanied by increasing prices of food, including commodities as evidenced by the increases reflected in the FAO Global Price Index.
The EU exports a wide range of products from all parts of the value chain which demonstrates the competitiveness of the EU agri-food sector in a variety of product classes ranging from commodities to highly processed food industry products. EU imports, on the other hand, are clearly dominated by basic agricultural food and feed products, which represent about 75% of all imports.
Looking at product categories, exports of pig meat and wheat strongly contributed to the increase in EU overall agri-food exports. Conversely, spirits and liqueurs as well as wine are among the sectors that experienced a difficult period for a number of reasons (e.g. the COVID pandemic, US retaliatory tariffs).
The growth in EU agri-food imports was mainly driven by increases in import values for oilseeds, other than soya beans; fatty acids and waxes, palm oil, fruit including tropical fruit, and soya beans.
China, Switzerland and the Middle East and North Africa (MENA) region were the major growth destinations for EU agri-food exports in 2020. The value of EU exports fell most to the United States, Turkey, Singapore and Japan.
In terms of imports, Canada grew significantly as a source for the EU imports. By contrast, EU imports declined most in value from the United Kingdom, Ukraine and the United States.
In 2020, the UK has become the EU’s most important partner in agri-food trade, with a share of 23% in total EU agri-food exports and 13% in total imports.
With EU exports and imports both decreasing, its trade surplus with the US increased by 2% when compared to 2019, as falls on the imports side were stronger. China became the top destination for US agri-food exports.
EU agri-food exports to China were primarily driven by continued record high sales of pig meat which increased by 74%. Pig meat and meat offal – the latter mainly comprised of products originating from pigs – accounted for over 40% of EU exports to China in 2020, demonstrating the importance of this market for the pig meat sector.

%
page 3
Agriculture
and Rural
Development
Brazil’s exports to China continued to increase in 2020, absorbing 35% of its total agri-food exports. Combined agri-food exports from Brazil to the EU and the US now account for half of Brazilian exports to China. In 2020, Brazil supplied 50% of extra-EU demand for soya beans and 40% for oilcakes.
Wheat continued to be the leading EU export product to Africa with a 23% share of the EU’s total export basket, whereas cocoa beans dominate in the EU imports from Africa, with the same share of 23%.
Most African countries benefit from duty-free, quota-free access to the EU market under the "Everything But Arms" scheme and for many of them Economic Partnership Agreements (EPAs) or other trade agreements with the EU are applied, encouraging regional cooperation and trade.
In 2020, the EU applied 45 free trade agreements (FTAs) with 77 partners. The share of agri-food trade under preferential agreements is also expanding and in 2021, it accounted for 31% and 41% of total EU agri-food exports and imports, respectively.
The value of EU agri-food trade under preferential agreements expanded more in relative terms compared to total EU agri-food trade. EU agri-food exports under preferential agreements increased by almost 2% to reach the value of € 57.8 billion. The value of EU agri-food imports under preferential agreements was higher by almost 3%, reaching € 50.3 billion, compared with 2019.
The year 2020 also brought the entry into force of the EU-Vietnam Trade Agreement and the signature of a modernised agreement with Mexico. A landmark agreement with China was concluded to protect 100 European Geographical Indications (GIs) in China and 100 Chinese GIs in the EU against usurpation and imitation. Finally, negotiations on the Trade and Cooperation Agreement with the United Kingdom were concluded.

page 4
Agriculture
and Rural
Development
1. International setting
In 2020, global economic activity was expected to pick up after a sluggish growth in 2019. However, early signs of recovery were suppressed by the outbreak of the COVID-19 pandemic. As a result, the year 2020 proved to be the worst period for the global economy and trade for decades. IMF now estimates a contraction of 3.5% for the global economy in 2020 but projects a strong growth of 6% in 2021 and 4.4% in 20221. Likewise, during the period of 2020, the EU economy contracted by 6%, but according to the latest forecast, a strong rebound is expected in 2021 and 2022 by over 4%2. This growth is projected to be driven by private consumption, investment, and a rising demand for EU exports from a strengthening global economy.
The performance of world trade clearly reflects the global economic context. The volume of world merchandise trade has fallen by 5.3% in 2020. According to the latest estimates by WTO, global trade is expected to increase by 8% in 2021 and 4% in 20223.
The relatively positive short-term outlook for global trade is, however, marred by regional disparities, continued weakness in services trade, and lagging vaccination timetables, particularly in developing countries. COVID-19 continues to pose a threat, as new waves of infection could easily undermine a hoped-for recovery.
In addition to the above mentioned factors, EU trade performance in 2020 was affected by the withdrawal of the United Kingdom for the EU as of 1st February 2020 and the negotiations about the Trade and Cooperation Agreement. While during the last year, the EU traded with the UK under single market conditions until the end of transition period on 31 December 2020, the whole year was characterised by significant uncertainty for businesses about future trade conditions. The Trade and Cooperation Agreement negotiated until the last possible moment was signed on 29th December 2020 and provisionally
1 World Economic Outlook, April 2021, International Monetary Fund. 2 European Economic Forecast, Spring 2021, European Commission. 3 WTO forecast, March 2021: https://www.wto.org/english/news_e/pres21_e/pr876_e.htm
applied as of 1 January 2021. The agreement foresees duty-free, quota-free trading conditions. While this is the highest degree of market access that the EU has concluded with any trading partner, it needs to be underlined that trade with the UK is and will not be as frictionless as before.
In recent years, the EU made progress on other multiple bilateral trade negotiations as well as on the implementation of the concluded trade agreements.
As of 1 August 2020, the EU- Vietnam Free Trade Agreement entered into force. Vietnam is the second largest destination for EU agri-food exports in south-east Asia. Together with the Free Trade Agreement with Singapore that has entered into force since November 2019, EU presence in the ASEAN region – a prime location for international trade - is further strengthened.
The year 2020 also marked the signature of an EU-China bilateral agreement to protect 100 European Geographical Indications (GIs) in China and 100 Chinese GIs in the European Union against usurpation and imitation. During the first four years after its entry into force, the scope of the agreement will expand to cover an additional 175 GI names from both sides.
In 2020, the EU also signed a modernised association agreement with Mexico for which negotiations on the trade part were concluded in 2018. The new agreement, once ratified, will replace the existing EU-Mexico Global Agreement, which entered into force in 2000.
Ratification is also awaited for an EU-Mercosur Association Agreement for which an 'agreement in principle' was reached on 28 June 2019.
The EU also made notable progress on multiple bilateral negotiations, including those with Australia, New Zealand, Indonesia and with Chile on the modernisation of the current association agreement.
Over the course of 2020, EU international trade in agri-food products was negatively impacted by US retaliatory tariffs imposed in the context of the WTO civil aircraft dispute. The retaliatory tariffs covered several agricultural products from various EU countries and imposed an additional ad-valorem duty

page 5
Agriculture
and Rural
Development
of 25%, including for key EU agricultural exports, such as wine, whiskey, dairy (cheeses, butter), olive oil, table olives. On 5 March 2021, the EU and US reached an agreement to suspend the punitive tariffs for a four-month period. This period creates space to try to find a solution to this long-running dispute.
Regarding world trade policy, multi-nation regional trade deals have been also advancing. For example,
the African Continental Free Trade Area4 (AfCFTA) signed by 54 members of the African Union (AU) in March 2018 and following the ratification of 36 of the signatory states entered into force on 1st January 2021. The AfCFTA establishes a single market for African goods and services, eliminates tariffs by 90 per cent and tackles non-tariff barriers such as customs delays.
In the Asian Pacific area, the Regional Comprehensive Economic Partnership (RCEP) was signed on 15 November 2020. RCEP is a multilateral agreement extending and deepening the free trade between the member states of the Association of Southeast Asian Nations (ASEAN) and China, Japan, and South Korea as well as Australia and New Zealand. The process of ratification is currently ongoing and upon its entry into force, RCEP will be the world's largest regional trade agreement in terms of GDP and population. RCEP's countries currently account for about 29% (€21.7 trillion) of global gross domestic product and approx. 29% (2.3 billion) of the world's population.
On February 14, 2020, the Economic and Trade Agreement between the United States of America and the People's Republic of China - Phase One - went into effect. China agreed to expand purchases of certain US goods and services by a combined $200 billion for the two-year period from January 2020, through December 2021; above the 2017 baseline levels.
In regard to covered agricultural products, China and US agreed to an additional $12.5 billion of purchases in 2020 above 2017 levels, translated into an annual commitment of $36.6 billion (US imports from China) and $33.4 billion (US exports to China). Through 2020- the first year of the agreement, US exports to
4 The AfCFTA brings together 55 African countries, out of which Eritrea
has not yet signed the AfCFTA.
China of covered agricultural products were $27.3 billion (82% of the commitment) and US imports from China totalled $23.6 billion (64% of the commitment)5.
2. World trade in agri-food6
Agriculture trade performance is a reflection of the global economic context. While for global economic activity and trade in goods declines were reported in 2020, international trade in agri-food seems to overall report marginal increases. However, the situation differs from one country to another, in particular for certain leading exporters and importers, as described below.
Graph 1: Top world agri-food exporters 2018 - 2020 (billion €)
When comparing to 2019, the ranking of the top five world agri-food exporters has remained unchanged in 2020, after the EU took over the leading position from the US in 2013 (graph 1). The EU27 further reinforced its position and attained exports worth €184.4 billion with a 1.4% increase. The US remained an equally strong agri-food trading nation with its exports progressing by over 3% and totalling €136 billion. The gap to the third top exporter, Brazil has narrowed down slightly as its agri-food exports
5 https://www.piie.com/research/piie-charts/us-china-phase-one-tracker-chinas-purchases-us-goods; accessed 06-07-2021. 6 Agri-Food products refers to the WTO definition of agricultural products and includes the chapters 1-24 (excluding fish and fish products) of the Harmonised System, and a number of headings in chapters 33, 35, 38, 41, 43 and 50-53. The aggregate of EU Agri-Food trade does not contain tariff codes CN 3302.10.40 and CN 3302.10.90 (some odoriferous substances which are regarded as industrial products). The details of the product categories referred to in this report are available on: https://ec.europa.eu/info/sites/info/files/food-farming-fisheries/farming/documents/agrifood-product-classes-details_en.pdf

page 6
Agriculture
and Rural
Development
recorded a solid growth rate of over 5%, reaching €77 billion. Canada was also able to see an impressive 10% growth of its agri-food exports (€45 billion), while China reported a 4% decrease (€50 billion). Altogether, the export value of below top five world players increased by 2% in 2020 after having risen by 5% in 2019.
The other main world agri-food exporters, Indonesia, India, and Mexico reported all higher values of exports (€31 billion, €29 billion, and €26 billion respectively), whereas they were lower in case of Australia and Thailand (to reach over €26 billion each).
As graph 2 shows, agri-food imports likewise further increased, by altogether 4% for the top five world importers after already a strong growth of 7% in 2019. With an impressive 16% increase in 2020 and 13% in 2019, China outpaced the US as the world’s biggest importer of agri-food products (€138 billion). US imports were 1% higher (€129 billion) after already a strong increase of 8% in 2019. EU27 came third with imports worth €122 billion (↗0.3%).
Graph 2: Top world agri-food importers 2018 - 2020 (billion €)
The United Kingdom and Japan, next in the ranking, follow far behind the three big players in global agri-food imports. The UK, which left the European Union on 31st January 2020, reported a slight decrease (↙2%) in its imports worth €55 billion, including part being still sourced from the EU27 under single market conditions in 2020. Japan also noted a decrease of 5% to attain €51 billion after having risen in 2019 by 6%.
The other main agri-food importers- Canada, South Korea – increased slightly their imports by 1% each (to reach €33 billion and €25 billion, respectively), whereas Russia reported agri-food imports worth €24 billion – 4% lower compared to 2019.
The profile of the main players among world agri-food traders varies: the EU, US, China and Canada have a strong domestic production of agri-food and feature at the same time among top exporters and importers. Brazil and Argentina are primarily suppliers - just like Australia and New Zealand, which however operate at a lower aggregate level - ranking 3rd and 11th exporters worldwide respectively. Japan, the United Kingdom and Russia (the 8th biggest importer), in contrast, are net purchasers on world agricultural markets.
Over the course of 2020, the UN Food and Agriculture Organisation’s (FAO) food price index decreased slightly during the first five months of the year, while since May, the index started to grow quickly to reach 108.5 points in December (graph 3). The increase was primarily driven by rising values of the vegetable oil price index and to a lesser extent those of cereals.
Overall, for the year 2020, the benchmark index averaged 98 points, a three-year high and a 3% increase compared to 2019, but still down more than 25% from its historical peak in 2011. However, in 2021 the index has continued to expand even further.
Graph 3: FAO food price index 2018 -2021
Source: FAO

page 7
Agriculture
and Rural
Development
3. EU performance in agri-food trade
Agriculture and the food related industries and services together provide almost 44 million jobs in the EU, including regular work for 22 million people within the agricultural sector itself7. The agriculture and food production and processing chain together account for 7.5% of employment and 3.7% of total value added in the EU. The output of the EU agricultural sector was estimated at € 427 billion in 20178, which is a strong increase compared to the 2016 value of € 406 billion.
Exports of agri-food products provide income and are a driver for jobs and growth for the European agri-food sector. The share of exports in production value has been on the upward trend in the last 10 years, both for agri-primary products and for products from the food industry, and in 2020 it reached 16.5% and 14.4%, respectively, as shown in graph 4. Thus, exports are still an increasingly important source of income for EU agricultural and food producers.
Graph 4: Share of export in production values
Source: Calculations based on Eurostat
The European Commission helps EU exporters to identify export opportunities and secure business deals through promotion activities9, including high level missions of the Commissioner for Agriculture to non-EU countries with strong potential for EU agricultural exports.
7 Food and Farming – Focus on Jobs and Growth, DG Agriculture and
Rural Development, December 2015. 8 Eurostat, Economic Accounts for Agriculture. 9 Cf. also: Enjoy it's from Europe - Promoting EU food and farming
abroad: https://www.youtube.com/watch?v=_IyceHSCYoI&t=12s
The export competitiveness of EU agri-food producers in 2020 was hampered by the appreciation of the euro against currencies of its main trading partners (↗1% against the pound sterling, ↗2% against the US dollar and the Chinese yuan, ↗34% against the Brazilian real). On the other hand, the euro exchange rate stagnated against the Japanese yen and depreciated against the Swiss franc (↙4%), which made EU exports more competitive.
Graph 5: Euro exchange rate against currencies of its main trading partners, 2010 - 2020
As graph 5 shows, this is a somewhat different situation than in 2019, during which the euro depreciated against currencies of most of its trading partners (with the exception of the Brazilian real).
-20%
-10%
0%
10%
20%
30%
40%
2010 2011 2012 2013 2014 2015 2016 2017 2018 2019 2020
EUR exchange rate(annual change compared to previous year, %)
Swiss franc Pound sterling Brazilian real
Chinese renminbi-yuan US dollar
Importance of quality schemes for EU agri-food exports
Geographical indication (GI) schemes are becoming increasingly important for EU agriculture and agri-food exports. These schemes protect the names of specific products and help to promote their unique characteristics, linked to their geographical origin. A study on the economic value of EU quality schemes, published in March 2021, showed that between 2010 and 2017 the share of GI+TSG* products in EU exports to third countries by value grew by 56%, representing € 17 billion for the EU28 in 2017 and 23% of total EU GI/TSG product sales. Wines remained the most important product category in terms of extra-EU trade (50%) GI/TSG trade, followed by spirits (39%) and other agricultural products and foodstuffs (10%). The two largest GI agri-food product categories exported to non-EU countries were cheeses and meat products.
*) TSG - Traditional Speciality Guaranteed- only GIs schemes are covered by EU trade agreements, but for the purpose of the study, a separation was not possible.

page 8
Agriculture
and Rural
Development
3.1. EU agri-food trade development
In 2020, extra-EU exports of goods fell to €1 931.6 billion (a decrease of 9.4% compared with 2019), and imports fell to €1 714.3 billion (a decrease of 11.6% compared with 2019). As a result, the EU recorded a surplus of €217.3 billion, compared with €191.5 billion in January-December 2019.
In contrast, EU international trade in agri-food products reported a slight growth in comparison to 2019. The value of EU agri-food exports increased to €184.4 billion (a rise of 1.4%), while the value of imports rose to €122.1 billion (a growth of 0.3%). The resulting balance of agri-food trade for 2020 stood at a surplus of €62.3 billion, an increase of 3% compared to 2019. The surplus in agri-food trade now represents one third in the EU overall surplus in international trade in goods.
Looking at monthly developments over the course of 2020 (graph 6), the performance of the EU international trade in agri-food followed a similar downward trend as overall trade in goods with the biggest decline reported in May and moderate growth observed during last quarter of the year.
Graph 6: EU international trade in goods in 2020
However, the EU’s external trade in agri-food has been less affected by COVID-19 compared to trade in industrial goods. In fact, the agri-food sector showed great resilience.
In a result, agri-food products accounted for a solid share of 9% of the value of EU total goods exports in 2020, ranking fourth after machinery and vehicles, other manufactured goods and chemicals.
Graph 7: EU exports by product group in 2020
On the other hand, imports of agri-food products represent 7% of the value of EU total goods imports in 2020, ranking fifth after machinery and vehicles, other manufactured goods, chemicals and raw materials (graph 8).
Graph 8: EU imports by product group in 2020
During the last decade, EU27 agri-food exports and imports expanded continuously except for minor stagnations observed in 2016 and 2018. The annual export growth rate reported a 1.4% rise in 2020 after having picked up firmly with a 7.5% increase in 2019 and a 0.5% rise in 2018. Import growth rates developed from a negative value (↙0.3%) in 2018 to 2.4% upwards in 2019 and slowed down again to a 0.3% rise in 2020. Graph 9 shows the evolution and structure of EU agri-food trade since 2010.
-40%
-30%
-20%
-10%
0%
10%
20%
30%
Jan. 2020 Feb. 2020 Mar.2020
Apr. 2020 May.2020
Jun. 2020 Jul. 2020 Aug. 2020Sep. 2020 Oct. 2020 Nov.2020
Dec. 2020 Jan. 2021 Feb. 2021 Mar.2021
EU27 international trade in goods/agri-food(monthly change compared to previous year, %)
EU27 exports in agri-food EU27 imports in agri-food EU27 exports in goods EU27 imports in goods
Agri-food9 %
Raw materials
3 %
Energy3 %
Chemicals21 %
Machinery & vehicles
39 %
Other manufactured
goods
22 %
Other2 %
Agri-food7 %
Raw materials5 %
Energy13 %
Chemicals14 %
Machinery & vehicles34 %
Other manufactured
goods
26 %
Other2 %

page 9
Agriculture
and Rural
Development
Graph 9: Structure of EU agri-food trade 2010 - 2020
The EU exports a wide range of products from all stages of the value chain which demonstrates the competitiveness of the EU agri-food sector in a variety of product classes reaching from commodities to highly processed food industry products (see graph 9 and annex for product classification). More than half of the exports (58%) are agricultural food and feed products (commodities, other primary and processed agricultural products). More than one third (32%) is accounted for food preparations and beverages. Non-edible agricultural products make up the remaining value (10%). Notably, the share of final products (processed foods and food preparations) in exports increased slightly over the last 10 years, up to 44% in 2020.
EU imports, on the other hand, are clearly dominated by agricultural food and feed products, which represent about 75% of all imports, while food preparations and beverages account for 14%, and non-edible products make up 11%. The share of imports of final agricultural products is in 2020 20% (almost €24 billion), which is considerably lower than the export share for these products (€ 80 billion). This shows the strength of the EU agri-food sector in producing high value added quality produce.
During the last decade, overall EU agri-food trade pattern in terms of the broad product categories have not changed substantially in relative terms, although exports have increased by almost 50% since 2011 and imports expanded by 22%.
In 2020, the top five destinations for EU27 agri-food exports were the United Kingdom10, the United States, China, Switzerland and Japan (graph 10). These five destinations account for over 52% of EU exports.
In 2020, the UK has become the EU largest export market, with a share of 23% in total EU27 agricultural exports. The sales to the UK reported a moderate growth of 1% over the course of 2020 (to reach 41.8 billion) after a slight decrease (↙0.1%) in 2019. The US, which before had been the most significant partner, came second and absorbed almost 12% of EU exports (€21.4 billion) i.e. a bit more than half of the UK share. While for the last decade, EU agri-food exports to the US were continuously increasing, in 2020 they reported a fall of 1.8% after hitting a 10% record growth rate in 2019 and a slight increase of 1.6% in 2018.
In 2020, the most striking increase of 22% was noted for exports to China (to reach €17.7 billion) after already an exceptional growth of 38% in 2019 and a decrease of 7% in 2018. China now absorbs almost 10% of EU exports of agri-food products. Exports to China have increased spectacularly since 2007 (except for 2018), making it the third most important export destination for the EU since 2015. Concerning trade relations with China, it has to be acknowledged that Hong Kong to a large extent functions as its transit hub. Consequently, while EU exports to Hong Kong declined by 9% to attain € 2.5 billion, adding them to EU exports to China would magnify the Chinese export market to €20.2 billion. In this perspective, China would further consolidate its position and thus follows closely the USA in the ranking.
Switzerland remains the EU’s fourth export market, with an export share of 5%. EU agri-food sales to Switzerland, which have been steadily increasing over the last decade, reported a strong growth of 8% in 2020 after a rise of 3% in 2019 and 1% in 2018. It is followed by Japan and Russia (almost 4% share each) to which EU agri-food exports fell by 4% and 2.5%, respectively in 2020 after a strong growth in 2019 for both countries (16% and 8%).
10 Trade with the UK is reported here as trade with a third country though single market conditions were applied to the UK until the end of the transition period 31/01/2021.
page 10
Agriculture
and Rural
Development
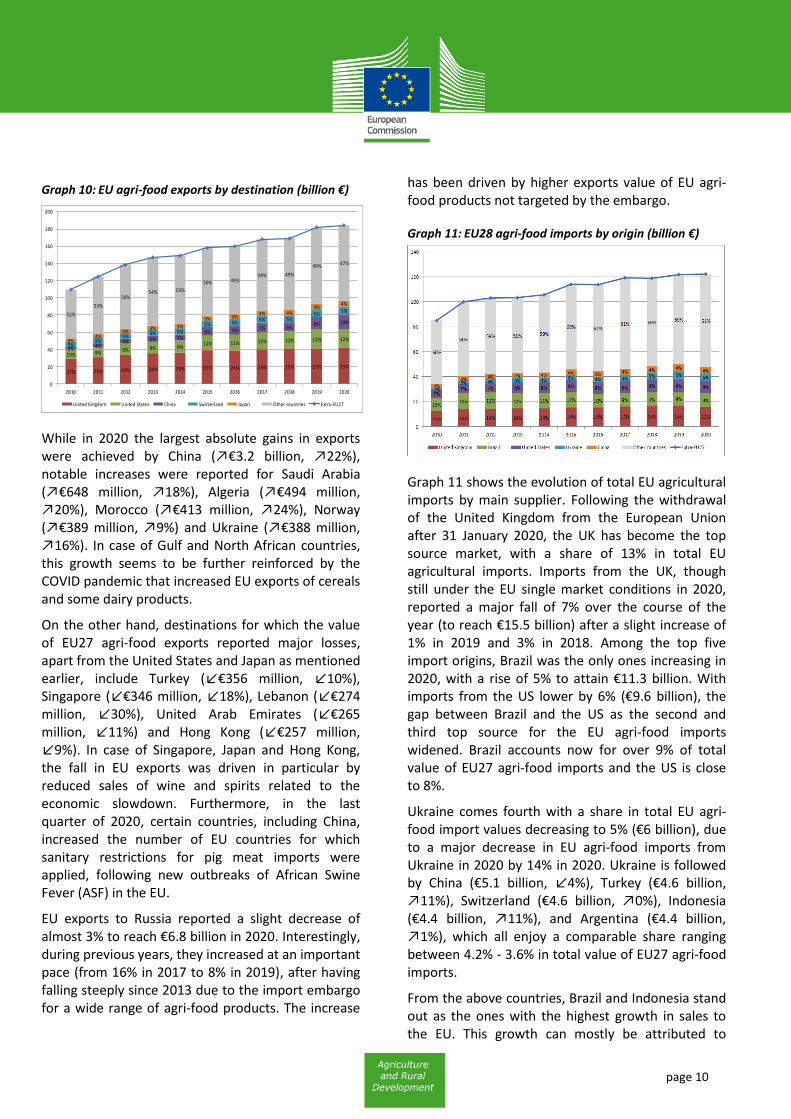
Graph 10: EU agri-food exports by destination (billion €)
While in 2020 the largest absolute gains in exports were achieved by China (↗€3.2 billion, ↗22%), notable increases were reported for Saudi Arabia (↗€648 million, ↗18%), Algeria (↗€494 million, ↗20%), Morocco (↗€413 million, ↗24%), Norway (↗€389 million, ↗9%) and Ukraine (↗€388 million, ↗16%). In case of Gulf and North African countries, this growth seems to be further reinforced by the COVID pandemic that increased EU exports of cereals and some dairy products.
On the other hand, destinations for which the value of EU27 agri-food exports reported major losses, apart from the United States and Japan as mentioned earlier, include Turkey (↙€356 million, ↙10%), Singapore (↙€346 million, ↙18%), Lebanon (↙€274 million, ↙30%), United Arab Emirates (↙€265 million, ↙11%) and Hong Kong (↙€257 million, ↙9%). In case of Singapore, Japan and Hong Kong, the fall in EU exports was driven in particular by reduced sales of wine and spirits related to the economic slowdown. Furthermore, in the last quarter of 2020, certain countries, including China, increased the number of EU countries for which sanitary restrictions for pig meat imports were applied, following new outbreaks of African Swine Fever (ASF) in the EU.
EU exports to Russia reported a slight decrease of almost 3% to reach €6.8 billion in 2020. Interestingly, during previous years, they increased at an important pace (from 16% in 2017 to 8% in 2019), after having falling steeply since 2013 due to the import embargo for a wide range of agri-food products. The increase
has been driven by higher exports value of EU agri-food products not targeted by the embargo.
Graph 11: EU28 agri-food imports by origin (billion €)
Graph 11 shows the evolution of total EU agricultural imports by main supplier. Following the withdrawal of the United Kingdom from the European Union after 31 January 2020, the UK has become the top source market, with a share of 13% in total EU agricultural imports. Imports from the UK, though still under the EU single market conditions in 2020, reported a major fall of 7% over the course of the year (to reach €15.5 billion) after a slight increase of 1% in 2019 and 3% in 2018. Among the top five import origins, Brazil was the only ones increasing in 2020, with a rise of 5% to attain €11.3 billion. With imports from the US lower by 6% (€9.6 billion), the gap between Brazil and the US as the second and third top source for the EU agri-food imports widened. Brazil accounts now for over 9% of total value of EU27 agri-food imports and the US is close to 8%.
Ukraine comes fourth with a share in total EU agri-food import values decreasing to 5% (€6 billion), due to a major decrease in EU agri-food imports from Ukraine in 2020 by 14% in 2020. Ukraine is followed by China (€5.1 billion, ↙4%), Turkey (€4.6 billion, ↗11%), Switzerland (€4.6 billion, ↗0%), Indonesia (€4.4 billion, ↗11%), and Argentina (€4.4 billion, ↗1%), which all enjoy a comparable share ranging between 4.2% - 3.6% in total value of EU27 agri-food imports.
From the above countries, Brazil and Indonesia stand out as the ones with the highest growth in sales to the EU. This growth can mostly be attributed to
27% 25% 24% 24% 25% 25% 24% 24% 25% 23% 23%
10% 9%9% 9% 9%
11% 11% 12% 12% 12% 12%
3%4%
4% 5% 5%6% 7% 7% 6%
8% 10%
5%5%
5%5% 5%
5% 5%5% 5%
5%5%
4%4%
4%3% 3%
3% 3%4% 4%
4%4%
52%
53%
54%54% 53%
50% 49%49% 49%
49% 47%
0
20
40
60
80
100
120
140
160
180
200
2010 2011 2012 2013 2014 2015 2016 2017 2018 2019 2020
United Kingdom United States China Switzerland Japan Other countries Extra-EU27

page 11
Agriculture
and Rural
Development
higher values of soya beans and palm oil imports. These two products combined accounted for almost 9% of EU agri-food imports.
Other noteworthy changes for countries not shown in graph 11 include Canada (€3.1 billion, ↗52% - driven by higher values of rapeseeds and wheat imports), Malaysia (€2.3 billion, ↗26% - higher value of palm oil imports) and Turkey (€4.6 billion, ↗11% - higher values of citrus fruit and nuts, preparations of vegetables and fruit imports).
3.2. EU agri-food exports by product
Over the last decade, exports of most product categories11 that represent final goods for direct consumption increased to account for 52% of total agri-food exports, whereas exports of commodities and other primary products stabilised at a share of 38%. Overall, in 2020 exports of EU agri-food products were 1.4% higher compared to 2019. Graph 12 shows the main categories of EU agri-food exports in 2020.
Graph 12: Main categories of EU agri-food exports in 2020
Wine and vermouth continued to dominate the basket of exported products with an 8% share, although their value fell by 8% when comparing to 2019, to reach €13.9 billion in 2020. Pig meat ranked second (€10.1 billion, 5.5% share), reporting the highest increase of 27% in value amongst all exported agri-food products. These products are followed by pasta and pastry (€8.8 billion, ↗5%),
11 The definition of product categories can be here:
https://ec.europa.eu/agriculture/sites/agriculture/files/trade↙analysis/statistics/outside↙eu/2015/product↙classes↙details_en.pdf
infant food (€8.7 billion, ↗2%), chocolate and confectionary (€8.2 billion, ↙2%), food preparations (€7.7 billion, ↗5%), preparations of vegetables, fruit (€7.2 billion, ↙0.5%) - which all enjoy a similar share ranging between 4% and 5% in total value of EU27 agri-food exports.
By contrast, some important changes for products not shown in the graph 12 include spirits and liqueurs that reported biggest fall in value (↙19%) to reach exports worth €6.8 billion. Decreasing sales of spirits and wine can be explained partly by the economic recession induced by the COVID pandemic, and to some extent, by the negative impact of US punitive tariffs related to the WTO civilian aircraft dispute. On the other hand, the COVID pandemic, as well as the yield development in the EU and other regions, seemed to have contributed to higher exports value of EU wheat that increased by 31% compared to 2019 to reach exports worth €7.18 billion.
Graph 13: Distribution of exports in main product categories by top destinations - 2020
As graph 13 indicates, for the top three main product categories exported by the EU (wine, pig meat, pasta and pastry), the top five destinations are absorbing above 65% of EU exports. Additionally, in each of the four groups, one partner is clearly dominant: the UK for chocolate and confectionary, pasta and pastry and China for pig meat and infant food12. For wine,
12 China's shares of 57% for pig meat and 30% for infant food and other
cereals, flour, starch or milk preparations even rise to 59% and 34%,
Wine, Vermouth, Cidre and Vinegar13 931, 8%
Pigmeat, fresh, chilled and frozen10 062, 5%
Pasta, pastry, biscuits and bread
8 767, 5%
Infant food and other cereals, flour, starch or
milk preparations
8 657, 5%
Chocolate, confectionery and ice cream
8 230, 4%
Preparations of vegetables, fruit or nuts
7 219, 4%
Remaining agri-food products
127 497, 69%
Source: Comext-EurostatUnits: million EUR, %

page 12
Agriculture
and Rural
Development
the concentration among the top export destinations is less pronounced and exports are more evenly spread between them (the top 5 absorbing 67% of the total exports).
Outside the top five products, the concentration of product categories such as vegetables, spirits and liqueurs exports is particularly high with over 70% of EU exports going to the main five destinations in 2020, and where the first top destination – UK for vegetables and US for spirits and liqueurs absorb over 40% of their respective EU exports. In case of cheese and preparations of vegetables and fruit, the top five destinations receive over 60% of their sales outside the EU.
Graph 14: Product categories with the largest absolute annual export value increase in 2020 (million €)
The product categories with the highest annual increase in export values are shown in graph 14. In 2020, the largest gains were achieved for pig meat – which switched in the ranking from the 6th top export product in 2019 to the 2nd place in 2020 - thanks to an exceptional growth of 27 % (€10.1 billion exports value). Wheat, likewise, saw a remarkable increase of exports by €1.7 billion (↗31%) to reach €7.2 billion in total. Other product categories that displayed solid growth rates include pet food (↗€565 million, ↗11%), cigars and cigarettes (↗€551 million, ↗13%), rapeseed and sunflower oils (↗€476 million, ↗18%), soups and sauces (↗€239 million, ↗11%), coarse grains (↗€212 million, ↗9%).
respectively; if exports to Hong Kong (entry point to the Chinese market) are added.
Graph 15 below explains the drivers behind increased exports of the five most dynamic products. The increases for four of them: pig meat, wheat, pet food, rapeseed and sunflower oils were primarily driven by volume increases, implying that higher amounts were shipped. On the contrary, higher prices were the only reason behind higher export value for cigars and cigarettes.
Graph 15: Annual percentage change in volume and unit price for the product categories with the largest EU total export increases in 202013
Graph 16: Product categories with the largest absolute export value decrease in 2020 (million €)
In terms of export value losses in 2020, the most notable products include spirits and liqueurs as well as wine, for which exports declined by €1.6 billion
13 Unit prices here and in the rest of the document are calculated by
division of traded value with traded volume of the product categories. The result may include effects of proportional changes between higher and lower valued items within the product category aggregate.
2 668
4 277
5 049
5 462
7 945
3 144
4 828
5 614
7 177
10 062
0 2 000 4 000 6 000 8 000 10 000 12 000 14 000 16 000
Vegetable oils other than palm & olive oil
Cigars and cigarettes
Pet food
Wheat
Pigmeat, fresh, chilled and frozen
2020 2019
in million EUR
increase € 2118
increase € 1715
increase € 565
increase € 551
increase € 476
25% 26%
7%
0%
14%
1%
4%4%
13%
3%
0%
5%
10%
15%
20%
25%
30%
Pigmeat, fresh, chilled andfrozen
Wheat Pet food Cigars and cigarettes Vegetable oils other thanpalm & olive oil
% change in volume % change in unit price
Source: COMEXT

page 13
Agriculture
and Rural
Development
(↙19%) and €1.2 billion (↙8%), respectively, as shown in graph 16. However, the highest export value decreases in percentage terms were observed for raw hides and skins as well as for cotton and flax for which the value of exports were 46% (↙€582 m) and 30% (↙€413 m) lower, respectively.
Products from the animal sector complete the overview of highest decreases, reporting trade €312 million lower (↙10%) for poultry meat and €274 million less (↙9%) for live animals. For these two products, the lower export values were driven mainly by lower quantities as their unit prices decreased slightly (graph 17).
Lower export values for spirits and liqueurs, wine, cotton and flax were driven by lower unit prices and to a lesser extent smaller volume. In case of raw hides and skins, unit prices fell almost by half, whereas the exported quantity marginally increased.
Graph 17: Annual percentage change in volume and unit price for the product categories with the largest EU total export decreases in 2020
3.3. EU agri-food import products
Graph 18 shows the composition of EU agri-food imports by product category. In essence, the EU is sourcing three main types of products from third countries: products that are not (or only to a small extent) produced in the EU itself due to natural conditions (such as tropical fruit, coffee and fresh or dried fruits – together 21%), products that are mostly
used for animal feed (oilcakes and soybeans – together 9%) and products that are used as ingredients in further processing (palm oil – 5%).
Graph 18: Main categories of EU agri-food imports 2020
Compared to the previous year, the top six import categories did not change in 2020. While shares of palm oil, fruit, tropical fruit and soybeans increased in total EU agri-food imports value, shares of oilcakes, unroasted coffee and tea decreased, but all of them at rather slight rates.
At product category level, the geographical concentration of EU agri-food imports value remains more significant than for exports as graph 19 reveals. Oilcake supply is covered to 72% by Brazil and Argentina; the top five origins concentrate 87% of EU supply. For palm and kernel oil, 69% of EU imports are provided by Indonesia and Malaysia alone and 86% come from the top five origins. In case of unroasted coffee and tea, Brazil and Vietnam cover 47% of EU imports, whereas 68% comes from the top five origins. For tropical fruit and for fresh and dried fruit, the geographical concentration is less pronounced – the top five origins concentrate 48% and 54% of EU supply, respectively.
In the above ranking, the United Kingdom and China are missing from this picture of imports in the main product categories. This indicates that other suppliers are more specialised in the particular products with the highest import demand by the EU - and that the UK and China have a more diversified export mix. In fact, the EU's main imports from the UK are spirits and liqueurs (12%), followed by chocolate and confectionary, food preparations, pasta and pastry and pet food - which all have a similar share oscillating between 5-6%. In case of
-8%
-3%
3%
-13%
-7% -6%
-11%
-5%
-47%
-19%
-4%-2%
-60%
-50%
-40%
-30%
-20%
-10%
0%
10%
20%
Spirits and liqueurs Wine, Vermouth, Cidreand Vinegar
Raw hides, skins andfurskins
Cotton, flax and hemp,and plaiting materials
Poultry meat, fresh,chilled and frozen
Live animals
% change in volume % change in unit price
Source: COMEXT
Tropical fruit, fresh or dried, nuts and spices
13 357, 11%
Oilcakes6 294, 5%
Unroasted coffee, tea in bulk & mate
6 108, 5%
Fruit, fresh or dried, excl. citrus & tropical
fruit
6 075 5%
Palm & palm kernel oil
5 439, 5%
Soyabeans5 114, 4%
Remaining agri -food products
79 673, 65%
Source: ComextUnits: million EUR, %

page 14
Agriculture
and Rural
Development
China, the EU top imported product categories include edible offal, pet food, vegetables, tropical fruit, preparations of vegetables- for which share in total EU agri-food imports value from China ranges between 7 and 9%.
Graph 19: Distribution of imports in main product categories by top origins
Graph 20: Product categories with the largest absolute annual import value increase 2020
The product categories with the highest annual increase in import values are shown in graph 20. The highest gains in import value in 2020 were registered for oilseeds other than soya beans (↗€615 m, ↗14%), fatty acids and waxes (↗€596 m, ↗25%), palm and palm kernel oil (↗€595 m, ↗12%), fruit fresh or dried (↗€615 m, ↗14%), and tropical fruit (↗€615 m, ↗14%).
Graph 21 reveals that the drivers behind these increases in import values. Higher volume was the
only reason behind higher export values for oilseeds other than soya beans and tropical fruit. On the contrary, higher unit price for palm and palm kernel oil triggered alone a rise in its exports values. A combination of increased volumes and increased prices was responsible for higher export values for fatty acids and waxes and fruit.
Graph 21: Annual percentage change in volume and unit price for selected product categories with EU total import increases in 2020
Graph 22: Product categories with the largest absolute annual import value decrease in 2020
On the other hand, the most noteworthy import value losses in 2020 were registered for coarse grains (€ ↙1.2 billion, ↙28%), spirits and liqueurs (€ ↙491 m, ↙14%), oilcakes (€ ↙411 m, ↙6%), bovine meat (€ ↙405 m, ↙20%), and wool and silk (€ ↙342, ↙38%) as shown in graph 22.
Graph 23 shows the drivers of these developments. In case of coarse grains, oilcakes and bovine meat, lower import volumes were behind these falls
12 881
5 582
4 844
2 411
4 288
13 357
6 075
5 439
3 007
4 903
0 2 000 4 000 6 000 8 000 10 000 12 000 14 000 16 000
Tropical fruit, fresh or dried, nuts and spices
Fruit, fresh or dried, excl. citrus & tropical fruit
Palm & palm kernel oil
Fatty acids and waxes
Oilseeds, other than soyabeans
2020 2019
in million EUR
increase € 615
increase € 596
increase € 595
increase € 493
increase € 475
9,0%
0,1%
13,7%
4,4% 4,0%
14,4%
12,1%
-0,8%
4,2%
-0,3%
-2%
0%
2%
4%
6%
8%
10%
12%
14%
16%
Fatty acids and waxes Palm & palm kernel oil Oilseeds, other thansoyabeans
Fruit, fresh or dried, excl.citrus & tropical fruit
Tropical fruit, fresh ordried, nuts and spices
% change in volume % change in unit price
Source: COMEXT
896
2 027
6 705
3 553
4 394
555
1 622
6 294
3 062
3 181
0 1 000 2 000 3 000 4 000 5 000 6 000 7 000 8 000
Wool and silk
Bovine meat, fresh, chilled andfrozen
Oilcakes
Spirits and liqueurs
Cereals, other than wheat and rice
2020 2019
in million EUR
decrease € -1213
decrease € -491
decrease € -411
decrease € -405
decrease € -342
page 15
Agriculture
and Rural
Development
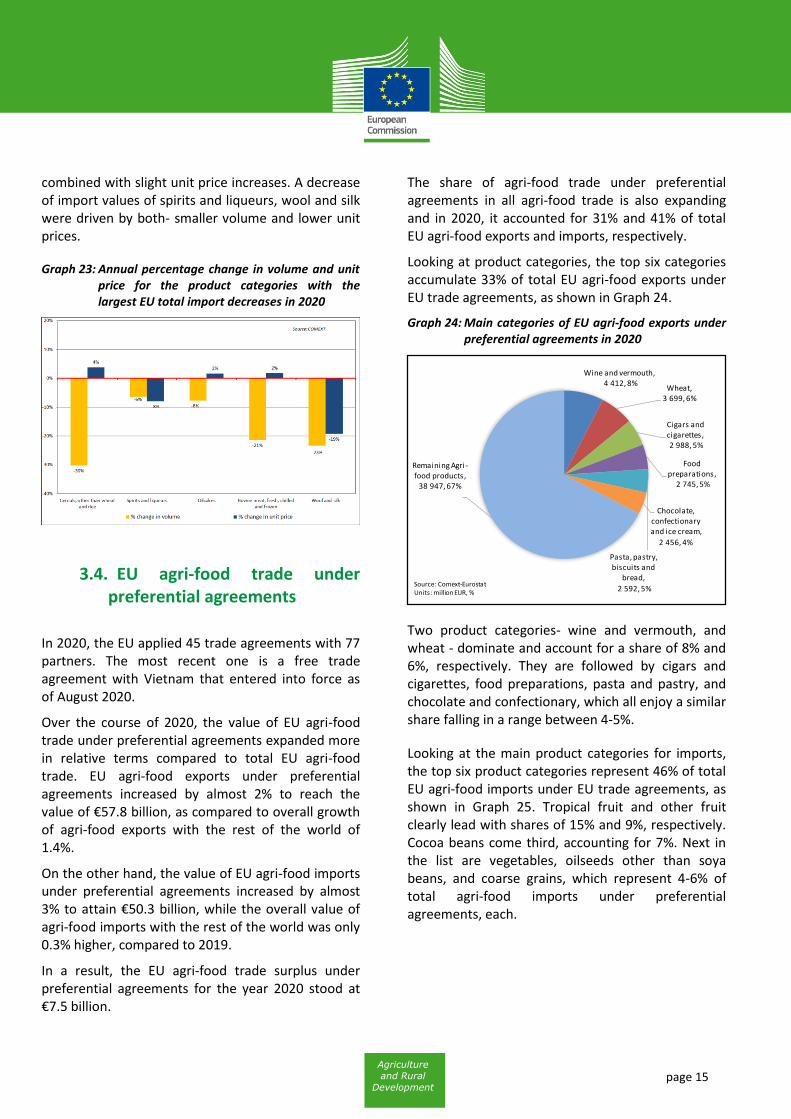
combined with slight unit price increases. A decrease of import values of spirits and liqueurs, wool and silk were driven by both- smaller volume and lower unit prices.
Graph 23: Annual percentage change in volume and unit price for the product categories with the largest EU total import decreases in 2020
3.4. EU agri-food trade under preferential agreements
In 2020, the EU applied 45 trade agreements with 77 partners. The most recent one is a free trade agreement with Vietnam that entered into force as of August 2020.
Over the course of 2020, the value of EU agri-food trade under preferential agreements expanded more in relative terms compared to total EU agri-food trade. EU agri-food exports under preferential agreements increased by almost 2% to reach the value of €57.8 billion, as compared to overall growth of agri-food exports with the rest of the world of 1.4%.
On the other hand, the value of EU agri-food imports under preferential agreements increased by almost 3% to attain €50.3 billion, while the overall value of agri-food imports with the rest of the world was only 0.3% higher, compared to 2019.
In a result, the EU agri-food trade surplus under preferential agreements for the year 2020 stood at €7.5 billion.
The share of agri-food trade under preferential agreements in all agri-food trade is also expanding and in 2020, it accounted for 31% and 41% of total EU agri-food exports and imports, respectively.
Looking at product categories, the top six categories accumulate 33% of total EU agri-food exports under EU trade agreements, as shown in Graph 24.
Graph 24: Main categories of EU agri-food exports under preferential agreements in 2020
Two product categories- wine and vermouth, and wheat - dominate and account for a share of 8% and 6%, respectively. They are followed by cigars and cigarettes, food preparations, pasta and pastry, and chocolate and confectionary, which all enjoy a similar share falling in a range between 4-5%.
Looking at the main product categories for imports, the top six product categories represent 46% of total EU agri-food imports under EU trade agreements, as shown in Graph 25. Tropical fruit and other fruit clearly lead with shares of 15% and 9%, respectively. Cocoa beans come third, accounting for 7%. Next in the list are vegetables, oilseeds other than soya beans, and coarse grains, which represent 4-6% of total agri-food imports under preferential agreements, each.
Wine and vermouth,4 412, 8%
Wheat, 3 699, 6%
Cigars and cigarettes,2 988, 5%
Food preparations,
2 745, 5%
Pasta, pastry, biscuits and
bread,
2 592, 5%
Chocolate, confectionary and ice cream,
2 456, 4%
Remaining Agri -food products,
38 947, 67%
Source: Comext-EurostatUnits: million EUR, %

page 16
Agriculture
and Rural
Development
Graph 25: Main categories of EU agri-food imports under preferential agreements in 2020
4. Agri-food trade with key partners
This chapter provides a general overview of the trade performance of the EU's key partners14 and a description of their trade flows with the EU15. The United Kingdom, the United States and China are the partners depicting the strongest reciprocal trade relationship with the EU. Agri-food trade with Brazil is more of a one-way flow. In addition, the EU trade development with Africa is analysed.
4.1. United Kingdom
The United Kingdom left the European Union on 31st January 2020 and is treated in this report as a third country. The transition period, under which trade happened were still under the EU single market and customs union conditions, which applied until 31 December 2020. From 1 January 2021, a new Trade and Cooperation Agreement has been implemented provisionally.
United Kingdom – agri-food trade with the world
The United Kingdom ranks fourth in world imports and twelfth in exports of agri-food. Its agri-food trade deficit stood at €31.3 billion in 2020 (↗6% compared to 2019). The value of UK agri-food exports fell to €24 billion following a decrease of 10% (in 2019 they were 3% higher compared to 2018)16, and that of imports decreased by 2% to reach €55.3 billion after having reported a rise of 2% in 2019 and in 2018.
EU27 is the UK leading origin for imports, supplying 75% of all agri-food imports (€41.8 billion, ↗1%). It is followed with a wide gap by the US with a 3% share (€1.6 billion, ↙3%). Brazil came third with imports worth €0.9 billion (↗6%) and a share of 2%. Next in the ranking are China, South Africa, Thailand, Argentina, and New Zealand for which UK agri-food imports ranges between €0.9-0.7 billion and represent a 1% share each. The remaining countries supply 15% of agri-food imports value.
14 Based on Global Trade Atlas (GTA) and agri-food aggregate on 6 digit
level. 15 Based on Eurostat (Comext), cf. also Factsheets on EU27 agri-food
trade with the world, individual countries and selected regions: https://ec.europa.eu/agriculture/trade-analysis/statistics_en.
16 Based on the definition of agricultural products used for this newsletter. Source: Global Trade Atlas
Tropical fruit, fresh or dried,
nuts and
spices, 7 757, 15%
Fruit, fresh or dried, excl.
citrus &
tropical fruit, 4 449, 9%
Cocoa beans, 3 670, 7%
Vegetables, fresh, chil led
and dried,
2 735, 6%
Oilseeds, other than
soyabeans,
2 448, 5%
Cereals, other than wheat and rice, 2 111, 4%
Remaining Agri-food products,
27 067, 54%
Impact of trade agreements on the agricultural sector
Trade agreements can help EU farmers and food producers make better use of export opportunities. The updated study on the cumulative impact of EU trade agreements on the agricultural sector, published in January 2021, finds that the implementation of the 12 Free Trade Agreements (FTAs) analysed in the study would result in a balanced increase in both EU agri-food exports and imports, with a slightly higher increase in exports. This would increase further the net positive EU agri-food trade balance - already projected to remain largely positive in 2030 – by €800 million to €1 billion depending on the scenario considered. Furthermore, impacts on production and producer prices would remain moderate. More specifically, EU agri-food exports would increase by 2.8% to 3.3% compared to the scenario without FTAs, an increase of €4.7 to €5.5 billion.
More detailed and sector-specific findings are available in the study.
page 17
Agriculture
and Rural
Development
In terms of products, the UK basket of imported agri-food products is quite diversified with no product representing more than 7%. The product with the biggest share is wine (€3.8 billion, ↙4%). Bread and pastry (€2.5 billion, ↙3%) comes second with a 5% share. These are followed by meat preparations (€2.1 billion, ↙4%), chocolate and confectionary (€1.9 billion, ↗4%), cheese and curd (€1.9 billion, ↙4%), and food preparations (€1.7 billion, ↗2%) – each representing 3-4% in total imports. The remaining products account for 74% of UK agri-food imports value.
The main market for UK agri-food exports is the European Union (€15.5 billion, ↙7%) with a 65% share in total agri-food export values. Similarly, as for imports, the EU27 is followed with a wide gap by the US with a 8% share in exports (€2 billion, ↙19%). China came third with UK exports worth €0.8 billion (↙1%) and a share of 3%. Next in the ranking are Australia, Singapore, Hong Kong, and Canada for which UK agri-food exports ranges between €0.5-0.4 billion and represent a 2% share each. The remaining countries account for 16% of UK agri-food exports value.
The UK basket of exported products is clearly dominated by spirits and liqueurs with a share of 23% in their total value (€5.4 billion, ↙23%). Food preparations ranked second with a 7% share (€1.6 billion, ↗0%). These are followed by pet food (€1.1 billion, ↗3%), bread and pastry (€1 billion, ↙7%), and chocolate and confectionary (€0.9 billion, ↙1%) – each representing a share of 4% in the total agri-food exports. The remaining products account for 58% of UK agri-food exports value.
The overall decrease in UK export values in 2020 (↙€2.8 billion) was primarily driven by falling export values for spirits and liqueurs (↙€1.6 billion).
United Kingdom – agri-food trade with the EU
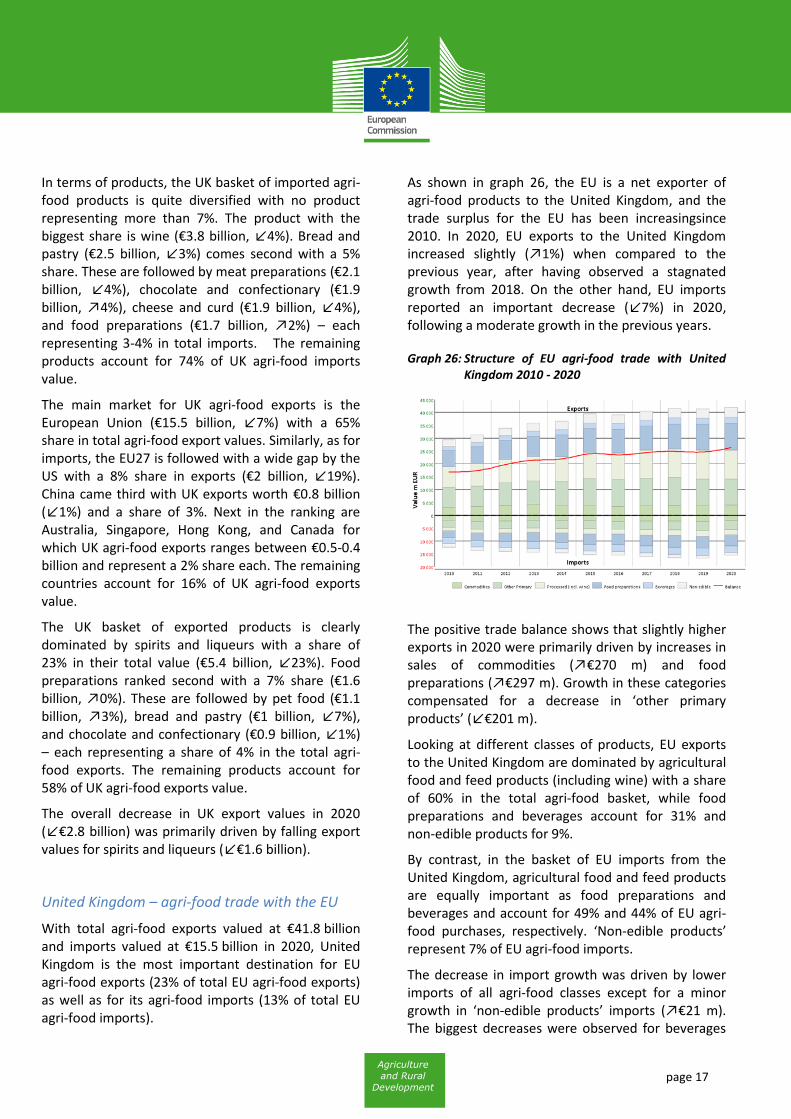
With total agri-food exports valued at €41.8 billion and imports valued at €15.5 billion in 2020, United Kingdom is the most important destination for EU agri-food exports (23% of total EU agri-food exports) as well as for its agri-food imports (13% of total EU agri-food imports).
As shown in graph 26, the EU is a net exporter of agri-food products to the United Kingdom, and the trade surplus for the EU has been increasingsince 2010. In 2020, EU exports to the United Kingdom increased slightly (↗1%) when compared to the previous year, after having observed a stagnated growth from 2018. On the other hand, EU imports reported an important decrease (↙7%) in 2020, following a moderate growth in the previous years.
Graph 26: Structure of EU agri-food trade with United Kingdom 2010 - 2020
The positive trade balance shows that slightly higher exports in 2020 were primarily driven by increases in sales of commodities (↗€270 m) and food preparations (↗€297 m). Growth in these categories compensated for a decrease in ‘other primary products’ (↙€201 m).
Looking at different classes of products, EU exports to the United Kingdom are dominated by agricultural food and feed products (including wine) with a share of 60% in the total agri-food basket, while food preparations and beverages account for 31% and non-edible products for 9%.
By contrast, in the basket of EU imports from the United Kingdom, agricultural food and feed products are equally important as food preparations and beverages and account for 49% and 44% of EU agri-food purchases, respectively. ‘Non-edible products’ represent 7% of EU agri-food imports.
The decrease in import growth was driven by lower imports of all agri-food classes except for a minor growth in ‘non-edible products’ imports (↗€21 m). The biggest decreases were observed for beverages

page 18
Agriculture
and Rural
Development
(↙€428 m) and commodities (↙€354 m) when compared to 2019.
Regarding the more disaggregated product categories, the top five categories accumulate 34% of total EU agri-food exports towards the United Kingdom as shown in Graph 27.
Graph 27: Main categories of EU agri-food exports to United Kingdom in 2020
This reflects the fact that EU basket of agri-food products exported to the United Kingdom is quite diverse. Furthermore, the first five top products – pasta and pastry, meat preparations, chocolate and confectionary, vegetables, wine - enjoy each a share between 6-7%. Fruit and vegetables preparations, cheese, and fruit follow in the list, accounting for 4-5% each.
Compared to the trade pattern of 2019, the picture has somewhat changed. Increasing EU export values to the United Kingdom (↗€456 m, ↗1%) were driven by moderate exports growth of majority of agri-food products. Biggest increases were reported for wheat (↗€194 m), cigars and cigarettes (↗€157 m), pasta and pastry (↗€102 m), chocolate and confectionary (↗€95 m) – all triggered by higher export volumes except for ‘chocolate and confectionary’ for which the driver was a higher unit price.
On the other hand, significant decreases in export values were reported for such products as poultry meat (↙ €207 m), wine (↙ €104 m), fruit and
vegetables preparations (↙ €62 m), and pig meat (↙ €60 m). With regard to poultry meat, the decrease was driven by reduced quantities, whereas for wine by lower unit price despite a slight increase in exported volume. In regard to fruit and vegetables preparations and pig meat, the fall was triggered by smaller volumes in spite of slightly higher unit prices. As a result, the ranking of top EU agri-food exports to the United Kingdom changed with meat preparations, chocolate and confectionary advancing in the list, while wine and poultry meat slipping to lower places.
United Kingdom is an important agri-food market for a significant number of EU agri-food products – for almost half of them the UK absorbs at least one third of the total EU exports. In particular, as table 1 indicates, the UK is a crucial destination for meat preparations, ethanol and bovine meat, absorbing from 66% to 57% of all respective EU exports. High concentration of EU agri-food exports to the UK is also particularly present in the fruit and vegetables sector (fruit juices, vegetables, citrus fruit, fruit, fruit and vegetables preparations) for which the UK shares range between 47% and 30%. Poultry meat and ‘bulbs, roots and live plants’ are also noteworthy mentioning, with almost 50% of total EU exports going to the UK.
Table 1: United Kingdom as important destination for EU exports by product category in 2020 (€ million)
As regards EU imports from the United Kingdom, the top five most important product categories in 2020 (graph 28) remained unchanged compared to 2019. Spirits and liqueurs dominate with a share of 12%. The other four product categories are chocolate and confectionary, food preparations, pasta and pastry, pet food with shares of 6-5% each. Cheese, live animals, infant food and other cereals, sheep and
Pasta, pastry, biscuits and bread,3 040, 7%
Meat preparations,
2 882, 7%
Chocolate, confectionery and ice cream,
2 799, 7%
Vegetables, fresh, chil led
and dried,
2 766, 7%
Wine, Vermouth, Cidre
and Vinegar,
2 713, 6%
Remaining Agri-food products,
27 643, 66%
Source: Comext-EurostatUnits: million EUR, %
Rank Product categoryEU exports to
world
EU exports to
the UK
UK share in
total
1 Meat preparations 4.354 2.882 66%
2 Ethanol 604 355 59%
3 Bovine meat 1.977 1.129 57%
4 Fruit juices 1.661 785 47%
5 Vegetables 5.924 2.766 47%

page 19
Agriculture
and Rural
Development
goat meat, bovine meat follow in the list (shares between 3-4%).
Graph 28: Main categories of EU agri-food imports from United Kingdom in 2020
In relation to 2019, the ranking of most important product categories for imports changed slightly as well as their respective shares, given an important decline in EU agri-food imports (↙€1 224 m, ↙7%) from the United Kingdom in 2020. The highest decrease was observed for ‘spirits and liqueurs’ (↙€362 m) that was triggered by lower unit price and to lesser extent by reduced imported volume. Other top product categories that reported significant falls include ‘bovine meat’ (↙€99 m – driven by a substantial fall in volume despite higher unit price); and pasta and pastry’ (↙€92 m), ‘vegetables (↙€73 m), chocolate and confectionary (↙€56 m) – all driven by lower imported volume. Other notable falls were reported for wheat (↙€104 m) and ‘beet and cane sugar’ (↙€96 m) for which EU import value from the UK decreased by more than 50% compared to 2019 – both driven by a substantial reduction in quantities despite increase in unit price.
On the other hand, EU imports of pet food (↗€119 m), live animals (↗€54 m), and sheep and goat meat (↗€20 m) increased in value triggered by higher unit prices with lower volumes - except for live animals for which the increase was also driven by higher volume.
As a result of these developments, the ranking of top EU agri-food imports from the United Kingdom changed with pasta and pastry, infant food and other cereals, bovine meat slipping to lower places in the list, while food preparations, live animals, sheep and goat meat advanced in the list.
The United Kingdom is also an important origin for a significant number of EU imported agri-food products – though range of products seems to be smaller but with higher concentration rate than for EU exports. As table 2 indicates, the UK is a crucial origin for a number of dairy products (fresh milk and cream, buttermilk and yoghurt, butter, milk powders and whey) and for pig meat, providing more than 84% of total EU imports. A high share of EU agri-food imports from the UK is also particularly present in live animals (73%), spirits and liqueurs (61%), but also cheese, infant food and other cereals, poultry meat, sheep and goat meat for which UK shares range around 50% each. Chocolate and confectionary, pasta and pastry, bovine meat are also noteworthy mentioning, concentrating between 40% and 25% of total EU imports.
Table 2: United Kingdom as important origin for EU imports by product category, in 2020 (€ million)
4.2. United States
United States- agri-food trade with the world
US ranks second in world exports and imports of agri-food. Its agri-food trade surplus stood at €7 billion in 2020 (↗64% compared to 2019). The value of US agri-food exports rose to €136 billion following growth rate of 3% (same as in 2019 compared to
Spirits and liqueurs,
1 871, 12%
Chocolate, confectionery and ice cream,
894, 6%
Food preparations, not specified,
837, 5%
Pasta, pastry, biscuits and
bread,
807, 5%
Pet food, 791, 5%
Remaining Agri-food products,
10 325, 67%
Rank Product categoryEU imports
from world
EU imports from
the UK
UK share in
total
1 Fresh milk and cream, buttermilk and
yoghurt
372 351 94%
2 Butter 181 166 91%
3 Pigmeat 264 234 89%
4 Milk powders and whey 269 227 84%
5 Malt 19 14 77%

page 20
Agriculture
and Rural
Development
2018)17, and that of imports increased to €129 billion (↗2%) after having reported a record rise of 8% in 2019.
In 2020, China became the top US agri-food export destination after having outpaced Canada by a marginal gap. US agri-food exports to China skyrocketed by 83% to reach €22.8 billion (absorbing 17% of total US agri-food exports). Considering Hong Kong together with China adds another €1.8 billion to US exports to the region. Canada became second in the ranking for US export destinations worth €22.6 billion (17% share) and Mexico third (€16.5 billion, 12% share) - both countries experiencing a drop in US exports in 2020, by 4% and 7% respectively. They are followed by Japan (€10.4 billion, 8% share), EU27 (€9.6 billion, 7% share) and South Korea (€6.8 billion, 8% share) – for which all US agri-food exports observed a decline (↙4%, ↙5%, ↙2%), respectively.
The US basket of exported products is clearly dominated by soya beans with a share of 16% in their total value (€22 billion, ↗32%), reporting also the highest increase in value amongst all exported agri-food products. Maize ranked second with a 6% share (€8.4 billion, ↗17%) and nuts third with a 5% share (€6.8 billion, ↙10%). They are followed by wheat (€5.5 billion, ↙1%), food preparations (€5.4 billion, ↙3%), pig meat (€5.3 billion, ↗13%), and cotton (€5.3 billion, ↙4%) – each representing a share of about 4% in total US agri-food exports. The remaining products account for 57% of US agri-food exports value.
The overall increase in US export values in 2020 (↗ €4.4 billion) was mostly driven by higher export values for soya beans (↗ €5.4 billion) and maize (↗ €1.2 billion) - both characterised by substantially higher unit prices and lower quantities.
The biggest market for the most important US agri-food export product - soya beans - is China, for which in 2020 US export values increased by €4.8 billion, raising its share in US soya bean exports to 54%. Maize is the second main US export product. While it observed slightly lower values to its main markets- Mexico and Japan- its exports skyrocketed to China (↗ €1 billion), making its third top destination.
17 Based on the definition of agricultural products used for this
newsletter. Source: Global Trade Atlas
In terms of decreasing export values, notable declines were reported for US exports of nuts (↙ €0.7 billion) and cigars and cigarettes (↙ €0.6 billion).
In 2020, Mexico continued to be the top US agri-food origin, supplying 23% of US agri-food imports (€29 billion, ↗7%). Canada came second with a 17% share (€24 billion, ↗2%), followed closely by the EU27 (€21.5 billion, ↙2%). These three origins concentrate over 56% of US agri-food imports in value terms. Brazil (€3.5 billion, ↙3%), and China (€3.3 billion, ↗0%) are next in the ranking - each supplying 3% of US agri-food imports.
US agri-food imports are quite scattered, no product representing more than 6% of its total agri-food imports value. Spirits and liqueurs (€7.6 billion, ↙9%) account for the highest share of 6%. They are followed by food preparations (€5.7 billion, ↗10%), bread and pastry (€5.4 billion, ↗2%), beer (€5 billion, ↗0%), wine (€4.9 billion, ↙11%), and coffee (€4.9 billion, ↙4%). In the ranking, next agri-food products include fruit, vegetables, bovine meat, soft drinks and waters- each accounting for 3% of total US agri-food imports value. The remaining products represent 60% of US agri-food imports value.
Against the background of the overall increase of US import values in 2020 by 1% (↗ €1.6 billion), highest rises in absolute terms were observed for food preparations (↗ €0.5 billion), frozen bovine meat (↗ €0.4 billion) and tomatoes (↗ €0.4 billion). On the other hand, biggest decreases affected US imports of spirits and liqueurs (↙ €0.7 billion) and wine (↙ €0.6 billion).
United States- agri-food trade with the EU
Following the withdrawal of the United Kingdom from the European Union, the United States, which were traditionally the leading EU partner in agri-food trade, became its second top export market and third top origin for EU imports of agri-food products. 12% of EU agri-food exports (€21.5 billion) are directed towards the US, and 8% of EU imports (€9.6 billion) are sourced from there. After a significant expansion of EU sales to the US in the last years (↗10% in 2019), EU exports to the US decreased slightly (↙2%) in 2020 when compared to the previous year. On the

page 21
Agriculture
and Rural
Development
other hand, EU imports reported a further decrease (↙6%) after having already followed a downward trend since 2015, with the exception of 2018 during which they increased by 10% (see graph 29). The further appreciation of the Euro against the US dollar, especially in the second half of 2020, may have contributed to this development.
Graph 29: Structure of EU28 agri-food trade with the US 2010 - 2020
Looking at developments at product categories level, decreasing EU27 export values to the United States (↙€389 m, ↙2%) were driven primarily by lower unit prices of exported wine (↙€507 m), and spirits and liqueurs(↙€506 m) by 13% and 15%, respectively, while their exported quantities remained on a similar level as in 2019. US punitive tariffs on certain EU agri-food products, including wine and spirts, imposed in the context of the WTO civil aircraft dispute, have contributed to this development. In a result, the US was the EU export market with the highest absolute loss in 2020 compared to the previous year, which underlines the importance of this market for EU exports.
On the imports side, decreasing EU27 import values from the United States (↙€622 m, ↙6%) were driven primarily by lower quantities of imported soya beans (↙€538 m) by 28%, despite being sold at higher unit price (↗5%), when compared to 2019.
With EU exports and imports both decreasing, but with stronger falls on the import side, the agri-food trade surplus with the US for the year 2020 stood at €11.9 billion, an increase of 2% compared to 2019.
Looking at different classes of products, EU exports to the US are divided almost equally between
agricultural food and feed products (including wine) with 49%, and food preparations and beverages (44%).
EU imports from the US, by contrast, are dominated by agricultural food and feed products, which account for 69%, while food preparations and beverages represent 16% of EU agri-food purchases.
Graph 30: Main categories of EU agri-food exports to the US in 2020
By product category (see graph 30), almost half of the exports to the US (43%) are beverages: wine, spirits and liqueurs, waters and soft drinks, as well beer – not featuring in the graph. Pasta and pastry, fruit and vegetable preparations, olive oil, chocolate and confectionary, cheese contribute between 6% and 4% each.
Compared to the export structure of 2019, the situation in 2020 changed slightly. Among flagship export products, wine, spirits and liqueurs, cheese decreased in value (wine, spirits and liqueurs– due to lower unit prices, cheese- lower volume). On the other hand, fruit and vegetables preparations, chocolate and confectionary advanced in the ranking of top EU products following the increase in their exports values driven by larger volumes while their unit prices slightly decreased.
The US is a particularly important market for EU exports in coffee (re-exports), spirits and liqueurs, essential oils, olive oil and beer. As table 3 indicates, the US represents a crucial destination for these product categories, absorbing major shares of total
Wine, Vermouth, Cidre and Vinegar,
3 703, 17%
Spirits and liqueurs,
2 745, 13%
Waters and soft drinks,
1 711, 8%
Pasta, pastry, biscuits and
bread,
1 330, 6%
Preparations of vegetables, fruit
or nuts,
1 163, 5%
Remaining Agri-food products,
10 798, 50%
Source: Comext-EurostatUnits: million EUR, %

page 22
Agriculture
and Rural
Development
EU exports in these products. The US is also the number 1 export destination for other European agri-food products as waters and soft drinks (30%), wine (27%) and gums, resins and plant extracts (27%).
Table 3: US as important destination for EU exports by product category, in 2020 (€ million)
Concerning EU imports from the US, as shown in graph 31, tropical fruit and nuts (26%) and soya beans (18%) dominate, with food preparations (5%), spirits and liqueurs(5%), and raw tobacco (3%) completing the top five that absorb almost 60% of all EU agri-food imports from the US. Casein, wine, wheat, and vegetables follow with shares close to 3% each.
Graph 31: Main categories of EU agri-food imports from the US in 2020
In relation to 2019, the ranking of most important product categories changed slightly as well as their respective shares given lower imports from the US in 2020. Imports of soya beans (↙€ 538 m), spirits and liqueurs (↙€ 39 m), decreased in value due to lower imported quantities. On the other hand, EU imports
of food preparations (↗€ 61 m), tropical fruit and nuts (↗€ 56 m), and raw tobacco (↗€ 37 m) increased in value- triggered by higher volumes. In terms of other notable changes, it is noteworthy to mention ethanol which imports skyrocketed (↗€ 192 m – primarily driven by higher quantities and slightly higher unit price), and wheat (↗€ 49 m) compared to 2019.
As shown in table 4 below, the US share in EU imports is high for odoriferous substances (38%) and soya beans (33%) for which the US is, together with Brazil, the EU's top origin. The highest US share in EU imports are coming also from raw hides and skins (31%), casein, other albuminoidal substances and modified starches (29%), and wheat (22%). However, imports of these products except soya beans are relatively limited.
Table 4: US as important origin for EU imports by product category, in 2020 (€ million)
4.3. China
China - agri-food trade with the world
China ranks first in world imports and fourth in exports of agri-food. Its agri-food trade deficit stood at €87.3 billion in 2020 (↗31% compared to 2019). The value of Chinese agri-food exports fell to €50.4 billion following a decrease of 4% (in 2019 they were 7% higher compared to 2018)18. Agri-food imports increased by another record 16% to reach €137.7 billion after having already reported a major rise of 13% in 2019. Considering Hong Kong together with China adds another €6.4 billion to its exports and €0.4 billion to its imports.
18 Based on the definition of agricultural products used for this
newsletter. Source: Global Trade Atlas
Rank Product categoryEU exports to
world
EU exports to
the US
US share in
total
1 Unroasted coffee, tea in bulk 477 214 45%
2 Spirits and liqueurs 6.808 2.745 40%
3 Essential oils 703 244 35%
4 Olive oil 2.904 961 33%
5 Beer 3.553 1.131 32%
Tropical fruit, fresh or dried,
nuts and spices,
2 463, 26%
Soyabeans, 1 688, 18%
Food preparations, not specified,
528, 6%
Spirits and liqueurs, 520, 5%
Raw tobacco, 277, 3%
Remaining Agri-food products,
4 108, 43%
Source: Comext-EurostatUnits: million EUR, %
Rank Product categoryEU imports
from world
EU imports from
the US
US share in
total
1 Odoriferous substances 16 6 38%
2 Soyabeans 5.114 1.688 33%
3 Raw hides, skins and furskins 463 143 31%
4 Casein, other albuminoidal substances and modified starches946 270 29%
5 Wheat 1.156 255 22%

page 23
Agriculture
and Rural
Development
In 2020, Brazil continued to be the top agri-food origin for China, supplying 22% of its agri-food imports (€31 billion, ↗17%). US came second with a 14% share (€20 billion, ↗68%) after having reported a record high increase of 68%, compared to 2019. Chinese imports from the EU27 also observed an impressive growth of 22% and thus it kept its third position in the ranking with a 13% share (€17.7 billion, ↗22%). These three origins concentrate almost 50% of Chinese agri-food imports. Australia (€7.8 billion, ↙15%), New Zealand (€7.5 billion, ↗0%), and Thailand (€6.5 billion, ↗12%) are next in the ranking - each supplying 5-6% of China’s agri-food imports. The remaining countries supply 35% of agri-food imports value.
In terms of products, soya beans are the dominant Chinese import product, accounting for 25% of total agri-food imports (€34.6 billion, ↗9%). Soya beans are sourced mainly from Brazil (€22 billion, ↗6%) and the US (€9 billion, ↗53%). Pig meat ranks second and imports skyrocketed in 2020 by 158% to reach €10.4 billion, representing a share of 8% in China’s basket of agri-food purchases (2019 already saw a growth rate of 130%). Soya beans and pig meat are followed in the ranking by frozen bovine meat (€8.6 billion, ↗21%), infant food preparations (€5.2 billion, ↙1%), fruit (€3.6 billion, ↗29%), palm oil (€3.6 billion, ↙2%), and food preparations (€3.4 billion, ↗20%) for which shares in Chinese agri-food imports value range between 6-3%. The remaining products represent 48% of China’s agri-food imports value.
The overall increase of China import values in 2020 by 16% (↗ €18.7 billion) was driven primarily by higher purchases of pig meat (↗ €6.4 billion – triggered by more than double increase in volume and to a lesser extent unit price rise), and higher purchase value of soya beans (↗ €2.9 billion – higher volume and slightly lower unit price), frozen bovine meat (↗ €1.5 billion), poultry meat (↗ €1.3 billion), maize (↗ €1.2 billion), and wheat (↗ €1.2 billion). On the other hand, biggest decreases affected Chinese imports of wool (↙ €0.7 billion) and wine (↙ €0.6 billion).
The main market for Chinese agri-food exports is Hong Kong (€6.4 billion, ↙12%) with a 13% share in total value. With vegetables, soft drinks, wine, live pigs and poultry meat leading, it is likely that some of
these products are further exported to other destinations from Hong Kong. Despite of a decrease in exports value to Japan (€5.5 billion, ↙6%), the country remains in second place of export destinations with a share of 11% in Chinese total agri-food exports, just before the EU (€5.1 billion, ↙4%). Vietnam kept its fourth position in the ranking (€4.5 billion, ↙2%) followed by the US (€3.8 billion, ↗7%), South Korea (€2.8 billion, ↙2%), Thailand (€2.5 billion, ↗4%), and Malaysia (€2.4 billion, ↗7%). The remaining countries account for 33% of China total agri-food exports.
The Chinese basket of exported products is dominated by vegetables, fruit, food preparations, pet food and tea.
Against the background of an overall decrease of Chinese export values in 2020 by 4% (↙ €2 billion), the biggest declines in absolute terms were observed for vegetables (↙ €0.7 billion) and cigars and cigarettes (↙ €0.4 billion).
China – agri-food trade with the EU
With total agri-food exports valued at € 17.7 billion and imports valued at € 5.1 billion, China is the third most important destination for EU agri-food exports (10% of all EU agri-food exports) and the fifth most important origin for EU agri-food imports (4% of total EU agri-food imports).
Graph 32: Structure of EU28 agri-food trade with China 2010 - 2020
As shown in graph 32, the EU has been a net exporter of agri-food products to China since 2011,

page 24
Agriculture
and Rural
Development
and the trade balance was increasingly positive for the EU until 2017. After a slight contraction in 2018, it rebounded impressively and reached € 12.6 billion in 2020, after exports increased by 22% and imports from China decreased by 4%.
Notably, the trade balance shows that higher exports in 2020 were driven by record increases in other primary products (↗€ 2.6 billion to reach a share of 48% of all agri-food exports to China) and to a lesser extent in commodities (↗€ 744 m) and food preparations (↗€ 356 m). Growth in these three categories far more than compensated for decreases in processed food, including wine (↙€ 169 m), non-edible products (↙€ 323 m), and beverages (↙€ 17 m).
Looking at different classes of products , EU exports to China are clearly dominated by agricultural food and feed products (including wine) with a share of 67% in the total agri-food basket, while food preparations and beverages account for 26%.
Similarly, EU imports from China are also dominated by agricultural food and feed products, which account for 61%, but ‘non-edible products’ feature equally prominent as ‘food preparations and beverages’ and represent shares of 20% and 19% of EU agri-food purchases, respectively.
Beverages and commodities reported minor falls, while food preparations (↗€ 43 m) and processed food (↗€ 5 m) witnessed a slight rise when compared to 2019.
Regarding the more disaggregated product categories, the top five categories accumulate 66% of total EU agri-food exports towards China as shown in Graph 33.
This reflects the fact that China is mainly importing a selected range of agri-food products from the EU. Pig meat (whose share increased from 23% in 2019 to 32% in 2020) and ‘offal and other meats’ (10%) – the latter mainly comprised of products originating from pigs – account now for over 40% of EU exports to China in 2020, demonstrating the importance of this market for the pig meat sector. ‘Infant food and other cereals or milk preparations’ as well as ‘milk powders and whey’ remain important product categories representing shares of 15% and 4% in the EU agri-food exports basket. The list of top five EU
exports products is completed by wine whose share decreased to 4% in 2020 due to a 23% drop in exports value.
Graph 33: Main categories of EU agri-food exports to China in 2020
The decrease in import growth was primarily driven by lower imports of non-edible products (↙€ 189 m) and other primary commodities (↙€ 65 m).
Compared to the trade pattern of 2019, the picture has deeply changed. The most striking development was an increase of pig meat exports by 74%, from € 3.3 billion in 2019 to € 5.7 billion in 2020, driven by record high-rise in volume and minimal price increase. This is related to devastating consequences of ASF outbreaks in China in 2019 during which EU exports of pig meat already skyrocketed (↗230% in value) from € 1 billion in 2018 to € 3.3 billion in 2019. In 2020, this growth slightly slowed down due to the Chinese sanitary restrictions on pig meat imports from some EU countries but remains still an impressive development.
Other product categories that reported substantial growth in EU exports value to China include wheat (↗ €411 m), infant food (↗ €203 m), fresh milk and cream (↗ €135 m), coarse grains (↗ €131 m) and offal (↗ €109 m) – all increases driven primarily by higher volume, except for infant food for which growth was triggered by higher unit price and lower quantities.
On the other hand, significant decreases in export values were reported for such top products as wine
Pigmeat, fresh, chilled and
frozen,
5 725, 32%
Infant food and other cereals, flour, starch or
milk preparations,
2 619, 15%
Offal, animal fats and other meats, fresh, chil led and frozen,
1 807, 10%
Milk powders and whey,
794, 4%
Wine, Vermouth, Cidre
and Vinegar,
677, 4%
Remaining Agri-food products,
6 071, 34%
Source: Comext-EurostatUnits: million EUR, %

page 25
Agriculture
and Rural
Development
(↙ €199 m), cotton (↙ €196 m), raw hides, skins and furskins (↙ €104 m), spirits and liqueurs (↙ €61 m). In case of cotton, the decrease was driven by significant falls in quantities and in unit price, whereas for wine, spirits and liqueurs by lower quantities despite slightly higher prices, and for raw hides by higher price and reduced volume. As a result, the ranking of top EU exports products to China changed with milk powders, fresh milk and cream, wheat and coarse grains advancing in the list, while wine, spirits and cotton slipping to lower places.
China is a particularly important market for EU exports: in particular for pig products as well as for raw agricultural material used in the garment industry (wool and silk, raw hides and skins, cotton). As table 5 indicates, China represents a crucial destination for these product categories, absorbing from one third to more than 57% of EU exports – even more when adding exports to Hong Kong. China is the number one destination not only for EU pig meat (59% together with Hong Kong) and offal (52%), but also for many dairy products (infant food ↙ 30%, fresh dairy products ↙ 29% and milk powders and whey ↙ 16%).
Table 5: China as important destination for EU exports by product category in 2020 (€ million)
As regards EU imports from China, the five most important product categories in 2020 (graph 34) remained unchanged compared to 2019. Offal and animal fats, pet food, vegetables, tropical fruit and nuts dominate with shares of 9% each. Preparations of vegetables (7%) follow in the list.
Graph 34: Main categories of EU agri-food imports from China in 2020
In relation to 2019, the ranking of most important product categories changed slightly as well as their respective shares given lower agri-food imports (↙€ 225 m, ↙4%) from China in 2020. Highest decrease was observed for ‘wool and silk’ (↙€ 95 m) that was triggered equally by reduced imported volume and lower unit price. Other top product categories that reported significant falls include ‘offal and animal fats’ (↙€ 93 m – driven by lower quantities) and ‘fatty acids and waxes’ (↙€ 91 m – driven by a substantial fall in volume despite higher unit price).
On the other hand, EU imports of tropical fruit (↗€ 51 m), oilseeds other than soya beans (↗€ 46 m), and pet food (↗€ 37 m) increased, triggered by higher volumes, and in case of ‘oilseeds other than soya beans’ by an equally important rise in unit price.
Table 6: China as important origin for EU imports by product category, in 2020 (€ million)
Rank Product categoryEU exports to
world
EU exports to
China
China share
in total
1 Pigmeat 10.063 5.725 57%
2 Offal, animal fats and other meats 3.452 1.807 52%
3 Raw hides, skins and furskins 689 315 46%
4 Cotton, flax and hemp, and plaiting
materials986 363 37%
5 Wool and silk 55 18 33%
Offal, animal fats and other meats, fresh, chilled and
frozen, 483, 9%
Pet food, 449, 9%
Vegetables, fresh, chil led
and dried,
445, 9%
Tropical fruit, fresh or dried,
nuts and spices,
439, 9%Preparations of
vegetables, fruit or nuts,
380, 7%
Remaining Agri -food products,
2 927, 57%
Source: Comext-Eurostat
Rank Product categoryEU imports
from world
EU imports from
China
China share
in total
1 Wool and silk 555 226 41%
2 Offal, animal fats and other meats 1.189 483 41%
3 Gums, resins and plant extracts 1.109 265 24%
4 Non-edible animal products 415 96 23%
5 Pet food 2.204 449 20%

page 26
Agriculture
and Rural
Development
Quite remarkably, offal as well as wool and silk feature among the list of products for which China is an important origin for EU imports (see table 6), providing more than 40% of EU supply. This indicates a strong reciprocal trade between the EU and China for both of these products, although the offal traded is of different types. For other products, the share of China in EU imports is less important.
4.4. Brazil
Brazil – agri-food trade with the world
Brazil ranks third in world exports and twenty-third in imports of agri-food. Its agri-food trade surplus stood at €67.7 billion in 2020 (↗6% compared to 2019). The value of Brazilian agri-food exports rose to €76.7 billion, representing a growth rate of 5% (2% in 2019 compared to 2018)19, and that of imports stagnated at €9 billion (↗0%) in 2020 after having reported a rise of 5% in 2019.
In 2020, China remained the top destination for Brazilian agri-food exports. They increased by 11% to reach €27 billion (absorbing 35% of total agri-food exports from Brazil). China is followed by the EU to which Brazilian exports rose by 5% and totalled €11.3 billion. These two destinations absorb 40% of Brazilian agri-food exports value. US (€3.2 billion, ↙4%), and Japan (€2 billion, ↙27%) are next in the ranking - each representing shares between a-4% in Brazilian agri-food exports. Then, there is a number of countries - South Korea, Vietnam, Hong Kong, Indonesia, Thailand, Turkey, Saudi Arabia, Bangladesh, and Egypt for which Brazilian agri-food exports range between €1.8 billion to €1.2 billion and thus represent a 2% share each. The remaining countries account for 35% of Brazil total agri-food exports.
The Brazilian basket of exported products is clearly dominated by soya beans with a share of 33% in their total value (€25.5 billion, ↗10% - primarily driven by volume increase and a slight rise of unit price). Cane sugar ranked second with a 10% share (€7.6 billion, ↗64%) reporting also the highest increase in value amongst all exported agri-food products – driven by
19 Based on the definition of agricultural products used for this
newsletter. Source: Global Trade Atlas
a substantial increase in quantities and slight increase in unit price. They are followed by frozen bovine meat (€5.8 billion, ↗15%), soya bean oilcakes (€5.2 billion, ↙1%), maize (€5 billion, ↙24%), poultry meat (€4.9 billion, ↙16%), and coffee (€4.4 billion, ↗7%) – each representing a share ranging between 8% and 6% in total agri-food exports. The remaining products account for 24% of Brazilian agri-food exports value.
The overall increase in Brazilian export values in 2020 (↗ €3.9 billion) was mostly driven by higher export values for soya beans (↗ €2.2 billion) and cane sugar (↗ €3 billion). On the other hand, the biggest decrease was reported for exports value of maize (↙€2.2 billion) – primarily triggered by reduced quantities and to a lesser extent lower unit price.
Argentina is the top origin for agri-food imports to Brazil, supplying 30% (€2.7 billion, ↙8%). EU27 came second with a 20% share (€1.7 billion, ↙3%), followed by the US (€0.9 billion, ↙9%). These three origins concentrate over 60% of Brazil agri-food imports value. Paraguay (€0.8 billion, ↗36%), and Uruguay (€0.6 billion, ↗10%) are next in the ranking - supplying 9% and 7%, respectively, of Brazilian agri-food imports.
While the Brazilian basket of imported agri-food products is dominated by wheat (€1.2 billion, ↙11%) with a 13% share, the importance of other products is quite scattered. Malt (€0.5 billion, ↙4%) came second with a 5% share, followed by ethanol (€0.4 billion, ↙31%), olive oil (€0.4 billion, ↗3%), wine (€0.4 billion, ↗10%), and rice (€0.3 billion, ↗48%) – each representing about 4% in total imports. The remaining products represent 66% of Brazil agri-food imports value.
Brazil – agri-food trade with the EU
With total agri-food exports valued at €1.7 billion and imports valued at €11.3 billion, Brazil is the second most important origin for EU agri-food imports (9% of all EU agri-food imports) and the nineteenth most important destination for EU agri-food exports (1% of all EU agri-food exports).
As shown in graph 35, the EU trade deficit with Brazil has continued to slightly decrease since 2016, due to

page 27
Agriculture
and Rural
Development
lower value of agri-food imports and marginally higher EU exports. In 2020, it reached though €9.6 billion, after EU exports value fell by 3% and imports from Brazil increased by 5%.
Graph 35: Structure of EU27 agri-food trade with Brazil 2010- 2020
Notably, the trade balance shows that higher imports in 2020 were primarily driven by increase in purchases of agricultural commodities (↗€765 m). Growth in this category far more than compensated for decreases in imports of other primary commodities (↙€124 m) and processed products (↙€123 m).
Looking at different classes of product, EU imports from Brazil are clearly dominated by agricultural commodities with a share of 69% in the total agri-food basket, while other primary commodities and processed products enjoy a similar share of around 10% and non-edible products account for 8%. Imports of beverages are minimal.
Having in mind that EU agri-food exports to Brazil represent only 1.2% of total EU agri-food exports, they are dominated, in contrast, by processed products, including wine with a 40% share, and food preparations (20%). Agricultural commodities and other primary products represent lower shares - 15% each, as well as beverages and non-edible products- 6% each.
The decrease in EU export growth was primarily driven by lower sales of other primary commodities (↙€88 m) and, to a lesser extent beverages (↙€12 m), compared to 2019.
Regarding the more disaggregated product categories, the top five categories accumulate 75% of
total EU agri-food imports from Brazil as shown in Graph 36.
Graph 36: Main categories of EU agri-food imports from Brazil in 2020
This reflects the fact that the EU imports a selected range of agri-food products from Brazil. Out of the top five product categories, almost two third of the imports value is associated with animal feed products (soya beans and oilcakes -22% each), and one third with products for human consumption (unroasted coffee, tea -17%, fruit juices -9%,). Out of remaining agri-food products, raw tobacco, meat preparations, tropical fruit and bovine meat follow in the list with shares representing between 3-4%, each.
Compared to the trade pattern of 2019, the picture has slightly changed. The most striking development was an increase of soya bean imports by 62%, from €1.6 billion in 2019 to €2.5 billion in 2020, driven by record high-rise in volume. Other noteworthy growth in EU imports value from Brazil has been reported for ethanol (↗ €119 m) - also triggered by exceptional spike in volume related to the COVID-19 pandemic.
On the other hand, decreases in import values were noted for a number of other agri-food products, including some top ones such as coarse grains (↙ €152 m), oilcakes (↙ €96 m), fruit juices (↙ €104 m), bovine meat (↙ €55 m), and raw tobacco (↙ €49 m). In case of coarse grains, oilcakes and bovine meat -decreases were driven by falls in quantities, whereas for fruit juices by lower unit price.
Soyabeans, 2 532, 22%
Oilcakes, 2 482, 22%
Unroasted coffee, tea in bulk & mate,
1 886, 17%
Fruit juices, 984, 9%
Cereals, other than wheat and
rice,
651, 6%
Remaining Agri-food products,
2 805, 25%
Source: Comext-EurostatUnits: million EUR, %

page 28
Agriculture
and Rural
Development
As a result, the ranking of top EU imports products from Brazil changed with soya beans, ethanol advancing in the ranking, while oilcakes, bovine meat slipping to lower places.
Brazil is a particularly important origin for EU sourcing: on one hand, of feed products and on the other hand, of certain food products. As table 7 indicates, Brazil supplies 50% of -EU imports of fruit juices and soya beans as well as almost 40% for oilcakes. Brazil is also the top origin for unroasted coffee, tea in bulk and meat preparations, providing around one third of extra-EU demand.
Table 7: Brazil as important origin for EU imports by product category, in 2020 (€ million)
As regards EU exports to Brazil, the basket of top five most important product categories in 2020 (graph 37) remained unchanged compared to 2019. Olive oil clearly dominates with a 19% share. Fruit and vegetables preparations as well as wine account for 9%, each. Pet food (6%) and malt (5%) follow in the list.
Graph 37: Main categories of EU agri-food exports to Brazil in 2020
In relation to 2019, the ranking of the most important product categories changed slightly as well as their respective shares given lower agri-food exports (↙€46 m, ↙3%) to Brazil in 2020. Highest decreases were observed for ‘fruit’ (↙€35 m) and ‘vegetables’ (↙€28 m) – both triggered by substantial reductions in imported volume with higher unit prices. On the other hand, EU exports of malt (↗€17 m) and olive oil (↗€16 m) increased in value, driven by higher volumes with a decrease in unit prices.
Brazil is not a destination which is the key market for EU exports of particular products like some other countries, never representing more than 11% in its value (see table 8). Brazil accounts for 11% of EU exports value of olive oil and 9% for malt.
Table 8: Brazil as important destination for EU exports by product category, in 2020 (€ million)
4.5. Africa
Africa – agri-food trade with the EU20
With total EU agri-food exports valued at € 17.6 billion and imports valued at € 16.5 billion in 2020, African countries are important destinations for EU exports (9.5% of all EU agri-food exports) and origin for its imports (7% of total EU agri-food imports), although with very different trade pattern across African regions and countries, for instance for North Africa or the Sub Saharan countries.
As shown in graph 38, the EU is a net exporter of agri-food products to Africa. Its trade balance
20 Africa’s agri-food trade with the world is not covered in this report due to lack of sufficiently consolidated data for 2020.
Rank Product categoryEU imports
from world
EU imports from
Brazil
Brazil share in
total
1 Fruit juices 1.979 984 50%
2 Soyabeans 5.114 2.532 50%
3 Oilcakes 6.294 2.482 39%
4 Unroasted coffee, tea in bulk & mate 6.108 1.886 31%
5 Meat preparations 1.157 332 29%
Olive oil, 328, 19%
Preparations of vegetables, fruit or
nuts,
160, 9%
Wine, Vermouth, Cidre
and Vinegar,
158, 9%
Pet food, 104, 6%Malt,
86, 5%
Remaining Agri-food products,
916, 52%
Source: Comext-EurostatUnits: million EUR, %
Rank Product categoryEU exports to
world
EU exports to
Brazil
Brazil share in
total
1 Olive oil 2.904 328 11%
2 Malt 911 86 9%
3 Essential oils 703 28 4%
4 Miscellaneous seeds and hop cones 2.112 60 3%
5 Palm & palm kernel oil 191 5 3%

page 29
Agriculture
and Rural
Development
increased slightly in last two years and reached € 1.1 billion in 2020, after EU exports rose by 6% (following already an impressive growth rate of 9% in 2019) and imports rose by 4% (5% in 2019).
Graph 38: Structure of EU27 agri-food trade with Africa in 2010 - 2020
The positive trade balance shows that higher EU agri-food exports (↗€1004 m) in 2020 were primarily driven by increase in sales of agricultural commodities (↗€1173 m) and, to a lesser extent, food preparations (↗€233 m). Growth in these categories compensated for decreases in other categories with ‘other primary products’ (↙€129 m) and ‘beverages’ (↙€118 m) reporting highest losses.
Looking at different classes of products , EU exports to Africa are dominated by ‘commodities’ with a 44% share. Important shares also represent food preparations (21%) and other primary products (17%). Processed food account for 8%, while beverages and non-edible products- 5% each.
By contrast, in the basket of EU imports from African countries, ‘commodities’ dominate together with ‘other primary products’ and account for 43% and 38% of EU agri-food purchases, respectively. Non-edible products (11%) and processed food (7%) follow in the list. Food preparations account for only 2%, while imports of beverages are minimal.
The increase in import growth (↗€596 m) was driven by higher imports of ‘other primary commodities’ (↗€407 m) and, to a lesser extent, by other categories, in particular ‘commodities’ (↗€185 m) and ‘processed food’ (↗€153 m). This growth compensated for a decrease in imports of ‘non-edible products’ (↗€177 m), when compared to 2019.
Regarding the more disaggregated product categories, the top five categories accumulate 48% of total EU agri-food exports towards Africa as shown in Graph 39.
Graph 39: Main categories of EU agri-food exports to Africa in 2020
The basket of EU agri-food exports to Africa is clearly dominated by wheat with a share of 23%. Infant food and other cereals as well as milk powders and whey follow in the list with shares 7-8%, each. Food preparations, rapeseed and sunflower oils account for a similar share of 5%, each. Out of remaining agri-food exports, important products include poultry meat, vegetables, live animals, pet food, and coarse grains – each accounting for a share of around 3%.
Compared to the trade pattern of 2019, the picture has remained rather unchanged with exports of all top five products further increasing. Highest rise was reported for wheat which exports increased by 26%, from €3.2 billion in 2019 to €4.1 billion in 2020, driven by high-rise in volume and minimal price increase. Other product categories that reported major growth in EU exports value to Africa include milk powders and whey (↗ €164 m), coarse grains (↗ €152 m), infant food and other cereals (↗ €115 m). In case of milk powders and whey as well as infant food and other cereals, the exports value increase was primarily triggered by higher unit price, whereas for coarse grains by substantial increase in exported volume.
Wheat, 4 090, 23%
Infant food and other cereals,
flour, starch or
milk preparations,
1 463, 8%
Milk powders and whey, 1 210, 7%
Food preparations, not specified,
826, 5%
Vegetable oils other than palm
& olive oil ,
821, 5%
Remaining agri -food products,
9 178, 52%
Source: Comext-EurostatUnits: million EUR, %
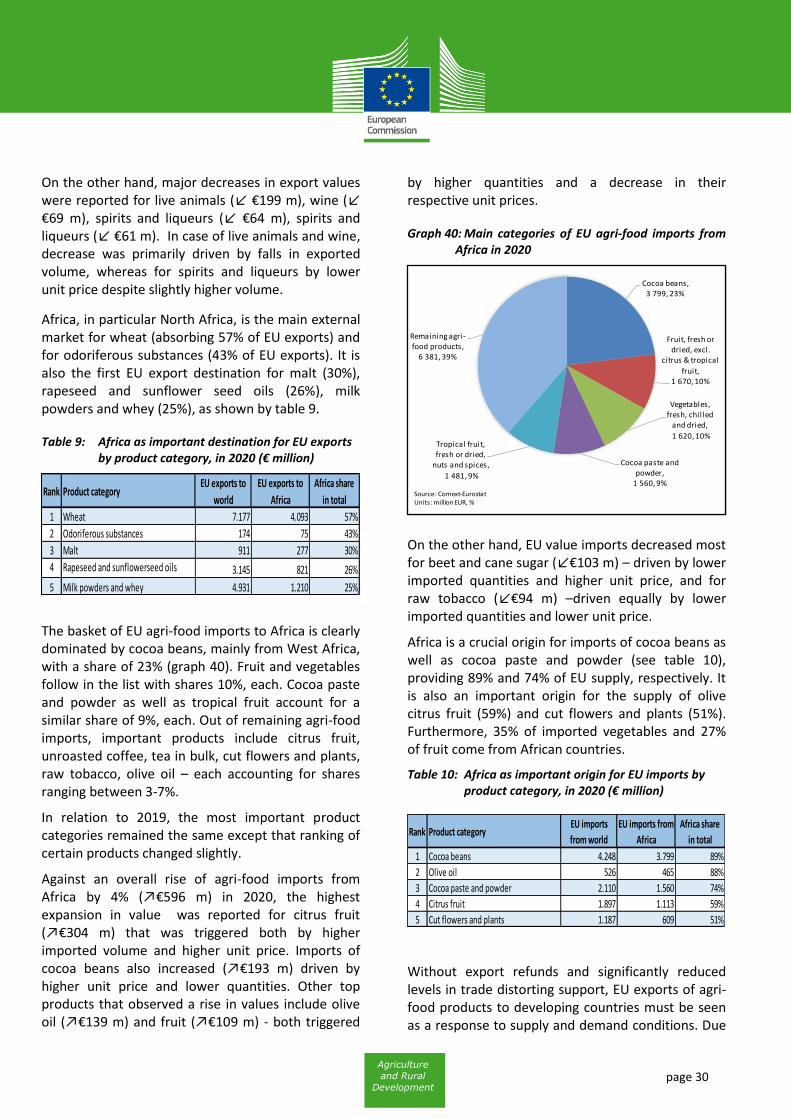
page 30
Agriculture
and Rural
Development
On the other hand, major decreases in export values were reported for live animals (↙ €199 m), wine (↙ €69 m), spirits and liqueurs (↙ €64 m), spirits and liqueurs (↙ €61 m). In case of live animals and wine, decrease was primarily driven by falls in exported volume, whereas for spirits and liqueurs by lower unit price despite slightly higher volume.
Africa, in particular North Africa, is the main external market for wheat (absorbing 57% of EU exports) and for odoriferous substances (43% of EU exports). It is also the first EU export destination for malt (30%), rapeseed and sunflower seed oils (26%), milk powders and whey (25%), as shown by table 9.
Table 9: Africa as important destination for EU exports by product category, in 2020 (€ million)
The basket of EU agri-food imports to Africa is clearly dominated by cocoa beans, mainly from West Africa, with a share of 23% (graph 40). Fruit and vegetables follow in the list with shares 10%, each. Cocoa paste and powder as well as tropical fruit account for a similar share of 9%, each. Out of remaining agri-food imports, important products include citrus fruit, unroasted coffee, tea in bulk, cut flowers and plants, raw tobacco, olive oil – each accounting for shares ranging between 3-7%.
In relation to 2019, the most important product categories remained the same except that ranking of certain products changed slightly.
Against an overall rise of agri-food imports from Africa by 4% (↗€596 m) in 2020, the highest expansion in value was reported for citrus fruit (↗€304 m) that was triggered both by higher imported volume and higher unit price. Imports of cocoa beans also increased (↗€193 m) driven by higher unit price and lower quantities. Other top products that observed a rise in values include olive oil (↗€139 m) and fruit (↗€109 m) - both triggered
by higher quantities and a decrease in their respective unit prices.
Graph 40: Main categories of EU agri-food imports from Africa in 2020
On the other hand, EU value imports decreased most for beet and cane sugar (↙€103 m) – driven by lower imported quantities and higher unit price, and for raw tobacco (↙€94 m) –driven equally by lower imported quantities and lower unit price.
Africa is a crucial origin for imports of cocoa beans as well as cocoa paste and powder (see table 10), providing 89% and 74% of EU supply, respectively. It is also an important origin for the supply of olive citrus fruit (59%) and cut flowers and plants (51%). Furthermore, 35% of imported vegetables and 27% of fruit come from African countries.
Table 10: Africa as important origin for EU imports by product category, in 2020 (€ million)
Without export refunds and significantly reduced levels in trade distorting support, EU exports of agri-food products to developing countries must be seen as a response to supply and demand conditions. Due
Rank Product categoryEU exports to
world
EU exports to
Africa
Africa share
in total
1 Wheat 7.177 4.093 57%
2 Odoriferous substances 174 75 43%
3 Malt 911 277 30%
4 Rapeseed and sunflowerseed oils 3.145 821 26%
5 Milk powders and whey 4.931 1.210 25%
Cocoa beans, 3 799, 23%
Fruit, fresh or dried, excl.
citrus & tropical
fruit, 1 670, 10%
Vegetables, fresh, chilled
and dried,
1 620, 10%
Cocoa paste and powder,
1 560, 9%
Tropical fruit, fresh or dried,
nuts and spices,
1 481, 9%
Remaining agri -food products,
6 381, 39%
Source: Comext-EurostatUnits: million EUR, %
Rank Product categoryEU imports
from world
EU imports from
Africa
Africa share
in total
1 Cocoa beans 4.248 3.799 89%
2 Olive oil 526 465 88%
3 Cocoa paste and powder 2.110 1.560 74%
4 Citrus fruit 1.897 1.113 59%
5 Cut flowers and plants 1.187 609 51%

page 31
Agriculture
and Rural
Development
to rapid population growth and urbanisation, demand greatly outstrips supply in many developing countries and increasing domestic production is not sufficient to satisfy the growing nutritional needs, in terms of quantity as well as quality.
Agriculture and rural development globally have a crucial role for meeting the Sustainable Development Goals (SDGs) of Agenda 2030, including ending hunger and extreme poverty, and can make an important contribution to economic growth, social stability and sustainable use of natural resources. The sector is central for job creation in many developing countries, in particular in Africa. While representing one quarter to one third of the GDP, African agriculture employs 65% to 75% of the labour force. Given the demographic trend in Africa, the challenge to create a sufficient number of job opportunities for young Africans coming into the labour market is immense.
Thus, there is a need to modernise African agriculture in order to address significant structural issues, develop value chains and making it easier for local farms and companies to provide additional income and employment.
This could help to overcome poverty and food insecurity as well as to absorb a rapidly increasing workforce. The EU strongly invested in fostering relationships with developing countries and with the African Union, in conducting a policy dialogue that assists in advancing the agricultural and rural potential, and in encouraging responsible private investment in Africa. Furthermore, the EU is ready to take a leading role in global initiatives that aim at fostering development and sustainable agricultural production - for example in the context of the UN Food Systems Summit, the G20 and the G7. The EU and its Member States also remain the largest provider of development assistance (EUR 74.4 billion 201821) which is crucial to boost our partners' economies.
Most of the African countries benefit from duty-free, quota-free access to the EU market under the "Everything But Arms" scheme and many of them
21 For further information see: http://www.oecd.org/dac/ financing-
sustainable-development/development-finance-standards/modernisation-dac-statistical-system.htm
have concluded Economic Partnership Agreements (EPAs) or other free trade agreements with the EU, encouraging regional cooperation and trade. Concerning agriculture, provided that the products comply with the EU sanitary and phyto-sanitary requirements, the EU trade preferences for African countries incentivise European businesses to buy African products compared to imports from other suppliers subject to non-preferential duties.

page 32
Agriculture
and Rural
Development
Annex Product classification
Product groups Product classes Product categories
Agricultural food and feed products
Commodities
Wheat
Cereals, other than wheat and rice
Rice
Flours and other products of the milling industry
Malt
Starches, inulin & gluten
Soya beans
Oilseeds, other than soya beans
Palm & palm kernel oils
Vegetable oils other than palm & olive oils
Oilcakes
Other feed and feed ingredients
Beet and cane sugar
Sugar, other than beet & cane
Milk powders and whey
Butter
Gums, resins and plant extracts
Unroasted coffee, tea in bulk & mate
Cocoa beans
Cocoa paste and powder
Agricultural commodities, not specified
Other primary
Live animals
Bovine meat, fresh, chilled and frozen
Pig meat, fresh, chilled and frozen
Poultry meat, fresh, chilled and frozen
Sheep and goat meat, fresh, chilled and frozen
Offal, animal fats and other meats, fresh, chilled and frozen
Fresh milk and cream, buttermilk and yoghurt
Eggs and honey
Vegetables, fresh, chilled and dried
Fruit, fresh or dried, excl. citrus & tropical fruit
Citrus fruit
Tropical fruit, fresh or dried, nuts and spices
Miscellaneous seeds and hop cones
Agricultural primary food products, not specified
Processed (incl. wine)
Meat preparations
Cheese
Olive oil
Preparations of vegetables, fruit or nuts
Fruit juices
Wine, vermouth, cider and vinegar
Roasted coffee and tea
Food preparations and beverages
Food preparations
Chocolate, confectionery and ice cream
Infant food and other cereals, flour, starch or milk preparations
Pasta, pastry, biscuits and bread
Soups and sauces
Coffee and tea extracts
Food preparations, not specified
Pet food
Beverages
Waters and soft drinks
Beer
Spirits and liqueurs
Odoriferous substances
Non-edible Non-edible
Raw hides, skins and furskins
Non - edible animal products
Wool and silk
Cotton, flax and hemp, and plaiting materials
Cut flowers and plants
Bulbs, roots and live plants
Raw tobacco
Cigars and cigarettes
Fatty acids and waxes
Sugar alcohols
Essential oils
Ethanol
Casein, other albuminoidal substances and modified starches
Non-edible, not specified
Products non-attributable

page 33
Agriculture
and Rural
Development

page 34
Agriculture
and Rural
Development

page 35
Agriculture
and Rural
Development
Contact: DG Agriculture & Rural Development: A1 Unit for Global Issues and Relations with ACP countries Tel: +32-2-2991111/ email: [email protected]
http://ec.europa.eu/agriculture/publi/map/index_en.htm
© European Union, 2021 Reproduction authorized provided the source is acknowledged.