agricultural and food policy preferences: the 1994
TRANSCRIPT

South Dakota State UniversityOpen PRAIRIE: Open Public Research Access InstitutionalRepository and Information Exchange
Department of Economics Research Reports Department of Economics
12-15-1994
Agricultural and Food Policy Preferences: the 1994Perspectives of South Dakota AgriculturalProducersBashir QasmiSouth Dakota State University
John A. Sondey
Follow this and additional works at: http://openprairie.sdstate.edu/econ_research
Part of the Agricultural Economics Commons
This Article is brought to you for free and open access by the Department of Economics at Open PRAIRIE: Open Public Research Access InstitutionalRepository and Information Exchange. It has been accepted for inclusion in Department of Economics Research Reports by an authorizedadministrator of Open PRAIRIE: Open Public Research Access Institutional Repository and Information Exchange. For more information, pleasecontact [email protected].
Recommended CitationQasmi, Bashir and Sondey, John A., "Agricultural and Food Policy Preferences: the 1994 Perspectives of South Dakota AgriculturalProducers" (1994). Department of Economics Research Reports. Paper 49.http://openprairie.sdstate.edu/econ_research/49

Agricultural and Food Policy Preferences: the 1994 Perspectives of South Dakota Agricultural Producers
by
Bashir A. Qasmi and John A. Sondey· Economics Department
South Dakota State University
Research Report 94-6 December, 1994
"Assistant Professors, Economics Department, South Dakota State University, Brookings, South Dakota 57007.

"Forty-two copies of this document were printed by the Economics Department at a cost of cost cost of $1.68 per document."

Acknowledgements
Funding for this survey in South Dakota was provided by the Agricultural Experiment Station and the Agricultural Extension Service of South Dakota State University.
The authors wish to thank Dr. Larry Janssen, and Dr. Richard Shane , both of the Economics Department, South Dakota State University for their review and helpful comments on an earlier draft of this manuscript. Nevertheless, the authors are responsible for any remaining errors and shortcomings of this report.
We offer our sincere appreciation to Mr. John Ranek and the staff of the South Dakota Agricultural Statistics Service for their assistance in drawing the sample and mailing the survey questionnaire. We appreciate the timely preparation of questionnaires by Ms. Verna Clark and other Economics Department support staff and the data entry and tabulation of survey results by Ms. Karen Brovold. Finally, this report was facilitated by the cooperation of many South Dakota farmers and ranchers in completing and returning the 1994 Agricultural Policy Survey.
1

Table of Contents
Page Summary....................................................................................... 1
1. Introduction . . . . . . . . . . . . . . . . . . . . . . . . . . . . . . . . . . . . . . . . . . . . . . . . . . . . . . . . . . . . . . . . . . . . . . . . . . . . . . . . . . . 5
2. U.S. Farm Policy Trends . . . . . . . . . . .. .. . .. .. . . . . . . . . . . . . . . . . . . . . . . ......................... 6
3. SD Producers' Perspectives on Farm Commodity Policy ............................ 10
4. SD Producers' Perspectives on Conservation & Environment Policies ............ 16
5. SD Producers' Perspectives on Disaster Assistance & Crop Insurance .. . .. ....... 23
6. SD Producers' Perspectives on International Trade . . . . . . .. . . . . .. .. . .. .. ... . . . . . .. .. .. 25
7. SD Producers' Perspectives on Domestic Food Issues . . . . . .. .. . . .. . . . . . . .. . . . . . .. . .. . 29
8. SD Producers' Perspectives on Other Issues ...................... ....... ..... .. ........ 31
References . . . . . . . . . . . . . . . . . . . . . . . . . . . . . . . . . . . . . . . . . . . . . . . . . . . . . . . . . . . . . . . . . . . . . . . . . . . . . . . . . . . . 3 7
Appendix A: Profile of Survey Respondents in South Dakota .......... ..... ....... A-1
Appendix B: Survey Questionnaire . . . . . . . . . . . . . . . . . . . . . . . . . . . . . . . . . . . . . . . . . . . . . . . . . . . . . . B-1
ii

List of Tables
Page 2.1 Target prices, loan rates, average market prices, and ending US stocks;
com and wheat; selected years..................................................... 9
2.2 Direct government payments to farmers; selected years................................ 9
3.1 SD Producers' preferences on farm commodity policy................................. 11
3.2 SD Producers' preferences for policies on commodity target prices and loan rates. 13
3.3 SD Producers' preferences on farm commodity spending cuts........................ 15
3.4 SD Producers' opinions on flexible acres, farmer-owned reserve, income safety net and producer financed dairy program....................... 17
4.1 SD Producers' opinions on conservation reserve program contracts................. 19
4.2 SD Producers' opinions on conservation compliance, water quality and wetland related issues.......................................................... 20
4.3 SD Producers' opinions on farm chemical use, farm chemicals application records, and green payments......................................... 22
4.4 SD Producers' opinions on status of the environment and regulation costs to individual property owners.................................. 24
5.1 SD Producers' opinions on disaster assistance and subsidized crop insurance policy options......................................... 26
6.1 SD Producers' opinions on international trade, subsidized exports, foreign food aid, and limiting Canadian wheat exports....................... 28
7.1 SD Producers' opinions on domestic food aid, food safety, and inspection....... 30
7.2 SD Producers' opinions on nutrition education and food labeling................... 32
8 .1 SD Producers' opinions on targeting agricultural research and FmHA programs; corporate farming; and rural development........................ 33
8.2 SD Producers' opinions on biotechnology and subsidies on plant based fuels.... 35
iii

Page A-1 SD Respondents' profile: personal characteristics..................................... A-2
A-2 SD Respondents' profile: income characteristics....................................... A-4
A-3 SD Respondents' profile: participation in programs and organizations............ A-5
IV

Summary
U.S. farm policies are reviewed, every five years concurrent with the drafting of new farm legislation. The present farm bill expires in 1995, and a new bill will be debated and enacted in 1995. Since farm and food policies have a major impact on farmers, information on their preferences with regard to these policies are invaluable to legislators as well as to different advocacy groups (working for farmers). The research was completed as a part of a 15 state study to document the agricultural and food policy preferences by agricultural producers. This report deals with the policy preferences of South Dakota Producers. A sample of 1,500 farmers and ranchers was randomly drawn from the list of all agricultural producers in South Dakota. A questionnaire, mainly consisting of policy issues common to all participating states, and nine issues of local importance, was mailed to these 1,500 producers. In total, 463 useable completed surveys were returned. The primary results of the survey are summarized below.
General Direction of Commodity Programs Farmers are divided about the future direction for commodity programs. The most frequent responses are split between those who want to gradually eliminate the commodity programs and those who want to retain present programs.
Target price and loan rate Farmers are also divided between those who would like to see the target prices adjusted for inflation and those who favor gradual phasing out of target prices. On loan rates, the two most frequent responses are split between those who wish to continue basing the loan rate on a five year average price and those who would prefer elimination of loan rate and commodity policies.
Federal spending cut preferences If farm commodity program costs must be reduced, the majority of producers prefer to channel payments to small and medium sized farms. Reducing target prices and deficiency payments and making payments based on financial need are the least preferred choices.
Non-Payment Acres More than two-thirds of producers would like to plant more flexible nonpayment acres each year, while retaining their historic program acreage bases.
Farmer-Owned Reserve More farmers favor continuing the farmer-owned reserve than are against it.
Revenue Assurance On the revenue assurance proposal, about one-third of producers are not sure, while for those stating a preference, a few more producers support than oppose the plan.
Future Dairy Support More respondents agree than disagree that the dairy program should be financed by milk producer assessments and administered through a producer marketing board with power to control production. Of dairy farmers, however, two-thirds were against such a proposal.
1

Conservation Reserve Program (CRP) One-fourth of respondents prefer extending all CRP contracts for several years. One-third would prefer to extend contracts on the most erodible acres with new bids. One-fifth would like to discontinue this program.
Conservation Compliance A majority of farmers support the conservation compliance requiring farmers to implement approved conservation plans by January 1, 1995 on highly erodible land or lose the eligibility for farm program benefits.
Regulating Land Use to Improve Water Ouality One-fifth of respondents were not sure about the government regulation of specific farming practices and land use to improve water quality. Among those stating a preference, slightly more opposed it. Stronger opposition came from farmers who have mainly dairy or livestock operations or a large farm.
Grass Protection Strips Farmers are divided on whether they should be required to plant grass strips along stream banks and in waterways to protect water quality. One in five farmers are not sure. Among those who have a preference, slightly more oppose it. A majority of very small farmers, however, support it. A very sizable majority of farmers also believe that they should be compensated for planting these grass strips.
Wetland Preservation Farmers are divided on whether farm program participants should be prohibited from draining wetlands to plant crops on such lands. More farmers oppose than support it.
Pesticide Use and Application Records More farmers have reduced than increased their pesticide use in the past five years. Nevertheless, one half of farmers report that the amount of pesticide use on their farms has not changed during the last five years. Farmers are divided on whether they should be required to keep records on use of all agricultural pesticides.
Threat of Farm Chemicals to Environment Farmers disagree, by a two to one margin, that farm chemicals are becoming a serious threat to South Dakota environment.
Shifting Some Funds to Green Payments Almost one third of respondents were unsure about shifting a part of federal funds currently spent on the commodity program to"green payments" to encourage "environment-friendly" farming practices. Among those who have a preference, a comfortable majority favored the idea.
Status of the Environment in South Dakota A sizable majority of farmers and ranchers believe that they are, generally, doing a responsible job of preserving environmental quality in South Dakota. A majority of them also believe that farm wastes are not becoming a serious threat to the environment in South Dakota.
Government Regulation & Individual Property Rights A strong majority of respondents believe that the government regulations intended to benefit society as a whole, have imposed costs on private property owners which outweigh the social benefits. A strong majority of respondents
2
also believe that if government regulations reduce the value of private property, the owner should be compensated for their loss.
Disaster Assistance A majority of respondents favor some form of government protection from major disasters. However, they are divided on the specific form of this government protection.
Preferred Subsidized Crop Insurance Program A majority of the farmers would prefer to buy crop insurance on a voluntary basis, paying for coverage based on their individual farm yields.
Negotiations to Further Reduce Trade Barriers Two-thirds of respondents want the United States to continue to actively negotiate multilateral and bilateral trade agreements to reduce trade barriers.
Subsidized Export Sales About one-third of respondents are unsure about subsidized export of agricultural products. Among those with preferences, producers who favor subsidized exports outnumber those who are against them by two to one.
Subsidizing Export of Value-added Products Almost forty percent of respondents are not sure about subsidizing value-added products. Among those with preferences, slightly more farmers favor subsidizing value-added products.
Foreign Food Aid Funding Almost one-third of respondents were not sure about continuing the reduction in foreign food aid funding. Among those with preferences, farmers in favor of the reduction outnumbered those opposed by more than a two to one margin.
Limiting Canadian Durum Wheat Exports to the U.S. A sizable majority of respondents support limiting Canadian wheat exports into the U.S. even at the risk of Canadian retaliation against U.S. exports.
Domestic Food Assistance More respondents support than oppose shifting the food programs to cash grants and letting the states distribute the funds.
Food Stamp Distribution Three-fourths of respondents support the distribution of food stamps only to the elderly and families with children which have incomes below the poverty level.
Food Safety and Inspection Almost three quarters of respondents believe that all meat and meat products sold at retail should carry instructions for storage and cooking. Seventy-two percent of respondents favor the strengthening of food inspections in order to ensure safer and better quality foods.
Safety of Imported Food Slightly more farmers agree than disagree that imported foods and beverages meet the same safety requirements as domestic products.
3

USDA Nutrition Guidelines About half of the respondents have seen the USDA food pyramid. Among those, a sizable majority believe that the pyramid is a useful educational tool.
Food Labels More than sixty percent of respondents agree that food labels should contain more information about diet and nutrition. Nine-tenths of respondents read the labels at least occasionally.
Targeting Agricultural Reseairch More than three-quarters of respondents feel that government supported research should be targeted to benefit small and medium farms.
Targeting FmHA Farm Loan Programs More respondents agree than disagree that the FmHA farm loan programs should be restricted to beginning, low resource farmers with less than 10 years of farming experience.
Laws to Restrict Agribusiness Coroorations Four-fifths of farmers and ranchers favor maintaining or strengthening Laws that restrict agribusiness corporations from engaging in large scale farm operations.
Rural Economic Developmen1; About two-thirds of respondents agree that the federal government should increase funding for programs to expand employment activity in rural areas. Respondents believe that business development, more support for public education, and new or improved roads are the three key economic development needs in South Dakota.
Biotechnology A majority of respondents believe that biotechnology will benefit agricultural producers as well as consumc~rs.
Subsidizing Plant Based Fuel~l Two-thirds of respondents favor the use of tax money to subsidize fuels developed from plants (ethanol and soy diesel). More than two-thirds of South Dakota respondents favor maintaining the federal and state subsidies to ethanol producers at least at their present levels.
4

1. Introduction
This research was conducted to document the preferences of South Dakota agricultural producers for agricultural policy alternatives. South Dakota is one of 15 states1 across the nation which participated in the 1994 Survey on Agricultural Policy Alternatives. The survey instrument included questions about farm commodity programs and policies relating to conservation, environment, water quality, international trade, food and nutrition, and other issues of interest to U.S. farmers and ranchers. Most survey questions were identical across states. However, each state was allowed to add a few questions of local interest. Copies of the survey questionnaire were mailed to samples of agricultural producers drawn from each of the participating states. The combined survey results from the 15 states has been published and will provide input to Congressional debate and farm legislation in 1995. 2 This research report presents the results of the South Dakota producers' survey.
In South Dakota, the survey was mailed to a sample of 1,500 farmers and ranchers drawn randomly from a list of all agricultural producers in the state. 3 The questionnaire was mailed, with one follow up in March 1994. Overall, 463 (31%of1,500) useable surveys were returned. The profile and geographic distribution of these respondents are reported in Appendix A. A copy of the South Dakota smvey questionnaire can be found in Appendix B.
U.S. farm policy trends are briefly reviewed in section two. Specifically, the historical setting for U.S. farm policy, the importance of coalitions for U.S. farm interests, and trends in recent farm bills are reviewed. The likely direction for the 1995 farm bill is also discussed. Results of the South Dakota survey are presented in the next five sections. Section three is devoted to producers' perspectives on farm commodity policy. Section four deals with conservation and environmental policies. Producers' views on disaster and crop insurance policies are presented in section five. Producers' opinions on international trade and domestic food policies are discussed in sections six and seven, respectively. Finally, section eight is devoted to producers' opinions on miscellaneous policy issues.
1States which participated in the 1994 Survey on Agricultural Policy Alternatives are Arizona, Georgia, Idaho, Illinois, Indiana, Iowa, Kansas, Michigan, Nebraska, Ohio, Oklahoma, South Carolina, South Dakota, Tennessee, and Texas.
2Tue 15 state composite report is available as Guither, Harold et al., U.S. Farmers' Preferences for Agricultural and Food Policy after 1995, North Central Extension Publication 545. South Dakota also participated in similar cooperative research efforts on agricultural policy alternatives in 1984, and 1989.
3Tue sample was drawn by the South Dakota Agricultural Statistics Service (SDASS). In order to ensure the anonymity of responses, the SDASS also mailed the questionnaires.
5

2. U.S. Farm Policy Trends
Historical Setting for U.S. Farm Policy Federal government policies have a large impact on farmers and ranchers in the United States. The general goals of U.S. farm policy can be identified as: a) expanding farm production in order to provide an adequate and secure supply of food at reasonable prices, b) supporting and stabilizing farm prices and incomes, c) adjustment of agricultural production to market needs, and d) expanding agricultural exports. Although the nature of the agricultural problem has tended to change, the goals of agricultural policy have been amazingly stable over time. The relative importance of these goals and the mechanics of implementation have, however, changed in response to the changing circumstances. Consequently, farm policy changes are evolutionary in nature. (Knutson, Penn and Boehm, 1983, 231-232)
"The most visible U. S. agricultural programs, price and income support programs, began in 1930s, following a period of serious economic hardship for the agricultural sector that began in the early 1920s. The~ Agricultural Adjustment Acts of 1933 and 1938 laid out the basic design for the major commodity programs that have continued to the present. 11 (Allen, 1990, 8) These programs were designed to deal with the chronic problems of low income and excess capacity in U.S. agriculture. All subsequent U.S. farm programs have essentially amended these Acts.
In 1933, over 20% of the U.S. population lived on farms, export markets were not a major outlet for farm products, and the technological revolution in agriculture was in its infancy (Janssen, 1989, 13). Since the 1930s, U.S. agriculture has experienced great technological and structural changes, becoming more internationalized and commercialized. 11 Agricultural production and processing also have become more concentrated; farms have become larger and more specialized in production, and in some food industries, vertical integration, from production through processing and distribution, has become common. In production, dependence on purchased inputs-including fertilizers, pesticides, and fuel-and on borrowed funds has increased." (Allen, 1990, 9)
Today, only 1.8 percent (1991) of the U.S. population live on farms. U.S. farms number less than 2.1 million (1992), and can be divided into two segments: a) a small number of commercial, full-time farmers producing most of our food and fiber, and b) a large number of small, mostly part-time farmers, who produce a small portion of our food and fiber and earn most of their family income from non-farm employment sources. This emerging agricultural structure has important imphcations for the role of and design of commodity programs. For example, should the commodity programs be designed for the largest 24 percent of farms (with an annual gross sales of $40,000 or more) that produce 90 percent of the U.S. agricultural output or for the smallest 76 percent of farms (with annual gross sales of less than $40,000) that
6

produce only 10 percent of the nation's agricultural production?*
Over the years, farm programs that provide support and protection for agriculture have come under fire from some economists, politicians, non-farm interest groups, and farmers themselves. The complaints are that farm programs: (1) entail high costs with benefits accruing to a very small percentage of the population; (2) are unable to cure rural economic ills; (3) contribute to externalities by encouraging practices that damage or deplete soil, water, and air resources; and (4) cause the United States to be a residual supplier of many agricultural commodities by maintaining high loan rates and therefore high price floors in the U.S. (Allen, 1990, 4).
Foreign markets are important for the U.S. agriculture sector but are very unstable. For example, during the five year period ending December, 1991, exports as a percentage of total grain use have ranged from 12 percent (in 1991) to 36 percent (in 1988). This instability raises an important policy issue. Should commodity programs simultaneously provide price stability, income protection, and maintain or expand agricultural export? As noted by Janssen (1989, 13), in such an economic environment, policy choices for commodity programs remain complex.
Importance of Coalitions for U.S. Farm and Commodity Interests U.S. farm and commodity interests have remained well represented during the long legislative debates that precede the farm bill passage every five years. However, farm interests no longer can determine the outcome by themselves. As noted by Brown (1988), the number of other groups seeking to air their views on agricultural policy issues have increased. For example, consumer and taxpayer representatives, environmental interests, rural communities, agribusiness firms, banking interests, representatives of agricultural workers, foreign governments, foreign farm groups, and impoverished foreign consumers are increasingly seeking the attention of Congress in this matter. In a,ddition to the United States Department of Agriculture, a number of other federal departments and agencies (for example, the Office of Management and Budget, the Environmental Protection Agency, the Food and Drug Administration, the Office of the U.S. Trade Representative and Department of State) are playing an ever-increasing role in authoring farm bills. This explosion of interest groups and federal agencies makes it more difficult to define a unified direction for agricultural policy. Consequently, agriculture policy making has become a process of mutual accommodation, with a large number of narrow provisions tailored to specific, diverse interest groups being added to comprise a broad piece of legislation that often contains internal inconsistencies (Brown, 1988). Concurrently, the process has become somewhat more open and democratic, and agricultural policy has been forced to address broader issues than farm prices and incomes.
The major objectives of agricultural policy for farm groups remain price and income support and commodity markiet stability. However, the overall goals of U.S. agricultural policy
4Based on the cash receipts from marketings in 1992 (Source: Economics Research Service, Economic Indicators of the Farm Sector, National Financial Summary, 1992, ECIFS12-l, Washington D.C., USDA, January 1994, Table 49).
7

have broadened in response to an evolving physical, economic and political environment. In the process of "legislative logrolling" many non-farm interest groups trade their support for the commodity programs in return for inclusion of some of their objectives in the final legislation. Farm organizations enhance the probability that their interests will be served by building coalitions with other non-farm groups. The strength of the farm groups continues to lie in their ability to provide useful and timely input during policy deliberations and in the general recognition of agriculture's importance to the U.S. economy. No single organization or a set of organizations, can be insiders on all agricultural policy matters. The agricultural policy process has sometimes drawn together dissimilar groups that can unite behind one or more common objectives. "It could be said that agricultural policy often makes strange bedfellows, but without the coalition building and support of many different groups, many agricultural programs would not likely suirvive." (Allen, 1990, 13)
Trends in Recent Farm Bills The Food Security Act of 1985 (FSA) legislated the commodity, trade, and general provisions for crop years 1986 through 1990. "Its more obvious objectives, judging from the provisions, were to maintain farm income while expanding agricultural exports and drawing down government-held stocks of agricultural commodities, particularly grain..... A broader goal, not limited to agriculture, was to bring down the massive budget deficit." (Allen, 1990, 3) The FSA, basically, signalled a change in the direction of U.S. farm programs. Specifically, the 1985 farm program made provisions for: setting loan rates low and more responsive to the market conditions, setting target prices to support farm income, and employing Payment in Kind (PIK) certificates by the USDA to reduce carry over of government owned commodities.
The 1990 farm program, which provided the basis for agricultural policies for the crop years 1991 through 1995, was the result of two statutes. First, the Food, Agriculture, Conservation, and Trade Act of 1990 superseded the FSA. Second, the Agricultural Reconciliation Act of 1990 further modified many of the agricultural programs in order to reduce outlays as required by the federal deficit reduction agreement. Most of the required agricultural budget reductions came in price and income support programs. These budget cuts were achieved by a combination of lower target prices, frozen specific crop base yields, and reduced payment acres while maintaining program base acres. The 1990 farm bill also attempted to improve competitiveness with foreign producers by making commodity loan rates more responsive to market conditions and by providing increased planting flexibility to producers. The 1990 farm bill encouraged conservation of natural resources by including wetland and water quality programs, and introducing stricter penalties for non-compliance.
The 1985 farm bill was effective in lowering government owned grain inventories (Table 2.1). The farm bills of 1985 and 1990 were also successful in lowering target prices and maintaining commodity loan rates lower than market prices for major grains (Table 2.1). Direct government payments to agricultural producers peaked at $16. 7 billion in 1987 and declined to $9.2 billion by 1992. Nevertheless, for the five year period ending in 1992, the average annual direct government payment to agricultural producers was $10.4 billion per year, accounting for 24 percent of net farm income in the U.S. (Table 2.2).
8

TABLE 2.1 Target prices, loan rates, average market prices, and ending US stocks; corn and wheat; selected years.
Corn All Wheat Crop Target Loan Market Govt. Total Target Loan Market Govt. Year Price Rate Price Stocks Stocks Price Rate Price Stocks
Total Stocks
$/bu $/bu $/bu Mil bu Mil bu $/bu $/bu $/bu Mil bu Mil bu
1984/85 3.03 2.55 2.63 225 1648 4.38 3.30 3.39 378 1425 1985/86 3.03 2.55 2.23 546 4040 4. 38 3.30 3.08 602 1905 1986/87 3.03 1. 92 1. 50 1443 4882 4. 38 2.40 2.42 830 1821 1987/88 3.03 1. 87 1. 94 835 4259 4. 38 2.28 2.57 283 1261 1988/89 2.93 1. 77 2.54 363 1930 4.23 2.21 3. 72 191 702 1989/90 2.84 1. 65 2.36 233 1344 4.10 2.06 3. 72 117 537 1990/91 2.75 1.57 2.28 371 1521 4.00 1. 95 2.61 163 866 1991/92 2.75 1. 62 2.37 113 1100 4.00 2.04 3.00 152 472 1992/93 2.75 1. 72 2.i'J7 56 2113 4.00 2.21 3.24 150 529 1993/94 2.75 1. 72 2.55 45 827 4.00 2.45 3.26 150 570
Source: USDA, Agricultural Statistics, 1993. Tables 2, 5, 9, 38, 40, & 45 updated from Wheat Situation and Outlook Report, ERS/WHS-308, Oct. 1994, & Feed Situation and Outlook Report, ERS/FDS-329, May 1994.
TABLE 2.2 Direct goverrunent payments to farmers; selected years.
Calendar Direct Govt. Total Net Farm Direct Govt. Payments Year Payments (Bil tl_ Income (Bil $) (as % of Net Farm Income)
1980 1. 3 16.1 8.1% 1981 1. 9 26.9 7.1% 1982 3.5 23.8 14. 7'% 1983 9.3 14.2 65.5% 1984 8.4 26.1 32.2% 1985 7.7 28.8 26.7% 1986 11.8 31.1 37.9% 1987 16.7 39.7 42.1% 1988 14.5 38.9 37.3% 1989 10.9 46.9 23.2% 1990 9.3 46.5 20.0% 1991 8.2 40.0 20.5% 1992 9.2 48.6 18.9%
Source: USDA, Economic Indicators of the Farm Sector: National Financial Swnrnary, 1992, Washington, D.C., ERS/ECIFS 12-1, January 1994.
9

Likely Directions for the 1995 Farm Bill It is too early to know the exact composition of the 1995 farm bill. Nevertheless, budgetary pressure to reduce government outlays on farm programs is expected to continue. Environmental and consumer interest groups are likely to strive for stricter environmental provisions, especially stricter regulations for eliminating or reducing the use of a growing number of farm chemicals from food and water supplies. The CRP program may possibly be renewed with a lower level of funding so that the most erodible land in the CRP contracts, which begin expiring in 1996, will be put back in CRP, conceivably for lower per acre payments.
In general, the 1995 bill is likely to stress the increased market orientation of the farm sector. Since the General Agreement on Tariffs and Trade pact requires a 21 percent cut in the volume of subsidized exports, a reduced level of funding for Export Enhancement Programs is likely. The indications are that, within GA TT limitations, the use of EEP type programs will be broadened, both in terms of countries and products, to include meats, dairy, and other high value products.
The Federal Crop Insurance Act of 1994 has already mandated subsidized catastrophic insurance coverage for major crops, and provided for subsidized "buy-up" or supplemental coverage in addition to the minimum mandatory5 insurance through private sector. Pedaraza (1994) noted that "gone for good, according to this new law, are the politically popular but increasingly expensive ad-hoc disaster programs .... " He further added "consider this the opening chapter of the 1995 farm bill. In its bold print are four key features of future farm legislation: expanded flexibility and choice for farmers, greater participation of the private sector in food policy, broader market mandates, and closer scrutiny of farmers (whether or not they participate in farm programs)."
3. SD Producers' Perspectives on Farm Commodity Policy
General Direction of Commodity Programs South Dakota producers' attitudes regarding the future direction of commodity programs have been shifting from mandatory controls towards gradual elimination of commodity programs. The decoupling of farm income support from current farm production decisions has also gained backing. These shifts are, however, marginal (Table 3.1). Gradual elimination of commodity programs is now favored by 40 percent of producers, as compared to 35 percent in 1989. Onethird of producers prefer to keep the present program, as was the case in 1989. A policy of decoupling, which involves separating government support payments from current production decisions, is favored by only 16 percent (up from 12% in 1989). Only 6 percent (down from
5Buying minimum coverage insurance is mandatory only for those producers who receive any payments from USDA under any program.
10

TABLE 3.1 SD producers' preferences on farm commodity policy.
Policy Option
Keep present program
Mandatory supply control programb
Re-establish acreage all•:>tments and market quotasc
Separate government payment from production requirements (decoupling)d
Eliminate commodity programs
Gradually eliminate commodity programs
Other/Undecided
Other/No response
Total
Percent of responses8
1984 Survey 1989 Survey 1994 Survey
25.5 33.1 33.5
13.5 13. 3 6.3
11.5
11. 6 15.8
27.7
35.3 40.0
21. 8
6.7
100.0 100.0 100.0
8 The surveys were completed by 480, 490, and 463 respondents in 1984, 1989, and 1994, respectively. The 1984 and 1989 survey response information is from Janssen (1989, 16).
bMandatory supply control programs (set aside and price supports) with all farmers required to participate if approved in a farmer referendum.
cRe-establish acreage allotments and market quotas is a policy option to increase Federal regulation of farm program decisions similar to commodity programs in the 1950's and 1960's.
dDecoupling is a policy option to immediately reduce Federal regulation of farm production decisions and gradually reduce Federal payment benefits.
Source: South Dakota Agricultural Policy Survey, 1984, 1989, and 1994.
11

13 % in 1989 and 1984) supported a mandatory supply control program if such a program were approved in a producer refere:ndum. If implemented, such a mandatory supply control program would require increased Federal regulation of production decisions through the use of price supports and higher levels of set aside which may reduce Federal budget outlays.
Respondents from we.stern South Dakota were more in favor of eliminating commodity programs (53 % ) whereas respondents from eastern South Dakota were split between eliminating commodity programs (36%) and keeping the present programs (35%). Farmers who are 65 or older are more supportive of current programs, and farmers under 65 years of age are more in favor of gradually phasing out all commodity programs. Grain and soybeans producers are more likely to support maintaining the current commodity programs. Livestock and dairy producers were more likely to prefer phasing out of all commodity programs.
Target Prices and Loan Ratei!_ The level of price and income support is a central issue in the farm commodity programs as it directly affects producers' well being. The present system of loan rates (price supports) and target prices (used to calculate deficiency payments) was established in 1973. With this system, producers participating in the program can receive nonrecourse loans from the Commodity Credit Corporation (CCC) based on the loan rate. "There is no incentive for the farmer to sell unless the market price rises above the loan rate plus accumulated interest costs. The loan rate becomes a price floor because if the farmer cannot receive a higher price from the market, normally, it [the commodity] will be forfeited to the government" (Knutson, Penn, and Boehm, 1990, 238). If the loan rate is set too high, it interferes with the market clearance mechanism and the CCC ends up accumulating large stocks of commodities. Between crop years 1984/85 and 1990/91, the loan rates for corn and wheat were lowered by 38 percent and 40 percent, respectively (Table 2.1).
Participating producers also receive deficiency payments per unit of commodity, based on the difference between the target price and the average market price (the loan rate if the loan rate is higher than average market price). The actual deficiency payment to a producer is calculated by multiplying the per unit deficiency payment by the total units of the commodity qualifying for payment. Other factors being the same, government outlays on a commodity program can be decreased either by lowering the target price, or lowering the quantity of the commodity which qualifies for the deficiency payment or some combination of both. Between crop years 1984/85 and 1990/91, the target prices for both corn and wheat were lowered by 9 percent (Table 2.1).
South Dakota producers are deeply divided on policy options regarding target prices and commodity loan rates. Almost half of the respondents (49%) favor raising target prices each year to match the rate of inflation, while two-fifths of respondents favor lowering target prices by some percent each year or phasing out target prices completely over a 5-10 years period (Table 3.2). Relatively few (9%) respondents favor keeping target prices at their present levels.
12
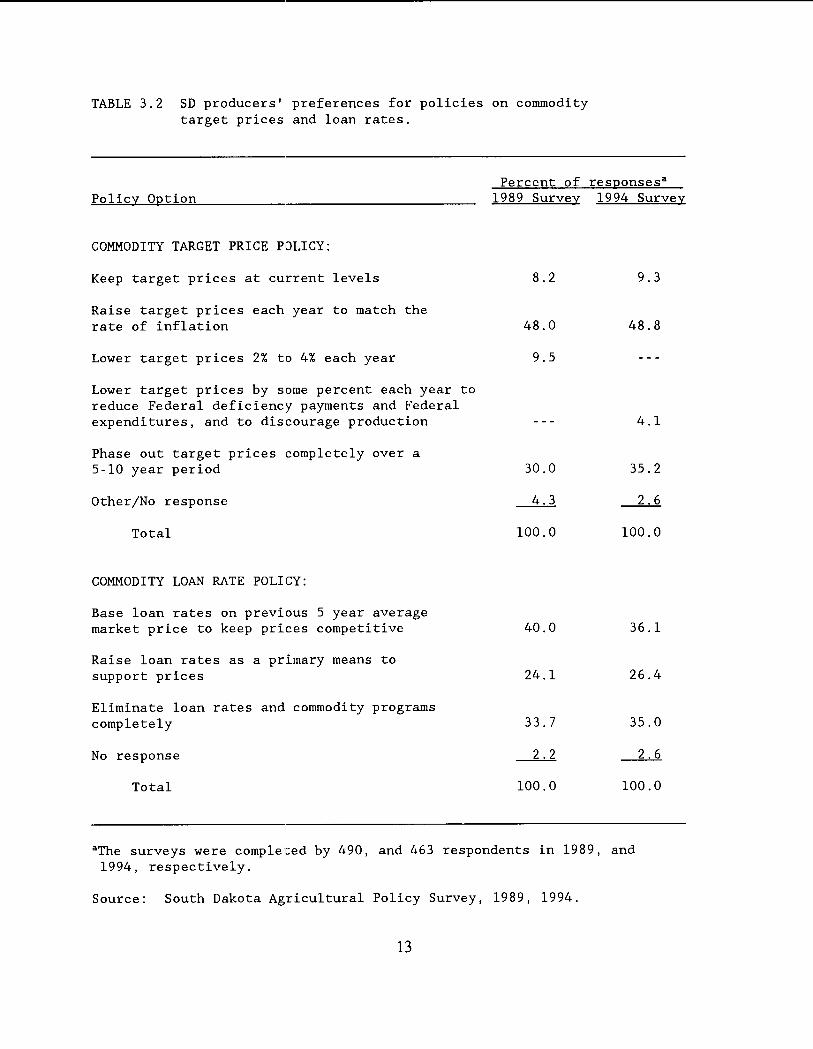
TABLE 3.2 SD producers' preferences for policies on commodity target prices and loan rates.
Policy Option Percent of responses 8
1989 Survey 1994 Survey
COMMODITY TARGET PRICE POLICY:
Keep target prices at current levels
Raise target prices each year to match the rate of inflation
Lower target prices 2% to 4% each year
Lower target prices by some percent each year to reduce Federal deficiency payments and Federal expenditures, and to discourage production
Phase out target prices completely over a 5-10 year period
Other/No response
Total
COMMODITY LOAN RATE POLICY:
Base loan rates on previous 5 year average market price to keep prices competitive
Raise loan rates as a primary means to support prices
Eliminate loan rates and commodity programs completely
No response
Total
8.2 9.3
48.0 48.8
9.5
4.1
30.0 35.2
100.0 100.0
40.0 36.1
24.1 26.4
33.7 35.0
100.0 100.0
8 The surveys were completed by 490, and 463 respondents in 1989, and 1994, respectively.
Source: South Dakota Agricultural Policy Survey, 1989, 1994.
13

Grain farmers, dairy farmers, and grain-livestock (mixed) farmers with annual gross sales of less than $250,000, are more likely to support raising target prices each year to track the rate of inflation. Strongest support for phasing out target prices completely is more likely to come from livestock producers and large producers with an annual gross sales of $250,000 or more. Respondents from western South Dakota are more likely to support phasing out target prices completely. On the other hand, respondents from eastern South Dakota are more apt to favor indexing target prices to the irate of inflation.
Although South Dakota producers are divided with regard to the future of loan rate policy, the most frequently reported preference is for loan rates to be based on a 5 year average market price. This formula was established under the 1985 Food Security Act. While 36 percent of producers prefer basing the loan rate on the five year average price, 26 percent favor raising loan rates, and 35 percent favor elimination of loan rates and commodity policy (Table 3.2). The results of the 1994 survey regarding commodity target prices and loan rates policy are strikingly similar to the results of 1989 survey (Table 3.2). Regional comparison identified farmers and ranchers from western South Dakota as being relatively more supportive of eliminating commodity loans ..
Cutting Farm Commodity Costs Respondents were asked for their choice of program reductions if federal deficit concerns mandate further spending cuts in farm commodity programs. A majority of respondents favor limiting payments to small and medium size farms or basing the payments on financial needs (Table 3.3). One in six respondents support reducing the number of payment acres, and one in eight prefer reducing target prices and deficiency payments.
On this issue, responses from western South Dakota producers did not differ much from those of eastern South Dakota producers. Among producers with annual gross sales of $500,000 or more, the preferred approach is to limit payment acres. Alternatively, producers with annual gross sales less than $500,000, favored restricting farm commodity payments to small and medium size farms.
Non-Payment Acres and Farmer-Owned Reserve (FOR) Under the 1990 Act, farmers have been allowed to plant up to 25 percent of their program crop acreage bases to certain other crops without losing their established historic program crop acreage base for future years. Crops planted on the first 15 percent of these "flex" acres do not receive deficiency payments. Almost three-quarters of respondents would favor permitting producers to plant more of these flexible non-payment acres (Table 3.4). Support for allowing producers to plant more flexible non-payment acres is strong among producers of all sizes and age groups.
The Farmer-Owned Reserve (FOR), an extended loan rate program covering a period of up to three years, was established in 1977 and has continued with some restrictions. Under this program (usually after a bumper harvest and depressed market) a producer agrees not to sell the commodity until the market price reaches a specified level. In return for placing the
14

TABLE 3.3 SD producers' preferences for farm commodity spending cuts.
If Further Spending Cuts Must be Made on Farm Commodity Programs: % of 463
Policy Option Responses
Reduce target prices and deficiency payments
Reduce the number of payment acres (increase flex acres)
Make payments only to small and medium size farms
Make payments based on financial need
No response
Total
Source: South Dakota Agricultural Policy Survey, 1994.
15
11. 7
16.4
54.4
13.4
100.0

commodities in FOR, farmers receive higher loan rates with some interest subsidy, and storage payment. Farmers were asked if some form of farmer-owned reserve should be continued. About half of the respondents favor continuing some form of farmer-owned grain reserve with national minimum and maximum amounts that can be stored (Table 3.4). Support for continuing a farmer-owned grain reserve~ is strong among producers of all age groups, from both eastern and western South Dakota.
Revenue Assurance "An Iowa farm bill study team proposed that the 1995 farm bill include a revenue assurance program in which each producer is assured 70 percent of normal crop revenue. This proposed revenue assurance plan combines disaster assistance with crop insurance and eliminates target prices, acreage reduction, and acreage bases." (Guither, et al., 1994, p 12). South Dakota producers were evenly divided in their opinions regarding this proposal. About 38 percent of South Dakota producers favor the proposal, whereas 31 percent are not sure, and 28 percent do not favor the proposal (Table 3.4). Producers with larger operations (annual gross sales of more than $250,000) and respondents from western South Dakota are slightly more in favor of the proposal.
Future Dairy Support Policy Currently, milk prices are supported through government purchases of manufactured dairy products at specified prices and producer assessments (Guither, et al., 1994, p 12). Farmers were asked if they agreed that the dairy program should be financed by the milk producer assessments and administered through a producer marketing board with the power to control production. About 40 percent of respondents are in favor of financing the dairy program by producer assessment, 34 percent are not sure, and 21 percent disagree (Table 3.4). A relatively higher proportion of producers from western South Dakota (47% vs. 38% of their counterparts from eastern South Dakota) favor the proposal. Among dairy producers, only one-fourth of respondents favor the propos1~ plan while two-thirds do not.
4. SD Producers' Perspectives on Conservation and Environmental Policies
The Federal government has been involved with soil conservation since 1933. Prior to 1985, conservation programs were voluntary and were not linked directly to income and price support benefits of commodity programs (Janssen, 1989, 26). The 1985 farm legislation introduced several changes in the conservation policy including: a) Conservation Reserve Program (CRP); b) Conservation Compliance; and c) Sodbuster and Swampbuster Provisions. The 1990 farm program broadened the cons<;~rvation reserve program by including cropland whose cultivation adversely affects water quality, and by establishing a wetland reserve. The 1990 farm program also introduced stricter penalties for non-compliance with conservation provisions.
16

TABLE 3.4 SD producers' opinions on flexible acres, farmer-owned reserve, income safety net and producer financed dairy program.
(percent of 463 respondents)
Farmers should be permitted to plant more flexible non-payment acres in any year and still retain the historic acreage bases for their programs crops.
Strongly agree
26.6 45.8
Not sure
13.8
Disagree
7.6
Strongly disagree
3.2
No response
3.0
Some form of farmer-owned grain reserve (FOR) with national minimum and maximum amounts to be stored should be continued.
Strongly agree
9.9 38.4
Not sure
29.2
Disagree
12.3
Strongly disagree
6.9
No response
3.2
Replace the current target price, acreage reduction, Federal crop insurance and disaster assistance programs with an income safety net (a 70% of normal crop revenue assurance to each producer).
Strongly agree
7.8 29.8
Not sure
30.7
Disagree
20.1
Strongly disagree
7.8
No response
3.9
The dairy program should be financed by milk producer assessments and administered through a producer marketing board with the power to control production.
Strongly agree
8 .4 32.0
Not sure
34.0
Disagree
15.0
Source: South Dakota Agricultural Policy Survey, 1994.
17
Strongly disagree
6.1
No response
3.9

Conservation Reserve Program (CRP) The Conservation Reserve Program (CRP) in the 1985 Food Security Act authorized a maximum of 45 million of the most erodible cropland to be taken out of production for 10 years and seeded to soil-conserving crops or planted trees. Between 1986 and 1992, 35 million acres in the U.S., including 2.1 million acres from South Dakota, were enrolled in the CRP (USDA, Agricultural Statistics, 1993, 421, 422). CRP contracts that established in 1986 will begin expiring in 1996.
Respondents were asked what policy should be pursued when CRP contracts expire. A majority of the respondents support either the extension of CRP contracts for several years on the same conditions or with some changes (Table 4.1). One-fourth of respondents would like to extend all contracts for several years at the current payment rates per year. Another one-third of respondents would like to extend contracts on the most erodible acres with new bids. Onefifth of respondents would like to discontinue this program, and 15 percent of respondents would replace CRP with conservation and water quality incentive payments.
Respondents from eastern South Dakota are more likely to support the renewal of current contracts at current payment rates or extension of some of the contracts with new bids. Respondents from western South Dakota are more likely to support discontinuing this program. Strongest support for extending contracts on most erodible acres with new bids or extending all contracts for several years at the current payment rates comes from grain and soybean producers.
Conservation Compliance The conservation compliance provisions of the 1985 Food and Security Act prohibit USDA program benefits to farmers who produce crops on highly erodible land without the use of appropriate conservation practices. According to these provisions, farmers with highly erodible land are required to have approved conservation plans implemented by January 1, 1995, or lose eligibility for farm program benefits. A majority (57%) of respondents favor implementation of conservation compliance provisions (Table 4.2). About one-fourth of respondents disagree with enforcement of conservation compliance.
Regulating Land Use to Reduce Water Pollution Farmers were asked if they concurred that the government should regulate specific farming practices and land use to reduce pollution of underground and stream water. Respondents are divided on this issue. About 42 percent of respondents disagree with the regulation of farming practices and land use, whereas 37 percent support it (Table 4.2). Another 21 percent are either not sure or did not respond. Disagreement is much stronger among dairy farms, livestock farms, and larger farms.
Planting Grass Protection Strips to Protect Water Quality Producers were asked if farmers should be required to plant grass protection strips along stream banks and in waterways in order to protect water quality. About 44 percent of respondents favor requiring producers to plant grass protection strips, while 37 percent are against it (Table 4.2).
18

TABLE 4.1 SD producers' opinions on conservation reserve program contracts.
What should the government's policy be when current Conservation Reserve Program (CRP) contracts begin to expire in 1996?
Policy Option
The government should offer to extend all contracts for several years at the current payment rates per year.
The government should offer to extend contracts on the most erodible acres with new bids.
The government should discontinue this program.
The government should replace CRP with conservation and water quality incentive payments.
No response
Total
Source: South Dakota Agricultural Policy Survey, 1994.
19
% of 463 Responses
25.3
36.3
21. 6
14.5
2.4
100.0

TABLE 4.2 SD producers' op1n1ons on conservation compliance, water quality, and wetland related issues.
(percent of 463 respondents)
A. To be eligible for farm program benefits, farmers are required to implement approved conservation plans by January 1, 1995. This compliance program should be continued.
Strongly agree
8.0 49.2
Not sure
12.3
Disagree
19.2
Strongly disagree
9.1
B. Water quality has become a major concern. Government should regulate specified farming practices and land uses to reduce pollution of underground and stream water.
Strongly Not Strongly agree Agree sure Disagree disagree
7.3 29.6 17.9 27.0 14.9
c. To protect water quality, all farmers should be required to grass protection strips along stream banks and in waterways.
Strongly Not Strongly agree Agree sure Disagree disagree
9.3 35.0 15.6 25.3 12.1
D. Farmers should be compensated for planting grass protective along stream banks and in waterways.
Strongly Not Strongly agree Agree sure. Disagree disagree
16.4 52.3 11. 2 13 .8 3.7
E. Farmers should not be permitted to drain wetlands and plant these lands.
Strongly Not Strongly agree Agree sure Disagree disagree
11.0 26.1 15.3 19.2 16.4
Source: South Dakota Agricultural Policy Survey, 1994.
20
No response
2.2
No response
3.2
plant
No response
2.8
strips
No response
2.6
crops on
No response
1. 9

Another 18 percent were not sure or did not respond to the question. Among very small farmers (with annual gross sales less than $40,000), support for requiring producers to plant grass protection strips along stream banks and in waterways to protect water quality is strong (58 % in favor). Among respondents other than very small producers, more respondents disagree than agree (47% disagree whereas 40% agree).
Producers are less divided on the issue of compensation for planting grass strips. More than two-thirds of respondents agree that producers should be compensated for planting grass protective strips along stream banks and in waterways (Table 4.2). Only 15 percent of respondents oppose such compensation to producers.
Wetland Preservation Under the 1985 Food Security Act and the 1990 farm program, farm operators cannot drain wetlands without losing program benefits. The most controversial problem in implementing wetland policy has been defining wetland. Farmers were asked to respond to the statement that farmers should not be permitted to drain wetlands and plant crops on these lands. About 46 percent of respondents disagree with restrictions on draining wetlands, while 37 percent agree (Table 4.2). Very small producers (with annual gross sales ofless than $40,000) are more likely to support restricting farmers from draining wetlands. Among other farmers, a majority of respondents disagree with such restrictions (52% disagree, 34% agree). Regional comparison showed that a slightly higher proportion of respondents from eastern South Dakota are against restricting farmers from draining wetlands.
Pesticide Use and Keeping p,esticide Application Records The use of agricultural pesticides has become an important issue for many concerned with water quality, food safety, and wildlife protection. Respondents were asked how the amount of pesticides they were currently using (based on active ingredients per acre) compared with the amount used five years ago. About one-half of respondents claim that they are using about the same quantity of pesticides, and about one-third of respondents claim that they are using less (Table 4-3). About 8 percent reported that they are using more pesticides, and another 8 percent were not sure.
The 1990 Farm Bill required farmers to maintain application records for restricted use pesticides. Respondents were asked if farmers should be required to keep the application records on their use of all agricultural pesticides. Farmers are divided on this issue. About 44 percent of respondents agree that farmers should be required to maintain the application records of all agricultural pesticides, while 42 percent respondents disagree (Table 4-3).
Threat of Farm Chemicals to the Environment Respondents were asked if farm chemicals are becoming a serious threat to the environment in South Dakota. About one-half of respondents disagree, and about one-fourth of respondents agree, that farm chemicals are becoming a serious threat to the environment in South Dakota. Another one-fourth of respondents are not sure. Very small producers (with annual gross sales less than $40,000) tend to agree that farm chemicals are becoming a serious threat to the
21
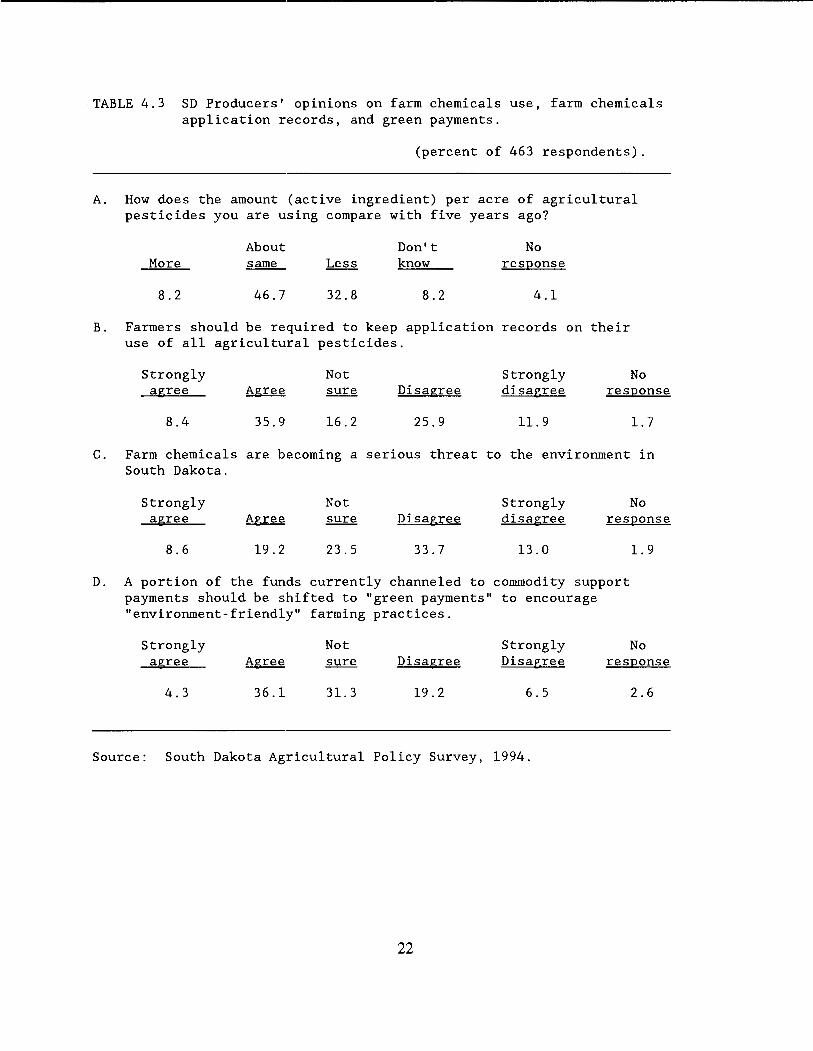
TABLE 4.3 SD Producers' opinions on farm chemicals use, farm chemicals application records, and green payments.
(percent of 463 respondents).
A. How does the amount (active ingredient) per acre of agricultural pesticides you are using compare with five years ago?
B.
C.
About Don't More same Less know
8.2 46.7 32.8 8.2
Farmers should be required to keep application use of all agricultural pesticides.
Strongly agree
8 .4
Farm chemicals South Dakota.
Strongly agree
8.6
Not Agree sure
35.9 16.2
are becoming a
19.2
Not sure
23.5
Disagree
25.9
serious threat to
Disagree
33.7
No response
4.1
records on their
Strongly No disagree response
11. 9 1. 7
the environment in
Strongly disagree
13.0
No response
1. 9
D. A portion of the funds currently channeled to commodity support payments should be shifted to "green payments" to encourage "environment-friendly" farming practices.
Strongly agree
4. 3 36.1
Not sure
31. 3
Disagree
19.2
Strongly Disagree
6.5
Source: South Dakota Agricultural Policy Survey, 1994.
22
No response
2.6
environment of South Dakota (40% agree, 27% disagree). The larger the operation the more likely the respondent is to disagree (among respondents with annual gross sales of $40,000 or more, 56% disagree, and 22 % agree).
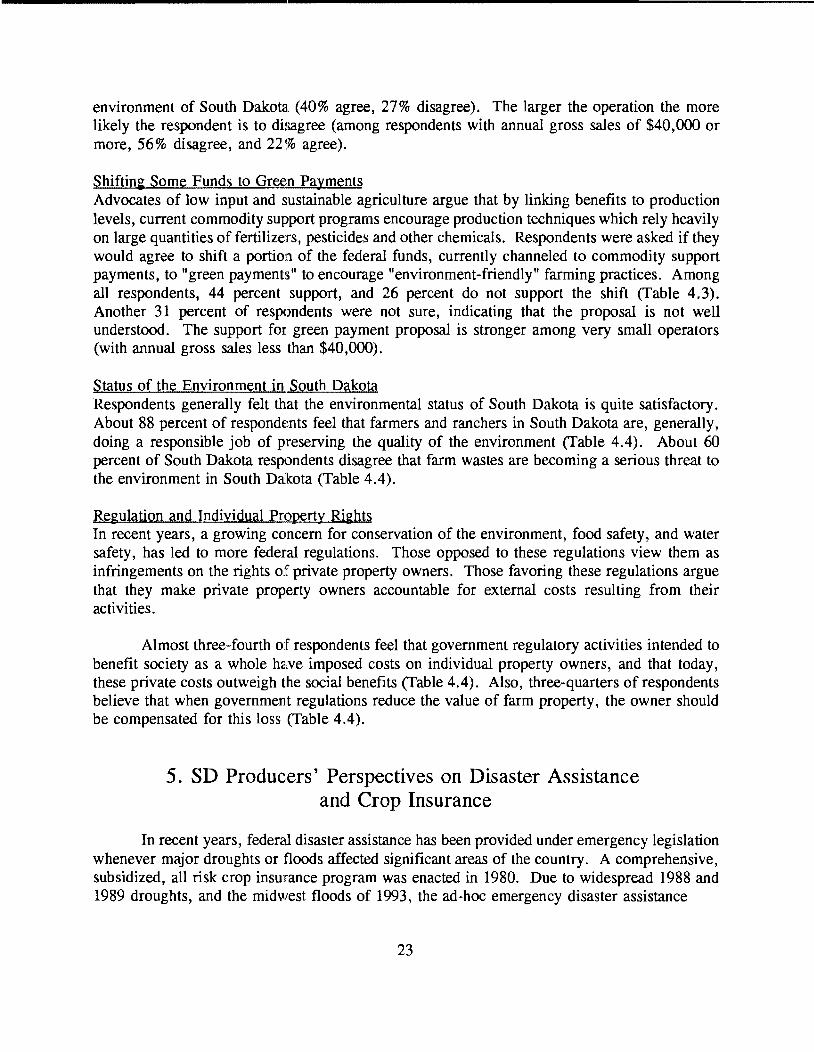
Shifting Some Funds to Green Payments Advocates of low input and sustainable agriculture argue that by linking benefits to production levels, current commodity support programs encourage production techniques which rely heavily on large quantities of fertilizers, pesticides and other chemicals. Respondents were asked if they would agree to shift a portion of the federal funds, currently channeled to commodity support payments, to "green payments" to encourage "environment-friendly" farming practices. Among all respondents, 44 percent support, and 26 percent do not support the shift (Table 4.3). Another 31 percent of respondents were not sure, indicating that the proposal is not well understood. The support for green payment proposal is stronger among very small operators (with annual gross sales less than $40,000).
Status of the Environment in South Dakota Respondents generally felt that the environmental status of South Dakota is quite satisfactory. About 88 percent of respond<:mts feel that farmers and ranchers in South Dakota are, generally, doing a responsible job of preserving the quality of the environment (Table 4.4). About 60 percent of South Dakota respondents disagree that farm wastes are becoming a serious threat to the environment in South Dakota (Table 4.4).
Regulation and Individual Property Rights In recent years, a growing concern for conservation of the environment, food safety, and water safety, has led to more federal regulations. Those opposed to these regulations view them as infringements on the rights of private property owners. Those favoring these regulations argue that they make private property owners accountable for external costs resulting from their activities.
Almost three-fourth of respondents feel that government regulatory activities intended to benefit society as a whole have imposed costs on individual property owners, and that today, these private costs outweigh the social benefits (Table 4.4). Also, three-quarters of respondents believe that when government regulations reduce the value of farm property, the owner should be compensated for this loss (Table 4.4).
5. SD Producers' Perspectives on Disaster Assistance and Crop Insurance
In recent years, federal disaster assistance has been provided under emergency legislation whenever major droughts or floods affected significant areas of the country. A comprehensive, subsidized, all risk crop insurance program was enacted in 1980. Due to widespread 1988 and 1989 droughts, and the midwest floods of 1993, the ad-hoc emergency disaster assistance
23

TABLE 4.4 SD producers' opinions on status of the environment, and regulation costs to individual property owners.
(percent of 463 responses)
A. Farmers and ranchers in South Dakota are, generally, doing a responsible job of preserving the quality of the environment.
Strongly agree
24.6 62.9
Not sure
5.6
Disagree
3.7
Strongly disagree
0.9
No response
2.4
B. Farm wastes are becoming a serious threat to the environment in South Dakota.
Strongly agree
2.4 10.4
Not sure
24.0
Disagree
46.0
Strongly disagree
15.1
No response
1. 9
C. Government regulatory activities, intended to benefit society as a whole, have imposed costs on individual property owners. Today, these private costs outweigh the social benefits.
Strongly Not Strongly No agree Agree sure Disagree disagree response
20.7 42.3 28.1 5.2 0.9 2.8
D. When government regulations reduce the value of farm property, the owner should be compensated for this loss.
Strongly Not Strongly No agree Agree sure Disagree disagree response
30.5 44.9 11. 9 8.9 1. 9 1. 9
Source: South Dakota Agricultural Policy Survey, 1994.
24
programs proved to be very expensive and were important policy issues at the time the survey was mailed out.
Disaster Assistance Respondents were asked whiether and how the government should protect farmers from the financial impacts of natural disasters. A majority of respondents (61 % ) favored some form of government protection, while 37 percent would rather see government withdraw from the crop insurance and special disaster assistance business (Table 5 .1). About one-fourth of respondents favor government developing a permanent disaster program for crop losses exceeding 50 percent and encouraging farmers to buy additional protection from private crop insurance companies. Support for getting the gove:rnment out of the disaster and crop insurance business and for relying on private crop insurance is much stronger in western South Dakota (50% as compared to 33 % among respondents from eastern South Dakota).
Crop Insurance Respondents were asked which type of insurance program would they prefer were the government to offer a subsidized crop insurance and no disaster program. About 87 percent of respondents favor letting the farmer buy crop insurance on a voluntary basis, with 62 percent of respondents favoring coverage based on individual yields and another 25 percent favoring a lower level of coverage based on county average yields, with no payoff unless county yields drop more than some specified amount (Table 5 .1). Ten percent of respondents favor a program mandating all farmers to buy crop insurance (Table 5.1).
Since completion of the survey, the Federal Crop Insurance Act of 1994 has been passed. The Act is intended to send a signal to producers that ad-hoc disaster programs are over. The Act mandates subsidized catastrophic insurance coverage for major crops, and provides for subsidized "buy-up" coverage in addition to the minimum mandatory insurance available through the private sector.
6. SD Producers' Perspectives on International Trade
U.S. farmers increasingly compete in a global marketplace. During the five year period ending with crop year 1992/93, about two-thirds of U.S. wheat, one-third of U.S. soybeans, and onefourth of U.S. com production were exported. During the five year period ending in 1992 (fiscal year), U.S. agricultural commodity exports have varied from $35.3 billion (in 1988) to $42.4 billion (in 1992) and netted an average trade surplus of $16.6 billion per year (USDA, Agricultural Statistics, 1993). During the same period, the U.S. animal and animal products exports have ranged from $6.0 billion (in 1988) to $7.8 billion (in 1992) and resulted in an average net trade surplus of $1.5 billion per year (USDA, Agricultural Statistics, 1993).
Although international trade has been greatly expanded and liberalized since World War TI, trade protectionism remains a major policy concern. Historically, agriculture was not included in multi-lateral trade liberalization efforts under GATT. In 1986, the U.S. proposed
25

TABLE 5.1 SD producers' opinions on disaster assistance and subsidized crop insurance policy options.
A. Should the government protect farmers from risks associated with major droughts and floods?
Policy option
Yes. Let Congress decide each year about disaster aid programs.
Yes. Develop a permanent disaster program for losses that exceed 50 percent and encourage farmers to buy additional protection by using private crop insurance.
Yes. Set up a mandatory crop insurance program for all farmers as a condition of eligibility for additional disaster payments.
No. Let farmers buy private crop insurance if they want protection and get the government out of crop insurance and special disaster assistance.
No response
% of 463 Responses
17.1
25.9
17.7
37.2
2.2 100.0
B. If the government were to offer a subsidized crop insurance program and no disaster program, which type of program would you prefer?
Policy option
Let farmers buy crop insurance on a voluntary basis, paying for coverage based on their individual farm yields.
Let farmers buy crop insurance on a voluntary basis, but offer lower premiums by basing premiums on county average yields with no pay off unless county yields drop more than some specified percent.
Require all farmers to buy crop insurance.
No response
Source: South Dakota Agricultural Policy Survey, 1994.
26
% of 463 Responses
61.8
25.1
9.3
3.9 100.0

that trade in agricultural products be included under the GA IT, and that trade distorting subsidies and other trade baniers for agricultural products be completely eliminated over time. Subsequently, while GAIT negotiations remained stalled, the U.S. signed and ratified the North American Free Trade Agreement (NAFTA) with Canada and Mexico. The GA IT pact was finalized in 1993, requiring a 21 percent cut in the volume of subsidized exports from the base year (1986). When the survey was conducted, the GAIT was awaiting a vote by the U.S. Congress. Subsequently, the GAIT has been ratified by the Congress.
In 1989, Janssen (1989, 34) noted that "conflicting benefits of freer trade versus benefits from protectionism are reflected in respondents' opinions". The 1994 survey also confirms their dichotomy. While, a strong majority of respondents favor freer trade, a significant proportion of respondents also support continuing subsidized export sales of agricultural products, and a majority of respondents favor limiting Canadian wheat exports to the United States even at the risk of Canadian retaliation against U.S. exports.
Negotiations to Further Reduce Trade Barriers Respondents were asked if th1e United Sates should continue to vigorously negotiate multilateral and bilateral arrangements (beyond the NAFTA and GAIT) to further reduce trade barriers. Most farmers agree that we should. Two-thirds of respondents agree that U.S. should take the lead in negotiating multilateral and bilateral trade agreements to reduce trade barriers, whereas one-tenth of respondents disagree, and two-tenth of respondents are not sure (Table 6.1). Support for additional trade agreements is stronger among farmers and ranchers who are under 50 years of age, and have attended some college or vocational school beyond high school.
Subsidizing Exports and Decreasing Foreign Food Aid Respondents were asked whether the U.S. should continue subsidizing export sales of agricultural products. About 43 percent of respondents agree that we should, whereas 21 percent disagree, and 32 percent are not sure (Table 6.1). Farmers and ranchers who have attended some college or technical school and produce grain, or produce grain and livestock are most supportive of subsidizeel export sales. Dairy farmers are least supportive and respondents from eastern South Dakota are, generally, more supportive of subsidized export sales.
When asked if the U.S. should continue subsidizing exports of value added agricultural products (such as meat, flour, and similar processed commodities) rather than bulk commodities, three-tenths of respondents agreed that we should, one-fourth of respondents disagreed, and fourtenths of respondents were not sure (Table 6.1). Support for subsidized exports of value added products is slightly stronger among respondents from eastern South Dakota.
When asked if the U.S. should continue to decrease its funding of foreign food aid, almost one-half of the respondents agreed that we should, while one-fifth disagreed, and about three-tenths were not sure. The support for decreasing foreign food aid is stronger among respondents from western South Dakota.
27

TABLE 6.1 SD producers' opinions on international trade, subsidized exports, foreign food aid, and limiting Canadian wheat exports.
(percent of 463 responses)
A. Beyond the current NAFTA and GATT agreements, the U.S. should continue to vigorously negotiate multilateral and bilateral arrangements to further reduce trade barriers.
B.
Strongly agree
16.4
The U.S. should products.
Strongly agree
6.3
Agree
50.8
continue
36.5
Not sure Disagree
20.7 5.8
to subsidize export
Not sure
32.0
Disagree
16.0
Strongly No disagree response
2.8 3.5
sales of agricultural
Strongly disagree
5.2
No response
4.1
C. The United States should subsidize exports of value added products (such as meat, flour, and similar processed commodities) rather than bulk commodities.
D.
Strongly agree Agree
4. 5 27.7
The U.S. should continue
Strongly agree
13.6 34.6
Not Strongly sure Disagree disagree
38.4 19.9 5 .4
to decrease its funding of foreign
Not sure
26.8
Disagree
18.8
Strongly disagree
2.6
No response
4.1
food aid.
No response
3.7
E. Imports of durum wheat from Canada have taken market share from domestic producers. U.S. should take steps to limit Canadian wheat exports to the United States even though Canada may retaliate against U.S. exports.
Strongly agree
15.8 43.0
Not sure
26.8
Disagree
9.9
Strongly disagree
2 .4
Source: South Dakota Agricultural Policy Survey, 1994.
28
No response
2.2

Limiting Canadian Durum Exports to U.S. As imports of durum wheat from Canada have captured market share from domestic producers, respondents from South Dakota were asked whether the U.S. should take steps to limit wheat imports from Canada? About sixty percent of respondents agreed that U.S. should take steps to limit wheat imports from Canada even though Canada may retaliate against U.S. exports, whereas about one-tenth disagreed, and three-tenths were not sure or did not respond (Table 6.1). The support for limiting Canadian wheat exports into the U.S., even at the risk of Canadian retaliation against U.S. exports, is strong among all age groups, and all farm size groups as well as among producers from eastern and western South Dakota.
7. SD Producers' Perspectives on Domestic Food Issues
Domestic Food Assistance Domestic food stamps and other food assistance programs account for more than half of the U.S. Department of Agriculture budget. When asked if the food programs should be shifted to cash grants and allow states to distribute the funds, 45 percent of respondents agreed, 28 percent disagreed, and 22 percent were not sure or did not respond (Table 7.1). When asked if food stamps should be distributed only to the elderly and families with children which have incomes below the poverty levels, 75 percent of respondents agreed, while 11 percent disagreed, and 14 percent were not sure or did not respond (Table 7 .1).
Food Safety and Inspection With periodic well-publicized outbreaks of illness caused by contaminated meat, food safety has emerged as an important policy issue. Respondents were asked if they agree that all meat and meat products sold at retail should carry instructions for storage and cooking. About 72 percent of respondents agree, 16 percent disagree, and 12 percent were not sure or did not reply (Table 7 .1). When asked if they favored the strengthening of food inspections in order to ensure safer and better quality foods, 72 percent respondents agreed, 11 percent disagreed, and 17 percent were not sure or did not respond (Table 7 .1).
Respondents were divided on whether imported food and beverages now meet the same safety requirements as domestic products. About 39 percent of respondents agreed that the imported food and beverages now meet the same safety requirements as domestic products, 37 percent disagreed, and 27 percent were not sure or did not answer (Table 7.1). Among those who produce hogs, beef, and sheep, or have mixed grain and livestock farms, disagreement is slightly stronger.
USDA Nutrition Guidelines The United States Departmen1t of Agriculture has always played a key role in nutrition education. In 1980, the USDA, in conjunction with the Department of Health, Education and Welfare (now Health and Human Services), issued its first set of dietary guidelines. The guidelines encouraged consumers to avoid food products containing too much fat, saturated fat, and cholesterol. The guidelines drew a negative reaction from many farm groups, especially
29

TABLE 7.1 SD producers' opinions on domestic food aid, food safety, and inspection.
(percent of 463 respondents).
A. Food stamps and othe:r food programs take more than half of the U.S.
B.
Department of Agriculture budget. Food programs should be shifted to cash grants and let states distribute the funds.
Strongly agree
11.0
Food stamps
34.3
should be
Not sure
22.7
Disagree
18.1
distributed only to the with children which have incomes below poverty
Strongly Not agree Agree sure Disagree
24.6 50.8 10.2 8.9
Strongly disagree
9.7
elderly and levels.
Strongly disagree
2.4
No response
4.1
families
No response
3 .4
C. All meat and meat products sold at retail should carry instructions for proper storage and cooking.
Strongly Not Strongly No agree Agree sure Disagree disagree response
15.1 56.6 9.3 13. 8 2.4 2.8
D. Food inspections should be strengthened to insure safer and better quality foods.
Strongly Not Strongly No agree Agree sure Disagree disagree response
15.8 55.7 14.3 9.7 1. 5 3.0
E. Imported food and beverages now meet the same safety requirements as domestic products.
Strongly agree
18.2 20.7
Not sure
21.4
Disagree
22.3
Strongly disagree
14.4
Source: South Dakota Agricultural Policy Survey, 1994.
30
No response
2.3

livestock and dairy groups. In 1982, Secretary of Agriculture Block appointed a committee of scientists to review these dietary guidelines. In their 1985 report, the committee recommended only minor changes, and today the same dietary guidelines remain the basis for federal dietary guidance policy. (Knutson et al., 1990, 341-44).
Amid much controversy, the USDA issued its revised nutrition recommendations in the form of a food pyramid (based on dietary guidelines) in 1992. One-half of the respondents have seen the USDA food pyramid and its guidelines for proper nutrition, 40 percent have not seen them, and the remaining 10 percent are not sure or did not respond (Table 7.2). A higher proportion of respondents who are less than 50 years old and have attended college have seen the pyramid. Of those who have seen the USDA pyramid, 60 percent believe it is a useful educational tool, 20 percent believe it is not, and another 20 percent were not sure (Table 7 .2).
Food Labelling In recent years, there has been an increased emphasis on diet and health. Consequently, the information conveyed by food labels has emerged as an important policy issue. When asked if food labels should be required to contain more diet and nutrition information, 61 percent of respondents agreed, whereas 16 percent disagreed, and 23 percent were not sure or did not respond (Table 7.2). Respondents who are older, have less education, and are grain producers are more supportive of added information on the labels. When asked if they read the food labels on the packages to determine: the contents of the product, 37 percent of respondents said they often do, 56 percent said they occasionally do, and remaining 7 percent said they never do or did not reply (Table 7.2).
8. SD Producer's Perspectives on Other Issues
Targeting Agricultural Research Responding to the question of whether government-supported agricultural research should be targeted to benefit small and medium farms, 79 percent respondents said yes, 9 percent said no, and remaining 12 percent were not sure or did not respond (Table 8.1). Naturally, respondents with medium or smaller operations (annual gross sales of $100,000 or less) are more supportive of this focus:. However, a majority of respondents from each farm size category favored this proposition. Even among respondents with an annual gross sales of $500,000 or more, 50 percent were supportive while 21 percent were against the proposed targeting.
Targeting FmHA Farm Loan Programs Farmers and ranchers in South Dakota were asked if they would support a policy of restricting the FmHA farm loan programs to beginning, low resource farmers with less than 10 years of farming experience. Such restrictions on the FmHA farm programs are supported by 47 percent of respondents. About 30 percent were opposed, and 23 percent were not sure or did not respond (Table 8.1).
31

TABLE 7.2 SD producers' opinions on nutrition education and food labeling.
(percent of 463 responses)
1. Have you seen the USDA food pyramid with guidelines for proper nutrition?
Yes No
49.7 39.5
Not sure
8.6
No response
2.2
2. If you have seen the USDA food pyramid, do you think it is a useful educational tool?
Yes No
19.5a
Not sure
20.5a
3. Food labels should be required to contain more diet and nutrition information.
Strongly Not agree Agree sure
12.3 48.8 18.4
4. Do you read the food labels on contains?
Occasionally
36.5 55.9
Disagree
14.3
the package to
5.0
Strongly disagree
1. 9
find what
No response
2.6
No response
4. 3
the product
aBased on responses of 230 respondents who have seen the USDA Food Pyramid.
Source: South Dakota Agricultural Policy Survey, 1994.
32
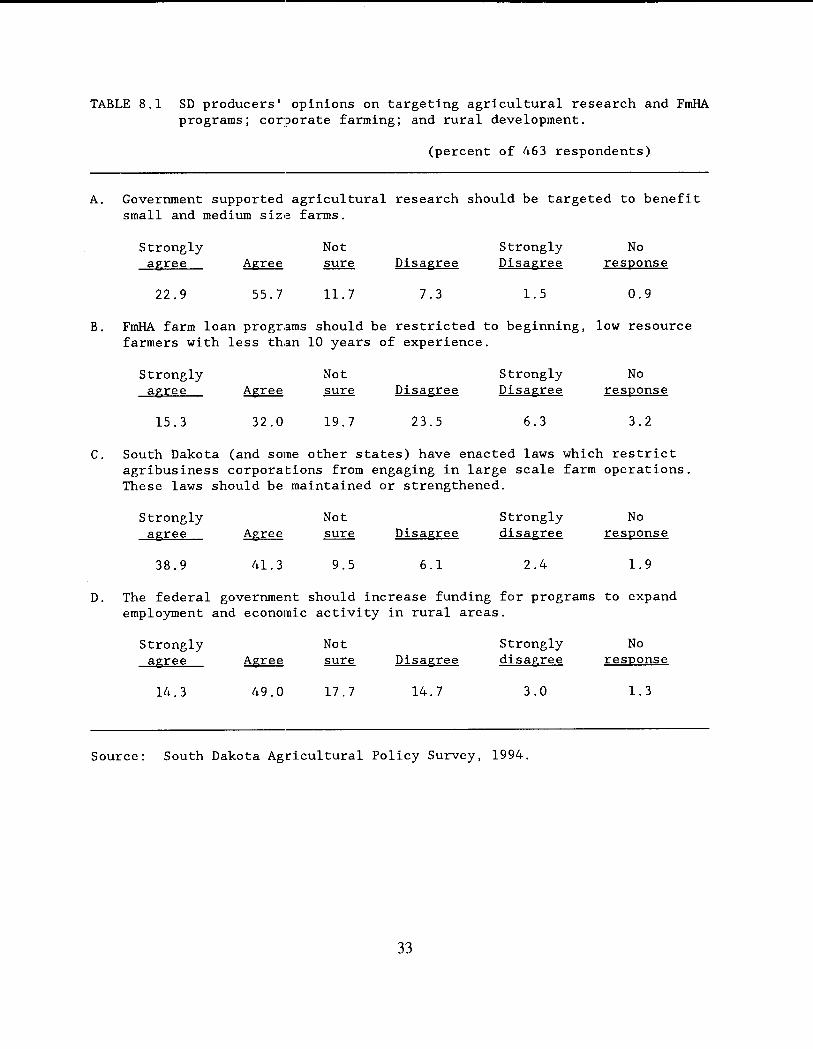
TABLE 8.1 SD producers' op1n1ons on targeting agricultural research and FmHA programs; corporate farming; and rural development.
(percent of 463 respondents)
A. Government supported agricultural research should be targeted to benefit small and medium size farms.
Strongly Not Strongly No agree Agree sure Disagree Disagree response
22.9 55.7 11. 7 7.3 1. 5 0.9
B. FmHA farm loan programs should be restricted to beginning, low resource farmers with less than 10 years of experience.
Strongly Not Strongly No agree Agree sure Disagree Disagree response
15.3 32.0 19.7 23.5 6.3 3.2
C. South Dakota (and some other states) have enacted laws which restrict agribusiness corporations from engaging in large scale farm operations. These laws should be maintained or strengthened.
Strongly Not Strongly No agree Agree sure Disagree disagree response
38.9 41. 3 9.5 6.1 2 .4 1. 9
D. The federal government should increase funding for programs to expand employment and economic activity in rural areas.
Strongly Not Strongly No agree Agree sure Disagree disagree response
14.3 49.0 17.7 14.7 3.0 1. 3
Source: South Dakota Agricultural Policy Survey, 1994.
33

Among respondents under 35 years old, support for the restrictions on the FmHA farm programs was stronger. Nevertheless, among all age groups, more respondents favored than opposed these restrictions, and the responses did not significantly vary across size nor type of farms.
Laws to Restrict Agribusiness Corporations South Dakota and some other states have enacted laws which restrict agribusiness corporations from engaging in large scale farm operations. Farmers and ranchers in South Dakota were asked if they favor the maintenance or strengthening of these laws. Four-fifths of respondents were in favor of maintaining or strengthening these laws, one-tenth were against, and another one-tenth were not sure or did not respond (Table 8.1).
Rural Economic Development Respondents were asked whether the federal government should increase funding for programs to expand employment activity in rural areas. Among all respondents from South Dakota, 63 percent agreed, 18 percent disagreed, and 19 percent were not sure or did not respond (Table 8.1).
From a list of ten possible needs, respondents were asked to select the three most important needs for rural development in South Dakota. The ranking of these needs by all respondents was as follows:
Business development More support for public education New or improved roads Improved health care facilities Public training to improve workers' skills More law enforcement and crime prevention New or improved bridges New or improved sewage plants others/no response
Percent of 463 respondents
61 49 46 33 31 21 16 4
12
Business development, more support for public education, and need for improved roads were identified as the top three rural development needs by the respondents. Sixty-one percent of respondents think business development is one of the top three rural development priorities in South Dakota. Comparison of responses from South Dakota with responses from all 15 states (which participated in the survey) reveals two basic differences. First, business development ranks as the primary need in both cases, but this need is perceived more strongly in South Dakota. Business development was identified as one of the three top needs by 61 percent of respondents from South Dakota (as compared to 47 percent of respondents from all 15 states). Second, the need for more law enforcement and crime prevention ranked sixth among the respondents from South Dakota, whereas it ranked fourth among the respondents in all 15 states. Law enforcement and crime prevention was
34

TABLE 8.2 SD producers' opinions on biotechnology and subsidies on plant based fuels.
(percent of 463 respondents)
A. Biotechnology (the use of living organisms, plants, animals, and microbes to develop different traits in plants, livestock and poultry) will be beneficial for producers.
Strongly Not Strongly No agree Agree sure Disagree disagree response
9.7 50.8 27.2 8.2 2.2 1. 9
B. Agricultural biotechnology will be beneficial for consumers.
Strongly Not Strongly No agree Agree sure Disagree disagree response
9.7 52.5 26.8 7.6 1. 5 1. 9
C. Tax money should be used to subsidize fuels developed from plants (ethanol and soy diesel).
Strongly Not Strongly No agree Agree sure Disagree disagree response
17.7 49.7 19.4 10.4 1. 9 0.9
D. Federal and state subsidies to ethanol producers should be maintained at their present levels or increased.
Strongly Not Strongly No agree Agree sure Disagree disagree response
27.7 49.2 14.3 5.0 1. 5 2.4
Source: South Dakota Agricultural Policy Survey, 1994.
35

identified as one of the three most important development needs by 21 percent of respondents in South Dakota as compared. to 40 percent of respondents from all 15 states.
Biotechnology Biotechnology refers to the use of living organisms, plants, animals, and microbes to develop different traits in plants, livestock, and poultry. A majority of respondents believe that biotechnology will benefit producers as well as consumers. When asked if they believed that biotechnology will be beneficial for producers, 61 percent of respondents said they do, 10 percent said they do not think so, and 29 percent were not sure or did not respond (Table 8.2). When asked if they believed that biotechnology will be beneficial to consumers, 62 percent respondents said they do, 9 percent said they don't think so, and 28 percent were not sure or didn't respond (Table: 8.2). Respondents who have most confidence in biotechnology as to benefiting producers as well as consumers, are under 50 years old and have attended some college or technical school.
Subsidizing Plant-Based Fuels With an increased emphasis on clean air, plant-based fuels have become a major policy issue. Should tax money be used to subsidize fuels like ethanol and soy diesel developed from plants. A two-thirds of all respondents favored it, one-tenth opposed it, and two-thirds were not sure or did not respond (Table 8.2). Respondents who produce grain and soybeans and are under 50 years old are strong proponents of subsidies for plant-base fuels. More than three-quarters of respondents were in favor of at least maintaining the federal and state subsidies to ethanol producers at their present levels (Table 8.2).
36

References
Allen, Kristen. 1990. "Reflections on the Past, Challenges for the Future: An Examination of U.S. Agricultural Policy Goals," in Kristen Allen, ed., Agricultural Policies in a New Decade (Washington, D.C., Resources for the Future). pp. 3-23.
Browne, William P. 1988. "The Fragmented and Meandering Politics of Agriculture," in M. Ann Tutwiler, ed., U.S. Agriculture in a Global Setting: An Agenda for the Future (Washington, D.C., Resources for the Future). pp. 136-53.
Guither, Harold and others. ]Farmers Preferences for Agricultural and Food Policy in the 1995. North Central Regional Research/Extension Publication, Forthcoming, 1994.
Janssen, Larry. 1989. Agricultural and Food Policy Decisions: A 1989 Perspective from South Dakota's Agricultural :Producers, Economics Research Report 89-4, South Dakota State University, September.
Janssen, Larry and Mark Edelman. 1985. Agricultural Policy Decisions: A 1984 Perspective from South Dakota's Farmers and Ranchers, Economics Research Report 85-1, South Dakota State University, September.
Knutson, Ronald, J.B. Penn, and William T. Boehm. 1990. Agricultural & Food Policy., Second Ed., Prentice Hall, Englewood Cliffs, New Jersey
Pederaza, Juan Miguel, 1994. The End of an Era. With Revised Federal Insurance Plan Debate on the '95 Farm Bill has Begun. AGWEEK, October 24, p. 12.
USDA. 1994. Wheat Situation and Outlook Report, Washington D.C., ERS/WHS-308, October.
___ . 1994. Economic Indicators of the Farm Sector: National Financial Summary, 1992, ECIFS 12-1, Washington D.C., ERS, January.
1994. Feed Situation and Outlook Report, Washington D.C., ERS/FDS-329, May.
1993. Agricultural Statistics, Washington D.C., ERS.
37

Appendix-A Profile of Survey Respondents in South Dakota
To gain some insight into respondent characteristics, the questionnaire included a number of questions about the producers:, their farm operations and participation in farm programs and farm organizations. The survey included South Dakota farmers of varying age groups, income levels, and types of farm operation. A majority of respondents were 35-64 years old, with at least a high school diploma, and operated medium sized farms with an annual gross sales of $40,000 to $249,999, and owned morn than 50 percent of the land they farmed. Among all respondents, 43 percent reported that they belonged to at least one farm commodity group, and 30 percent belonged to more than one farm organization. A majority of respondents (57 percent) participated in feed grain programs. Forty one percent of respondents participated in both the farmer owned reserve program and wheat program, and 21 percent participated in the conservation reserve program. These characteristics of the respondents from South Dakota are listed in Tables A-1 through A-4, and are discussed below.
Age The sample included farmers and ranchers in all age groups. Among all respondents from South Dakota, 52 percent were between 35 and 65 years of age, 11 percent were under 35 years old, and 21 percent were 65 years or older. Respondents from eastern South Dakota were relatively younger (Table A-Jl).
Years of School Completed The sample included farmers and ranchers with varying levels of formal education. Of all respondents in South Dakota, 19 percent had completed a college degree, another 25 percent had attended some college or technical school beyond high school, and 40 percent earned a high school diploma {Table A-1). Respondents from western part of the state completed, on an average, fewer years of formal school education. For example, 22 percent of respondents from western South Dakota as compared to 13 percent of their counterparts from eastern South Dakota have not earned a high school diploma (Table A-1).
Proportion of Land Owned Among all respondents, 44 percent owned more than 75 percent of the land they farmed, and 8 percent did not own any land. Respondents from western South Dakota reported owning a relatively higher proportion of the land they farm (Table A-1).
Annual Gross Sales Respondents operated farms of all sales classes from under $40,000 to $500,000 or more. Thirty one percent of respondents reported their annual gross farm sales as less than $40,000, fifty-eight percent reported their sales as between $40,000 and $250,000, and eight percent reported their sales above $250,000 (Table A-2). Respondents from western South Dakota, on average, reported lower annual gross sales compared to their counterparts from eastern South
A-1
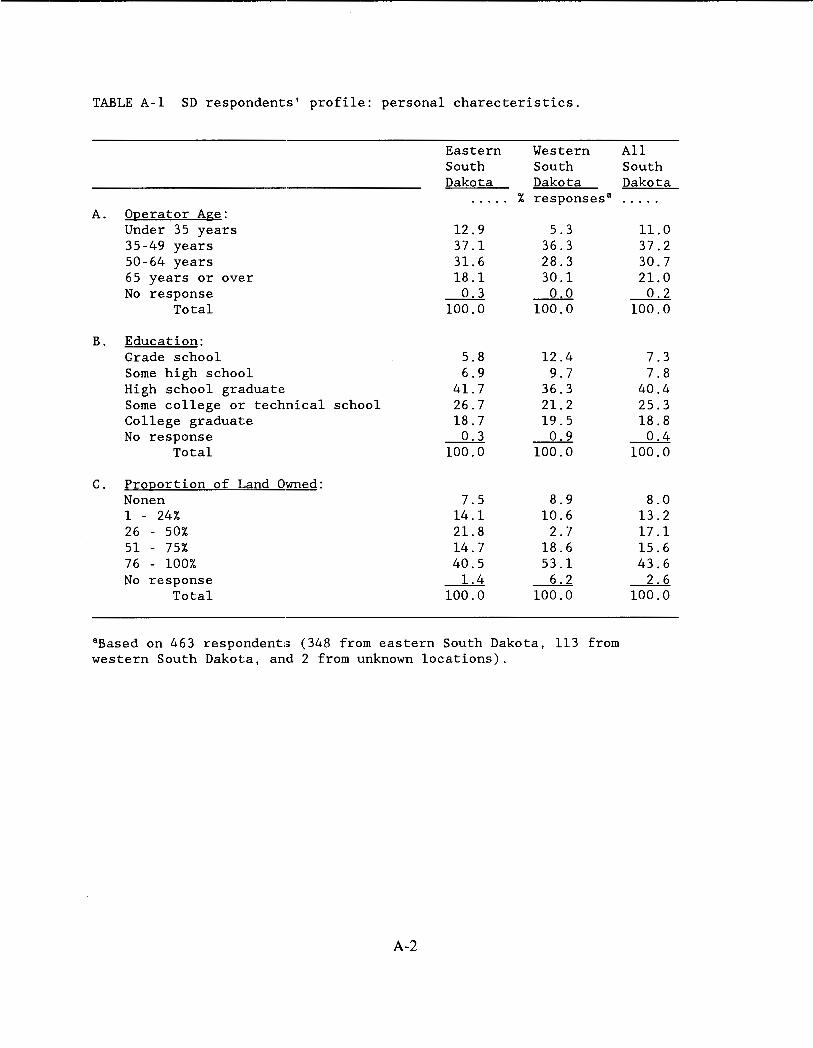
TABLE A-1 SD respondents' profile: personal charecteristics.
Eastern Western South South Dakota Dakota
% responses 8
A. 012erator Age: Under 35 years 12.9 5.3 35-49 years 37.1 36.3 50-64 years 31. 6 28.3 65 years or over 18.1 30.1 No response __Q.:.1 _Q_,_Q
Total 100.0 100.0
B. Education: Grade school 5.8 12.4 Some high school 6.9 9.7 High school graduate 41. 7 36.3 Some college or technical school 26.7 21. 2 College graduate 18.7 19.5 No response __Q.:.1 _JLl
Total 100.0 100.0
c. Pro12ortion of Land Owned: Nonen 7.5 8.9 1 - 24% 14.1 10.6 26 - 50% 21. 8 2.7 51 - 75% 14.7 18.6 76 - 100% 40.5 53.1 No response _Ll ___Q__,_2_
Total 100.0 100.0
8 Based on 463 respondents (348 from eastern South Dakota, 113 from western South Dakota, and 2 from unknown locations).
A-2
All South Dakota
11.0 37.2 30.7 21.0
___Q..2 100.0
7.3 7.8
40.4 25.3 18.8 ~ 100.0
8.0 13.2 17.1 15.6 43.6
---2....-2. 100.0

Dakota (Table A-2).
Income from Off-Farm Employment Off-farm employment by farmers or their family members is an important source of income to many farm families. Thirty percent of respondents reported that their family income from offfarm employment is under $10,000, 14 percent reported from $10,000 to $19,999, another 21 percent reported $20,000 or more, and 36 percent of respondents did not answer this question. There appears to be more inequality in off-farm employment income in the western South Dakota (Table A-2).
Primary Source of 1993 Farm Income Livestock (hogs, beef, or she<:~) was reported as the most important source of 1993 farm income in South Dakota. Among all respondents from South Dakota, 37 percent reported hogs, beef, or sheep as their most important source of income, 26 percent reported grain, 21 percent reported mixed grain and livestock, 5 percent reported dairy, and 9 percent reported other enterprises as their most important source of 1993 farm income (Table A-2).
In western South Dakota, livestock was reported as the most significant source of income by 46 percent of respondents, followed by mixed grain and livestock by 18 percent of respondents (Table B-2). Livestock was also indicated as the most important source of farm income in eastern South Dakota (by 33 percent of respondents) closely followed by grain (by 30 percent of respondents) and mixed grain and livestock (reported by 22 percent of respondents) (Table A-2).
Forty seven percent of South Dakota farmers and ranchers who participated in the survey reported that most of their total farm cash receipts in 1993 came from sales of livestock and livestock (including dairy) products (Table A-2). In the case of western South Dakota, 56 percent of respondents reported receiving most of their farm cash receipts from sale of livestock and livestock products (Table A-2).
Participation in the 1993 Farm Program Of all the respondents from South Dakota, 57 percent participated in the 1993 feed-grain program, 41 percent in the wheat program, 21 percent on the conservation program, 10 percent in the wool/mohair program, and 4 percent in the farmers owned reserve program. In addition, 42 percent of all respondents from South Dakota benefitted from 1993 disaster program, 4 percent benefitted from otht~r federal programs, and 15 percent did not participate in any program (Table A-3).
A relatively higher proportion of respondents in eastern South Dakota reported receiving benefits from the wheat program (43%), feed grain program (68%), and conservation reserve program (22%), as well as the 1993 disaster program (51 %) (Table A-3). A relatively higher proportion of respondents from western South Dakota (32 % as compared to 9% for respondents from eastern South Dakota) did not report receiving any benefits under these programs (Table A-3). It may be pointed out that some of the ranchers in western South Dakota do benefit from
A-3

TABLE A-2 SD respondents' profile: income characteristics.
Eastern Western South South Dakota Dakota
% responses 8
A. Gross Farm Sales: Under $40,000 27.9 40.7 $40,000 - 99,999 32.8 28.3 $100,000 - 249,999 27.0 23.9 $250,000 - 499,999 6.9 3.5 $500,000 or more 2.6 0.9 No response ___L_2 _L]_
Total 100.0 100.0
B. Off Farm Em2loyment Income of Family: Under $10,000 26.7 38.9 $10,000 - 19,999 15.5 8.0 $20,000 - 39,999 15.8 8.9 $40,000 or more 5.8 8.9 No response _J_Ll ~
Total 100.0 100.0
c. Princi2al Enter2rise: Grain 29.6 13. 3 Hogs, Beef, & Sheep 33.3 46.0 Mixed grain & livestock 22.1 18.6 Dairy 6.0 0.0 Other 6.3 16.8 No response --2_,_§_ ---2.J
Total 100.0 100.0
D. Income Form Livestock: None 18.4 20.4 1 - 25% 13. 8 8.9 26 - 50% 22.7 12.4 51 - 75% 25.9 18.6 76 - 100% 18.4 37.2 No response 0.9 2.7
Total 100.0 100.0
8 Based on 463 respondents (348 from eastern South Dakota, 113 from western South Dakota, and 2 from unknown locations).A.
A-4
All South Dakota
31.1 31. 8 26.1 6.1 2.2 ~ 100.0
29.8 13. 8 14.0
6.5 -1Ll 100.0
25.7 36.5 21. 2 4.5 8.9 3.2
100.0
19.0 12.5 20.1 24.2 22.9
1. 3 100.0

TABLE A-3 SD respondents' profile: participation in programs and organizations.
A. Benefitted from: Wheat Program Feed Grain Program Conservation Reserve Program Wool/Mohair Program Farmer Owned Reserve Program 1993 Disaster Progrrun Other Programs No Program (Non Participants)
B. Membership in: A Farm Organization A Commodity Organization More than One Organi:zation At Least One Organization No Organization (Including No Response)
C. Membership in Farm Organization: National Farmers Union American Farm Bureau National Farm Organi:zation Grange American Agricultural Movement
D. Membership in Commodity Organization: Wheat Growers Association Corn Growers Association Soybean Association Grain Sorghum Growers Association Cattlemen's Association Pork Producers Association Milk Producers Association
Eastern South Dakota
43.1 67.5 21. 8
9.5 5.2
50.6 2.9 8.6
40.5 46.0 33.9 68.4 31. 6
28.5 13.2
3.7 0.0 0.0
11.2 8.3
19.5 0.3
11.2 12.9
5.8
Western South Dakota
% responses 8
35.4 24.8 20.4 10.6 0.9
13.3 5.3
31. 9
32.7 36.3 19.5 59.3 40.7
15.9 16.8 1. 8 0.9 0.0
13.3 1. 8 0.0 0.0
22.1 2.7 0.9
8 Based on 463 respondents (348 from eastern South Dakota, 113 from western South Dakota, and 2 from unknown location).
A-5
All South Dakota
41.0 57.0 21.4 9.7 4.1
41. 5 3.5
14.5
38.4 43.4 30.2 66.1 33.9
25.3 14.0
3.2 0.2 0.0
11. 7 6.7
14.7 0.2
13.8 10.4 4. 5
grazing on public lands which was not asked in the questionnare.
Membership in Farm and Commodity Organizations Of all respondents in South Dakota, 38 percent indicated a membership in a farm organization, 43 percent in a commodity organization, and 30 percent in more than one organization (Table A-3). About two-thirds of all respondents in South Dakota reported to be affiliated with at least one farm/commodity organization (Table A-3). Of all respondents, 25 percent claimed membership in the Farmers Union, and 14 percent in the Farm Bureau (Table A-3). The Farmers Union seems to be more popular in eastern South Dakota while both the Farmers Union and Farm Bureau are equally popular in western South Dakota (Table A-3).
A-6
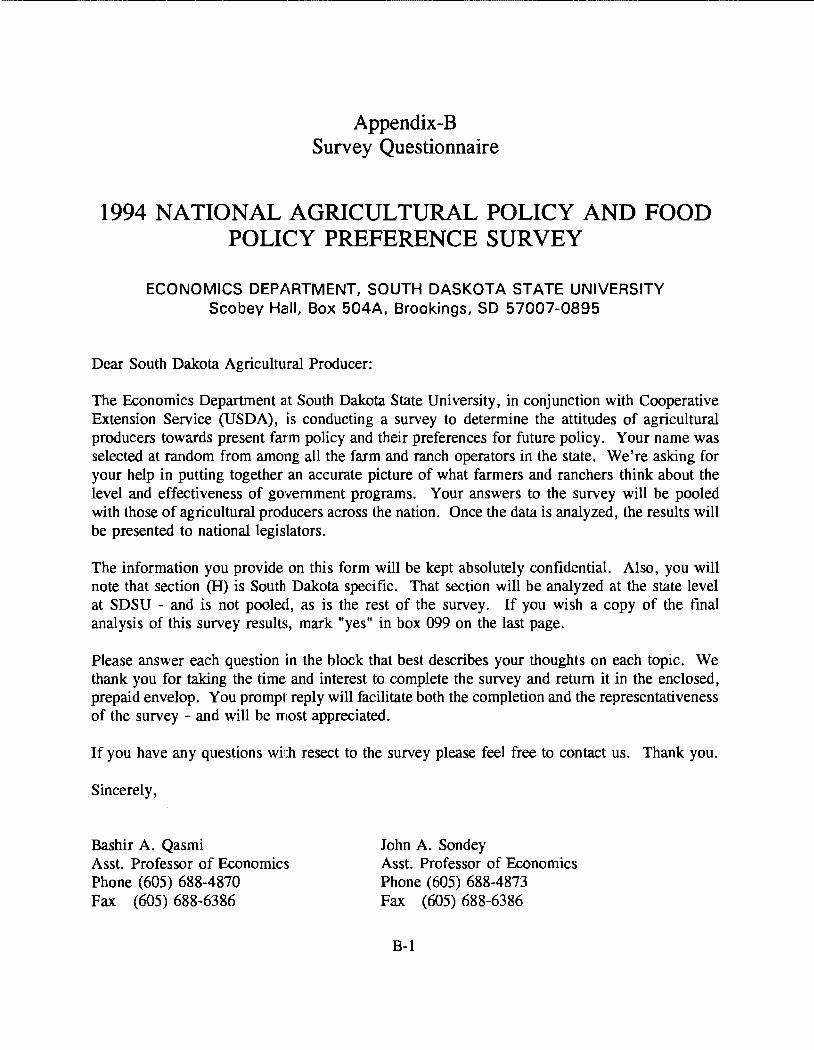
Appendix-B Survey Questionnaire
1994 NATIONAL AGRICULTURAL POLICY AND FOOD POLICY PREFERENCE SURVEY
ECONOMICS DEPARTMENT, SOUTH DASKOTA STATE UNIVERSITY Scobey Hc:lll, Box 504A, Brookings, SD 57007-0895
Dear South Dakota Agricultural Producer:
The Economics Department at South Dakota State University, in conjunction with Cooperative Extension Service (USDA), is conducting a survey to determine the attitudes of agricultural producers towards present farm policy and their preferences for future policy. Your name was selected at random from among all the farm and ranch operators in the state. We're asking for your help in putting together an accurate picture of what farmers and ranchers think about the level and effectiveness of government programs. Your answers to the survey will be pooled with those of agricultural producers across the nation. Once the data is analyzed, the results will be presented to national legislators.
The information you provide on this form will be kept absolutely confidential. Also, you will note that section (H) is South Dakota specific. That section will be analyzed at the state level at SDSU - and is not pooled, as is the rest of the survey. If you wish a copy of the final analysis of this survey results, mark "yes" in box 099 on the last page.
Please answer each question in the block that best describes your thoughts on each topic. We thank you for taking the time and interest to complete the survey and return it in the enclosed, prepaid envelop. You prompt reply will facilitate both the completion and the representativeness of the survey - and will be most appreciated.
If you have any questions wi1th resect to the survey please feel free to contact us. Thank you.
Sincerely,
Bashir A. Qasmi Asst. Professor of Economics Phone (605) 688-4870 Fax (605) 688-6386
John A. Sondey Asst. Professor of Economics Phone (605) 688-4873 Fax (605) 688-6386
B-1

SEC 1lON A- FARM COMMODITY PROGRAMS 1. What should be the policy toward nrnduction ccmtrois and
associated price supports after the 1990 Food, i!t,griculture, Conservation and Trade Act (1990 Farm Bill) expires in (Check one)
I~~ I l a. Keep the present program . . . . • . . . . . . .
b. Establish a mandatory supply control program with all farmers required to participate atter approved In a relerendum . . . . . . .
c.
d.
Separate government payments from production requirements. (Sometimes called decoupling) . . . . . . . . . . .
Gradually eliminate all commodity programs including set aside, price support, deficiency payments and government storage programs
D D
.. .. D 2. What should be the policy toward target prices? (Check one)
a. Keep target prices at the current levels . . .
b. Raise target prices each year to match the rate of inflation . . . . . . . . . . . . . . . . . . . .
c. Lower target prices by some percent each year to reduce federal deficiency payments and fedora! expenditures and to discourage production • .
d. Phase out target prices completely over a 5 to 1 O year period . . . . . . . . • • . . . . . . . •
D D D D
3. \Nhat should be our commodity loan rate policy? (Check one) a. Base Joan rate on the average of market
prices to keep prices competitive ....
b. Raise loan rates as a primary means to support prices ...•...........
c. Eliminate loan rates and commodity loans completely . . . . . . . . . . . . . . . . .
4. II further spending cuts must be made in farm commodity programs, which would you preler?
(Check one!
a. Reduce target prices and deficiency payments.
b. Reduce the number of payment acres (Increase flex acres) . . ......... .
c. Make payments only to small and medium size farms ................ .
d. Make payments based on financial need ...... .
5. Farmers should be permitted to plant more flexible non-payment acres in any year and still retain the historic acreage bases for their program crops.
Sirongty Agree
B-2
6. Some form of farmer-owned grain reserve (FOR) with national minimum and maximum amounts to be stored should be continued.
7.
8.
S11ongly ~ !"E'l r:=-i Strongly Agree ~ LJ L::::J Disagree
A Farm Bill Study Team has proposed that the 1995 farm bill Include an income safety net through a revenue assurance program in which each producer is assured 70 percent of normal crop revenue. The proposed program would eliminate target prices, acreage reduction programs, federal crop Insurance and disastF!r assistance, allow producers to plant whatever crops in any amount they desire, and maintain non-recourse commodity loans and grain reserves. Do you agree or disagree with this proposal?
suongly ~ !"El r=::::l S11ongly Agree L.J LJ L:::J Disagree
The dairy program should be financed by milk producer assessments and administered through a producer marketing board with the power to control production.
Slrong1y Disagree
SECTION B~CONSERVATION, ENVIRONMENT, ANO WATER QUALITY PROGRAMS 1. The Conservation Reserve Program (CAP) was established m 1985
with 10 year contracts to protect highly erodible land with cover crops. What should be the policy when these contracts begin to expire in 19967 The government should: (Cheek one)
a.
b.
Offer to extend all contracts for several years at the current payment rate per acre . . . .
Otter to extend some contracts on the most erodible acres with new bids . . . . . . . . .
D D
c. Discontinue this program . . . . . . . . • . . . . . . D d. Replace CAP with conservation and water D
quality program incentive payments. . ....... .
2. To be eligible for farm program benefits, farmers are required to implement approved conservation plans by January 1, 1005. This
':7;~'"T==m1r~t n:: I ~= 3. Water quality has become a major concern. Government should
regulate specified farming practices and land uses to reduce pollution of underground and stream water.
sx~~ B I ;u~ 11 ~ses·· I ~~!

4.
5.
6.
7.
8.
To protect water quality, all farmers should b'e required to plant grass protection strips along stream banks and in waterways.
Strongly Agree EJ I ~u~~ 11 Disagree I
S1rongly Disagree
Farmers should be compensated for planting grass protective strips along stream banks and in waterways.
Stronaly ~ ~ r:::l Strongly Agree L=.J LJ L::J Disagree
VVhen government regulations reduce the val:ue of farm o·:::;:-:11y, the owner should be compensated for this lo:ss.
Strongly ~ ~ r:::l .-S-tr-o-ng-ly---.
Agree L:J LJ LJ D<Segree
How does the amount (active ingredient) per acre of agricultural pesticides you are using compare with five yHars ago?
1::-1~~ rE:l L=.J LJ L::J 0 Farmers should be required to keep application records on their use of all agricultural pesticides.
Sl~~~ly EJ I ~u~~ 11 Drsagree I S1rongly Disagree
9. Farmers should not be permitted to drain we•:lands and plant crops on these lands.
Strongly ~ ~ r:::l Strongly Agree L:J LJ LJ Disagree
SECTION C - DISASTER ASSISTANCE
1.
2.
Major droughts and floods show the high risl<s farmers face. Should the government protect farmers from such disasters?
a.
b.
c.
d.
(Check one)
D Yes. Let Congress decide each year about disaster aid programs ................. .
Yes. Develop a permanent disaster program for losses D that exceed 50 percent and encourage farmers to buy additional protection by using private crop insurance
Yes. Set up a mandatory crop insurance program for all farmers as a condition of eligibility for additional disaster payments .................. .
No. Let farmers buy private crop insurance if they want protection and get the government out of crop insurance and special disaster assistancl!
D D
If the government were to otter a subsidized o:rop insurance program and no disaster o~::::;;~am, which type of program would you prefer?
a.
b.
Let farmers buy crop insurance on a voluntary basis, paying for coverage based on theiic individual farm yields ............. .
Let farmers buy crop insurance on a voluntary basis, but offer lower premiums by basing premiums on county average yields with no pay-off unless county yields drop more than some specified percent .
(Check one)
D D
c. Require all farmers to buy crop insurance' . . . . . . . D B-3
SECTION D - INTERNATIONAL TRADE 1. Beyond the current NAFTA and GATT agreements, the U.S.
should continue to vigorously negotiate multilateral and bilateral arrangements to further reduce trade barriers.
3.
4.
The U.S. should continue to subsidize export sales of agricultural products.
~ ~ IE! r:::l ~ L_J L:J LJ L::.J LJ The United States should subsidize exports of value added products (such as meat, flour, and similar processed commodities) rather than bulk commodities.
Strongly Agree EJ I ~~. 11 ~ugree I
Strongly Disagree
The U.S. should continue to decrease Its funding of foreign food aid.
~~IEIEJ L_J L:J LJ Dbagree
Strongly DisagrH
SECTION E - FOOD AID 1. Food stamps and other food programs take more than half of the
U.S. Department of Agriculture budget. Food programs should be shifted to cash grants and let states distribute the funds.
2.
Strongly Agree
Strongly Disagree
Food stamps should be distributed only to the elderly and families with children which have incomes below poverty levels.
Strongly Agree
Strongly Dloagree
SECTION F - FOOD SAFETY 1. All meat and meat products sold at retail should carry instructions
for proper storage and cooking.
2.
3.
Strongly Agree
Strongly Disagree
Food inspections should be strengthened to insure safer and better quality foods.
Strongly Agree
Strongly Disagree
Imported food and beverages now meet the same safety requirements as domestic products.
Strongly Agree
Slronoly Disagree

SECTION G - FOOD AND NUTRITION 1. Have you seen the USDA food pyramid with gL1idelines for
proper nutrition?
1a. If yes, do you think it is a useful educational tool?
2. Food labels should be required to contain morn diet and nutrition information.
Slrongly Ag tee Slrong!y
Oioagree
3. Do you read the food labels on the package to 'ind what the product contains?
B Occasionally EJ SECTION H· SOUTH DAKOTA QUESTIONS
1 . South Dakota (and some other states) have enacted laws which restrict agribusiness corporations from engaging in large scale farm operations. These laws should be maintained or strengthened.
2.
3.
~ r:=l rEl L_J L:J LJ
Slrongty OiNgfM
Federal and state subsidies to ethanol producers should be maintained at their present levels or incret1sed.
S11ongty Ag••• S1ron91y
Dia.agree
FmHA farm loan programs should be restricted to beginning, low resource farmers with less than 10 ye1ars of experience.
Slrongry Ag-too S1rongiy
D111agree
4. Farmers and ranchers in South Dakota are, generally, doing a responsible job of preserving the quality of the environment.
5.
6.
7.
8.
9.
B-4
Farm chemicals are becoming a serious threat to the environment in South Dakota.
Farm wastes are becoming a serious threat to the environment in South Dakota.
~ r:=l IE! L_J L:J LJ
Government regulatory activities intended to benefit society as a whole have imposed costs on individual property owners. Today, these private costs outweigh the social benefits.
~ LJ
A portion of the funds currently channeled to commodity support payments should be shifted to "green payments" to encourage "environment-friendly• farming practices.
imports of durum wheat from Canada have taken market share from domestic producers. U.S. should take steps to limit Canadian wheat exports to the United States even though Canada may retaliate against U.S. exports.

SECTION I • OTHER ISSUES ; a. 64otechnology (the use of living organisms, plants, animals,
and microbes to develop different traits Jn plants, livestock and poultry) will be beneficial tor producers.
~BI ~ 11~ugree11~=!1 ' ). i.Qricultural biotechnology will be beneficial for consumers.
2.
3.
4.
s.
S1rongty AgrH BI~ 11~Ng-1
Tax money should be used to subsidize fuels developed from plants (ethanol and soy diesel).
Strongty Agree B I :u~. 11 ~sag· .. I ~~?!
Government supported agricultural research should be targeted to benefit small and medium sized larms.
Strongly Agree
s11ong1y 01sagr"
The federal government should Increase funding for programs to expand employment and economic activity In rural areas.
Strongry Agree B I ~u~~ 11 Oisa9ree I 5)=•~
Check the 3 most important needs for economic development in your area from the following list:
a. More support for D public education
b. New or improved D sewage plants
c.
d.
Business development
More law enforcement and crime prevention
!. Other
D D
e.
f.
g.
h.
New or D impmved roads
New or improved D bridges
Public training to D improve worker's skills
Jmpmved health care facilities D
SECTION J - PERSONAL DATA To hel;:i us group responses for farmers with similar operations, we would like to know more about you. {Check one) 1. Your age: D
Under 35 ... . 50. 64 D 35-49 ....... D 65orover ..... D
B-5
2.
3.
4.
5.
Approximate average annual gross sales Qncluding government payments) from your farm in recent years: (Check one) D Under $40,000 . . . $250,000 • $499,999
$40.000. $99.999 . D $100.000. $249.999 D
$500,000 plus . . .
D D
What percent of your total farm cash receipts in 1993 came from sales of livestock and livestock (including dairy and poultry) products? (Check one)
None ....
1-25% ....... .
26-50% ...... .
D D D
51-75% •.•.•..
76-100% ..... .
D D
'M'lat was the last year of school you completed? (Check one)
Grade school . . . .
Some high school .
Graduated from high school ........
D D D
Some college or technical school
Graduated from college .....
D .. D
If you or members of your !amity were employed off the farm, check the approximale amount of family Income In 1993 that came from off-farm employment: (Check one)
Under$10,000 .•. D $10.000. $19.999 . D
$20,000 • $39,999 .
$40,000 plus . . . .
.D
.o 6. What was your most important source of cash receipts in
1993? (Check one)
Grain ....•.•.
Dairy .......•.
Cotton ...•....
D D D
Hogs, Beef, or Sheep D Mixed Grain and Livestock .
Rice ...
.D ·D D
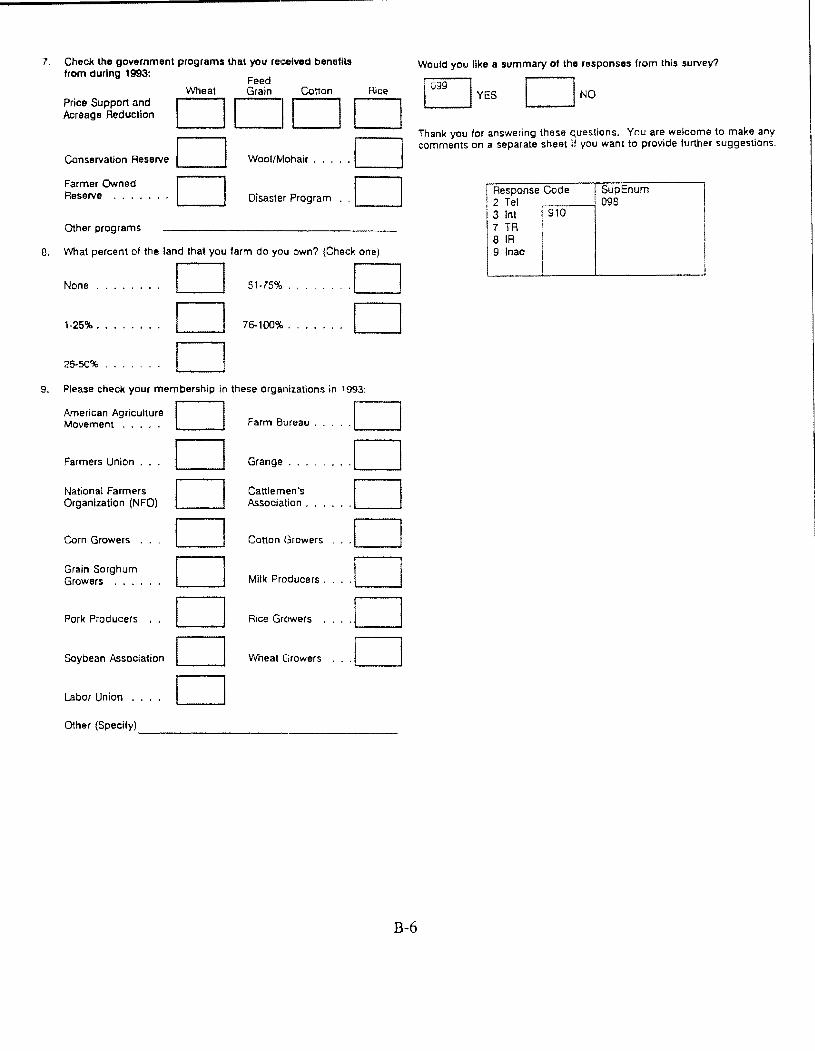
7.
8.
9.
Check the government programs that you re,celved benefits from during 1993: Feed
Price Support and Acreage Reduction
Wheat Grain Cotton Rice
DCIDD Conservation Reserve D Wool/Mohair .•... D Farmer Owned Reserve ....
Other programs
D Disaster Program .. D What percent of the land that you farm do you own? (Check one)
None . . . . . . . . D 51-75% ........ D 1-25% ••...••. D 76-100% ....... D 26-50% .... D Please check your membership In these organizations in 1993:
American Agriculture D Farm Bureau .... .o Movement .....
Farmers Union . . D Grange ... .o National Farmers D Cattlemen's .D Organization (NFO) Associat.ion .
Corn Growers D Cotton Growers .. .D Grain Sorghum D Milk Producers . . . . o Growers . ~ . .
Pork Producers . . D Rice Growers ... .o Soybean Association D Wheat Growers .. .o Labor Union .. D Other (Specify)
B-6
Would you like a summary of the responses from this survey?
[0991 L___j YES
Thank you for answering these questions. You are welcome to make any comments on a separate sheet if you want to provide further suggestions.
I Response Code I SupEnum , 2 Tel .------., 098
3 Int 910 7 TR 8 IA 9 lnac