agricultural productivity and its determinants in
TRANSCRIPT

61
Agricultural Productivity and its Determinants in Arunachal Pradesh: An Application of Cobb-Douglas type Production Function
Maila LamaAssistant Professor, Department of Economics, Rajiv Gandhi University, Rono Hills,
Itanagar.Email: [email protected]
AbstractThis paper examined the growth in agricultural productivity and its determinants in Arunachal Pradesh, a hilly State of North-East India. The study was based on both pri-mary and secondary data. Primary data were collected from 200 farming households by conducting field survey. The Cobb-Douglas type production function was applied to estimate the relationship between output and inputs. The function was estimated by using log-linear functional form. The study found very low growth in yield rates of major crops in the State, except paddy which was due to traditional method of cultivation and low level of use of modern inputs. The level of use of modern inputs by the surveyed farmers was very low. The results of the regression analysis showed that outputs of crops were responsive to both manure and fertilizer. Hence, the policy should focus on supplying and distributing modern inputs like high yielding variety of seeds and fertilizer to the farmers at subsidized rates, revitalize extension services and provide sufficient incentives to farm-ers and encourage them to diversify towards cash crops and provide market linkages to enhance farmers’ income.Keywords: Agriculture, productivity, Hills, determinants, Cobb-Douglas type production function, farm income.Introduction
Agriculture occupies an important place in Indian economy. It provides employ-ment to about half of the total work force (48.9 per cent) in the country (Economic Survey 2014-15). It acts as an important foreign exchange earner for the country accounting for about 12 per cent of the country’s export earnings. However, agricultural productivity in the country is low compared to other countries like China, Japan, Indonesia etc. The low productivity in India is attributed to limited spread of green revolution, uneconomic holdings, inadequate irrigation etc.
North Eastern Region of India comprises of eight States; Arunachal Pradesh, As-sam, Manipur, Meghalaya, Mizoram, Nagaland, Sikkim and Tripura. The region accounts
ISSN. 0972 - 8406The NEHU Journal Vol. XVI, No. 2, July - December 2018, pp. 61-73

62
for around 8 per cent of the country’s total geographical area. But almost two-third of the region is hilly Plains are mainly under Assam and some parts in other States (Agarwal, 1997). Agriculture is the main source of livelihood of majority of the people in the re-gion. In the hills cultivable land area is limited. So agricultural operations are carried out in narrow valleys and hill slopes. The percentage of operational area varies from 4.5 per cent in Arunachal Pradesh to 35.4 per cent in Assam as compared to 43.3 per cent at the national level. In the hills of North-East India traditional shifting cultivation is dominant activity (Dutta, 1997). The agricultural productivity is low due to poor irrigation and low intensity use of inputs (Barah, 2006).
Arunachal Pradesh, with an area of 83,743 sq. km, is the largest State of North East India in terms of area. It accounts for 2.64 per cent of the total geographical area of the Country. The topography of the State is hilly and mountainous owing to which arable land is very limited. Operational area in the State was only 4.59 per cent of its geograph-ical area (Agricultural Census, 2010-11). In this State 77.06 per cent of the people live in rural area and vast majority live on agriculture. As per 2011 census 58 per cent of its workforce was engaged in agriculture sector. However, the contribution of agriculture to Gross State Domestic Product (GSDP) has declined from about 40 per cent in 1990-91 to 17.77 per cent in 2014-15. This indicates low standard of living of rural people. Hence, there is a need to raise agriculture productivity for improving the living standard of vast majority of people who are dependent on agriculture for their livelihood.
Agricultural productivity depends on a number of factors. Therefore, it is im-portant to know that factors to which the output is more elastic. Many studies have been conducted to examine the determinants of agricultural output. For example, Dwivedi and Singh (2000) applied Cobb-Douglas type production function to examine resource struc-ture and resource productivity in wheat production in Agra district of Uttar Pradesh. The study found positive and significant elasticity of output in the case of manure, fertilizer and irrigation and negative in the case of labour and area. An inverse relationship was found between farm size and output. Suresh and Keshava (2006) examine resource pro-ductivity and technical efficiency of paddy production in Peechi Command Area of Thris-sur district in Kerala. The study was based on primary data collected from 71 farmers. The elasticity coefficients were found to be positive and significant for chemical fertiliz-ers, farmyard manure and human labour. The average technical efficiency was estimated to be 66.8 per cent. The technical efficiency was found to be positively affected by edu-
Maila Lama

63
cation of farmers and irrigation.In North-East India, only few studies (Roy, 1997; Barah, 2006) have been con-
ducted to assess the agrarian structure of hill agriculture in North East India. Most of stud-ies are based on secondary data and the study on determinants of productivity is limited. Hence, the present study was an attempt to fill the gap in knowledge. The study examined agricultural productivity and its determinants in Arunachal Pradesh. It also attempted to identify the various inputs used by the farmers in the hill agriculture and estimate the elasticity of output to with respect to inputs used in production. The study is expected to have important policy implications for development of agriculture in the State.ObjectivesThe study was conducted with the following objectives:
1. To analyse the trend and growth in productivity of different crops.2. To identify various inputs used in hill agriculture and to estimate the elasticity of
output with respect to inputs used.The Study Area
The study was conducted in two hilly districts of Arunachal Pradesh; West Kameng and Tawang. These districts are located in the western corner of the States and shares in-ternational border with China and Bhutan. The entire area is hilly and mountainous with elevation ranging from 1800 metres to 4000 metres and above. West Kameng district is spread over an area of 7422 sq. km. It accounts for 8.86 per cent of the total geographical area of the State. Tawang district has an area of 2172 sq. km accounts for 2.59 per cent of the State’s geographical areas. The total population of West Kameng district is 87013 persons (6.30 per cent of the total population of the State). It has low population density of only 12 persons per sq. km. Tawang district has total population of 49950 (3.61 per cent of total population of the State) with population density of 23 persons per sq. km (Census 2011). Together these two districts share 11.45 per cent of the State’s geographi-cal area and 9.91 per cent of the State’s total population. In these districts, 80 per cent of the people live in rural who are dependent on agriculture for their living. The important crops grown in the area are; paddy, wheat, maize, millet, potato, chilli. The arable land in these districts is very limited owing to hilly topography. Hence, it is important to raise productivity of crops to enhance income of farmers. Data Source and Methodology
The study was based on both primary data and secondary data. Secondary data
Agricultural Productivity and its Determinants in Arunachal Pradesh : An Application of Cobb-Douglas type Production Function
64
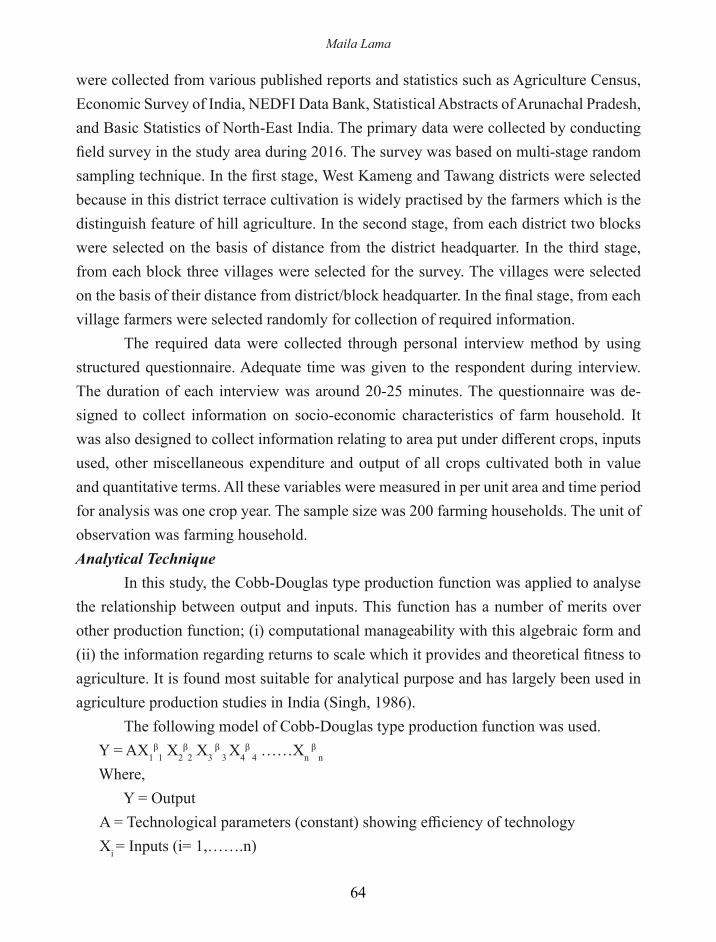
were collected from various published reports and statistics such as Agriculture Census, Economic Survey of India, NEDFI Data Bank, Statistical Abstracts of Arunachal Pradesh, and Basic Statistics of North-East India. The primary data were collected by conducting field survey in the study area during 2016. The survey was based on multi-stage random sampling technique. In the first stage, West Kameng and Tawang districts were selected because in this district terrace cultivation is widely practised by the farmers which is the distinguish feature of hill agriculture. In the second stage, from each district two blocks were selected on the basis of distance from the district headquarter. In the third stage, from each block three villages were selected for the survey. The villages were selected on the basis of their distance from district/block headquarter. In the final stage, from each village farmers were selected randomly for collection of required information.
The required data were collected through personal interview method by using structured questionnaire. Adequate time was given to the respondent during interview. The duration of each interview was around 20-25 minutes. The questionnaire was de-signed to collect information on socio-economic characteristics of farm household. It was also designed to collect information relating to area put under different crops, inputs used, other miscellaneous expenditure and output of all crops cultivated both in value and quantitative terms. All these variables were measured in per unit area and time period for analysis was one crop year. The sample size was 200 farming households. The unit of observation was farming household.Analytical Technique
In this study, the Cobb-Douglas type production function was applied to analyse the relationship between output and inputs. This function has a number of merits over other production function; (i) computational manageability with this algebraic form and (ii) the information regarding returns to scale which it provides and theoretical fitness to agriculture. It is found most suitable for analytical purpose and has largely been used in agriculture production studies in India (Singh, 1986).
The following model of Cobb-Douglas type production function was used. Y = AX1
β1 X2
β2 X3
β 3 X4
β 4 ……Xn
β n
Where, Y = Output
A = Technological parameters (constant) showing efficiency of technology Xi = Inputs (i= 1,…….n)
Maila Lama
65
βi = Elasticity of output with respect to ith input The log-linear functional form was used to estimate the above function which is specified as follows: LogY = Log A + β1X1 + β2X2 + β3X3 + ………+ βnXn
The coefficients (βi) of inputs show elasticity of output to ith input. The data were pro-cessed with the help of statistical packages like MS Excel and SPSS.Trend and Growth in Productivity of Major Crops
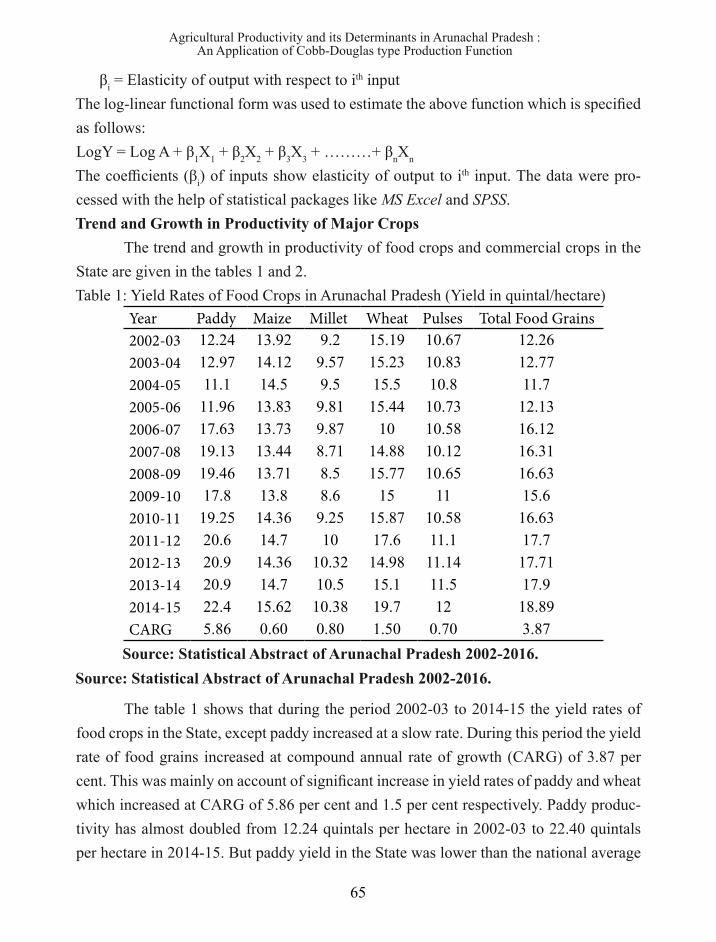
The trend and growth in productivity of food crops and commercial crops in the State are given in the tables 1 and 2. Table 1: Yield Rates of Food Crops in Arunachal Pradesh (Yield in quintal/hectare)
Source: Statistical Abstract of Arunachal Pradesh 2002-2016.
The table 1 shows that during the period 2002-03 to 2014-15 the yield rates of food crops in the State, except paddy increased at a slow rate. During this period the yield rate of food grains increased at compound annual rate of growth (CARG) of 3.87 per cent. This was mainly on account of significant increase in yield rates of paddy and wheat which increased at CARG of 5.86 per cent and 1.5 per cent respectively. Paddy produc-tivity has almost doubled from 12.24 quintals per hectare in 2002-03 to 22.40 quintals per hectare in 2014-15. But paddy yield in the State was lower than the national average
Year Paddy Maize Millet Wheat Pulses Total Food Grains2002-03 12.24 13.92 9.2 15.19 10.67 12.262003-04 12.97 14.12 9.57 15.23 10.83 12.772004-05 11.1 14.5 9.5 15.5 10.8 11.72005-06 11.96 13.83 9.81 15.44 10.73 12.132006-07 17.63 13.73 9.87 10 10.58 16.122007-08 19.13 13.44 8.71 14.88 10.12 16.312008-09 19.46 13.71 8.5 15.77 10.65 16.632009-10 17.8 13.8 8.6 15 11 15.62010-11 19.25 14.36 9.25 15.87 10.58 16.632011-12 20.6 14.7 10 17.6 11.1 17.72012-13 20.9 14.36 10.32 14.98 11.14 17.712013-14 20.9 14.7 10.5 15.1 11.5 17.92014-15 22.4 15.62 10.38 19.7 12 18.89CARG 5.86 0.60 0.80 1.50 0.70 3.87
Source: Statistical Abstract of Arunachal Pradesh 2002-2016.
Agricultural Productivity and its Determinants in Arunachal Pradesh : An Application of Cobb-Douglas type Production Function

66
of 35 quintals per hectare. The yield rates of other food crops were much lower than the national average. This is due to very low growth in their yield rates during the period under review (table 1). The yield rate of maize in the State was 15.62 quintal per hectare in 2014-15 which was muchlower than the national average of 26.32 quintals per hectare.
Table 2: Yield Rates of Commercial Crops in Arunachal Pradesh (Yield in quintal/hectare)
Source: Statistical Abstract of Arunachal Pradesh 2002-2016The table 2 shows the trend and growth in yield rates of commercial crops in
the State. It shows that during the period 2002-03 there were large disparity in growth of yield rates of commercial crops. Among the various crops, yield rates of chilli and turmeric grew at faster rate. While the chilli yield rate grew at CARG of 5.55 per cent, the yield rate of turmeric grew at 2.43 per cent. During the same period, the yield rate of potato grew at CARG of 1.71 per cent. However, the growth in yield rates of oilseeds, ginger and sugarcane were very low (table2). The yield rate of chilli has nearly doubled from 14.58 quintals in 2002-03 to 28.20 quin-tals per hectare in 2014-15. The yield rate of turmeric has increased from 39.3 quintals per hectare to 48.3 quintals per hectare in 2014-15. During the same period yield rate of potato improved from 69.63 quintals per hectare in 2002-03 to 82.5 quintals per hectare in 2014-15. The yield rates of most of the commercial crops were in the State were found lower than
Year Oilseed Potato Ginger Turmeric Chilli Sugarcane2002-03 10.47 69.63 72.69 39.3 14.58 191.532003-04 10.16 73.52 79.44 34.16 14.67 205.282004-05 9.7 65.3 73.9 35.5 13.7 1922005-06 8.6 75.29 69.23 38.2 12.2 191.472006-07 9.1 79.92 73.42 36.94 14.34 163.522007-08 9.3 75.91 75.19 35.38 15.32 176.432008-09 9.76 82.22 74.85 38.81 17.07 171.092009-10 9.8 86.1 77.6 40.8 16.8 183.92010-11 9.18 82.67 79.29 44.5 16.43 192.142011-12 10.15 86.95 79.41 44.8 17.2 193.552012-13 9.55 80.7 81.79 41.39 19.53 197.072013-14 9.6 82.4 80.3 46.9 27.1 195.72014-15 9.7 82.5 75 48.3 28.2 195CARG 0.10 1.71 0.60 2.43 5.55 0.20
Maila Lama

67
the national average. For example, the yield rate of potato in the State was 82.5 quintals per hectare which was much lower than the national average of 231.26 quintals per hect-are. In the same year, yield rate of sugarcane in the State was 195 quintals per hectare which was far below the national average of 715.12 quintals per hectare (Agricultural Statistics 2016). Results and Discussion Socio-economic Characteristics of Surveyed Farmers
In agricultural production analysis, the study of socio-economic characteristics is important for two reasons. First, it indicates the level of well-being of farm households. Second, the production decision of farming households relating to allocation of acreage to crops, amount of labour use etc. depend of household characteristics. Chayanov in his model of farm household argued that demographic characteristic (consumer-worker ra-tio) is an important factor determining the amount of labour to be committed to farm work by a peasant farm household. The amount of labour time devoted to farm work is directly related to this ratio (Thorner et. al., 1966). Mellor (1966) in his theory of agriculture de-velopment argued that farmers with small size of holdings will have to push labour use up to the point where its marginal productivity is equal to zero for their subsistence. But the farmers with large size of holdings have option to choose between farm work and leisure because of their higher incomes.The socio-economic characteristics of the surveyed farm householdsare given in the table 3.
Table 3: Socio-economic Characteristics of Surveyed HouseholdsSource: Field Survey, 2016
Particulars Percentage of respondentAge (in years)18-29 4.030-49 5650 and above 40
Agricultural Productivity and its Determinants in Arunachal Pradesh : An Application of Cobb-Douglas type Production Function

68
The table 3 shows that most of the farmers were in the middle age group of 30-49 years. The mean age of the respondents was estimated to be 47.50 years. Educational lev-el of the surveyed respondent farmers indicated that majority of them were illiterate (77 per cent) and 17 per cent of them were having primary level education. Only few of them were educated up to secondary and higher secondary level. Household size of majority of the surveyed farmers was medium size (62.5 per cent). Land holdings of the surveyed households showed that most of them had semi-medium size of land holdings followed by small size. It was found that most of the farm households were having kutcha house.
Level of Inputs Use in different CropsThe level of various inputs used in production of different crops are shown in the
table 4. The mean level inputs used was found to vary from crops to crops.
Education levelIlliterate 77Primary Level 17Secondary 4.0Higher Secondary 2.0Household sizeLess than 5 35.05 to 9 62.5More than 9 2.50Size of holdingMarginal (less than 1 hectare) 1.5Small (1-1.99 hectares) 35.0Semi-medium (2-3.99 hectares) 49.0Medium (4-9.99 hectares) 13.5Large (10 and above hectares) 1.0House typeKutcha 68.5Pucca 31.5
Source: Field Survey, 2016
Maila Lama

69
Table 4: Mean Level of Various Inputs used Per Bigha in Production of Different Crops
The level of use of seed varied from 1.75 kg per bigha for millet to 110 kg per bigha for potato. Labour (in man days) use was found to be highest in potato which shows that potato cultivation is more labour intensive. The use of fertilizer per bigha was found to be more in cash crops. Its use varied from 1.15 kg per bigha in wheat to 15.59 kg per bigha in potato. The level of use of manure ranged from 3.23 kg per bigha in paddy to 99.26 per bigha in chilli.Determinants of Productivity of Crops The Cobb-Douglas type production function was applied to examine the factors deter-mining the output of different crops and elasticity of output to inputs. The log-linear functional form was used as it gives the elasticity of output with respect to various in-puts. The explanatory variables included in the analysis are; seed, fertiliser, manure and labour. The dependent variable is the output. All these variables were measured in terms of per unit area (per bigha). Though ploughing and irrigation are considered as important explanatory variables, they could not be considered due to their limited availability in the study area. The results of the regression analysis are presented in the table 5.
Table 5: Result of the Regression for determinants of Output of Crops
Crops Seed (in kg) Labour (in man days)
Fertiliser (in kg) Manure (in kg)
Paddy 2.67 25 3.38 3.23Wheat 2.15 22 1.15 20.57Maize 3 22 4.1 75.2Millet 1.75 25 1.25 67.97Potato 110 30 15.59 56.59Chilli 2 22 3.37 99.26
Source: Field Survey, 2016
CropsCoefficient
Seed Fertiliser Manure Labour Constant R2 F-Statistic
Paddy0.005 0.222** 0.057 0.102 3.84
0.33 4.41***(0.05) (2.417) (0.872) (0.557) (6.12)
Maize .152** 0.012 0.216*** -0.047 4.49
0.49 10.86***(1.991) (0.162) (4.366) (-0.052) (13.45)
Millet0.138 0.107** 0.002 0.145 4.081
0.39 5.48***(1.576) (1.799) (-0.044) (1.730) (16.417)
Agricultural Productivity and its Determinants in Arunachal Pradesh : An Application of Cobb-Douglas type Production Function

70
Note: Figures in the bracket indicate t-values and *** and ** indicate significant at 1 and 5 per cent level.
The result of the regression analysis for production function estimates for differ-ent crops showed that in case of paddy coefficient of fertiliser was positive and significant at 5 per cent level. The variables seed, manure and labour were also positively affecting the paddy output but were not significant. It shows that output of paddy can be raised by increasing the use of fertilizer.
Maize is one of the major food crops grown in the area. The. Hence, it could not be included as a variable in the regression analysis. The results of the regression analysis for determinants of maize production showed that the coefficients of seed and manure were positive and significant at 5 per cent and 1 per cent level of significance. The coeffi-cient of fertilizer as also positive but it was not significant at any level. This could be due to low use of fertiliser in maize production. The variable labour was negatively affecting the maize output but it was not significant.
In case of millet, the coefficient of fertiliser was positive and significant at 5 per cent level. The variables seed, manure and labour were also positively affecting the millet output and were not significant at any level. It indicates that output of millet is responsive to fertiliser. In case of wheat, coefficients of both fertiliser and manure were positive and significant at 5 per cent level of significance. The variable seed was also positively affect-ing wheat output but it was not significant. The coefficient of labour was negative but it was not significant.
Potato is one of the major cash crops grown in the area. The most important inputs used in potato production were found to be fertiliser, manure and labour. The results of the regression analysis for determinants of potato output showed that the coefficients of both fertiliser and manure were positive and significant at 1 per cent level. This implied that output of potato is responsive to both fertiliser and manure. The coefficient of seed was also positive but it was significant at 5 per cent level of significance. The coefficient
Wheat0.133 0.125** 0.244** -0.346 4.792
0.38 2.39**(0.997) (1.719) (2.126) (-2.144) (12.076)
Potato0.501*** 0.299*** 0.089*** -0.08 3.25
0.61 52.92***(6.768) (8.332) (2.913) (-1.436) (9.607)
Chilli0.028 0.256*** 0.035 0.370*** 3.107
0.46 10.70***(0.299) (3.735) (0.793) (4.331) (10.745)
Maila Lama

71
of labour was negative but it was not significant.Chilli is another important cash crop grown in the area. The main inputs used by
the farmers in chilli production were fertiliser, manure and labour. The results of the re-gression analysis showed that the variables fertiliser and labour were positively affecting chilli output and were significant at 1 per cent level respectively. The coefficients of seed and manure were also positive but were not significant at any level.Policy ImplicationsThe above findings and discussion lead to following policy implications:
1. The productivities of major crops in the State were found to be low compared to national average. Thegrowth in productivity of major crops except paddy was very low during the period under review. This can be attributed to traditional method of cultivation and low level of use of modern technology. Hence, the policy should focus on transforming traditional agriculture by introducing new methods of cultivation.
2. The level of inputs used in production of different crops indicated very low use of modern inputs. The farmers were relying more on traditional inputs. The level of use of plant nutrients was very low. This was due to high cost as well as non-avail-ability of modern inputs. Since the output was found responsive to plant nutrients, the government should supply and distribute modern inputs like, high yielding variety of seeds, fertiliser, manure etc. to farmers at subsidised rate.
3. The extension services were found to be very poor in the area. Extension ser-vices are considered very important to disseminate new technology in rural areas. Hence, the government should revitalise extension services and ensure regular visit of extension agents to villages to educate and aware farmers as most of them were illiterate.
4. Size of landholding is considered important for adoption of new technology. Small holdings are unsuitable for adoption of new technology. It was found that most of the surveyed farmers were having semi-medium holdings. The percentage of farmers having medium and large holdings was very less. Hence, the government should introduce land reforms and redistribute land.
5. The standard of living of farming households was found low. Hence, the policy should provide incentives to farmers and encourage them to diversify towards cash crops, provide market linkage to enhance farmers’ income.
Agricultural Productivity and its Determinants in Arunachal Pradesh : An Application of Cobb-Douglas type Production Function

72
ConclusionAgriculture is an important sector of the economy of Arunachal Pradesh in terms
of its contribution to employment. But agriculture in the State is progressing at a slow pace. The productivities of major crops were found low and growing at very low rates. It was mainly due to traditional method of cultivation and low level of use of modern and improved inputs. The study found very low level of use of plant nutrients by the farmers. This was due to high cost and non-availability of modern inputs. The outputs of crops were found responsive to plant nutrients like fertilizer and manure. Hence, the govern-ment should supply and distribute new and improved inputs like high yielding variety of seeds, fertilizer, manure etc. to farmers at subsidized rates such that they can apply improved inputs in their field to realize higher yield. There is also need to revitalize exten-sion services to educate and sensitize farmers as most of them were illiterate and having low level of education. The policy should be designed to provide sufficient incentives to farmers to diversify towards cash crops and provide market linkage to enhance farmers’ income.Acknowledgement: This article is based on the UGC sponsored minor research project. The author would like to acknowledge the financial support of the UGC.ReferencesAgarwal, A. K. 1997. ‘Agricultural System and Behaviour in North-Eastern States’, in
Behera, M. C. and N. C. Roy (ed.), Trends in Agrarian Structure in the Hills of North-East India, Commonwealth Publishers, New Delhi: 3-14.
Barah, B. C. 2006. ‘Agricultural Development in North-East India: Challenges and Opportunities’, Policy Brief No. 25, National Centre for Agricultural Economics and Policy Research, New Delhi.
Dwivedi, S. and Singh, N.P. 2000. ‘A Study of Resource Use Efficiency of Wheat Crop in Agra District’, Journal of Agricultural and Scientific Research, 36 (1): 14-18.
Government of Arunachal Pradesh. 2016. Statistical Abstract of Arunachal Pradesh 2002-2015, Directorate of Economics and Statistics, Itanagar.
Government of India. 2011. Agriculture Census 2010-11, Ministry of Agriculture, New Delhi.
Government of India. 2011. Census of India 2011: Provisional Population Totals Arunachal Pradesh, Directorate of Census Operations, Arunachal Pradesh, Ministry of Home Affairs, New Delhi.
Government of India. 2013.Agricultural Statistics at a Glance 2013, Directorate of Economics and Statistics, Ministry of Agriculture, New Delhi.
Maila Lama
73
Government of India. 2016. Agricultural Statistics at a Glance 2016, Directorate of Economics and Statistics, Ministry of Agriculture, New Delhi.
Government of India. 2011. Agriculture Census 2010-11, Ministry of Agriculture, New Delhi.
Government of India. 2011.Census of India 2011: Provisional Population Totals Arunachal Pradesh, Directorate of Census Operations, Arunachal Pradesh, Ministry of Home Affairs, New Delhi.
Mellor, J. W. 1966. Economics of Agricultural Development, Cornell University Press, New York.
Roy, N. C. 1997. ‘Agricultural Productivity in Arunachal Pradesh’, in Behera, M. C. and N. C. Roy (ed.), Trends in Agrarian Structure in the Hills of North-East India, Commonwealth Publishers, New Delhi: 55-59.
Singh, S. M. 1986. Technological Parameters in Agricultural Production Function, Ashish Publishing House, Punjabi Bagh, New Delhi.
Suresh, A. and Keshava T. R. 2006. ‘Resource-use Efficiency of Paddy Cultivation in Peechi Command Area of Thrissur District of Kerala: An Economic Analysis’, Agricultural Economics and Research Review, 19: 159-171.
Thorner, D., Kerblay, B. and Smith R.E.F. 1966. Chayanov on the Theory of Pheasant Economy, Richard D. Irwin Homewood, Illinois.
*****
Agricultural Productivity and its Determinants in Arunachal Pradesh : An Application of Cobb-Douglas type Production Function