agricultural science and resource management in the
TRANSCRIPT

RHEINISCHE FRIEDRICH-WILHELMS-UNIVERSITÄT BONN
Faculty of Agriculture
M A S T E R T H E S I S
As part of the Master programme
Agricultural Science and Resource Management
in the Tropics and Subtropics
Submitted in partial fulfilment of the requirements for the degree of
„Master of Science“
Soil salinity and its effects on the coastal
peri-urban vegetable production system
of Maputo, Mozambique
– exploration of the status quo
and management recommendations –
submitted by:
Jakob Herrmann
2964974
submitted on: 09.05.2019
first examiner: apl. Prof. Dr. Nazim Gruda
second examiner: PD Dr. Heide Hoffmann

Declaration
I hereby affirm that I have prepared the present paper self-dependently, and without
the use of any other tools, than the ones indicated. All parts of the text, having been
taken over verbatim or analogously from published or not published scripts, are indi-
cated as such. The thesis hasn’t yet been submitted in the same or similar form, or in
extracts within the context of another examination.
Bonn, 09.05.2019
_______________________________
Jakob Herrmann

Acknowledgements
I wish to thank, first of all, the “Stiftung für Tropische Agrarforschung”. Without its finan-
cial support the research stay in Maputo might not have been possible.
Furthermore, I am indebted to Professor Famba, Professor Magaia, Professor
Nuvunga, and Professor Chiconela from the agricultural faculty of the University Edu-
ardo Mondlane, who provided scientific guidance and who have done everything pos-
sible to support my research activities.
I share the credit of my work with the team of the agricultural soil and water laboratory
of the Eduardo Mondlane, first and foremost, Dr. Machava, Romano Guiamba and Jo-
sé Matlombe. I am thankful for your mentorship and active support of my research en-
deavor. The same holds true for the colleagues of the Department of Economic Activi-
ties of the Municipality of Maputo and the Casa Agraria of KaMavota. I especially want
to thank Matias Siueia Júnior and senhor Mania for their genuine interest, and support
of all field research activities. Not to forget, Evelina Carlos Manhiça from the agricultur-
al faculty of the University Eduardo Mondlane, for being a valuable research partner.
I am highly indebted to all the interview partners who shared their time, knowledge and
thoughts with me. Without you, this thesis would not have been possible. A very special
thanks goes to all the farmers who regularly welcomed me at their fields, and occa-
sionally even supplied me with fresh vegetables.
Lastly, I would like to thank Professor Hoffmann and Professor Gruda for their scientific
supervision of this thesis; as well as the UFISAMO research team for their support in
organizational matters and occasional interchange of ideas.
.

Dedication
This thesis is dedicated to my family and friends.
I am grateful for your consistent support.

Table of Content
List of Abbreviations and Technical Terms ..................................................................... i
List of Tables ................................................................................................................. ii
List of Figures ............................................................................................................... iii
List of Annexes ............................................................................................................. iv
Summary ....................................................................................................................... v
1 Introduction ................................................................................................................ 1
1.1 Thematic Contextualization .................................................................................. 1
1.2 Conceptual and Methodological Framework ........................................................ 3
1.3 Hypothesis, Objectives and Organization of the Thesis ........................................ 5
2 Review: Soil Salinity and Vegetable Production .......................................................... 7
2.1 Characteristics and Development of Salt-Affected Soils ....................................... 7
2.2 Soil Salinity Effects on Plant Growth and Crop Production ................................... 8
2.3 Agronomic Management of Soil Salinity ............................................................. 13
3 Study Location: Maputos’ Peri-Urban Vegetable Production System ........................ 21
3.1 Geographic Context ........................................................................................... 21
3.2 Socio-Political Context ....................................................................................... 22
3.3 Economic Context .............................................................................................. 25
3.4 Bio-Physical Context .......................................................................................... 27
3.5 Soil Salinity as an Impairing Factor .................................................................... 29
4 Methodology and Research Process ........................................................................ 32
4.1 Literature Review ............................................................................................... 32
4.2 Field Research Site ............................................................................................ 32
4.3 Interviewing and Field Observations .................................................................. 34
4.4 Participatory Soil and Water Survey ................................................................... 36
5 Results: Local Perception and Management of Soil Salinity within Maputos’ Peri-
Urban Vegetable Production Areas ............................................................................. 39
5.1 General Farming Practices and their Underlying Rationales .............................. 39
5.2 Local Indicators for Soil Salinity and Economic Evaluation ................................. 46
5.3 Local Perception on Significance, Causes, and Spatio-Temporal Dynamics of
Soil Salinity .............................................................................................................. 48
5.4 Local Strategies to Cope with Soil Salinity ......................................................... 51
5.5 Participatory Soil and Water Survey ................................................................... 56
6 Discussion of the Studies’ Results ............................................................................ 59
6.1 General Farming Practices and their Underlying Rationales .............................. 59
6.2 Local Indicators for Soil Salinity and Economic Evaluation ................................. 60
6.3 Local Perception on Significance, Causes, and Spatio-Temporal Dynamics of
Soil Salinity .............................................................................................................. 61
6.4 Local Strategies to Cope with Soil Salinity ......................................................... 63
6.5 Participatory Soil and Water Survey ................................................................... 65
7 Discussion of Potential Management Approaches Adapted to the Local Context ..... 67
7.1 Regional Management Approaches ................................................................... 67
7.2 Agronomic Management Approaches ................................................................ 69
8 Conclusions and Outlook .......................................................................................... 72
References .................................................................................................................. 74
Annexes ...................................................................................................................... 91

i
List of Abbreviations and Technical Terms
ABIODES Associação pela Agricultura Biológica, Biodiversidade e
Desenvolvimento Sustentável
(Association for Biological Agriculture, Biodiversity and Sustainable De-
velopment)
Casa Agraria Governmental Agricultural Extension Institution at the District Level
CMM Conselho Municipal de Maputo
(Municipality of Maputo)
DAE Departamento de Actividades Económicas
(Department of Economic Activities of the Municipality of Maputo)
DASACM Direção da Agricultura e da Segurança Alimentar da Cidade de Maputo
(National Government Directorate of Agriculture and Food Security in
Maputo)
DMPUA Direcção Municipal de Planeamento e Urbanização
(Municipal Directorate of Planning and Urbanization)
ECe Electrical Conductivity of the Saturated Soil Paste Extract
ECw Electrical Conductivity of Irrigation Water
ESP Exchangeable Sodium Percentage of a Soil
Green Zone Peri-Urban Agricultural Production Area; from port. Zona Verde
IIAM Instituto de Investigação Agrária de Moçambique
(Institute of Agrarian Research of Mozambique)
MASA Ministerio da Agricultura e Seguranca Alimentaria
(Ministry of Agriculture and Food Security)
SAR Sodium Adsorption Ratio of a Soil Solution
UEM University Eduardo Mondlane, Maputo

ii
List of Tables
Table 1: Classification of salt-affected soils. ................................................................. 7
Table 2: List of salt tolerant under-utilized leafy vegetable crop species. .................... 19
Table 3: Member and land statistics of the farmers associations of KaMavota. .......... 34
Table 4: Local bio-physical soil salinity indicators and economic evaluation categories
for soil salinity. ............................................................................................................ 46
Table 5: Locally perceived causes for soil salinity. ...................................................... 49
Table 6: Local strategies to cope with soil salinity and their underlying rationales ...... 52
Table 7: Local perception towards salt tolerance of different common crop species. .. 53
Table 8: Recommendations for regional management approaches. ........................... 68
Table 9: Recommendations for agronomic management approaches. ....................... 70

iii
List of Figures
Figure 1: Administrative structure of Maputo and localization of the peri-urban
vegetable production zones within the urban matrix ................................................... 22
Figure 2: Geological map of Maputo ........................................................................... 28
Figure 3: Geographic localization of the farmers associations of the Green Zone of
KaMavota. .................................................................................................................. 33
Figure 4: Geographic localization of the soil and water survey sample locations within
the Green Zone of KaMavota ..................................................................................... 37
Figure 5: Examples for the spatio-temporal variability of local cropping patterns ........ 39
Figure 6: Contrasting crop diversity between individual producers ............................. 41
Figure 7: Typical local kale and lettuce varieties ......................................................... 41
Figure 8: Local soil and fertility management .............................................................. 43
Figure 9: Local irrigation management ....................................................................... 44
Figure 10: Local extension activities ........................................................................... 45
Figure 11: Locally used soil salinity indicators. ........................................................... 47
Figure 12: Locally perceived long-term drivers for salinization. ................................... 51
Figure 13: Local approaches to cope with soil salinity. ............................................... 54
Figure 14: ECe and ECw grouped by farmers‘ soil salinity categorization .................... 57

iv
List of Annexes
Annex I Salt Tolerance of Selected Vegetable Crops
Annex II Index of Informants and Respective Interviews
Annex III Guiding Questions for Interviews with Farmers and Extension Workers
Annex IV Codebook – Themes Identified from Interviews and Field Notes
Annex V Index of Crops Grown in the Green Zones of Maputo
Annex VI Data Table of the Participatory Soil and Water Survey

v
Summary
Soil salinity is a significant threat to agriculture. A variety of production systems are
affected, totaling up to one billion hectares globally. Smallholder vegetable production
systems of the Global South are poorly studied with regard to their impairment through
soil salinity. To tackle this knowledge gap, an exploratory case study was conducted in
the coastal peri-urban vegetable production areas of Maputo, Mozambique. A mixed-
method approach was applied, building on literature review, stakeholder interviews,
field observations, and a participatory soil and water survey. The objective of this study
was to assess the local knowledge, perception, and management of soil salinity, in
order to formulate management recommendations adapted to the local context.
Maputos’ farmers and extension workers have a profound and differentiated under-
standing of the spatio-temporal dynamics of soil salinity and its agronomic manage-
ment. Respective local perception and practice resembles reports from other small-
holder settings. Furthermore, they are largely in accordance with scientific explana-
tions. Progressing salinization of horticulturally used land is perceived as an increasing
problem, and is mostly ascribed to insufficiently managed and maintained drainage
systems. Typically, farmers detect elevated salt levels in the fields through the observa-
tion of plant symptoms and salt crusts, or by tasting soil and irrigation water. In the long
term, farmers evaluate soil salinity levels on the overall productivity of their respective
fields. Common agronomic strategies to cope with salinity include: (a) use of organic
soil amendments, (b) mineral fertilizer application, (c) simple land-shaping techniques,
(d) increased watering intensities, (e) the use of salt tolerant crop species, and (f) land
use extensification. On a socio-economic level, the problem is met by a balanced allo-
cation of plots, direct marketing strategies, and land use change initiatives. The partici-
patory soil and water survey demonstrated that the assessment of soil salinity through
local farmers is largely supported by technical ECe and ECw measurements.
In order to prevent continued salinization and to allow for sustained land reclamation,
the existing drainage systems need to be restored. Apart from that, a number of inno-
vative agronomic strategies should be promoted by the local extension services. Low-
cost technologies such as (a) improved irrigation management, (b) mulching, (c) inten-
sified and diversified use of organic soil amendments, (d) targeted fertilizer manage-
ment, (e) selection of tolerant crop varieties, (f) cultivation of previously under-utilized
tolerant crop species, and (g) targeted catch and intercropping would respond to the
low financial and technological resource endowment of local farmers, and could easily
build on already existing strategies. Regular monitoring of soil and water resources and

vi
the overall improvement of agricultural value chains should be considered as comple-
mentary strategies, in order to increase the adaptive capacity of local farmers.
On a global level, more in depth case studies are necessary to reveal universal pat-
terns of farmers’ knowledge, perception, and management with regard to soil salinity.
Participatory field trials of scientifically proven technologies should be forced in order to
evaluate their practicability under field conditions and promote their adoption in small-
holder vegetable production systems.
Keywords: coastal wetland, farmers’ perception, horticulture, land degradation, local
knowledge, participatory mapping, salinization, salt stress, urban agriculture

1
1 Introduction
1.1 Thematic Contextualization
Soil salinity is a global phenomenon, and, as a major abiotic plant stress, responsible
for impaired crop production in many of parts of the world. Soil salinity generally refers
to a complex of related phenomena. Salt-affected soils, per definition include (a) saline
soils, soils with high amounts of soluble salts; (b) sodic soils, which contain high
amounts of exchangeable sodium; and (c) saline-sodic soils, which share both charac-
teristics (Ghassemi et al. 1995; Rengasamy 2006). Existing estimates surmise 800
million to 1 billion hectares of land to be salt-effected worldwide, with ca. 40% of the
area being saline and 60% sodic (FAO 2015; Rengasamy 2006). A substantial share of
this area, at least 77 million hectares, salinized as a result of human activities, mostly
related to inadequate water management. Currently, at least 20% of the world’s irrigat-
ed land is affected by salinity (Ghassemi et al. 1995). In the light of increasing global
natural resource use, as well as noticeable climate change and variability, salinization
is seen as an ever increasing driver of land degradation (Plaut et al. 2013). Salt affect-
ed soils occur primarily in arid and semiarid climates. But they are not restricted to the-
se regions. They are found in every climatic zone and on every continent. All soil types
with diverse morphological, physical, chemical and biological properties may be affect-
ed (Rengasamy 2006).
Soil salinity affects plant growth due to osmotic and specific ion effects. The latter could
be toxicities or nutritional disorders caused by the presence of certain salt ions, most
prominently sodium and chloride (Munns et al. 2008). Most of the cultivated crop spe-
cies exhibit comparatively low salt tolerance levels, and consequently demonstrate
yield losses when grown under saline conditions. Vegetable crops are considered par-
ticularly sensitive (Grieve et al. 2012). Based on simple extrapolation, Qadir et al.
(2014) estimated the global annual cost of soil salinity in irrigated areas due to de-
creased crop yields to be around US$ 27.3 billion. But salinization of agricultural land
does not only have economic implications on the plot or farm level. As a consequence,
it may entail profound socio-economic transformations within affected regions (Haider
et al. 2013; Qadir et al. 2014).
Due to its spatial dimension, its detrimental effects on crop production, and conse-
quently on rural livelihoods, food security and national economies, scientific research
on the topic has been extensive. Great advances have been made in fundamental re-
search on general soil-plant interactions under salinity stress (Munns et al. 2008;
Shabala et al. 2017). Furthermore, application-oriented agronomic research has pro-

2
vided a thorough understanding of salinity management, particularly in the context of
irrigated agriculture under arid and semi-arid conditions (Qadir et al. 2000; Wallender et
al. 2012). However, not all affected production systems have equally profited from this
research progress. Especially smallholder vegetable production systems of the Global
South are poorly studied with regard to their impairment through soil salinity. Even
though extensive research on soil salinity in the context of vegetable production exists,
it is restricted to fundamental research, and thus is barely geared towards direct ap-
plicability in smallholder farming contexts (Machado et al. 2017; Shahbaz et al. 2012).
Since data is scarce, estimates of the extend of vegetable production systems affected
by soil salinity within the Global South are not existent. Karlberg et al. (2004) have em-
phasized this shortcoming with specific focus on the African continent. Nonetheless, an
array of case studies points to their geographically widespread importance. Examples
include coastal production systems, affected by seawater intrusion; for example in
Bangladesh (Rahman et al. 2011), Madagascar (Mawois et al. 2011), and Benin
(Wouyou et al. 2017). Other studies report salinity problems in the context of peri-urban
vegetable production due to the use of saline wastewaters for irrigation; for example in
Nigeria (Binns et al. 2003), South Africa (Materechera 2011) or India (Biggs et al. 2009;
Buechler et al. 2016). However, within these case studies, soil salinity is either ap-
proached as a mere agronomic problem or even just mentioned as an aside. Conse-
quently, there is need for research on the agronomic and socio-economic contextual-
ization of soil salinity and its impacts on smallholder vegetable production systems, in
order to facilitate the transfer of existing knowledge and technologies to affected farm-
ing communities.
To tackle this knowledge gap, an exploratory case study was conducted in the coastal
peri-urban vegetable production areas of Maputo, Mozambique, where previous stud-
ies reported the significance of soil salinity as a major agronomic constraint (Barghusen
et al. 2016; Schmidt 2017; Sitoe 2016). Maputo, located at the shores of Maputo bay in
southern Mozambique, comprises two extensive coastal lowlands bordering the central
built up city. These areas traditionally are characterized by intensive market gardening.
They account for ca. 1.200 hectares of agricultural land (DASACM 2017) and ca.
11.700 smallholder farmers (Sambo 2016). With an estimated mean annual production
of 75.000 tons over the last years, local farmers are able to meet a significant share of
the cities vegetable demand (Sambo 2016). Nonetheless, the local production system
faces several constraints which impair its overall productivity. Next to soil salinity this
includes a restricted access to high quality inputs, elevated pressure of pests and dis-
eases, as well as unfavorable hydrological conditions. Local farmers generally have a
low financial and technological resource endowment which limits their coping capaci-

3
ties (Barghusen et al. 2016; Schmidt 2017; Sitoe 2016). The present study therefore
aims at providing a profound regional contextualization of soil salinity and its effects on
vegetable production, in order to formulate adequate management recommendations.
1.2 Conceptual and Methodological Framework
An increasing body of literature suggests the importance of looking at the management
of agricultural resources not only from a technical and biophysical point of view but to
also consider the surrounding socio-economic and cultural context. On one hand, this
allows for a better understanding of current agriculture and resource management, as
based on farmers’ decision making. On the other hand, it facilitates the evaluation of
potential future technologies and management practices adapted to local contexts
(Neef et al. 2011; Ojiem et al. 2006; Shiferaw et al. 2009; van de Fliert et al. 2002).
Several conceptual frameworks have been developed, trying to integrate and structure
the complexity of agricultural activities (Cochet 2012; Giller 2013; Glaeser 1995). One
approach, specifically aiming at the development of locally adapted agronomic technol-
ogy solutions, is the socio-ecological niche concept, proposed by Ojiem et al. (2006). It
argues for the evaluation of any potential technology against a set of hierarchically
nested boundary conditions, including overall agro-ecological, socio-cultural, economic,
and local ecological factors. It is claimed that, if consequently applied, this methodology
may define a specific niche environment for a given technology. Agricultural research
thus wouldn’t rely on global management recommendations but could tailor locally
adapted solutions which consequently would lead to higher adoption rates among
farmers (Descheemaeker et al. 2016; Ojiem et al. 2006).
To facilitate such complex system analysis and to increase ownership among the target
group of farmers, development oriented agricultural research increasingly advocates
for participatory approaches (DeWalt 1994; Hoffmann et al. 2007; Neef et al. 2011; van
de Fliert et al. 2002). It is argued, that especially with regard to forms of land degrada-
tion such as soil erosion, nutrient depletion, and salinization the consideration of farm-
ers’ knowledge and perceptions is key to develop effective and sustainable interven-
tions (Pulido et al. 2014; Qadir et al. 2014). The number of published case studies on
soil salinity, which followed participatory approaches, is still limited. Nonetheless, they
provide valuable insights into farmers’ respective management approaches, and their
underlying rationales as shaped by farmer’s knowledge, perception and the overall
socio-economic and ecological context. They represent diverse regional contexts, with
examples from Tanzania (Kashenge-Killenga et al. 2014), Mozambique (Nhantumbo
4
2009), Uzbekistan (Giordano et al. 2010), Algeria and Tunisia (Bouarfa et al. 2009),
Lebanon (El-Fadel et al. 2018), Pakistan (Kielen 1996), and Bangladesh (Ali 2003).
These case studies suggest that farmers generally have a credible understanding of
soil salinity, its causes, spatio-temporal variability, and management; even though their
forms of detection and ways of description may diverge significantly from scientific ap-
proaches. This is a phenomenon, widely recognized within the study of local
knowledge systems. Knowledge of farmers and other local stakeholders is often tacit
and difficult to articulate, describe, and validate. Thus, it should always be critically ex-
amined (Hoffmann et al. 2007). Drawing on a broad variety of case studies, Pulido et
al. (2014) developed an analytical framework to systematically assess and document
local knowledge and perception on land degradation in the wider sense, thus facilitating
its integration into scientific approaches. They put emphasis on the following analytical
units: (a) local indicators of land degradation, since they shape farmers perception of
the respective processes; (b) local perceptions on the causes, spatio-temporal dynam-
ics, and effects, since they influence farmers decision making on coping measures; (c)
overall farming practices and their underlying rationales, since they also determine if
farmers take specific coping initiatives or not. Many other scientists, additionally en-
dorse the direct comparison of local knowledge on soil and water resources with scien-
tifically acquired data (Ali 2003; Barbero-Sierra et al. 2016; Bouarfa et al. 2009; Kielen
1996; Mairura et al. 2008; Payton et al. 2003).
Studies which examine local knowledge and perception in the context of development
oriented agronomic research usually draw on a mix of methods, highly informed by the
social sciences. Especially the discipline of anthropology provides valuable approaches
(Crane 2014; DeWalt 1994; Sillitoe 2013). Social surveys, interviews with key inform-
ants, participatory rapid appraisal tools, or field observations may be combined with
agronomic approaches such as field experimentation, or soil surveys; depending on the
respective context and available research resources (Neef et al. 2011; Payton et al.
2003; Pereira et al. 2017). Within this context, qualitative and quantitative approaches
are equally valued. Nonetheless, linking quantitative and qualitative methods generally
leads to a more profound understanding of the respective phenomenon studied. It fur-
ther allows for cross checking of findings through triangulation and facilitates the inte-
gration of interdisciplinary data (Cox 2015; Spoon 2014).

5
1.3 Hypotheses, Objectives and Organization of the Study
Several case studies suggest that soil salinity as an agronomic constraint generally is
complexly embedded and cross-linked within the wider ecological and socio-economic
system of a given setting (Ali 2003; Bouarfa et al. 2009; El-Fadel et al. 2018;
Kashenge-Killenga et al. 2014; Kielen 1996; Nhantumbo 2009). As such, it is not mere-
ly an external driver of ecological and socio-economic change, but has to be consid-
ered as a factor which is integrated into local production and livelihood rationales.
Based on these assumptions and following the conceptual frameworks outlined in the
previous chapter, the study aims at exploring the local knowledge, perception and
management of Maputos’ peri-urban vegetable farmers with regard to soil salinity.
Building on this analysis, potential management approaches adapted to the local condi-
tions shall be evaluated. Thus, the following two broad research objectives have been
formulated:
I. Explore and describe key agro-ecological and socio-economic aspects of the
peri-urban vegetable production system of Maputo linked to soil salinity
II. Review and evaluate potential soil salinity management approaches against the
background of the local context
To structure the envisaged analysis in accordance with other research, the first objec-
tive has been broken down into specific sub-objectives which largely follow the analyti-
cal units proposed by Pulido et al. (2014):
Explore and describe general farming practices and their underlying rationales
Explore and describe local indicators for soil salinity
Explore and describe local perception on causes, spatio-temporal dynamics,
and effects of soil salinity
Explore and describe local management of soil salinity
Compare local knowledge and perception to scientifically acquired data on soil
salinity
The structure of the thesis follows the sequential logic of the two broad research objec-
tives. This introductory chapter is followed by a basic literature review on agronomic
soil salinity research, with a specific focus on vegetable production. It will cover pro-
cesses of salinization, its effects on plants, and the respective implications for vegeta-
ble production. Chapter three provides a review of the overall ecological and socio-
economic setting of vegetable production in Maputo, based on the available literature.
It also includes a sub-chapter on the previously documented information on soil salinity
within the respective production areas. Thereupon, the applied methods for data collec-

6
tion, analysis and evaluation are described. Chapter four presents the study’s results.
All analytical units as defined through the above outlined research objectives, are suc-
cessively treated. Within the subsequent chapters, the findings are first discussed
against other case studies and the scientific state of the art, before management rec-
ommendations are elaborated. The study concludes with a summary and an outlook on
potential further research activities.

7
2 Review: Soil Salinity and Vegetable Production
2.1 Characteristics and Development of Salt-Affected Soils
Salt-affected soils are characterized by an excessive accumulation of soluble salts,
which reaches a level that impacts on agricultural production, environmental health,
and economic welfare (Rengasamy 2006). Major cations potentially found in these soils
are sodium, calcium, magnesium and, to a lesser extent, potassium. The major anions
are chloride, sulphate, bicarbonate, carbonate, and nitrate (Qadir et al. 2000). The ac-
tual composition of these different salt ions may vary considerably, depending on the
individual context. However, sodium and chloride are often the principal components.
The high electrolyte concentration is the only common characteristic of all salt-affected
soils. With regard to chemistry, morphology, pH, and other properties they can be high-
ly diverse (Pessarakli et al. 2011; Rengasamy 2010).
An internationally widely accepted categorization, divides salt-affected soils into saline,
sodic, and saline-sodic soils. Saline soils are defined by high amounts of salts in the
solution phase; while sodic soils contain a high quantity of sodium on the cation ex-
change sites. Saline-sodic soils share both of these characteristics. As a scientific
standard, the electrical conductivity of the saturated paste extract of a soil (ECe) serves
as an indicator for the content of soluble salts. The sodium adsorption ratio of a soil
solution (SAR), or the exchangeable sodium percentage of a soil (ESP) indicates the
state of sodicity (Qadir et al. 2000; Rengasamy 2010). Conventionally, the threshold for
salinity is defined as ECe ≥4 dSm-1, and for sodicity as ESP ≥15, which corresponds to
SAR ~ 13 (Qadir et al. 2008; Shahid et al. 2011; Table 1).
Table 1: Classification of salt-affected soils according to Richards (1954).
Classification ECe (dSm-1
) ESP pH
saline >4 <15 <8.5
sodic <4 >15 <8.5
saline-sodic >4 >15 >8.5
Salinity and sodicity profoundly influence the physical, chemical, and biological proper-
ties of a soil (Pessarakli et al. 2011). The osmotic stress brought about by the high
electrolyte content of saline soils typically reduces microbial activity, microbial biomass
and changes microbial community structure (Yan et al. 2015). As a consequence, vari-
ous nutrient cycling processes might be altered, including carbon (Setia et al. 2011)
and nitrogen cycles (Akhtar et al. 2012). The actual amount and composition of salt
ions present also influences the pH and thus the state and availability of other nutrient
8
elements (Rengasamy 2016). Sodic soils are additionally characterized by a con-
strained structural stability. The elevated contend of sodium at the exchange complex
of clay minerals facilitates their swelling and thus the dispersion of soil aggregates,
which finally results in low soil permeability and infiltration capacity (Qadir et al. 2002).
The formation of salt-affected soils involves complex processes. Natural sources of
salts are rainfall, aeolian deposits, mineral weathering, and stored salts. Groundwater
dynamics may redistribute the accumulated salts and can potentially provide additional
sources. However, salts may also be washed out of soil layers by water entering the
system (Rengasamy 2006). Consequently, the salt regime of a given setting is highly
depended on the specific topography, climatic conditions, soil characteristics, and
groundwater dynamics; and thus may be subject to temporal and spatial fluctuation.
Typical situations which favor the accumulation of salts in upper soil layers are a high
evapotranspiration rate, low rainfall, and restricted drainage due to a low permeability
of the soil and/or high groundwater tables. Thus, salt-affected soils are predominantly
found in arid and semi-arid parts of the world. But also coastal regions are often affect-
ed because of seawater intrusion (Pessarakli 1991; Rengasamy 2006, 2010; Shahid et
al. 2011).
Besides natural soil-forming processes, anthropogenically caused salinization is an
increasing factor. Typically it is associated with improper irrigation methods, like the
use of low quality water and deficient drainage, which consequently implies an insuffi-
cient leaching of the accumulating salts (Pessarakli et al. 2011; Rengasamy 2006).
However, additional aspects like overgrazing, deforestation, and chemical contamina-
tion of soils and water from industrial and agricultural sources have to be considered
(Pessarakli et al. 2011). Especially within intensive farming systems, the latter issue is
increasingly observable. The excessive use of mineral fertilizers and organic manures
may significantly increase the salinity of respective soils (Hargreaves et al. 2008; Li-
Xian et al. 2007; Sun et al. 2019). In coastal regions in turn, a high withdrawal of
groundwater for irrigation and an overall poor land and water management may favor
the ingress of seawater into local aquifers (Maji et al. 2016).
2.2 Soil Salinity Effects on Plant Growth and Crop Production
Effects on plant physiology and morphology. Soil salinity affects growth and devel-
opment of plants by causing various morphological, physiological and biochemical
changes. All major metabolic processes such as photosynthesis, protein synthesis,
energy and lipid metabolism are affected (Parida et al. 2005). The underlying mecha-
nisms of these plant responses are not yet fully understood (Läuchli et al. 2007). It is

9
therefore not always possible to exactly distinguish between the detrimental effects of
salt stress and components of tolerance mechanisms employed by plants (Ashraf et al.
2004; Cheeseman 2013). A two-phase model, initially suggested by Munns and col-
leagues (Munns et al. 2008), is now widely excepted as a simplified description of the
general effects of salt stress on plants.
The first phase is related to the osmotic effect of salinity. A high salt concentration in
soil solution increases the soil osmotic pressure and thus reduces the ability of plants
to acquire water. The osmotic effect of salinity induces physiological changes in the
plant similar to those caused by water stress-induced wilting, such as stomatal closure
and concomitant increases in leaf temperature. Stomatal conductance and transpira-
tion rates usually stay reduced persistently. However, the first rapid loss of cell volume
and turgor is often reversed within hours due to osmotic adjustment. Additionally, the
osmotic effect leads to a rapid overall growth reduction. The observable restricted
shoot growth, leaf expansion and lateral bud formation is due to a reduction in cell
elongation and cell division. The primary consequences are fewer and/or smaller plant
organs, and apparent stunting; commonly detectable within hours to days. (Läuchli et
al. 2007; Munns et al. 2008).
The second phase is related to a continuous uptake and consequent accumulation of
salt ions in the shoot, primarily sodium and chloride. The homeostasis of cellular ion
concentrations is fundamental to the physiology of living cells. Toxic effects are not
only dependent on absolute salt ion concentrations but also on their ratio to other ions.
For example, if the cytosolic potassium to sodium ratio is reduced to a critical level, this
compromises enzyme functionality and therefore key metabolic processes. Conse-
quently, this causes additional growth inhibition and finally premature senescence of
older leaves. It is a process that runs comparatively slow and will be detectable just
within days to weeks (Munns et al. 2008; Munns et al. 2016; Taiz et al. 2015).
Both, the osmotic and the ion effects of soil salinity impair essential metabolic process-
es such as photosynthesis and respiration. This doesn’t just lead to reduced net carbon
assimilation, but additionally induces oxidative stress through the production of reactive
oxygen species (Shabala et al. 2017; Tang et al. 2015). Next to these direct mecha-
nisms, salt-affected soils further affect plant growth indirectly. Most importantly this
refers to nutrient imbalances, either caused by reduced nutrient availabilities under
saline conditions; or by competitive uptake, transport and partitioning of specific nutri-
ent elements; depending on the actual ion composition present. Typical antagonistic
ion relations in salt affected soils are observed between sodium, potassium, calcium,
magnesium and ammonium, as well as between chloride and nitrate (Grattan et al.
10
1999). Especially in sodic soils, unfavorable soil physical properties, and the potentially
associated stresses such as water logging, are of additional relevance (Rengasamy
2010).
Plants evolutionary evolved several physiological and anatomical adaptations to salt
stress conditions (Shabala et al. 2017). However, there exists a high genetically deter-
mined interspecific variability of overall salt tolerance; depicting a continuum from very
sensitive to highly tolerant plant species (Cheeseman 2013, 2015; Flowers et al. 2010).
Species at the upper end of this continuum are conventionally referred to as halo-
phytes. Following a widely accepted definition, halophytes include all plant species that
complete their life cycle in a concentration of salt of ≥ 200 mM. All less tolerant species
are categorized as glycophytes (Flowers et al. 2008). Halophytes generally possess
constitutive salt tolerance, while the tolerance mechanisms of glycophytes typically are
induced with the onset of salt stress conditions (Rozema et al. 2013; Shabala et al.
2017). The different salt tolerance mechanisms existent in plants can be classified into
three interrelated main categories: (a) osmotic tolerance, which refers to long distance
signaled growth regulation and osmotic adjustment, (b) ion exclusion, which prevents
an excessive accumulation of sodium and chloride within leaves, and (c) tissue toler-
ance, which is based on effective cellular and intracellular compartmentalization of salt
ions in the leave tissue (Munns et al. 2008).
To offset the increased soil osmotic pressure under saline conditions, plants have to
readjust their internal cytoplasmic osmolality in order to maintain cell turgor and growth.
This is achieved either through uptake and/or synthesis of organic osmolytes, or the
accumulation of inorganic ions. Organic osmolytes, so called compatible solutes, are
small water-soluble sugars, polyoles, amino acids, and quarternary ammonium com-
pounds which don’t interfere with cytoplasmic metabolism. However, their synthesis is
a slow and energy intensive process. Inorganic ions such as potassium, sodium, and
chloride thus are of additional relevance for osmotic adjustment. They have to be se-
questered in cell vacuoles for not compromising cytosolic ion homeostasis. This intra-
cellular sequestration of salt ions is a key factor for tissue tolerance; next to effective
potassium retention in the cytosol. A further decisive aspect is the production of antiox-
idants in order to counteract oxidative stress. Since sodium and chloride are transport-
ed with the transpiration stream via the xylem, they tend to accumulate in leaf blades,
where they potentially first reach toxic levels. Against this background, effective exclu-
sion of these ions at the root level and/or targeted partitioning between different plant
tissues is acknowledged to increase a plants’ salt tolerance capacity (Munns et al.
2008; Shabala et al. 2017).

11
Apart from physiological mechanisms there are several anatomical features which con-
tribute to salt tolerance. Most typical is the development of leaf succulence, which facili-
tates intracellular sodium sequestration, and at the same time allows for a higher chlo-
roplast density per unit leaf area, thus maintaining photosynthetic rates with increased
transpiration efficiency. Root growth is usually less affected by salinity than shoot
growth, and branch root growth is promoted. This can be considered as a mechanism
to maintain access to water and nutrients. Aboveground excretion of salt ions into salt
glands and bladders is another morphological adaption strategy, restricted to certain
halophytic species (Shabala et al. 2017). It needs to be noted that all existing tolerance
mechanisms involve additional energy costs for the plant. Consequently, even highly
tolerant species reach a soil salinity threshold where the total energy gain will be offset
by the costs for maintenance of biomass and stress defense. Past this threshold plant
tissue will senescence (Munns et al. 2015).
Consistent with the physiological impact of soil salinity on plants, visual symptoms ap-
pear progressively. The first signs of salt stress are wilting, yellowed leaves, stunted
growth, and unusually small leaves. Furthermore, crop stands may be characterized by
uneven growth. In a second phase, which is associated with sodium and/or chloride
accumulation, the damage manifests as mottled chlorosis, necrosis on the leaf tips and
margins, as well as displayed scorching on the oldest leaves. Further plant symptoms
may occur under the influence of accompanying stresses such as nutrient disorders or
water logging (Rhoades 2012; Shannon et al. 1998).
Agronomic implications. Within the context of agriculture and horticulture, the salt
tolerance of a plant species is not merely evaluated against its overall biomass produc-
tion or the ability to complete its life cycle under saline conditions. The maintenance of
crop yield is of higher relevance to the farmer (Grieve et al. 2012; Roy et al. 2014). A
plants’ salt tolerance usually varies along its life cycle. Most annual crops are more
tolerant at germination but rather sensitive during emergence and early vegetative de-
velopment. They usually become progressively more tolerant again throughout later
stages of development. Furthermore, despite impaired vegetative development, grain
or fruit yield may not be reduced in certain crop species under low salinity levels. Con-
sequently, the salt tolerance evaluation of a given crop is depended on the plant part
harvested (Läuchli et al. 2007; Shabala et al. 2017). Additionally it has to be considered
that vegetable yield is not solely defined quantitatively. Various qualitative yield param-
eters such as taste, visual appearance or chemical composition may also be influenced
by soil salinity. In most cases, the effects of soil salinity on vegetable quality are posi-
tive (Rouphael et al. 2018). This is mainly due to plants increased synthesis of organic
osmolytes (sugars, sugar alcohols, soluble proteins, amino acids, polyamines,

12
sulfonium compounds) and antioxidants (ascorbic acid, tocopherols, carotenoids, phe-
nolic compounds) which improves taste, aroma and nutritional value (Grieve 2011).
Increased contents of these health promoting bioactive compounds are generally found
in both, fruit and leafy vegetables (Rouphael et al. 2018). Therefore, depending on the
crops genotype, moderate salt stress may be accepted or even applied in a controlled
manner by the farmer to improve vegetable quality (Rouphael et al. 2018).
Salt tolerance conventionally is described by functions of yield decline across a range
of salinity levels. Traditionally, a linear model based on the parameters of threshold and
slope as introduced by Maas et al. (1977) has been used. Where the threshold is de-
fined as the ECe that is expected to cause the initial significant reduction in the maxi-
mum expected yield, and the slope as the percentage of yield expected to be reduced
for each unit of added salinity above the threshold value (Grieve et al. 2012). Most ag-
ricultural and horticultural crop species demonstrate comparatively low salt tolerance
capacities and thus are categorized as glycophytes (Maas et al. 1999; Panta et al.
2014). Especially vegetable crops are reported to be sensitive to soil salinity (Shahbaz
et al. 2012; Shannon et al. 1998). Most conventional vegetables are characterized by
threshold values of ECe ≤2 dS m-1, which indicates that they can exhibit significant yield
losses when grown under conditions commonly still considered as non-saline. Excep-
tions are crops such as asparagus, beetroot, and green squash which are considered
moderately salt tolerant, having threshold values of ECe ≥4 dS m-1. An overview of the
standardized salt tolerance functions of selected vegetable crop species, as compiled
by Grieve et al. (2012), is provided in Annex I. With regard to irrigation water, a gener-
alized threshold value of ECw ≤3 dS m-1 can be assumed (Midmore 2015)
However, such data can only be regarded as a broad guideline. Firstly, because it is
not considering the broad varietal diversity of individual vegetable crop species (Shan-
non et al. 1998).There still exists a huge knowledge gap with regard to the varietal di-
versity in salt tolerance of the major vegetable crops (Machado et al. 2017; Shahbaz et
al. 2012). Secondly, because actual plant responses to salinity are not exclusively de-
termined by genotype and soil salinity level. Environmental factors such as climate, soil
conditions, agronomic practices, irrigation management, and salt composition may in-
fluence the situational salt tolerance function of a crop (Atkinson et al. 2012; Läuchli et
al. 2007; Mittler 2006; Shannon et al. 1998). For example, air carbon dioxide concen-
tration (Maggio et al. 2002), root zone temperature (Dalton et al. 1997), and heteroge-
neity vs. homogeneity of root zone salinity (Bazihizina et al. 2012) have been reported
to alter salt tolerance functions of vegetable crop species. Further, it has been
acknowledged that the response of plants to salt stress in combination with other abiot-
ic and/or biotic stresses is unique and doesn’t just represent the additive effect of the

13
different stresses involved. The existing research data suggests that most stress com-
binations demonstrate negative interactions (Atkinson et al. 2012; Mittler 2006). For
example, water logging generally enhances the ion effect of soil salinity by facilitating
the plant uptake of sodium and chloride (Barrett-Lennard et al. 2013). Furthermore,
plants are known to be more sensitive to soil salinity in hot, dry climates than they are
under cooler and more humid environments. The increased evaporative demand en-
hances transpiration and thus the uptake of salt ions (Läuchli et al. 2007; Mittler 2006).
Although salinity doesn’t directly cause plant diseases, salt stressed plants may be
more susceptible to infections by soil borne diseases (Läuchli et al. 2007), as has been
reported for tomato (Snapp et al. 1991; Triky-Dotan et al. 2005), pepper (Sango 2004),
common bean (You et al. 2011), or cucumber (Al-Sadi et al. 2010). In some cases ra-
ther positive interactions of stresses can occur (Mittler 2006). For example, it has been
demonstrated that the occurrence of heat stress (Rivero et al. 2014) as well as wound-
ing (Capiati et al. 2006) could increase the salt tolerance in tomato. Salt stress always
causes an osmotic effect, which is directly proportional to the overall salt concentration
of the soil solution (Ntatsi et al. 2017). However, the individual salt composition may
determine specific ion effects, including nutrient imbalances or toxicities (Grattan et al.
1999; Läuchli et al. 2007). Cucumber, for example, showed varying biomass and yield
reduction depending on the salt type applied, with calcium chloride being more phyto-
toxic than sodium chloride (Colla et al. 2013). Similar results have been reported for
stamnagathi (Cichorium spinosum), where salt type apparently determined plant toler-
ance, especially at lower salinity levels (Ntatsi et al. 2017).
2.3 Agronomic Management of Soil Salinity
A high diversity of different management practices to cope with soil salinity is globally
applied by affected farmers (Ali 2003; Bouarfa et al. 2009; Kielen 1996); and even
more are advocated for by the scientific community (Machado et al. 2017; Plaut et al.
2013; Qadir et al. 2000). The different strategies either aim at: (a) the reclamation of
salt-affected soils by permanently reducing salinity and/or sodicity levels, (b) preventing
the buildup of soil salinity, (c) temporarily alleviating salinity stress to plants by modify-
ing the root zone environment, or (d) cultivating salt tolerant crops. However, often a
combination of several of these aspects is observable under individual management
measures.
Typical approaches in the context of agriculture and horticulture are: (a) the improve-
ment of drainage and irrigation conditions, (b) the application of inorganic and organic
amendments for soil reclamation, (c) a targeted soil fertility management, including
mineral fertilizers, organic manures and biofertilizers, and (d) plant based strategies,

14
including salt tolerant crops and targeted catch and intercropping (Machado et al. 2017;
Plaut et al. 2013; Qadir et al. 2000). Salinity management is highly site specific. It has
to take into consideration, inter alia, the source of salinity, the type and content of salts
present, topography, soil characteristics, hydrological conditions, crop choice, and also
economic aspects. Therefore, no generalized recommendations can be made
(Pessarakli 1991; Shahid et al. 2011). Ideally, visual observations of soil, water and
plants are combined with simple scientific monitoring techniques. This can provide de-
tailed insights about the spatial and temporal salinity dynamics of a given setting and
thus facilitates its management (Qadir et al. 2000; Rhoades 2012).
Physical and water management approaches. In most cases, an effective drainage
system is the main requirement for reclaiming salt-affected lands, or for preventing its
occurrence (Pessarakli 1991). It allows for the removal of salts from the root zone by
leaching. This process further requires a sufficient and timely provision of good quality
water beyond the demands for meeting evapotranspiration rates. This additional water
demand is conventionally referred to as the leaching requirement. It is defined as the
minimum fraction of irrigation water that must be leached through the root zone to con-
trol soil salinity at a specific level. Its concrete amount is highly site specific, depending
on the salt content of the soil and the irrigation water itself, as well as on climatic condi-
tions (Plaut et al. 2013). Standardized guidelines for its respective calculation have
been available throughout past decades (Ayers et al. 1985; Hanson et al. 2006; Letey
et al. 2011).
However, the respective water and drainage requirements cannot be met in all contexts
(Machado et al. 2017). In smallholder farms, scraping of salts from the soil surface can
be a practicable option for temporal reclamation (Shahid et al. 2011). Moreover, specif-
ic soil shaping and irrigation techniques may rationalize salt leaching in these cases
(Machado et al. 2017; Shahid et al. 2011). The cultivation on ridges under furrow irriga-
tion practices for example has been proven to successfully establish a salt free growing
environment in humid coastal (Burman et al. 2015), as well as in arid regions (Devkota
et al. 2015; Shahid et al. 2011). Especially in intensive vegetable production systems
the use of water saving drip irrigation techniques offers another feasible approach.
Several field studies demonstrate, that with this technology even saline irrigation water
can be applied without substantially compromising yields of tomato (Karlberg et al.
2007; Malash et al. 2008; Wan et al. 2007), pepper (Nagaz et al. 2012), and watermel-
on (Romic et al. 2008). While under surface and sprinkler irrigation the entire plot sur-
face is watered and potentially leached, under drip irrigation only the immediate sur-
roundings of the plant roots are regularly wetted. Salts are transported towards the
periphery of the wet zone, thus providing for a salt free root zone. However, seasonal

15
plot scale leaching, preferably through natural rainfall, may be necessary to prevent a
gradual salinity buildup. An additional advantage of drip irrigation is the avoidance of
leaf burn and defoliation caused by the contact with saline water, which is a potential
constraint under sprinkler irrigation (Machado et al. 2017; Plaut et al. 2013; Shahid et
al. 2011).
Soil amendments. In the case of sodic soils, leaching is not sufficient, but must be
preceded by the application of certain soil amendments in order to replace sodium ions
from the exchange complex, typically with calcium ions (Machado et al. 2017). Gypsum
is the most commonly used chemical option. Alternatives include calcium chloride and
phospho-gypsum. Furthermore, acids or acid forming substances such as sulfuric acid,
elemental sulfur or pyrite can be used, since they facilitate the dissolution of native cal-
cite (Ahmad et al. 2013; Sharma et al. 2016). For an effective impact, amendments
should be incorporated into the soil through conventional tillage or even subsoiling.
This soil loosening measure also facilitates the subsequent leaching process (Shahid
et al. 2011; Singh et al. 2014). Throughout the past decades several other soil amend-
ments have been tested and evaluated for their capacity to reclaim sodic soils. Espe-
cially organic amendments such as animal manures, green manures, or organic wastes
and composts have proven to be effective, either as pure application or in combination
with chemical amendments (Mahmoodabadi et al. 2013; Sharma et al. 2016). The or-
ganic substances integrated promote an increase of the soils cation exchange capaci-
ty. Furthermore, they may contain considerable amounts of soluble calcium and other
bivalent cations (Diacono et al. 2015; Lakhdar et al. 2009). Additionally, they have the
capacity to release organic acids, lower the pH, and increase the carbon dioxide partial
pressure; which conjunctively facilitates the solubilzation of native calcite (Choudhary
et al. 2011; Pessarakli et al. 2011; Srivastava et al. 2016). Consequently, this results in
an increased replacement of sodium from the cation exchange sites.
However, the application of organic matter has many other positive effects on the soils
chemical, physical and biological properties, which are relevant for all salt-affected
soils. Most importantly, it increases soil porosity, soil bulk density, aggregate stability,
water infiltration, and water-holding capacity. The overall improvement of the soil struc-
ture thus facilitates the leaching of salts, and reduces surface evaporation. Further-
more, the application of organic matter improves nutrient contents and availabilities,
increases soil microbial biomass and soil enzymatic activities, and has pH buffering
effects (Diacono et al. 2015; Lakhdar et al. 2009). Another important aspect which is
increasingly investigated, are the direct effects of humic substances on plants growing
in salt affected soils. The salt stress alleviating functions of humic substances are at-
tributed to structural and physiological changes in plants related to nutrient uptake,

16
assimilation and distribution, as well as on hormone like activities in regulating germi-
nation and growth (Canellas et al. 2015; Ouni et al. 2014). If applied as mulch, organic
material may also favorably influence soil moisture, evaporation, and soil temperature,
thus counteracting salt accumulation in the root zone and allowing for increased water
use efficiency (El-Mageed et al. 2016; Saeed et al. 2014; Zhang et al. 2009).
In the context of vegetable production under saline conditions, several different organic
soil amendments have been tested for their capacity to alleviate salt stress and in-
crease crop productivity. Products recommended as effective include various compost
types (Abdel-Mawgoud et al. 2010; Leogrande et al. 2016), farmyard manures (Mitran
et al. 2016; Oustani et al. 2015), biochar (Rady et al. 2018), and extracted humic sub-
stances (Pérez-Gómez et al. 2017; Shalaby et al. 2018). However, it needs to be
stressed that certain organic matter sources may contain high salt contents and thus
would rather exacerbate than alleviate the problem. This refers mainly to municipal
solid waste composts and animal manures. Furthermore, the potential contamination
with inorganic or organic pollutants, which could affect crop production, has to be con-
sidered. Therefore, a concise monitoring and selection of organic amendments is im-
perative (Diacono et al. 2015; Lakhdar et al. 2009).
Fertilizer based approaches. Many salt-affected soils are characterized by low plant
nutrient contents and availabilities. Additionally, plant nutrient uptake may be impaired
by antagonistic effects. To approach these constraints, a thorough nutrient manage-
ment, including the targeted use of mineral fertilizers is generally recommended for
agriculture and horticulture under saline conditions (Machado et al. 2017; Plaut et al.
2013). However, the release and conversion mechanisms of applied nutrients, as well
as their plant uptake are not just influenced by the level of salinity and sodicity, but also
by several other soil and environmental factors. Therefore, no generalized recommen-
dations can be made (Choudhary et al. 2016; Grattan et al. 1999).
The salt stress alleviating effects of nitrogen, phosphorus, potassium and calcium ferti-
lization have been documented for several vegetable crops (Machado et al. 2017). In
the case of nitrogen, a combined application of nitrate and ammonium can be benefi-
cial (Hu et al. 2005; Machado et al. 2017). Furthermore, sub surface placement and
split application of nitrogen fertilizer are proven to reduce volatilization losses of am-
monia; a process which is a typically enhanced in salt-affected soils (Choudhary et al.
2016). Also for phosphorus a split of applications is recommended (Hu et al. 2005). In
irrigated vegetable production, the nutrient content of the irrigation water should be
considered. Where technologically feasible, the targeted application of fertilizers
through the irrigation water, known as fertigation, even could reduce soil salinization

17
and mitigate salt stress effects. In any case, high-purity, chloride-free, and low-saline
fertilizers should be selected in order to avoid additional salinization (Machado et al.
2017).
Next to mineral fertilization, the use of biofertilizers is increasingly advocated for, in
order to alleviate salt stress conditions in horticultural practice (Baum et al. 2015; Ma-
chado et al. 2017; Shahbaz et al. 2012). A biofertilizer is a substance which contains
living microorganisms, which when applied to seeds, plants, or soil, colonizes the
rhizosphere or the interior of the plants and promotes plant growth by increasing the
supply of nutrients and/or through the synthesis of plant growth-promoting substances.
The concept mainly refers to plant growth promoting rhizobacteria, and arbuscular
mycorrhizal fungi. These microorganisms potentially promote plant growth either direct-
ly through a facilitated nutrient acquisition (nutrient solubilization, especially of phos-
phorus; nutrient mineralization; nitrogen fixation; iron sequestration) and modulation of
phytohormone levels; or indirectly through the suppression of potential plant pathogens
(Bhardwaj et al. 2014; Mahanty et al. 2017).
A large number of experimental works has proven the salt stress ameliorating effects of
various biofertilizers in the context of vegetable production; inter alia: Glomus spp. in
basil (Elhindi et al. 2017), tomato (Abdel Latef et al. 2011), lettuce (Aroca et al. 2013),
and fenugreek (Evelin et al. 2012); Pseudomonas spp. in lettuce (Kohler et al. 2009),
tomato (Egamberdieva et al. 2017; Tank et al. 2010), and radish (Mohamed et al.
2012); Bacillus spp. in lettuce (Hasaneen et al. 2009), mung bean (Mahmood et al.
2016), and radish (Mohamed et al. 2012). The mechanisms by which these microor-
ganisms promote plant growth under salt stress are complex. They include the follow-
ing direct functions: (a) enhanced water and nutrient use efficiencies through increased
nutrient availability and stimulated root growth, (b) improved ion homeostasis, (c) en-
hanced production of osmolytes, (d) improved antioxidant activity, and (e) enzymatic
reduction of ethylene levels, thus counteracting the growth depression caused by this
phytohormone. Additionally, biofertilizers may improve the physical properties of the
soil through the exudation of certain polysaccharides or glycoproteins, which facilitate
the formation of soil aggregates. However, these mechanisms cannot be generalized
and don’t apply to all beneficial microorganisms used as biofertilizers (Ilangumaran et
al. 2017; Mishra et al. 2018; Muthukumar et al. 2017).
In general, the practical use of biofertilizers is constrained by the fact that their
effectivity is highly depend on the individual plant x microbe x soil interaction. Relevant
factors are, inter alia, genotypes of crop plant and beneficial microbes, soil type and
texture, nutrient content, soil moisture and temperature (Baum et al. 2015; Zaidi et al.

18
2015). Under saline conditions, the microorganisms additionally have to withstand the
specific osmotic stress situation (Mishra et al. 2018; Muthukumar et al. 2017). To coun-
teract this problem, products should be based on region specific microbial strains
adapted to the local conditions. A mix of different species and/or strains may also in-
crease effectivity (Baum et al. 2015; Zaidi et al. 2015). Against this background, the
manufacturing of nonspecific products on the basis of organic waste and/or animal ma-
nure fermentation is a common and feasible on-farm alternative to commercial formula-
tions. Typically, this involves the anaerobic digestion of the respective organic sub-
strate in simple tank constructions. The final liquid effluent usually contains high
amounts of mineral nutrients and plant growth promoting microbes (Alfa et al. 2014;
Suthar et al. 2017). In recent years, experimental work demonstrated that biofertilizers
produced from anaerobic digestion of cattle manure are effective in alleviating salinity
stress in seedling production of several vegetable crops, including pepper (Nascimento
et al. 2011), cowpea (da Silva et al. 2011), and groundnut (de Oliveira et al. 2016; de
Sousa et al. 2012).
Plant based approaches. Another widely researched and promoted approach to face
the constraints of soil salinity is the integration of salt tolerant plant species into the
cropping system (Qadir et al. 2008). Most importantly, this involves the use of alterna-
tive crop species and varieties. As alluded to before, amongst the conventionally culti-
vated vegetable crops only very few species are considered salt tolerant. Prominent
exceptions are artichoke, asparagus, beet root, and Swiss chard (Grieve et al. 2012).
However, if the salinity level is not too pronounced, the farmer may still draw on more
resistant cultivars of a given crop species. Several publications highlighted the intra-
specific variability of vegetable crops with regard to salt tolerance; including tomato
(Agong et al. 1997; Zaki et al. 2016), eggplant (Hannachi et al. 2018), lettuce (Bartha et
al. 2010; de Oliveira et al. 2011), pepper (Balasankar et al. 2017; Niu et al. 2010), and
different brassica species (Shannon et al. 2000; Su et al. 2013). There are increasing
efforts to develop salt tolerant vegetable crops by the means of conventional breeding,
marker-assisted selection and genetic engineering, exploiting the genetic diversity with-
in domesticated crops species and their wild relatives. However, so far successes have
been limited (Ebert et al. 2015; Roy et al. 2014; Shahbaz et al. 2012).
Against this background, there is growing advocacy to exploit the potential of previous-
ly under-utilized vegetable crops with higher salt tolerance, or even the domestication
of promising wild halophytic species. There exists a variety of comparatively salt toler-
ant plants which traditionally have been used as vegetables in different parts of the
world. It is noteworthy that they almost exclusively fall into the group of leafy vegeta-
bles and that a high share pertains to the Amaranthaceae family (Panta et al. 2014;

19
Qadir et al. 2008; Rao et al. 2014; Ventura et al. 2015; Table 2). Often these crops
don’t just attain good yields under saline conditions, but additionally are characterized
by a high nutritional value due to elevated contents of beneficial secondary metabo-
lites. However, in some cases antinutritional effects may become a problem. Most
prominently this concerns Atriplex hortensis and Portulaca oleracea which are known
to accumulate oxalates under saline growing conditions. Selected agronomic practices
such as modified nitrogen fertilization may be applied to counteract this problem (Ven-
tura et al. 2015).
Table 2: List of salt tolerant under-utilized leafy vegetable crop species.
Botanical name Common name Reference
Amaranthus spp. amaranth Wouyou et al. (2017), Amukali et al. (2015)
Atriplex hortensis red orach Wilson (2000)
Brassica juncea leaf mustard Singh et al. (2012), Rao et al. (2014)
Celosia argentea Lagos spinach Amukali et al. (2015), Carter et al. (2005)
Chenopodium album white goosefood Yao et al. (2010), Grubben et al. (2004)
Corchorus olitorius jute mallow Rao et al. (2014)
Diplotaxis tenuifolia rocket de Vos et al. (2013), Rao et al. (2014)
Portulaca oleracea purslane Grieve et al. (1997), Alam et al. (2014)
Salicornia spp. and
Sarcocornia spp.
pickleweed Ventura et al. (2013)
Salsola soda agretti Centofanti et al. (2015)
Sesuvium portulacastrum sea purslane Lokhande et al. (2013)
Suaeda salsa seepweed Song et al. (2015)
Talinum triangulare and Talinum paniculatum
waterleaf Montero et al. (2018), Assaha et al. (2017)
Tetragonia tetragonioides New Zealand
spinach
Wilson (2000)
Trigonella foenum-graecum fenugreek Rehm et al. (1984)
Another approach that capitalizes on the genetic diversity of salt tolerance amongst
vegetable crops is grafting. The use of tolerant rootstocks has been proven to be an
effective way to improve the salt tolerance of several fruit-bearing vegetables of the
Solanaceae and Cucurbitaceae families, including tomato, eggplant, cucumber and
pumpkin. Various mechanisms may be responsible for this phenomenon, including salt
exclusion by the root system, salt retention and accumulation in the rootstock, as well
as increased production of compatible osmolytes and antioxidants (Colla et al. 2010;
Plaut et al. 2013; Shahbaz et al. 2012).

20
Apart from salt tolerant vegetable crops, other plants may be advantageously em-
ployed in saline cropping environments. Several plant species have been tested for
their potential to facilitate reclamation of salt-affected soils, when integrated into the
cropping system as catch crops or improved fallows (Jesus et al. 2015; Plaut et al.
2013; Qadir et al. 2007). The typical underlying mechanisms are: (a) improved leaching
conditions based on plant root effects on soil physical characteristics; (b) increased
dissolution of calcite due to root respiration and root proton release, which results in
higher calcium availability and replacement of sodium from the exchange complex; and
(c) plant uptake of sodium and other salt ions, and their accumulation in the above
ground biomass. Apart from these main mechanisms, catch cropping may have other
beneficial side effects, like the increase of soil organic matter and microbial activity, or
the improvement of the soil fertility status (Ashraf et al. 2010; Jesus et al. 2015; Qadir
et al. 2007).
Stressed as highly effective in reclamation of salt-affected soils are the grass
Leptochloa fusca and the legume shrub Sesbania aculeata. Their reclamation capacity
is mainly attributed to root system facilitated calcite dissolution and salt leaching (Qadir
et al. 2007). Additionally, they can fix agronomically relevant amounts of nitrogen
through associated or symbiotic bacteria, even under saline conditions (Ashraf et al.
2003; Malik et al. 1997). Other species suggested for soil remediation include the
grasses Echinochloa stagnina (Ado et al. 2016), Cynodon dactylon and Sorghum spp.
(Qadir et al. 2007); as well as the herbaceous plants Chenopodium album (Hamidov et
al. 2007b), Tetragonia tetragonioides (Neves et al. 2007), Beta vulgaris (Ammari et al.
2008), Portulaca oleracea (Hamidov et al. 2007a; Kiliç et al. 2008), Suaeda maritima
(Ravindran et al. 2007), and Sesuvium portulacastrum (Rabhi et al. 2010; Ravindran et
al. 2007). The latter herbaceous species are known to be salt accumulators. Thus, their
long term reclamation effect is conditional on regular removal of their aboveground
biomass. However, since they all can be used as leafy vegetables or as animal fodder,
this can be considered a feasible option (Jesus et al. 2015). Due to their salt accumu-
lating capacities they may also be applied as intercrops to temporarily reduce the salt
content in the root zone of the respective salt sensitive companion crop (Plaut et al.
2013; Simpson et al. 2018). This strategy has been successfully tested for intercrop-
ping of Salsola soda with pepper (Colla et al. 2006) and tomato (Graifenberg et al.
2003; Karakas et al. 2016), Portulaca oleracea with tomato (Zuccarini 2008), and
Atriplex hortensis with watermelon (Simpson et al. 2018).

21
3 Study Location: Maputos’ Peri-Urban Vegetable Production
System
3.1 Geographic Context
Maputo is the capital of Mozambique, located in the southern part of the country be-
tween the coordinates 25º 52´ to 26º 10´ S and 32º 30´to 32º 40´ E. It is a coastal city,
sprawling along the shores of Maputo Bay and the Espirito Santos estuary. The munic-
ipality of Maputo occupies an area of 346.77 km2 and has a population of 1.1 million
(INE 2017). The greater metropolitan area of Maputo, including the neighboring cities
of Matola, Boane and Marracuene, accommodates nearly 2 million people (Paganini et
al. 2019). Maputos’ central urban area is located north of the Espirito Santos estuary,
comprising the administrative districts of Kampfumu, Kamayaquene, Nihamankulu,
Kamavota and Kamabukwana. The municipality further includes the Inhaca island (dis-
trict KaNyaka) constituting the eastern boundary of Maputo Bay, as well as the district
of KaTembe at the southern shores of the Espirito Santos estuary (Schmidt 2017; Fig-
ure 1a).
It can be assumed that up to 20% of Maputos’ population, mainly representing the ur-
ban poor, are involved in agricultural activities (Crush et al. 2011; Paganini et al. 2019).
Approximately 14.500 people are officially recognized as farmers by governmental in-
stitutions (Sambo 2016). Urban agriculture is found throughout the city. Scattered,
small-scale cultivation in backyards and on vacant land is typical for the central urban-
ized areas (Paganini et al. 2018a). However, agriculture is more relevant within the
municipalites’ rural and peri-urban districts. KaNyaka and KaTembe are characterized
by rather extensive rain-fed agriculture of staple crops, whereas the districts of
Kamavota and Kamabukwana distinguish themselves through coherent areas of highly
intensive vegetable production, the so called Green Zones (from port. Zonas Verdes;
Barghusen et al. 2016; Schmidt 2017).
The Green Zone of KaMubukwana stretches along the Infulene river valley which con-
stitutes the western boarder of the municipality (Figure 1b). The Green Zone of
KaMavota is located on a vast coastal plain northeast of the city’s urban center and
also includes the longitudinal escarpment west of these lowlands (Figure 1c). Together
they account for ca. 1.238 ha of agricultural land (DASACM 2017), which is cultivated
by ca. 11.700 farmers (Sambo 2016). With a mean annual vegetable production of an
estimated 75.000 tons over the last years, they are able to meet a significant share of
the cities demand (Sambo 2016).

22
Figure 1: Administrative structure of Maputo and localization of the peri-urban vegetable production zones
within the urban matrix. (a) Districts of Maputo; modified from Dörrbecker (n.d.). (b) Satellite image of the
Green Zone of KaMubukwana; based on Bing Maps data. (c) Satellite image of the Green Zone of
KaMavota; based on Bing Maps data.
3.2 Socio-Political Context
Previous to Mozambique’s independence in 1975, the majority of the present Green
Zones were farmed by settlers of Portuguese origin. After independence, these farms
were occupied by the Mozambican population. During the 1980s, as a cause of civil
war, many people from the countryside moved to major urban centers such as Maputo
which provided a comparatively safe environment. This influx of people led to a drastic
increase of people farming within the Green Zones of the capital and the forms of crop
production intensified. With the vision of ensuring stable food supplies to the increasing
urban population in times of political and economic crisis, the Mozambican state
b c
a

23
launched projects to support and stimulate development of urban agriculture (Sitoe
2016). In this context, official land use planning explicitly considered agricultural pro-
duction and a great diversity of agricultural inputs was made available to the producers
of the Green Zone (Sitoe 2016). However, within the frame of structural adjustment and
liberalization of the Mozambican economy, starting in 1987, this state support to urban
producers declined drastically. Nowadays, the Green Zones of Maputo still play a sig-
nificant role in the supply of agricultural products. However, agricultural activity is gen-
erally limited to small scale intensive vegetable cultivation, practiced by the urban poor
(Sitoe 2016).
Urban agriculture is still perceived as a relevant socio-economic factor by the national
and local government. The local institutions responsible for overseeing agricultural ac-
tivities within the city of Maputo are the Directorate of Agriculture of the City of Maputo
(DASACM) and the Department of Economic Activities (DMAE). While the DASACM is
subordinated to the Ministry of Agriculture and Food Security (MASA), the DMAE is
subordinated to the Municipal Council (CMM). To pool competencies and expertise, a
merger of these two parallel structures under the municipality is envisaged for the near
future (Barghusen et al. 2016; Schmidt 2017). A central organ, which is already used
jointly by the two structures are the so called Casas Agrarias (port., governmental agri-
cultural extension institutions), which are installed in each of the four agriculturally rele-
vant districts, close to the actual production areas. They are the direct contact point
between state and farmer, and as such, responsible for (a) the provision of information
and technical support, (b) the distribution of subsidized inputs, especially in the case
relief programs after crop failure, and occasionally (c) the renting of tractors and other
machines, or (d) the support in marketing matters (Barghusen et al. 2016; Schmidt
2017). Another important municipal department is the Municipal Directorate of Planning
and Urbanization (DMPUA), which is responsible for overseeing and executing existing
land use plans. According to the Mozambican constitution all land is governmentally
owned. DMPUAs main task thus is the issuing of official land use titles and the parcel-
ing of the respective plots. Maputos’ currently valid urbanization plan officially allows for
the strict preservation of the existing main agricultural areas (Barghusen et al. 2016;
Halder et al. 2018). Nonetheless, informal land use change due to a high urbanization
pressure is an acute phenomenon and hardly controllable by the responsible govern-
mental bodies, also within the cities’ Green Zones (Barghusen et al. 2016; de Sousa
2014; Halder et al. 2018).
The majority of the farmers in the Green Zones is currently organized within several
indipendend farmers associations. Previously, the organizational form of cooperatives
was predominant. However, this has drastically changed within the last two decades

24
(Barghusen et al. 2016). The formation of associations is highly promoted by the gov-
ernment as a means to facilitate the communication to the farmers and thus the execu-
tion of governmental programs towards urban agriculture. For example, the above
mentioned services of the Casas Agrarias are primarily offered to association mem-
bers. Also the access to occasional credit schemes for farmers has been made condi-
tional upon association membership. But the by far most important function of these
associations is the mediation of access to land. They are authorized to hold official land
use titles and allocate plots within their geographical limits to individual producers
(Barghusen et al. 2016; Schmidt 2017). Despite the apparent incentives to associate, a
significant share of farmers continues to operate individually. Major criticism of the cur-
rent associational structures are their instability, lack of transparency, and potential
internal conflicts (Schmidt 2017). Approximately 10.100 farmers of the two zones are
organized in a total of 26 associations. There are 11 associations in KaMavota and 15
in KaMubukwana. Another 1.600 farmers are not affiliated (DASACM 2017). The num-
ber of members and related land area may differ drastically between individual associa-
tions (Schmidt 2017).
Two thirds of farming households in the Green Zones are headed by women (Schmidt
2017; Smart et al. 2016a). Within farmers associations the share of women is even
reported to reach nearly 80% (Schmidt 2017). A bias towards predominantly elderly
people involved in farming is observable. Among younger generations, farming gener-
ally is regarded an unattractive occupation. Young people working within the Green
Zones are usually assisting family members or contracted workers (Schmidt 2017).
Farming households of the Green Zones often are supported by diversified livelihoods,
including additional non-agricultural income sources (Schmidt 2017). Households
which pursue agriculture just as an complementary economic activity typically cultivate
smaller plots, while those predominantly relying on agriculture have comparatively
large land holdings (Smart et al. 2016a). Sizes of land holdings range from 0.03 ha to
20 ha, with an average of 0.1 ha. Most producers hold legal land titles for their plots as
acquired through their respective association. They might have a single coherent plot,
or several dispersed plots, sometimes spread across association borders. Occasional-
ly, land is rented from peers. Additionally to their plots in the Green Zones, many pro-
ducers possess more agricultural land outside the metropolitan area, which is usually
used for extensive rain-fed agriculture (Schmidt 2017). Often, fields are not tended by
individuals alone. Additional labor is either provided by family members, or through
constant or temporal employment of contract workers (Schmidt 2017).
Both DASACM and DMAE employ a number of extension workers, which are stationed
at the different Casas Agrarias. Taken together, there are about 5-10 extensionists

25
working within each of the Green Zones of KaMubukwana and KaMavota. Actual num-
bers of employed personal may fluctuate. Every worker is responsible for 1-3 different
farmers associations (Barghusen et al. 2016; Schmidt 2017). Next to governmental
institutions, a number of non-governmental organizations have been working with
Maputos’ urban farmers in the course of recent years. Most remarkable is a project
which focuses on the promotion of organic and agro-ecological production methods
and the development of a marketing structure for products produced under a participa-
tory certification scheme. Initially run by the French organization ESSOR it is now con-
tinued by ABIODES, a local organization. The project had a broad coverage, having
trained a several hundred farmers in KaMubukwana and KaMavota (Barghusen et al.
2016; Paganini et al. 2019; Schmidt 2017). All of the extension work is more or less
coordinated between the different entities through regular formal and informal infor-
mation exchange. Extensionists are in close contact with the different association rep-
resentatives and individual farmers. Smart et al. (2016a) state that the majority of farm-
ers seeks agricultural advise through the governmental extension services of the
Casas Agrarias. Nonetheless, the extension structures still face a number of con-
straints, predominantly due to a lack of financial, technical and personal resources
(Schmidt 2017).
3.3 Economic Context
Producers within the Green Zones are quite homogeneous regarding their economic
situation and business orientation. Most farmers have small plots which are intensively
used for vegetable production (Smart et al. 2016b). Large scale commercial producers
with land holdings of >5 ha, farming companies, or cooperative-like operations are ex-
tremely rare (Schmidt 2017). Nonetheless, within this apparent homogeneous group a
differentiation based on overall resource endowment (finances, technology, land, mar-
ket access, education, access to extension) is verifiable. Smart et al. (2016b) distin-
guish two dominant clusters for Maputos’ Green Zones: (a) farmers with moderate level
of land endowment, access to extension or training advice, and horticultural crop sales
diversity, and (b) farmers with high levels of land endowment, high education/literacy,
and moderate horticultural crop sales diversity. Due to their higher asset level, farmers
from the second cluster tend to benefit through (a) a more concise and adequate use of
agrochemicals (Smart et al. 2016b), and (b) more diversified marketing channels
(Schmidt 2017).

26
Conventional inputs for vegetable production which are commonly demanded by Mapu-
to’s farmers are seeds, seedlings, pesticides, mineral fertilizers (urea, NPK), and poul-
try manure. A high share of available seeds and agrochemicals is imported, predomi-
nantly from neighboring South Africa. A number of formal agricultural retail stores, lo-
cated within the city limits, offer a diverse product range. Despite their existence, the
purchase of inputs from informal vendors is extremely widespread. These vendors are
not associated with private stores, but function as free agents who purchase and often
repackage products for resale. They may sell their products directly in the fields, on
streets, or markets (Schmidt 2017; Smart et al. 2016a). Smart et al. (2016a) report the
informal vendors’ market shares to be ca. 30% for seeds, 50% for pesticides, and ca.
90% for mineral fertilizer. Producers generally complain about the lack of transparency
associated with products bought from informal resellers. Reported cases include for
example low germination rates of seeds, wrong crop varieties, and ineffective or wrong
agrochemical products (Schmidt 2017). Nonetheless, these informal agents usually
offer the following advantageous services: (a) selling in close proximity to the farmers
fields, (b) offering products in smaller quantities, thus adjusted to small field sizes and
financial capacities of producers, (c) bridging supply gaps of formal input sources, and
(d) accepting delayed payment (Schmidt 2017). However, farmers are not completely
dependend on external agents for acquiring inputs. Many produce their own seedlings
from seeds or acquire them from peers. Some farmers of the Green Zones specialized
in producing and commercializing seedlings of the most common crops (Schmidt
2017). Partially, producers even obtain their own seeds from previous crop cycles. This
practice is quite common for kale and lettuce and may also be realized for other crops
(Patetsos et al. 2016; Schmidt 2017).
Most of the time, farmers sell their products at the farm gate, usually to informal inter-
mediaries. Ultimately, they supply the numerous formal and informal markets of the city
(Schmidt 2017; Smart et al. 2016a). Typical selling units for the main leafy vegetable
crops such as lettuce, kale and pumpkin leaves are entire raised beds, whereas many
other crops are sold in different quantity units. Prices are negotiated each time between
farmer and intermediary (Schmidt 2017). Some farmers have access to formal inter-
mediaries. Often this refers to individually operating agents, supplying restaurants, ho-
tels, or supermarkets (Schmidt 2017). Selling products directly at the cities wholesale
or retail markets and fairs is less common for farmers, due to a lack of required re-
sources, such as time, means of transport, or finances for market fees (Schmidt 2017;
Smart et al. 2016a).

27
3.4 Bio-Physical Context
The city of Maputo is located within an extensive low-lying coastal plain, commonly
known as Maputaland. Its geological development was characterized by recurring ma-
rine transgressions and regressions resulting in cycles of sedimentation and erosion.
As a consequence, the region is dominated by a series of north-south aligned dune
ridges parallel to the present day coastline, partly incised by river valleys (Kirkwood
n.d.). Following these general trends, the topography of central Maputo is character-
ized by the coastal plain of KaMavota to the east, which changes abruptly to a longitu-
dinal escarpment of NNE–SSW orientation. From this escarpment a flat highland of ca.
65 m altitude extends towards the west until it gradually descends to the Infulene river
valley at the margins of KaMubukwana (Vicente 2011). Figure 2 presents the geologi-
cal map of Maputo, illustrating the typical north-south aligned sequence of deposits.
The coastal plain of KaMavota is dominated by alluvial deposits, being fluvial dark
clays with intercalations of carbonaceous levels of marine origin. They are interspersed
with fine whitish dune sands of the Xefina formation. To the west, marked by the
straight escarpment, follows the interior dune of the Ponta Vermelha formation. It is
comprised of red to yellow silty sand. The Infulene river valley in KaMubukwana is part-
ly influenced by the western extremity of the Congolote formation, an interior dune of
poorly consolidated sands. In its center, the sandy clay intercalations of the Machava
formation dominate, and towards the south estuarine-marine deposits are prevalent.
Beneath all these different superficial sediments, lies a formation of calcareous to argil-
laceous sandstones. (Vicente 2011).
Following the Koeppen-Geiger classification, Maputo lies within the tropical savannah
climate type (Peel et al. 2007). The local climate is characterized by a clear seasonali-
ty, with a warmer rainy season between November and March, and a cooler dry sea-
son during the rest of the year. Average maximum temperatures don’t exceed 31°C
during the rainy season and average minimum temperatures don’t fall beneath 13°C
during July, the coolest month of the year. With ca. 800 mm of average annual rainfall,
Maputo is characterized by relatively dry conditions. Rain distribution can be highly
variable between individual years, with severe drought events generally occurring once
every 10 years. Other extreme weather events such as storms and cyclones do occa-
sionally occur. But natural disasters such as the major flooding of 2000, caused by cy-
clones and heavy rains, have to be regarded as exceptional. Nonetheless, prediction
models for future climate trends of the region suggest an increasing probability of in-
tensified rainfall events, decreased annual rainfall, higher temperatures, and storms
(Bacci 2014).

28
Figure 2: Geological map of Maputo (Vicente 2011)
Maputos’ hydrology is characterized by two main aquifers, the first being comprised by
the superficial dune formations, and the second by the underlying sandstone formation.
The latter is considered the main aquifer of the region, as being tapped by a great
share of the cities’ boreholes. The groundwater flow pattern follows closely the surface
water drainage pattern. That is, an eastern or western movement. The largest part of
the ground and drainage water thus flows either towards the Infulene river valley or the
coastal plain of KaMavota (Smidt et al. 1989; Vicente 2011). Here, groundwater tables
tend to be high, with the low lying areas regularly being inundated for parts of the year.
A basic drainage system exists in both Green Zones, but is insufficient to effectively
control water tables. In addition, its maintenance is neglected (Dykshoorn et al. 1988;
Eschweiler 1986; Matabeia 2015). Surface water draining from the central build up ar-
eas may cause soil erosion along the slopes of both Green Zones (Halder et al. 2018;
Tostao 2009; Vicente 2011). Due to its proximity to the sea, local aquifers are eviden-
tially influenced by saltwater intrusion, which affects specifically the coastal plain of

29
KaMavota and the Infulene river valley (Matsinhe et al. 2008; Smidt et al. 1989; Vicente
2011). Another important factor which influences the quality of Maputos’ water re-
sources are urban waste waters. Either of domestic, industrial, or agricultural origin,
they often remain untreated and follow the natural drainage patterns (Armazia et al.
2014; Chibantão 2012; Muchimbane 2010; Schmidt 2017; Vicente 2011), which leads,
inter alia, to increased nitrate concentrations within the catchment of the Green Zones
(Matsinhe et al. 2008).
In accordance with the geological and hydrological conditions, the soils of Maputos’
Green Zones are highly heterogeneous (Eschweiler 1986; Tostao 2009).The low lying
parts are characterized by darkish, clayey wetland soils, locally known as machongos.
Calcaric and Eutric Fluvisols are dominating, but locally peat soils are occurring (Histic
Fluvisols), and approaching the coast, higher salinity levels caused the development of
Gelyic Solonetz or Solonchaks. As ascending the slopes of the dunes at the Green
Zones’ margins, Gleyic, Albic and Cambic Arenosols become prevalent (Dykshoorn et
al. 1988; Eschweiler 1986; Gomes et al. 1998).
The original natural vegetation was characterized by open forest along the dune slopes
which gradually merged into wet grasslands towards the low lying areas (Eschweiler
1986). However, today only remnants of these vegetation formations are left, due to a
long history of agricultural use within this area. Especially the Infulene river valley is
exhaustively occupied by agricultural plots. Within the coastal plain of KaMavota great-
er areas towards the east are still covered by natural wet grasslands, owed to high wa-
ter tables and saline conditions (Eschweiler 1986; Tostao 2009). Generally speaking,
both Green Zones can be considered fairly well suited for agriculture, as apparent land
use suggests. Intensive vegetable production is prevailing, with kale, lettuce and
pumpkin leaves being the most important crops. Though, on the more sandy soils
farmers may be restricted to rain-fed agriculture of crops with lower water requirements
such as cassava, maize and cowpea. Another restriction is the high temperature and
humidity during the rainy season, which leads to an extensified use of many of the low
lying areas during this part of the year. With regard to local soil conditions, high as well
as low pH values, salinity, and sodicity are the most important constraining factors
(Eschweiler 1986; Schmidt 2017; Tostao 2009).
3.5 Soil Salinity as an Impairing Factor
First quantitative reports on soil salinity date back to the 1980s when local agronomic
suitability studies where executed by the Institute of Agrarian Research of Mozambique
(IIAM). These reports already indicate that considerable parts of the Infulene river val-

30
ley and the Green Zone of KaMavota are characterized by elevated salt and sodicity
levels. This, more specifically, refers to the low lying areas approaching the coast or
estuarine shore, where ECe values partly surpass 16 dS m-1 and ESP values may
reach up to 50%. Despite this general spatial gradient, a high local variability and
patchiness has been documented (Dykshoorn et al. 1988; Eschweiler 1986). More re-
cent soil surveys which have been conducted in the Infulene river valley, support these
pioneering findings (Matabeia 2015; Tostao 2009). Especially the study of Matabeia
(2015), using a systematic sampling approach, provided more detailed insights on the
spatial distribution and variability of soil salinity. The survey included the majority of the
Green Zone of KaMubukwana, covering in total an area of 335 hectares. Determined
ECe values for the upper 20 cm soil layer varied between 0.26 and 16.8 dS m-1, with an
average of 4.34 dS m-1. 37% of the surveyed area has been classified as moderately
saline (2-4 dS m-1) and another 35,5% as saline (4-8 dS m-1). Additionally, a general
trend of elevated salinity with increasing soil depth has been documented.
Apart from soil surveys, a limited number of water surveys exist, which can provide
useful information on the salinity levels of current or potential irrigation water sources of
the Green Zones. Armazia et al. (2014) documented that the waters of the Infulene
river are characterized by comparatively low salinity levels, only slightly surpassing
1.08 dS m-1. Sodium chloride was determined as the prevalent salt. Furthermore, a
clear trend of increasing salinity towards the estuary was demonstrated. Additional to
the main river water, Matabeia (2015) also considered samples from primary and sec-
ondary drainage channels, as well as water reservoirs within the Infulene river valley.
These findings suggest much higher salinity values for the local irrigation water
sources. Respective ECw values varied between 3.50 and 14.72 dS m-1, with an aver-
age of 6.30 dS m-1. Muchimbane (2010) investigated the water quality of several tube
wells within the western urbanized neighborhoods of KaMavota. This study revealed
that local ground water generally exhibits low to moderate salinity levels. Respective
ECw values varied between 0.35 and 3.20 dS m-1, with an average of 0.71 dS m-1. So-
dium chloride was determined as the prevalent salt. Furthermore, it was observed that
shallow wells exhibited a comparatively higher salt content. Even though the study lo-
cation didn’t cover the Green Zone of KaMavota itself, similar groundwater conditions
could be hypothesized for the nearby agriculturally used slope of the Ponta Vermelha
formation. There, self dug boreholes constitute the predominant source for irrigation
water. Looking at a broader scale, the studies of Smidt et al. (1989) and Matsinhe et al.
(2008) investigated the city wide groundwater resources. They state that especially the
coastal regions of KaMavota and KaMubukwana are affected by saltwater intrusion,
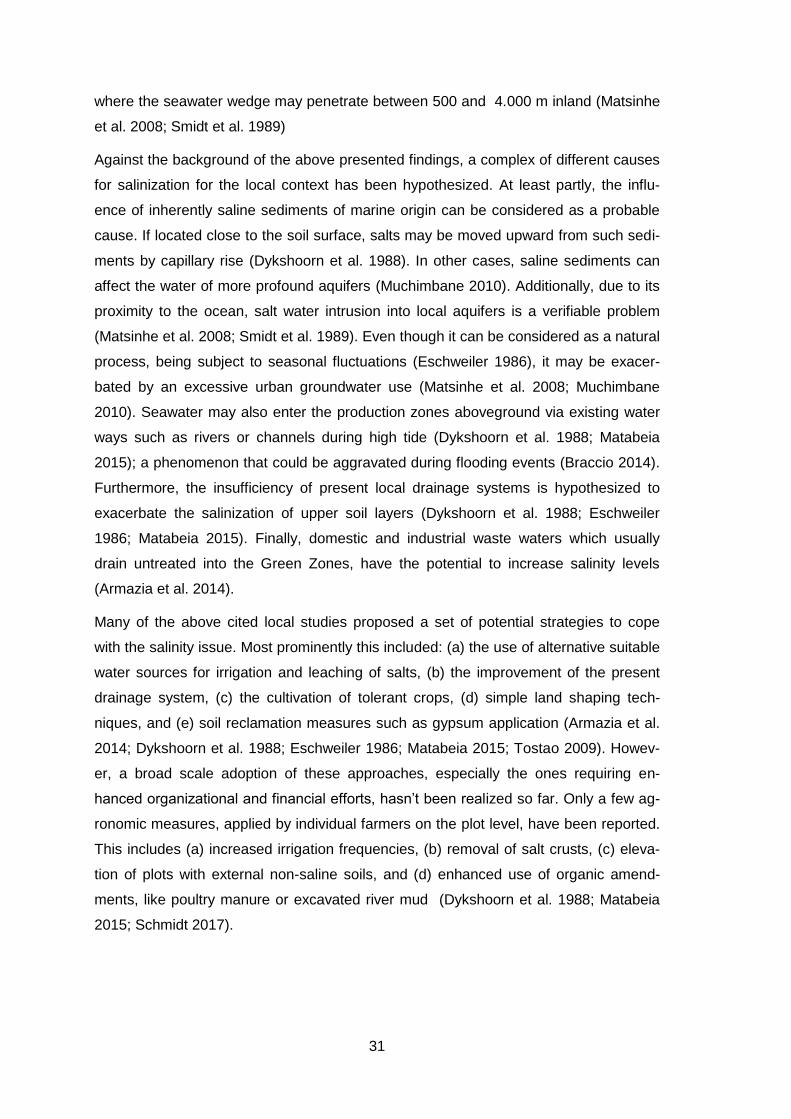
31
where the seawater wedge may penetrate between 500 and 4.000 m inland (Matsinhe
et al. 2008; Smidt et al. 1989)
Against the background of the above presented findings, a complex of different causes
for salinization for the local context has been hypothesized. At least partly, the influ-
ence of inherently saline sediments of marine origin can be considered as a probable
cause. If located close to the soil surface, salts may be moved upward from such sedi-
ments by capillary rise (Dykshoorn et al. 1988). In other cases, saline sediments can
affect the water of more profound aquifers (Muchimbane 2010). Additionally, due to its
proximity to the ocean, salt water intrusion into local aquifers is a verifiable problem
(Matsinhe et al. 2008; Smidt et al. 1989). Even though it can be considered as a natural
process, being subject to seasonal fluctuations (Eschweiler 1986), it may be exacer-
bated by an excessive urban groundwater use (Matsinhe et al. 2008; Muchimbane
2010). Seawater may also enter the production zones aboveground via existing water
ways such as rivers or channels during high tide (Dykshoorn et al. 1988; Matabeia
2015); a phenomenon that could be aggravated during flooding events (Braccio 2014).
Furthermore, the insufficiency of present local drainage systems is hypothesized to
exacerbate the salinization of upper soil layers (Dykshoorn et al. 1988; Eschweiler
1986; Matabeia 2015). Finally, domestic and industrial waste waters which usually
drain untreated into the Green Zones, have the potential to increase salinity levels
(Armazia et al. 2014).
Many of the above cited local studies proposed a set of potential strategies to cope
with the salinity issue. Most prominently this included: (a) the use of alternative suitable
water sources for irrigation and leaching of salts, (b) the improvement of the present
drainage system, (c) the cultivation of tolerant crops, (d) simple land shaping tech-
niques, and (e) soil reclamation measures such as gypsum application (Armazia et al.
2014; Dykshoorn et al. 1988; Eschweiler 1986; Matabeia 2015; Tostao 2009). Howev-
er, a broad scale adoption of these approaches, especially the ones requiring en-
hanced organizational and financial efforts, hasn’t been realized so far. Only a few ag-
ronomic measures, applied by individual farmers on the plot level, have been reported.
This includes (a) increased irrigation frequencies, (b) removal of salt crusts, (c) eleva-
tion of plots with external non-saline soils, and (d) enhanced use of organic amend-
ments, like poultry manure or excavated river mud (Dykshoorn et al. 1988; Matabeia
2015; Schmidt 2017).

32
4 Methodology and Research Process
Following the conceptual framework as outlined in chapter 1.2, the study was devised
as an exploratory case study (Yin 2018). It built on three complementary methodologi-
cal approaches, namely literature research, in-depth interviewing and field observa-
tions, as well as a participatory soil and water survey. The latter two have been con-
ducted during a field research phase realized between February and July 2018. The
overall research design thus may be classified as a sequential mixed-methods ap-
proach (Creswell et al. 2018). However, the qualitative component was dominating,
since emphasis was put on the aspect of interviewing and field observations (DeWalt et
al. 2011). Due to the studies’ exploratory nature, specific research methodologies
where occasionally modified during the field phase, responding to experienced difficul-
ties, or new information and insights gained (Neef et al. 2011). Therefore, not only the
respective procedures and techniques are outlined in the following sub-chapters, but
where appropriate, also explanations of their underlying rationales are given. This may
help to contextualize the here applied research methods and possible inherent limita-
tions. It may also provide suggestions for the design and implementation of future re-
search activities in similar contexts.
4.1 Literature Research
The research process was initiated with an extensive literature review, using Google
Scholar as the primary search engine. With the objective of providing profound themat-
ic contextualization for all following research phases, it focused on two main aspects:
(a) soil salinity in the context of vegetable production from an agronomic point of view,
and (b) the socio-economic and bio-physical environment of urban agriculture in Mapu-
to. Key word searching usually provided a primary pool of respective literature, from
where further references were traced. Due to a lack of formally published and peer
reviewed sources, the study of the second topic was primarily informed by grey litera-
ture, such as previous study reports and local degree theses. The review of relevant
literature continued throughout the research process. Especially during the field re-
search phase, locally available documents where sifted. The results of these review
efforts are presented, in a synthesized form, in the two preceding chapters.
4.2 Field Research Site
The establishment of contact to the envisaged research site was a rather lengthy and
formal process. Since the Green Zone of KaMubukwana recently has been studied with
regard to soil salinity (Matabeia 2015), it has been decided to focus on the vegetable

33
production areas of KaMavota. As a first step, the Casa Agraria of KaMavota, the local
municipal extension institution, was contacted. After a few introductory meetings, their
officials agreed to coordinate and assist my research activities. For an autonomous and
flexible research in the fields, representatives of the Casa Agraria had to further intro-
duce me to the local farmers associations operating in the research area. To avoid re-
peated lengthy introductory formalities, it has been decided to focus only on four of the
11 associations, namely Thomas Sankara, Costa do Sol, Graça Machel, and Lirandzo.
The decision was based on the common local perception that those are the associa-
tions substantially affected by soil salinity, while others are regarded to have only mar-
ginal problems (I27). Thus, after formally being introduced to the heads of the respec-
tive associations, interview dates with them were tried to arrange. Three out of the four
association heads could be interviewed between April 23 and April 30 2018 (I1; I2; I3).
These interviews constituted the starting point for further interviewing and field obser-
vation within the selected farming associations. Figure 3 depicts the locations of all
farmers associations within the Green Zone of KaMavota, while Table 3 provides basic
statistics of their respective size and number of members.
Figure 3: Geographic localization of the farmers associations of the Green Zone of KaMavota. The associ-
ations principally considered within this study are highlighted. Satellite image is based on Bing Maps data.

34
Table 3: Member and land statistics of the farmers associations of KaMavota. The associations principally
considered within this study are highlighted. Adapted from Schmidt (2017).
Association # members # men # women Area (ha) Area (ha) / person
Albazine 402 102 300 67 0.17
Costa do Sol 307 49 258 150 0.49
Djaulane 199 84 115 32 0.16
Eduardo Mondlane 887 50 835 37 0.04
Emilio Guebuza 1999 74 1925 129 0.06
Graça Machel 209 120 89 50 0.24
Joaquin Chissano 999 74 925 72,5 0.07
Lirandzo 718 252 466 106 0.15
Massacre de Mbuzirie 52 41 11 52 1.00
Samora Machel 1695 205 1490 106 0.06
Thomas Sankara 640 125 515 74 0.12
4.3 Interviewing and Field Observations
Sampling strategy. A purposive sampling approach, mixing snowball and conven-
ience sampling strategies, was applied (Cox 2015). Interviewed farmers regularly sug-
gested further potential informants. Additionally, some people were approached during
field walks. In general, the selection of informants among the farmers was biased to-
wards people who were (a) conversant in Portuguese, (b) willing to spare time for inter-
viewing or informal conversation, (c) working in the fields on a regular basis, and (d)
having personal experience with conducting agricultural activities within the local salt-
affected areas. Therefore, the acquired sample cannot be regarded as representative
for the overall farming community. Nonetheless, given the research objective of initially
exploring principal domains of local knowledge and perception, purposive sampling of
key informants, who are knowledgeable of the respective topic, can be regarded as a
legitimate and viable strategy (Bernard 2011). Interviews amongst farmers and field
observation were periodically conducted throughout the remaining field research
phase, between May and July 2018. It took place almost exclusively within the limits of
the four selected farmers associations. To also explore relevant knowledge and per-
ception of other local stakeholder groups, additional interviews were conducted with
extension workers, input providers, agronomic technicians and scientists, as well as
representatives of relevant municipal agencies. These informants have been ap-
proached on the basis of snowball sampling, with initial hints and suggestions always
coming either from farmers or representatives of the Casa Agraria in KaMavota. Annex
II provides an index of all informants, who were considered within the frame of this
study. The there indicated personal code is consistently used as an identifier through-
out this work.

35
Data collection. In the beginning, farmer informants were formally interviewed in a
semi-structured manner, using a print of guiding questions. Notes were immediately
taken. Three of the first interviews were also recorded, using a mobile voice recording
application. Since I repeatedly realized the informant’s reluctance of sitting down to
talk, mainly due to time constraints, and also of being recorded, I decided to shift the
interview format. I continued by using a rather informal conversational style, sometimes
approaching the same informants several times throughout repeated field visits. But
still, the key guiding questions were always tried to be addressed. Notes were taken
immediately after every conversation. Through this strategy, it appeared that I gained
rapport, and thus informants were more willing to share insights.
This approach was well combinable with conducting in depth field observations in the
research area. Repeated field visits were realized throughout the field research phase,
often several times a week. It involved passive observation, as well as interaction with
farmers, either in the form of informal conversations, as described above, or as guided
field walks (Bernard 2011; DeWalt et al. 2011). These activities were motivated by the
following objectives: (a) to confirm information communicated through interviews and
thus to reveal more implicit aspects of local knowledge and practice, (b) to document
farming practices in designated salt affected areas, and (c) to grasp the spatial dimen-
sions of relevant local knowledge and perception. Notes as well as photos were taken
during all field visits. Additionally, the mobile GIS application SW Maps (Malla 2018)
was used to record GPS coordinates of interest.
The guiding questions for the farmer interviews and conversations were prespecified,
following the analytical units proposed by Pulido et al. (2014). An adapted guide was
also used for the interviews with the extension personal, which were strictly conducted
in a semi-structured manner. When the informants accepted, the interview was record-
ed as described above. The complete interview guides for farmers and extension
workers are provided under Annex III. All other stakeholders involved were interviewed
in an unstructured, open-ended manner. The conversations usually evolved around the
general topic of soil salinity, and interviewees shared their respective knowledge and
perceptions. When novel relevant aspects came up, I tried to follow-up on them during
the interview. The conversations were not recorded, but notes were taken during and
right after every session.
Data analysis and presentation. As a first analyzing step, all audio recordings were
transcribed, and field notes transmitted to a digital format. Thereupon, these text doc-
uments were screened and coded deductively, working with the guiding themes
prespecified by the principal analytical units and guiding questions. As a next step, the

36
texts were coded inductively for additional topics and themes that came up during the
research process without initially being targeted by the author (Creswell et al. 2018;
DeWalt et al. 2011). Annex IV provides the resulting code book, which constituted the
basis for conclusive analysis. The thus carved out topics and themes are presented in
a narrative format, occasionally complemented with insights from the literature review.
Additionally, photographs and comprehensive tabular summaries are used to substan-
tiate and visualize the presented information (chapter 5.1 – 5.4).
4.4 Participatory Soil and Water Survey
Sampling strategy. Due to resource constraints, a survey comprehensively covering
the entire Green Zone of KaMavota was not feasible. Therefore, it was decided to fo-
cus on a restricted area, covering the farmers associations of Thomas Sankara and
Costa do Sol. The selection of individual sampling locations was guided by local farm-
ers’ perception on the spatial dimensions of soil salinity. Within the frame of interviews
and field walks, farmers consistently described soil salinity within the Green Zone of
KaMavota to follow a clear spatial gradient of increasing intensity towards the coast. To
confirm this observation, and in order to have a clearer geographical reference of the
farmers’ perception, a participatory mapping workshop was conducted on July 03 2018.
Seven representatives of the associations Thomas Sankara and Costa do Sol where
respectively involved. Participants were asked to discuss and define zones of differing
soil salinity level and to draw them on transparencies overlaid on an aerial photograph
of the study area. For a better orientation, points of reference where previously high-
lighted (Oudwater et al. 2003). The mapping activity confirmed the previous assertions.
Five distinctive soil salinity levels where defined and described as clear consecutive
strips oriented towards the coast. Following the farmers’ outline, eight parallel soil
sampling transects where defined. The distance between individual transects account-
ed for 200 m. Every transect comprised five sampling points with a consistent distance
of 200 m, each representing one of the farmers’ soil salinity categories. Consequently,
the survey followed a systematic grid based sampling strategy (Hanson et al. 2012;
Pennock et al. 2007). It covered an area of 135 ha (Figure 4).
Data collection. The sample grid was prepared in QGIS 2.18 (QGIS 2016) and up-
loaded into the mobile GIS application SW Maps (Malla 2018). The application was
used to locate the GPS coordinates of the defined sample positions in the field. A GPS
accuracy of ≤5 m was ensured. If the predefined location was not accessible, a spot as
close as possible was chosen and the respective GPS coordinates were recorded with
the SW Maps application. Samples were collected on four different days, between July
06 and July 11 2018. A conventional soil auger was used to collect the soil samples.

37
Five random extractions were taken within a 5 m radius around the sample location to
form a composite sample; for two sampling depths respectively (0-20 and 20-40 cm).
Soil from the extractions was mixed by hand and a share of ca. 400 ml filled into a plas-
tic bag for transport. If an irrigation water source (borehole, channel) was adjacent to
the sample location, a water sample was taken. The water samples were collected in
sealable plastic cups. Throughout transport and storage before analysis they were
cooled on ice.
Figure 4: Geographic localization of the soil and water survey sample locations within the Green Zone of
KaMavota. A systematic sample grid was designed, following the five farmers’ soil salinity categories
which have been described as clear consecutive strips; where a = non-saline, b = slightly saline (25-50%
yield loss), c = saline (50-75% yield loss), d = too saline for crop production (75-100% yield loss), e=highly
saline. Numbers indicate the sample ID. Satellite image is based on Bing Maps data.
Data analysis and presentation. The analysis of all soil and water samples was con-
ducted at the soil and water laboratory of the University Eduardo Mondlane in Maputo
(UEM), following the local analysis conventions as described by Geurts (1996) and
Wijnhoud (1997). Prior to any processing, the texture class of individual soil samples
was determined by hand analysis. Afterwards, the soil samples were oven dried,
passed through a 2 mm sieve, and stored for further analysis. EC of the soil samples
where determined on a 1:2.5 soil-water-suspension, using a digital EC meter (Wijnhoud
1997). A conversion from EC1:2.5 to ECe values was calculated, based on the samples’
texture class, following the conversion factors provided by Serno et al. (1989). Shortly
Thomas Sankara
Costa do Sol

38
before analysis, water samples were removed from the fridge to converge to air tem-
perature. ECw of the water samples was directly measured using a digital EC meter.
Spatial analysis and visualization of the data was realized with QGIS (QGIS 2016). All
statistical tests and data visualizations were performed using the RStudio environment
(RStudio 2016), including the packages ggplot2 (Wickham 2016), reshape (Wickham
2007) and agricolae (Mendiburu 2010).
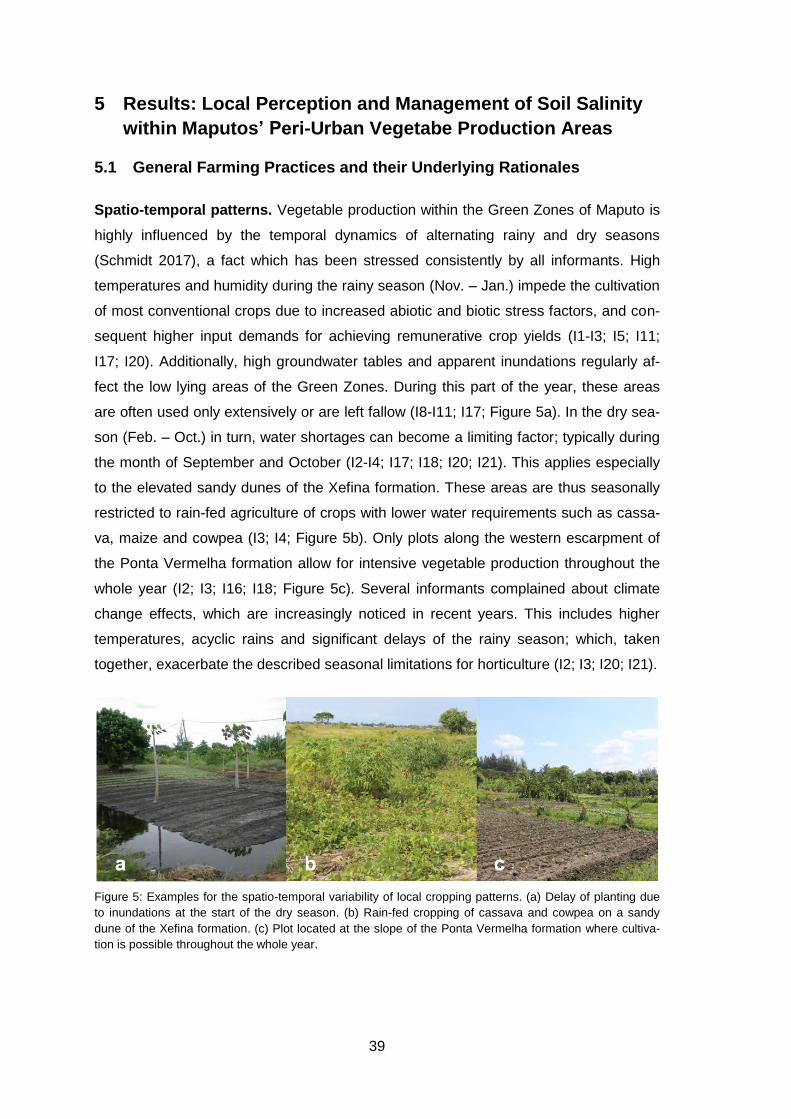
39
5 Results: Local Perception and Management of Soil Salinity
within Maputos’ Peri-Urban Vegetabe Production Areas
5.1 General Farming Practices and their Underlying Rationales
Spatio-temporal patterns. Vegetable production within the Green Zones of Maputo is
highly influenced by the temporal dynamics of alternating rainy and dry seasons
(Schmidt 2017), a fact which has been stressed consistently by all informants. High
temperatures and humidity during the rainy season (Nov. – Jan.) impede the cultivation
of most conventional crops due to increased abiotic and biotic stress factors, and con-
sequent higher input demands for achieving remunerative crop yields (I1-I3; I5; I11;
I17; I20). Additionally, high groundwater tables and apparent inundations regularly af-
fect the low lying areas of the Green Zones. During this part of the year, these areas
are often used only extensively or are left fallow (I8-I11; I17; Figure 5a). In the dry sea-
son (Feb. – Oct.) in turn, water shortages can become a limiting factor; typically during
the month of September and October (I2-I4; I17; I18; I20; I21). This applies especially
to the elevated sandy dunes of the Xefina formation. These areas are thus seasonally
restricted to rain-fed agriculture of crops with lower water requirements such as cassa-
va, maize and cowpea (I3; I4; Figure 5b). Only plots along the western escarpment of
the Ponta Vermelha formation allow for intensive vegetable production throughout the
whole year (I2; I3; I16; I18; Figure 5c). Several informants complained about climate
change effects, which are increasingly noticed in recent years. This includes higher
temperatures, acyclic rains and significant delays of the rainy season; which, taken
together, exacerbate the described seasonal limitations for horticulture (I2; I3; I20; I21).
Figure 5: Examples for the spatio-temporal variability of local cropping patterns. (a) Delay of planting due
to inundations at the start of the dry season. (b) Rain-fed cropping of cassava and cowpea on a sandy
dune of the Xefina formation. (c) Plot located at the slope of the Ponta Vermelha formation where cultiva-
tion is possible throughout the whole year.

40
Crop diversity. Crops dominating the local production systems are vegetables with a
short shelf live, primarily leafy vegetables. As confirmed by all informants, the by far
most important crops grown and commercialized are kale and lettuce. According to
Smart et al. (2016a) nearly 90% of all farmers produce and sell both of these crops
during the dry season. In the rainy season, the respective shares are still above 50%.
Irrespective of the season, other important commercialized crops are pumpkin leaves,
beet root, onion, cabbage, tomato, and carrot (Smart et al. 2016a). Apart from that,
there exists a great variety of complementing crops; including indigenous vegetables,
tuber crops, and fruit trees. A comprehensive list of all the crop species identified dur-
ing the field observations is presented in Annex V.
There is a complex of reasons which explains the paramount dominance of kale and
lettuce. According to Smart (2016), these are the crops with the comparatively highest
gross margins per square meter. Even though their production involves high input
costs, a stable market demand generally allows for an assured turnover (Smart 2016).
An additional motivation for farmers to concentrate on these two crops are their short
cropping cycles of ca. 30-45 days, since this allows for income in regular intervals.
While this aspect was not explicitly mentioned by the interviewed farmers, one exten-
sion worker stressed it as one of the most important motives (I18); and it has been pre-
viously stated by Barghusen et al. (2016) and Schmidt (2017). Crop diversity as applied
by individual producers is highly determined by their respective degree of overall re-
source endowment. Farmers with larger landholdings, and higher financial and techno-
logical capacity have been found to generally diversify their production patterns, espe-
cially by including high value crops such as cabbage, tomato, green pepper, carrot,
beet root, or cucumber (Sitoe 2016; Smart et al. 2016a). They also tend to include
more non-horticultural crops (Smart et al. 2016b). These previous findings have been
repeatedly confirmed through implicit accounts of the informants and field observations
(I1; I3; I4; I15; I8; Figure 6). Next to resource constraints, another factor that keeps
producers from cultivating more valuable crops, is the possibility of theft, since plots are
not properly fenced and are usually left unguarded during the night (I4; I11; Schmidt
2017). However, production is not purely commercially motivated. Almost all farmers
also consume their own vegetables (Paganini et al. 2019). Thus, crop choice is not only
determined by market demand, but also by personal preferences (I1; I8).
Information regarding the diversity on the varietal level tends to be opaque. The inter-
views revealed that farmers often don’t know the official name of the varieties they are
cultivating, but use colloquial names to refer to them (Schmidt 2017). Partly, this may
be explained by the significance of informal seed vendors who often can’t provide reli-
able respective information (I2-I4). Additionally, in-field seed production of lettuce and

41
brassica crops and consequent cross pollination complicate the situation (I8; I9; I30).
Nonetheless, a rough varietal pattern for the two main crops can be described. Kale
varieties found in the Green Zones are almost exclusively of the Tronchuda type, as
was confirmed by all informants (Figure 7a). Kale of the Galega type is occasionally
cultivated, but is of minor significance with regard to its production and commercializa-
tion (I1). Lettuce is found in greater diversity. Farmers and even extension workers
generally had difficulties of clearly naming and distinguishing individual varieties. Inter-
views with agricultural input providers and personal field observation revealed that va-
rieties of the Iceberg and Bativa groups are dominating (I28- I30; Figure 7b and c).
Most common is the Iceberg-variety Great Lakes (I28-I31). It is said to be well adapted
to the local environmental conditions and additionally demonstrates a long shelf life,
which makes it attractive for producers and market vendors alike (I11, I19).
Figure 6: Contrasting crop diversity between individual producers. (a) A plot with a high crop diversity,
including, next to kale and lettuce, also beetroot, pak choi, Swiss chard, leaf mustard, and eggplant. The
farmer cultivates several extensive plots, has a comparatively high financial capacity, and profits from
diverse direct marketing channels (I8). (b) A small plot exclusively cropped with kale and lettuce. The own-
er is restricted to this single plot and has an overall low resource endowment (I14).
Figure 7: Typical local kale and lettuce varieties. (a) Kale of the Tronchuda type. (b) Lettuce variety Great
Lakes, belonging to the Iceberg group. (c) Lettuce varieties of the Bativa group, locally refered to as
"yellow and purple lettuce” (port. “alface amarela” and “alface roxa”).
42
Cropping patterns. Farmers’ plots are usually divided into separate raised beds of ca.
1.5 m width and varying length, usually accounting for 5 to 9 m2 (personal observation
at plots of I7-I12, I14). Generally, these beds are dominated by a specific main crop.
Occasionally, widely spaced intercrops are integrated. This may include purposively
planted crops such as okra, maize, tomato or eggplant, or spontaneously emerging and
tolerated crops such as amaranth or New Zealand spinach. More intensive forms of
intercropping are rare. Perennial crops like sugar cane, banana, or fruit trees are often
found to mark plot limits as natural fences. Occasionally, a few papaya trees are
spaced over the plot, providing shade for the vegetable crops (personal observation;
see also Barghusen et al. 2016 and Schmidt 2017). Planting distances of the main
crops lettuce and kale range from 17 to 30 cm between individual plants. Planting in
strict rows is not common (personal observation at plots of I7-I12, I14). The failure rate
of transplanted seedlings is estimated to range between 20 and 50% (Schmidt 2017).
Consequently, replanting to close gaps in crop stands has been stated to be a common
practice (I9; I10; I14). Systematic crop rotations are barely applied by farmers. Main
commercial crops such as kale or lettuce can be found to be cultivated for several suc-
cessive cropping cycles (Schmidt 2017).
Several informants stressed that the length of individual cropping cycles can be quite
flexible, as explained by the following rationales. To be sold to the intermediaries, indi-
vidual beds of leafy vegetables must be characterized by a closed crop stand and an
overall appealing appearance. Since size or weight of individual plants are of lesser
importance with regard to these crops, farmers often opt for closer planting densities.
Thus, they are able to reduce the time span between planting and harvest down to 30
days (I22). However, the occurrence of biotic or abiotic stresses may impair crop de-
velopment and thus prolong cropping cycles (I1; I8). Additionally, in the case of periodic
oversupply, crops can hardly be sold and optimal harvest dates may be surpassed (I9;
I11; I14). According to Sambo (2016), local producers achieve 3 to 4 cropping cycles
per year, on average. However, in advantageous locations, where year round produc-
tion is possible, up to 8 yields may be attained.
Plant protection. Although not directly probed for during the interviews, many inform-
ants consistently stated pests and diseases as one of the major challenges to vegeta-
ble production. Farmers and extension workers are primarily aware of the diamondback
moth Plutella xylostella and the silverleaf whitefly Bemisia tabaci (I1; I3; I4). However,
as previous studies demonstrated, many other pests and diseases are of additional
relevance (Schmidt 2017; Tostao 2009). According to Cachomba et al. (2016), synthet-
ic pesticides are used by nearly 100% of the farmers. Alternative pest control methods
are of minor importance, being applied by less than 10%. Commercial pesticides thus

43
generally account for a significant share of the farmers total input costs (Smart et al.
2016a). The most widely used substance is the highly toxic Methamidophos
(Cachomba et al. 2016). Pesticides are applied excessively, usually in intervals of 7 to
14 days (Schmidt 2017). Even though farmers commonly perceive all pesticides as
highly toxic to humans, their handling is often imprudent. The consistent use of protec-
tive clothing is not widespread, spraying equipment is washed in on-farm water
sources, and empty pesticide bottles are dumped locally (Cachomba et al. 2016).
Soil and fertility management. Tillage and other soil management activities are gen-
erally realized manually with hoes, as all informants consistently stated. Mechanized
tillage is practically nonexistent within Maputos’ Green Zones (Barghusen et al. 2016).
If plots are seasonally left fallow, clearing of the field is realized after the rainy season
as soon as the hydrological conditions allow for it. Proper tillage is preceded by manual
weeding or burning of the emerged vegetation (I2-I4; I17-I19; personal observation;
Figure 8a and b). According to Paganini et al. (2019) and Tostao (2009), nearly 100%
of farmers use mineral fertilizers as well as organic manures. Urea and chicken manure
are the most common products. They were consistently named by all informants. NPK
is of lower significance among the small vegetable growers. It is mainly applied by
farmers with larger landholdings which also grow staple crops (I3; I16; I18; I19). Chick-
en manure is usually applied a few days after transplanting on top of the raised beds.
The same holds true for urea (I1; I3; I4; I16-I19; Figure 8c). Concrete application pat-
terns of these major fertilizers seem to vary significantly, depending on farmers’ habits
and current access to inputs. But generally, application rates range from 0.5 to 2 times
per cropping cycle (personal observation at plots of I7-I12; I14). A few farmers stressed
the importance of avoiding fertilization shortly before harvesting to prevent nitrate
linked antinutritive effects (I5; I9). Regarding the concrete quantities applied at each
fertilizing event, an even greater variability exists. Here also, farmers’ habits and ac-
cess to inputs seem to be decisive (personal observation).
Figure 8: Local soil and fertility management. (a) Freshly tilled plot. (b) Burned vegetation before tillage. (c)
Chicken manure applied on top of raised beds planted with lettuce.

44
Apart from commercial fertilizers, green manuring with local crop residues and weeded
plant material is a common practice and was consistently mentioned by all informants
(see also Barghusen et al. 2016 and Schmidt 2017). It predominantly takes place at the
beginning of the growing season when plots are cleared for cultivation, but occasionally
also throughout the year between individual cropping cycles (personal observation).
Further soil amendments utilized are ashes and charcoal residues, groundnut husks or
similar organic household wastes, and azolla waterfern (Azolla spp.) collected from
channels and boreholes (personal observation). Mulching with dried plant residues is
occasionally practiced (personal observation; see also Barghusen et al. 2016). Howev-
er, it is mainly restricted to stoolbeds, where its main function is physical protection (I3;
I17).
Irrigation management. According to Paganini et al. (2019) and Smart et al. (2016a),
nearly 100% of the local producers use solely manual irrigation mechanisms, that is,
watering cans (Figure 9a). Mechanized forms of irrigation, including the use of water
pumps, are restricted to very few producers in the Green Zones of Maputo; a fact which
has been consistently confirmed by all informants. Typical irrigation water sources are
natural watercourses, drainage channels, or individually dug and maintained boreholes
(Figure 9b and c). In KaMavota, the latter are of major importance and each plot is ad-
jacent to at least one (personal observation; see also Barghusen et al. 2016 and
Schmidt 2017). Irrigation patterns are quite individual and heavily depend on current
weather conditions which determine the degree of evapo-transpiration. The common
leafy vegetable crops generally require an elevated irrigation intensity (I8; I22). Against
this background, watering rates may range from 0,5 to 2 times per day (personal ob-
servation at plots of I7-I12; I14; see also Schmidt 2017). All informants confirmed that
the water is commonly applied above the crops’ canopy. Even though some farmers
acknowledged negative consequences of this practice, they stated convenience and
time constraints as reasons for its application (I1-I5; I18).
Figure 9: Local irrigation management. (a) Farmer using watering cans for irrigating her crops. (b) Drain-
age channel with adjacent vegetable plot. (c) Manually dug borehole.

45
Extension work. As alluded to in chapter 3, the extension services active in Maputos’
Green Zones try to persuade producers to modify their habitual agronomic practices.
This is being done through regular and extensive field work; either in the form of en-
quired field visits to individual farmers, or through the mentoring of demonstration plots
and farmer field schools (I16-I18; I21; Figure 10). ABIODES primarily works in close
contact with individual producers who show an interest in converting towards agro-
ecological farming practices (I16; I20; I24). Effective plant protection, as well as the
rationalized use of synthetic pesticides and mineral fertilizers was a concern to all in-
terviewed extension workers. Other target aspects mentioned by individual informants
included in field testing of different crop varieties (I16; I17; I21), promotion of improved
irrigation systems (I18-I21), and encouragement to jointly coordinated tillage which
would render the use of rented machinery feasible (I18). Especially representatives of
ABIODES further emphasized the promotion of biofertilizers and biopesticides, im-
proved green manuring techniques, on site composting, and mulching (I16; I20; I24;
see also Patetsos et al. 2016; Paganini et al. 2018b; Haber et al. 2015).
Figure 10: Local extension activities. (a) Joint work assignment at a demonstration plot, led by extension
personal of the Casa Agraria. (b) Demonstration of the preparation of liquid biofertilizer on the basis of
animal manures, led by extension workers of ABIODES.
Despite the above mentioned efforts, so far, adoption rates of the respective approach-
es are low. This was admitted by all interviewed extension workers. Different reasons
for this situation have been stated. On the one hand, extension personal referred to the
durability of farmers’ habits and believes (I16; I18-I20). Especially the fact that exten-
sion personal is primarily of younger age, was stated to be a constraint, since the elder-
ly farmers are said to question their experience and credibility (I16; I18; I19). On the
other hand, several extension workers acknowledged that at least some of the promot-
ed approaches are not feasible under the current socio-economic conditions. Especial-
ly financial and time constraints were mentioned as limiting factors (I18; I20; I21). The
latter aspect was repeatedly stressed by the farmers themselves (I1; I4; I11; I12; I14).

46
5.2 Local Indicators for Soil Salinity and Economic Evaluation
A total of 8 farmers and 6 extension workers have been directly probed towards specif-
ic bio-physical soil salinity indicators (I1-I6; I11; I12; I16-I21). Apart from that, several
interviews revealed that farmers often implicitly evaluate the state of salinity in econom-
ic terms. Table 4 summarizes the different indicators and economic evaluation catego-
ries.
Table 4: Local bio-physical soil salinity indicators and economic evaluation categories for soil salinity.
Indicators Explanations
Bio-Physical
Plant symptoms leaf yellowing, stunted plant growth, dying off of seedlings, consequent
non-uniform and patchy crop stands
Salt crust on soil surface are said to develop after watering of plants, or under conditions of high
groundwater tables
Taste of soil or water if pronounced, salinity can be tasted by tongue
Soil color whitish or grayish soils are associated with salinity
Soil structure ascribed to salinity are low infiltration rates and granular properties
Indicator plants indicators for saline conditions: Sporobolus virginicus, Salicornia
meyeriana, indicator for favorable soil conditions: Centella asiatica
Economic
Net yield / income reduced crop yields in quantitative and qualitative terms impair the
annual income
Gross yield / income implementation of coping strategies involves increased input costs,
which consequently implies reduced gross productivity
All probed informants mentioned plant symptoms as the most important indicator. Leaf
yellowing, stunted plant growth, dying off of seedlings, and consequent non-uniform
and patchy crop stands are generally related to soil salinity by the interviewees (Figure
11a-c). Another common way of detecting the presence of salt is through observation
of salt crusts (Figure 11d-e). They are said to develop spontaneously, especially after
irrigation measures and during the rainy season when groundwater tables are high (I1-
I6; I11; I16-I21). One aspect mentioned by several farmers, but only by one extension
worker was the tasting of soil and irrigation water to determine if elevated salt levels
are present (I3-I5; I11; I12; I18).
Other detection methods, apart from these commonly used indicators, were mentioned
rarely, often just by one respondent respectively. One farmer mentioned a grayish to
whitish soil color as an indicator for salinity (I11). Another farmer said that he could

47
“feel and hear” the salt when working the soil with his hands, due to the distinctive
granular properties he ascribed to salt affected soils (I5). One extension worker, which
also has been farming for many years in KaMavota, pointed out the low infiltration ca-
pacity of saline soils (I17). During a field walk, the use of indicator plants has been de-
scribed (I6). According to the informant, the presence of Centella asiatica signals good
overall soil conditions, whereas Sporobolus virginicus and Salicornia meyeriana are
clear signs for saline conditions. Especially extension workers complained about the
lack of infrastructure to realize technical salinity measurements (I2; I18; I19). Theoreti-
cally, soil samples could be sent for analysis to the nearby laboratories of the UEM and
the IIAM, but the costs are generally too high to be afforded by individual farmers,
farmers associations, or the Casas Agrarias (I19).
Figure 11: Locally used soil salinity indicators: (a) Leaf boarder chlorosis on lettuce, (b) Leaf yellowing and
stunted growth on kale, (c) Non-uniform crop stand of kale. (d) Salt crust and dry cracks next to a borehole
used as an irrigation source. (e) Fine salt crust on raised bed planted with cilantro. (f) Dense cover of
Sporobolus virginicus, a halophytic grass.
An aspect which was rather implicitly communicated by farmers and extension person-
al was that, in the long term, soil salinity levels are evaluated on the overall productivity
of individual plots. Farmers would often express the effects of salinity in estimated per-
cent of yield loss. Respective estimates ranged from 30 up to 90% (I1; I3; I16; I17; I19;
I20). What frames this logic is a commonly shared categorization of the local land re-
sources into non-saline, intermediate, and salt-affected areas. Informants often referred
to comparative observations they have made between these categories (I1; I4; I6; I7;
48
I8; I17; I18; I19; see also chapter 5.5). Average yield levels of the non-saline plots are
used as reference points. What facilitates such direct comparisons is the geographical
proximity of non-saline and salt-affected areas, as well as the fact that individual farm-
ers often cultivate plots in both of these environments (I1; I4; I7; I8; I11; I13). Farmers
stressed that salinity induced yield loss is not necessarily confined to a reduced quanti-
ty of produce for a respective cropping cycle. The typical leaf yellowing and non-
uniform patchy crop stands also lead to a reduced marketable quality. Within the local
marketing frameworks, this consequently implies that individual raised beds may not be
accepted by intermediaries if their overall appearance is too much affected (I4; I5; I8;
I9; I10; I11; I14). One producer complained that due to this fact he often just sells three
quarters of his kale and lettuce crops (I5). Another aspect is the slowed crop develop-
ment caused by soil salinity (I1; I2; I4; I8; I11). One farmer emphasized, that due to
this, she occasionally just realizes three instead of four cropping cycles of lettuce per
season (I1).
The majority of informants pointed out that the negative effects of soil salinity could be
mitigated by certain agronomic measures, most prominently the consistent application
of organic soil amendments (see chapter 5.4). This implies increased input costs,
which consequently reduce the gross productivity of the local agricultural activity (I4; I5;
I10; I12; I18; I20). One farmer, for example, stated that she uses twice the amount of
chicken manure per land unit on her salt-effected plot compared to her non-saline fields
in order to achieve comparable yields for kale and lettuce (I7). Other informants
stressed that soil salinity, even when met with the local coping strategies, impedes the
cultivation of certain crop species. Therefore, certain high value crops such as green
beans or cucumber are out of reach for affected producers (I7; I8; I16; I17). Against this
background, it can be concluded that producers evaluate the effects of soil salinity not
just in terms of individual crop yields. They are well aware of the overall economic im-
plications it has for their farming activities.
5.3 Local Perception on Significance, Causes, and Spatio-Temporal Dy-
namics of Soil Salinity
Interviews with farmers and extension workers usually were opened with questions
targeting the perceptions on the overall agro-ecological conditions and related con-
straints. This revealed that soil salinity generally is not perceived as the main limiting
factor to crop production amongst the local farmers. It appeared that seasonal excess
or lack of water, pests and diseases, as well as constrained access to quality agricul-
tural inputs are regarded as more noteworthy (I2; I3; I4; I18; I21). This is also reflected
in the fact, that soil salinity is not specifically targeted by any of the local extension pro-
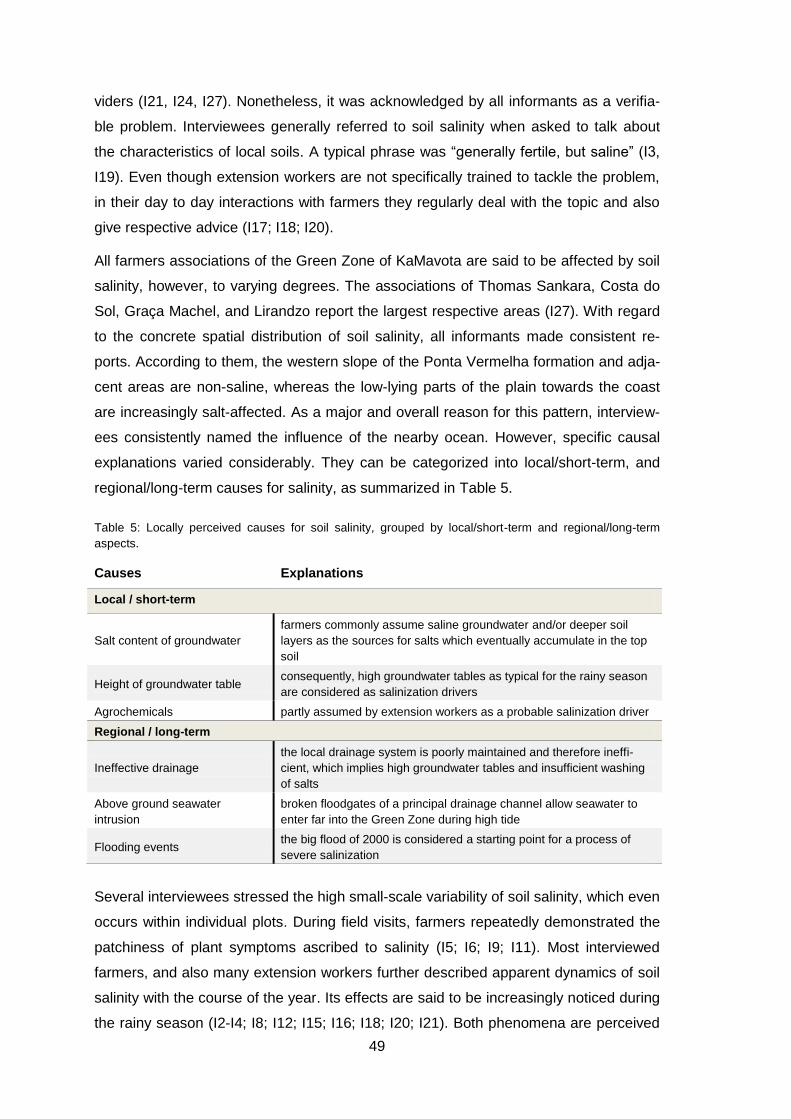
49
viders (I21, I24, I27). Nonetheless, it was acknowledged by all informants as a verifia-
ble problem. Interviewees generally referred to soil salinity when asked to talk about
the characteristics of local soils. A typical phrase was “generally fertile, but saline” (I3,
I19). Even though extension workers are not specifically trained to tackle the problem,
in their day to day interactions with farmers they regularly deal with the topic and also
give respective advice (I17; I18; I20).
All farmers associations of the Green Zone of KaMavota are said to be affected by soil
salinity, however, to varying degrees. The associations of Thomas Sankara, Costa do
Sol, Graça Machel, and Lirandzo report the largest respective areas (I27). With regard
to the concrete spatial distribution of soil salinity, all informants made consistent re-
ports. According to them, the western slope of the Ponta Vermelha formation and adja-
cent areas are non-saline, whereas the low-lying parts of the plain towards the coast
are increasingly salt-affected. As a major and overall reason for this pattern, interview-
ees consistently named the influence of the nearby ocean. However, specific causal
explanations varied considerably. They can be categorized into local/short-term, and
regional/long-term causes for salinity, as summarized in Table 5.
Table 5: Locally perceived causes for soil salinity, grouped by local/short-term and regional/long-term
aspects.
Causes Explanations
Local / short-term
Salt content of groundwater
farmers commonly assume saline groundwater and/or deeper soil
layers as the sources for salts which eventually accumulate in the top
soil
Height of groundwater table consequently, high groundwater tables as typical for the rainy season
are considered as salinization drivers
Agrochemicals partly assumed by extension workers as a probable salinization driver
Regional / long-term
Ineffective drainage
the local drainage system is poorly maintained and therefore ineffi-
cient, which implies high groundwater tables and insufficient washing
of salts
Above ground seawater
intrusion
broken floodgates of a principal drainage channel allow seawater to
enter far into the Green Zone during high tide
Flooding events the big flood of 2000 is considered a starting point for a process of
severe salinization
Several interviewees stressed the high small-scale variability of soil salinity, which even
occurs within individual plots. During field visits, farmers repeatedly demonstrated the
patchiness of plant symptoms ascribed to salinity (I5; I6; I9; I11). Most interviewed
farmers, and also many extension workers further described apparent dynamics of soil
salinity with the course of the year. Its effects are said to be increasingly noticed during
the rainy season (I2-I4; I8; I12; I15; I16; I18; I20; I21). Both phenomena are perceived

50
to be linked to the spatio-temporal fluctuations of the local hydrological pattern. A recur-
ring colloquial explanation was that the fresh water entering in the wake of the rainy
season would mix with the salts from deeper soil layers and transport it upwards with
rising groundwater tables (I1; I4; I8; I9; I12; I16; I17; I19-I21). Thus, farmers perceive a
causal relationship between the salt content of the groundwater as well as its distance
to the soil surface, and the salinization of upper soil layers.
Only isolated cases contradict this overall narrative. One farmer, for example, stated
that on her plots the effects of salinity would be enhanced during the dry season (I15).
In a similar vein, one extension worker questioned the common perception. He argues
that farmers would interpret constrained crop growth during the wet season misleading-
ly as a result of salinity. According to him, other stress factors such as heat, water log-
ging and diseases would be more relevant with regard to the observed symptoms. Sa-
linity levels within the upper soil layers actually should be higher during the dry season,
since then a lack of rain would prevent a regular leaching of salts (I18; see also
Schmidt 2017). Without being fully confident about it, a few informants, mainly exten-
sion workers, stated that the intensive use of synthetic pesticides and mineral fertilizers
could be additional drivers for salinization (I12; I16; I18; I20; I23).
On a regional scale, soil salinity is perceived as a gradually increasing problem. All
interviewed farmers and extension workers agreed that in the course of the last two
decades, salinization processes affected ever more plots and even led to the aban-
donment of a significant amount of previously cultivated land. Some of the interviewed
farmers personally experienced how the cultivation of individual plots became unprofit-
able; sometimes within a short time span (I4; I5; I11), in other cases gradually over
several years (I6; I7; I8; I9; I14). The president of the association Lirandzo reported 16
hectares to be lost due to salinity; which affected ca. 50 farmers (I3). A similar area
has been lost for the association Thomas Sankara (I1). However, the by far greatest
losses are recorded by Costa do Sol. Here, more than half of the associations 150 hec-
tares are no longer used agriculturally (I6; I18).
The individual explanations given for these observable long-term trends remarkably
varied, depending on the specific geographical location. Farmers of Thomas Sankara
consistently referred to a construction project located at the associations’ eastern bor-
der, which is said to highly compromise the main drainage channels of this part of the
Green Zone. Following the logics described above, they complained that this would
lead to generally higher groundwater tables in the cultivated areas, and consequently
to increased soil salinity (I1; I11; I13; Figure 12a). A similar situation was described for
the association Graça Machel (I2). Amongst the farmers of Costa do Sol, there was a

51
general agreement that the big floods of 2000 marked the starting point for a gradual
salinization process (I6; I7; I9). Yet another driver was identified by the members of
Graça Machel, Lirandzo and Djaulane. All of these associations are bordered by a
poorly maintained principal drainage channel, which directly drains into the ocean. In
this case, it is claimed, that since the break of the channels floodgates several years
ago, seawater is regularly pushed upstream during high tide, which leads to the salini-
zation of adjacent cropping land (I27; I2; I3; I15; Figure 12b-c). Despite local specifici-
ties, all of these perceived long-term drivers for salinization thus relate to a deficient
capacity of the Green Zones’ drainage systems.
Figure 12: Locally perceived long-term drivers for salinization. (a) Inundated plot within the association of
Thomas Sankara, ascribed to recently impaired drainage system. (b) Principal drainage channel bordering
the association of Lirandzo, which is said to carry seawater during high tide since its floodgates broke.
Previously, the adjacent land was cultivated. Nowadays it is covered with saltmarsh vegetation, and (c) the
soil is characterized by low infiltration rates and dry cracks.
5.4 Local Strategies to Cope with Soil Salinity
All informants were aware of, and explicitly described specific agronomic measures
conventionally applied to manage soil salinity. Additionally, interviews revealed a set of
socio-economic approaches, which directly or indirectly help to cope with its effects.
Table 6 presents a summary of these different aspects.
The consistent application of organic manures can be regarded as the principal agro-
nomic strategy, and was acknowledged by all informants. It is an approach highly sup-
ported by the extension personal (I16; I18-I21). And farmers, if they have the means,
consistently implement it. All locally available soil amendments are regarded as effec-
tive: chicken manure, green manures of crop residues and weeded plant material, ash-
es, as well as organic household wastes. Especially farmers who cultivate in differently
affected areas, had a clear understanding of how much more chicken manure they
have to apply in their salt-affected plots to achieve satisfactory yields (I4; I7). Inform-
ants generally couldn’t give a specific causal explanation for this strategy. Its wide-
spread application is rather driven by the common perception that organic manures are
beneficial for overall soil fertility, as well as by local experimentation (I4; I18; I21).

52
Table 6: Local strategies to cope with soil salinity and their underlying rationales, grouped by agronomic
and socio-economic approaches.
Measures Explanations
Agronomic
Organic manures a high organic matter content is believed to generally improve soil
fertility; local experimentation proved its effectivity to counteract soil
salinity
Mineral fertilizers a proper fertilization of plants is regarded by some farmers as essen-
tial to mitigate the effects of soil salinity
Biofertilizers by some extension workers explicitly recommended for salt-affected
plots, however, barely put into practice by farmers
Elevation of plots in order to escape high groundwater tables, occasionally even through
the introduction of external soil resources
Use of tolerant crops based on individual experience, farmers developed an understanding
of the tolerance levels of different crop species
Higher watering intensity in order to compensate for the reduced water potential of the soil due
to salinity, and thus to ensure sufficient water uptake by the plant
Extensification extensive or no agricultural use of salt-affected plots during the rainy
season, when salinity effects are perceived to be most pronounced
Socio-Economic
Cultivation of several plots purposive allocation of plots from different ecological zones within an
association to individual farmers ensures a fair distribution of land
resources as well as risk spreading
Direct marketing farmers with direct marketing channels are not restrained by the local
marketing conventions and thus are able to sell also plants from im-
paired crop stands
Change of land use if cropping land is verifiably rendered unproductive due to soil saliniza-
tion, a change of land use in the context of urbanization may compen-
sate for the economic losses
A rather controversial topic was the use of mineral fertilizers. Even though not men-
tioned as a specific measure against soil salinity, some farmers implicated that a con-
sistent use of urea is imperative in the salt affected plots (I5; I12). In contrast, many of
the interviewed extension workers stressed that especially in the salt affected areas the
use of mineral fertilizers should be minimized; due to the perception that they actually
could be a driver for salinization (I18; I19; I21). In line with this, several extension
workers regard biofertilizers as a promising alternative. Their use is generally promot-
ed. But it is explicitly recommended for salt affected areas (I16; I17; I20). Another soil
management approach which was repeatedly stated as an explicit strategy to cope with
salinity is the elevation of individual plots; occasionally even through the introduction of
external soil resources. With such measures, farmers try to escape high groundwater
tables, which are generally perceived as local causes for salinization (I13; I16; I17; I20;
I21).

53
Apart from soil management approaches, targeted plant based strategies are applied
by many farmers. Almost all informants were asked to categorize local crop species
according to their perceived salt tolerance. Table 7 presents a synthesis of the respec-
tive answers. Beetroot was commonly mentioned as the crop with the highest salt tol-
erance. Several informants further pointed to its importance and targeted production
within the salt-affected areas; a pattern which was easily verifiable through field obser-
vations (I8; I11; I12; Figure 13a). Other commercially important vegetable crops which
consistently have been stated to be salt tolerant are carrot, onion, pumpkin leaves, and
eggplant. The list was augmented by a few less important complementary crops (I3; I5;
I8; I11; I16-I21). Common bean and cucumber were the only crops consistently classi-
fied as highly sensitive to soil salinity (I1; I7; I8; I16; I20). In the case of lettuce, kale,
cabbage, and other leafy vegetables the perceptions partly diverged. The respective
classification was commonly not perceived as absolute, but conditioned by other man-
agement aspects. Several informants stressed the importance of consistent application
of organic manures for these crops to withstand soil salinity (I4; I8; I12; I21). Additional-
ly, one farmer emphasized the necessity of increased irrigation intensities to compen-
sate for the plants impaired water uptake under saline conditions (I8). Yet other farmers
pointed out that they prefer producing their own seedlings within the salt affected plot.
They suggest that this would allow the plants to adapt to the local conditions and thus
increase their salt tolerance (I9; I11).
Table 7: Local perception towards salt tolerance of different common crop species.
tolerant moderately sensitive sensitive
commercially important crops
Beetroot
Carrot
Onion
Pumpkin leaves
Eggplant
complementary crops
New Zealand Spinach
Maize
Sugarcane
Banana
Lettuce
Kale
Cabbage
Swiss Chard
Common Bean
Cucumber
Several farmers further stated that they would cultivate their salt-affected plots less
intensively or even leave them fallow during the rainy season. They usually just throw a
few seeds of pumpkin, maize or cowpea onto the respective land without any further
management. However, such decisions are not exclusively determined by the percep-
tion of soil salinity, but also by conditions of water logging and increased pest and dis-
ease pressure during that part of the year (I8; I9; I13; I17; Figure 13b).

54
Figure 13: Local approaches to cope with soil salinity. (a) Beetroot is widely known as a salt tolerant crop
and predominantly cultivated in the salt-affected areas. (b) Salt-affected plots are often used more exten-
sively; in this case with an unmanaged cowpea crop. (c) In the context of Maputos’ urbanization dynamics,
formalized land use change of salt-affected agricultural land is an increasingly feasible option for many
farmers associations.
Apart from actively implemented strategies, several informants were aware of further
optional approaches to tackle soil salinity. A few farmers and extension workers, for
example, mentioned that the application of gypsum theoretically could facilitate the
washing of salts. But all agreed that under the current local conditions it wouldn’t be a
feasible option. Constrained accesses to the product, its costs, as well as the required
organizational and technical effort for its effective application are seen as the principal
restrictions (I3; I4; I18; I19). Another important aspect mentioned, was the use of alter-
native, non saline water sources and the implementation of efficient irrigation systems
such as drip irrigation. But also in this case, the informants acknowledged the limiting
socio-economic environment which prevents such options from being realized (I18; I20;
I23). The same holds true for the aspirations of resolving the perceived principal long-
term drivers of salinization. Several farmers complained that the municipality wouldn’t
administer to the necessity of repairing and maintaining the principal drainage system
of KaMavotas’ Green Zone. They stressed that the individual farmers associations are
aware of their responsibility for secondary and tertiary drainage channels. However,
they don’t have the financial and technical means, and also not the authority to main-
tain the primary infrastructure (I1; I2; I3; I4; I13; I19). An interview with representatives
of the DAE, the competent authority, confirmed this perception of the division of re-
sponsibilities. They stated that they are well aware of the problem, but also lack the
financial and technical resources to implement effective measures (I27).
Numerous accounts of different informants revealed that local stakeholders think of soil
salinity management not merely in agronomic or technical terms, but also follow ap-
proaches on the wider socio-economic level. Most obvious is the strategy of risk
spreading. It is achieved through a purposive allocation of plots from different ecologi-
cal zones to the individual members of a farmers association, to thus allow for a fair
and balanced distribution of the available land resources. Consequently, producers are
55
often not restricted to a single plot, and have the possibility to diversify their cropping
activities. As previously alluded to, farmers generally adjust their crop choice and over-
all management to the specific conditions of an individual plot and thus balance their
economic risks (I1; I4; I7; I8; I11). A further aspect is the form of marketing channel
used by the farmers. One producer explicitly stressed the advantage of direct market-
ing, especially when farming on salt-affected plots. Without being dependent on inter-
mediaries, she can afford irregular crop development and non-homogeneous crop
stands. She explained that she often selects individual plants for sale and doesn’t har-
vest whole crop stands at one point in time (I8). For other farmers, which entirely de-
pend on the conventional marketing structures, this strategy is not an option (I4; I5; I11;
I12).
Yet another aspect intensively discussed with regard to soil salinity is the complete
abandonment of farming and the endorsement of alternative land uses. In the context
of Maputos’ current urbanization dynamics, formal or informal declaration and selling of
construction land becomes increasingly feasible for farmers associations and individual
land title holders of KaMavota (I18; I26; I27). The associations of Costa do Sol and
Thomas Sankara already realized the official declaration of significant parts of their
land areas as construction land (I1; I6; I18; I27). Specifically within the former, parcel-
ing of land and actual construction work is in an advanced stage (I6; Figure 13c).
Members of Graça Machel and Lirandzo confirmed that their associations have similar
aspirations (I2; I4; I5; I27). According to representatives of the DAE, a redeclaration of
existing agricultural sites is not envisaged by the current municipal land use plans. It
can only be approved if it can be proven that the respective areas are severely im-
paired by soil salinity or other bio-physical constraints. The base of respective decision
making by the DAE is partly limited to expert evaluation of agronomic engineers visiting
the field sites. However, farmers associations are encouraged to commission and fi-
nance comprehensive soil analysis; which has been recently done by the association of
Graça Machel. Even though respective procedures are thus well defined, the obscure
distribution of responsibilities between different municipal authorities and apparent
cases of corruption are said to complicate the formalized execution of local land use
changes justified by soil salinity (I27).

56
5.5 Participatory Soil and Water Survey
Within the frame of the participatory mapping workshop, farmers defined five soil salini-
ty categories. They are based on the perceived severity of soil salinity and the respec-
tive impacts on crop production: (a) non-saline; (b) slightly saline, causing 25-50% yield
loss; (c) saline, causing 50-75% yield loss; (d) too saline for crop production, corre-
sponding with 75-100% yield loss; (e) highly saline. Spatially they have been described
as distinctive consecutive strips following a NW-SE orientation. This categorization is in
accordance with information stated in individual interviews. Further, it corresponds with
apparent changes in crop health, land use, and natural vegetation, as documented
during field walks. Specifically obvious was the geographic limit of vegetable production
which is marked by the boarder of categories c and d (Figure 14).
On a global scale, measured ECe (0-20 cm) values ranged from 0.23 to 17.99 dS m-1,
with a mean of 3.82 dS m-1. ECe (20-40 cm) values varied between 0.28 and 13.55 dS
m-1, with a mean of 2.92 dS m-1. ECw values ranged from 1.01 to 8.75 dS m-1, with a
mean of 2.58 dS m-1. A paired-samples t-test was conducted to determine if ECe at the
two distinctive sampling depths differ from another. ECe (20-40 cm) values (M = 2.92;
SD = 3.35) are significantly lower than respective ECe (0-20 cm) values (M = 3.82; SD
= 4.44); t(df:39) = -3.47, p < 0.01. However, individual assessment indicates that differ-
ences generally are minor and within a range of no practical implication, especially
among the samples taken within the actual vegetable production areas (categories a-
c). Further, it has to be considered that for the locally dominant short-cycle crops root
development is largely confined to the uppermost 20 cm soil layer (Midmore 2015;
Thorup-Kristensen 2006). Therefore, ECe (20-40 cm) was excluded from further data
analysis.
In order to compare farmers’ categorization with the acquired survey data, ECe (0-20
cm) and ECw measurements were disaggregated into the different categories (a-e).
Respective descriptive statistics and data visualization suggest a general agreement
with farmers’ categorization (Figure 14). ECe (0-20 cm) values within the categories a-c
are largely confined to ≤2.5 dS m-1, demonstrating a low variability. ECe (0-20 cm) val-
ues of category d and e predominantly lie within a range of 2.5 to 5.0 dS m-1 and 7.5 to
15.0 dS m-1 respectively, exhibiting a high internal variability. ECw values in category a
and b were confined to ≤2.5 dS m-1, showing a low variability. Within category c and d,
ECw demonstrated a higher variability, roughly ranging between 2.0 and 9.0 dS m-1.
Category e in turn is characterized by comparatively lower ECw values, ranging be-
tween 1.4 and 4.3 dS m-1.

57
Figure 14: ECe (0-20 cm) and ECw grouped by farmers’ spatial soil salinity categorization; where a = non-
saline, b = slightly saline (25-50% yield loss), c = saline (50-75% yield loss), d = too saline for crop produc-
tion (75-100% yield loss), e=highly saline. First section: Representative photographs of each category,
which demonstrate the apparent changes in crop health, land use, and natural vegetation. The geographic
limit of vegetable production is marked by the border of categories c and d. Middle section: Spatial repre-
sentation of ECe (0-20 cm) values for individual sample points. Satellite image is based on Bing Maps
data. Last section: Boxplot representation of ECe (0-20 cm) and ECw grouped by farmers’ spatial soil salini-
ty categorization.
Boxplot grouped by
farmers’ category
ECe (0-20 cm) of
sample locations
in dS m-1
ECe (dS m-1)
ECw (dS m-1)
15
10
5
0
a b c d e

58
A one-way ANOVA was conducted to test for statistical consistency of farmers’ catego-
rization on the basis of ECe (0-20 cm) and ECw. Both parameters significantly differed
depending on farmers’ categorization; with F(4; 35) = 14.75, p<0.001 for ECe (0-20 cm)
and F(4; 20) = 3.16, p<0.05 for ECw. However, a Fisher's LSD test indicated that, with
regard to ECe (0-20 cm), only category e (M = 10.40; SD = 5.03) is significantly differ-
ent from all other categories, and that category d (M = 4.29; SD = 3.41) significantly
differs from b (M = 1.23; SD = 0.68), at p≤0.05. With regard to ECw even more overlap-
ping groupings were indicated by the Fisher's LSD test, with only categories a (M =
1.44; SD = 0.33) and c (M = 4.62; SD = 2.86) being significantly distinctive from anoth-
er, at p≤0.05. Against this background, only farmer categories c, d and e could be con-
firmed as statistically distinctive entities based on either ECe (0-20 cm) or ECw; while a
differentiation between categories a and b couldn’t be substantiated on the basis of
ECe (0-20 cm) and ECw measurements.

59
6 Discussion of the Studies’ Results
6.1 General Farming Practices and their Underlying Rationales
The farming practices commonly employed by the vegetable producers in Maputos’
Green Zones are apparently shaped by the given bio-physical and socio-economic
context (compare chapter 3). Leaving aside minor differentiations, the local farming
community can be regarded as a comparatively homogeneous group. Individual farm-
ing enterprises are typically characterized by small cultivation area, high dependency
on manual labor, intensive use of commercial agricultural inputs such as seeds, miner-
al fertilizers and pesticides, as well as low crop diversification. Analyzing the studies’
findings, the following aspects can be recapitulated as the major predeterminations for
the local vegetable production system:
The bio-physical characteristics of the coastal wetland environment
Generally low financial resource endowment of farmers
Restricted access to high quality agricultural inputs
Limitation of available land resources
Diversified livelihoods, resulting in a reduced availability of agricultural labor
Restricted spectrum of vegetable products demanded by local consumers
Strong dependence on intermediaries for marketing vegetable products
Comparatively strong social organization in the form of farmers associations
Established extension system, which facilitates knowledge transfer
Constrained financial and organizational capacity of relevant state institutions
Several interviewed farmers and extension workers directly referred to one or more of
the above listed aspects as decisively determining the local farming rationales. Often,
informants were aware of objectively better management alternatives, but gave plausi-
ble explanations for not applying respective approaches on basis of these frame condi-
tions. Ojiem et al. (2006) suggested the socio-ecological niche concept as an analytical
framework for decoding agronomic practices and their underlying rationales in small-
holder farming systems. The framework distinguishes between the following factor cat-
egories: ecological (climate, soil characteristics, etc.), socio-cultural (values and norms,
livelihood strategies, etc.), economic (financial capital, labor and output markets, etc.),
and institutional (extension services, input providers, etc.). The above listed determin-
ing factors identified for the context of Maputos’ Green Zones evenly represent the dif-
ferent categories proposed by Ojiem et al. (2006), thus corroborating the equal signifi-
cance of bio-physical and socio-economic aspects in shaping local farming practices.

60
As has been reviewed by Pulido et al. (2014) and Shiferaw et al. (2009), it are the
same context specific frame conditions which generally determine the management of
specific forms of land degradation, such as salinization of agricultural land. A mere
awareness of the respective problem by farmers generally is not sufficient to trigger the
implementation of effective countermeasures. Especially resource poor farmers are
unlikely to adopt strategies which are not well adapted to their bio-physical and socio-
economic realities and which don’t promise short term economic gains (Pulido et al.
2014; Shiferaw et al. 2009). Against this background, the discussion of current soil sa-
linity management in the Green Zones of Maputo (chapter 6.4), as well as of potential
future strategies (chapter 7), has to consider the above summarized bio-physical and
socio-economic frame conditions.
6.2 Local Indicators for Soil Salinity and Economic Evaluation
Soil quality indicators as perceived by local farming communities are generally complex
and encompass a holistic suite of partial elements (Pereira et al. 2017; Pulido et al.
2014). Most commonly, visually recognizable physical landscape features serve as soil
indicators (Barbero-Sierra et al. 2016; Mairura et al. 2008). However, farmers may also
use other senses to evaluate soil characteristics, including smells, taste, feels and
sounds (Pereira et al. 2017). In the context of land degradation, this typically refers to
consequent aspects of the degradation process, such as plant symptoms, decline in
crop yields, change in soil structure and soil crusting, presence of specific natural vege-
tation or weed species, etc. (Pulido et al. 2014). The findings of the present study fit in
well with this overall trend. To evaluate the state of soil salinity, farmers in Maputo pre-
dominantly rely on directly visible indicators related to soil characteristics, crop devel-
opment and yield. Less common are indicators which are based on other sensory per-
ception, such as tasting by tongue or feeling by hand. The soil salinity indicators used
by Maputos’ peri-urban farmers further resemble the ones reported in other case stud-
ies. Indicators which are universally used by farming communities from Tanzania,
Bangladesh and Pakistan are: reduced crop yield, stunted plant growth, leaf yellowing,
salt crusts on soil surface, salty taste of soil and irrigation water, as well as soil struc-
tural problems such as low infiltration rates and dry cracks (Ali 2003; Kashenge-
Killenga et al. 2014; Kielen 1996).
Most of the described indicators directly relate to scientifically confirmed symptoms of
soil salinity (Pessarakli et al. 2011; Qadir et al. 2002; Rhoades 2012; Shahid et al.
2011; Shannon et al. 1998). Based on this observation it could be claimed that local
farmers’ indicators are a valuable substitute for the more cost and time intensive tech-
nical salinity evaluations. Rhoades (2012) however argues that visual observations of

61
soils, crops, topography, etc. are rarely sufficient to diagnose a salinity problem conclu-
sively. This is because first yield losses due to salinity might not be indicated by visual
plant symptoms. Moreover, visual observations could lead to a false diagnosis, since
other factors potentially induce the same or similar plant and soil symptoms typically
caused by salinity (Barbero-Sierra et al. 2016; Kielen 1996; Rhoades 2012). Also in the
specific context of Maputos’ Green Zones the validity of farmers’ soil salinity evaluation
has been questioned by local experts against the background of such considerations
(I18; Schmidt 2017). However, despite these general limitations, certain studies sug-
gest that farmers’ spatial soil salinity classification, based on their local salinity indica-
tors, may correspond well with scientific evaluations (Ali 2003; Bouarfa et al. 2009); an
aspect which is further discussed in chapter 6.5. In any case, an integration of local
and technical approaches should be strived for in order to rationalize soil salinity detec-
tion among affected farming communities (Mairura et al. 2008; Rhoades 2012).
6.3 Local Perception on Significance, Causes, and Spatio-Temporal Dy-
namics of Soil Salinity
Maputos’ farmers consistently perceive soil salinity as a verifiable and significant prob-
lem for local vegetable production. However, other constraints such as seasonal ex-
cess or lack of water, pests and diseases, as well as constrained access to quality ag-
ricultural inputs are often regarded as more noteworthy. This observation resembles
the findings of Nhantumbo (2009) who studied local perceptions on salinity among rice
farmers in the district of Chókwè, Mozambique. He argues that farmers tend to relativ-
ize the significance of soil salinity if other agronomic constraints, such as restricted
water supply, are present. Another aspect which was stated by previous case studies
as an important determinant of farmers’ perception on soil salinity is the duration of its
occurrence and the consequent experience of affected farmers. Farmers who have
experienced soil salinity already for a long time directly in their fields tend to attach
more importance to the topic than unaffected neighboring farmers (Bouarfa et al. 2009;
Nhantumbo 2009). Since the present study followed a purposive sampling approach
biased towards farmers affected by soil salinity, no comparative statement can be
made. However, isolated informal conversations with farmers not affected by salinity
suggested a lower awareness amongst the farmers restricted to the non-saline areas of
the Green Zone of KaMavota. Generally it can be hypothesized that many producers
currently farming salt-affected plots, already have long term experience with its man-
agement. This is because soil salinity is no new phenomenon within the peri-urban
production areas of Maputo (Dykshoorn et al. 1988; Eschweiler 1986), and the majority
of producers has been present already for several decades.

62
Further factors which potentially influence the knowledge and perception on salinity of
individual farmers are: economic dependence on agriculture, size of the farming enter-
prise, education, gender, and age (Barbero-Sierra et al. 2016; Nhantumbo 2009). The
data of the present study doesn’t allow for an analysis of their respective importance
within the context of Maputo. However, due to intensive personal contacts within the
local farming community, facilitated through the organization in associations, it can be
hypothesized that awareness and knowledge of the salinity problem is effectively
shared by peers and that the stated socio-economic factors thus are of less relevance
in the present case. As suggested by Nhantumbo (2009), perceptions towards salinity
may also differ significantly between individual stakeholder groups, depending on their
particular interactions with the problem. In the case of Maputo such divergences be-
tween stakeholder groups, such as farmers and extension workers, doesn’t seem to be
pronounced. This can be explained by the fact that farmers are the only stakeholder
group directly involved with the problem. They are the ones informing other stakeholder
groups in this regard and thus are determining their respective perception. Several of
the interviewed extension workers admitted, that their knowledge and perception of soil
salinity is highly informed by farmers’ accounts. The few cases of disagreement be-
tween the perception of extension workers and farmers may be explained by the spe-
cific technical formation of the former.
Farmers within the salt-affected areas of the Green Zone of KaMavota have a complex
perception of the causes and spatio-temporal dynamics of soil salinity. Farmers con-
sistently depicted and explained the respective phenomena in a colloquial way. None-
theless, most of these descriptions correspond well with the scientifically justified ex-
planations for the local context (compare chapter 3.5). The following salinization drivers
as perceived by local farmers can be considered as scientifically tenable: (a) the pres-
ence of inherently saline sediments (Dykshoorn et al. 1988; Vicente 2011); (b) pres-
ence of saline groundwater, due to seawater intrusion (Eschweiler 1986; Matsinhe et
al. 2008); (c) aboveground seawater influx via existing water ways during high tide
(Dykshoorn et al. 1988; Matabeia 2015), potentially exacerbated during flooding events
(Braccio 2014); and (d) deficiency of the local drainage system (Eschweiler 1986).
A few other aspects, which were mentioned by the informants, however, should be
subject to further review. A common perception among local farmers is that the level of
soil salinity is characterized by seasonal fluctuations, with an intensification typically
observed during the rainy season. The causal effect is commonly ascribed to the asso-
ciated rise of water tables. In view of the fact that within the Green Zone of KaMavota
heavy soils with a low drainage capacity predominate and that local groundwater is
assumed to be saline, the explanation of farmers can be considered plausible. Howev-
63
er, as argued by some local extension workers and agronomists (Schmidt 2017), it
should be also considered that other coinciding environmental factors potentially are
responsible for the increased incidence of plant symptoms and yield reduction. During
the rainy season several stress factors are accentuated, most prominently heat stress,
water logging, and occurrence of pests and diseases (compare chapter 5.1). Due to
additive or synergetic interactions, the effects of soil salinity on crop production are
typically intensified by the presence of these stresses (compare chapter 2.2.2). This
consequently may prejudice farmers’ assessment.
Another aspect which has been assumed as a driver for salinization by local stake-
holders, predominantly extension workers, is the excessive use of agrochemicals. Salt
containing mineral fertilizers are known to potentially contribute to soil salinization un-
der conditions of intensive crop production, especially in greenhouse systems (Sun et
al. 2019). Therefore, a contributing effect under the local circumstances of the Green
Zones of Maputo cannot be ruled out. However, due to open field conditions and the
fact that the conventionally applied mineral fertilizers, predominantly urea, are charac-
terized by low salt contents, its relative importance can be assumed to be marginal.
The use of poultry manure, which is the locally most important organic manure, is not
perceived as a salinization driver by local stakeholders. However, it has to be regarded
as a potential contributor to soil salinity (Li-Xian et al. 2007), even though its relative
importance within the local context may also be limited.
On the whole, it can be concluded that farmers’ perceptions towards the causes and
spatio-temporal dynamics of soil salinity are in accordance with the existing theoretical
explanations. This assessment is comparable to observations made by a study, which
was conducted in a salt-affected irrigation scheme in Pakistan (Kielen 1996). Nonethe-
less, in order to comprehensively determine and locate current or potential salinization
drivers within the Green Zones of Maputo, detailed pedological and hydrological stud-
ies would be necessary.
6.4 Local Strategies to Cope with Soil Salinity
The present study identified a set of agronomic approaches which are employed by
Maputos’ farmers in order to manage soil salinity. The following strategies are typically
applied: use of organic soil amendments, mineral fertilizer application, simple land
shaping techniques, the targeted choice of tolerant crop species, increased watering
intensity, and land use extensification. These findings confirm previous local reports
(Dykshoorn et al. 1988; Matabeia 2015; Schmidt 2017). They also correspond well with
findings of other case studies. Plant based approaches, the use of locally available soil

64
amendments, simple land shaping techniques, modified irrigation management, and
extensification of agricultural land use seem to be the most prevalent agronomic strat-
egies universally employed by affected smallholder farmers (Ali 2003; Bouarfa et al.
2009; Kielen 1996; Nhantumbo 2009). The study revealed that farmers’ choice of strat-
egies for soil salinity management is predominantly shaped by long-term experience
and on-farm experimentation. The employed management measures are largely in
accordance with scientifically recommended approaches (compare chapter 2.3). Even
though producers generally have no comprehension of the concrete underlying ecolog-
ical functions of individual management approaches, they still have a clear perception
of the respective cause-effect relations. This is a typical characteristic of agricultural
local knowledge systems in the Global South (Hoffmann et al. 2007).
Another finding of the present study is that management choice is not solely deter-
mined by the familiarity of an individual management strategy. Several farmers and
extension workers stated that they are aware of additional potential measures, which
however, are not feasible under the current local circumstances. As primary limitations
for their adoption, the following aspects were identified: (a) constrained market availa-
bility of necessary inputs (e.g gypsum application), (b) insufficient financial and techno-
logical capacity of individual farmers and municipal institutions (e.g. improvement of the
irrigation and drainage systems), and (c) time constraints of farmers (e.g. biofertilizer
production and composting). These observations confirm previous studies, which em-
phasize the importance of enabling socio-economic frame conditions for the realization
of measures against land degradation by smallholder farmers (Pulido et al. 2014;
Shiferaw et al. 2009).
Next to agronomic measures, farmers in the Green Zones of Maputo respond to soil
salinity by the means of socio-economic approaches. This includes risk spreading
through the cultivation of several plots, direct marketing channels, and change of land
use. Several previous case studies demonstrated the universal importance of socio-
economic coping strategies among farming communities impacted by soil salinity. Es-
pecially the abandonment of agricultural activities and subsequent land use change is a
popular phenomenon (Ali 2003; Bouarfa et al. 2009; Haider et al. 2013; Ligate et al.
2017; Nhantumbo 2009). It has to be emphasized though, that such measures are pure
mitigation strategies and that they don’t actively counteract the salinity problem. As
implied by several informants within the frame of the present study, the construction
activity within the Green Zone of KaMavota, which is partly stimulated by salinization
trends, may even exacerbate soil salinity in adjacent horticulturally used areas.

65
6.5 Participatory Soil and Water Survey
The results of the survey compare well with previous ECe and ECw data reported for
the Green Zones of Maputo, demonstrating similar value ranges (see chapter 3.5).
However, the measurements must be considered as a spatial and temporal snapshot,
which only can serve as a broad guideline for future management.
Farmers’ spatial soil salinity categorization is largely supported by the surveys meas-
urements (compare Figure 14, chapter 5.5). The data confirms a gradual increase of
soil and/or irrigation water salinity following a NW-SE orientation towards the coast.
The observed high variability of ECe (0-20 cm) and ECw within the categories of c, d
and e are in accordance with farmers’ reports on the patchiness of soil salinity which
masks the overall spatial gradient. Within categories a and b ECe (0-20 cm) and ECw
values are consistently ≤2.5 dS m-1, which corresponds well with farmers’ reports of
minor to moderate yield losses of kale and lettuce within these zones (compare Grieve
et al. 2012; Annex I). Within category c, ECe (0-20 cm) values are also confined to ≤2.5
dS m-1. However, ECw largely is ≥3.0 dS m-1, thus surpassing the critical threshold val-
ue for most conventional vegetable crops (Midmore 2015). The high ECw consequently
can be hypothesized as a main impairing factor within this zone, which could be re-
sponsible for the major yield losses of kale and lettuce reported by the farmers. Within
category d both, ECe (0-20 cm) as well as ECw values, are largely above critical
threshold levels of most conventional vegetable crops, ranging roughly between 2.5
and 6.0 dS m-1. These findings correspond well with the observation that many previ-
ously cultivated plots within this zone have been abandoned by farmers (compare
Grieve et al. 2012; Annex I). Category e is characterized by the by far highest ECe (0-
20 cm) values, partly surpassing 15.0 dS m-1. However, ECw measurements indicated
comparatively low values. This can be explained by the fact that water samples were
highly limited within this zone. They were largely confined to apparent fresh water
sources such as major drainage channels. The consistently observable salt marsh
vegetation serves as a clear confirmation for the elevated soil salinity within category e.
As suggested by the conducted statistical tests, categories d and e can be defined as
distinctive entities predominantly based on ECe (0-20 cm), while category c distin-
guishes itself from category a and b only on the basis of ECw. However, the survey
results cannot confirm the differentiation of categories a and b; which suggests that
they should be merged into one category on the basis of ECe (0-20 cm) and ECw
measurements. However, it has to be considered that farmers’ categorization is pre-
dominantly based on indirect indicators of salinity such as percent of yield loss. Thus,
other stress factors related to salt affected soils, which haven’t been considered within

66
the survey, could be of additional relevance. Hypothetically, high pH or ESP, in con-
junction with EC could be responsible for the observable plant symptoms and yield
losses.
In the light of the above, it can be stated that local farmers’ evaluation of soil salinity
corresponds well with the results of the soil and water survey. Similar observations
have been made by other case studies. Ali (2003) compared the results of a detailed
scientific soil survey of a coastal farming community in Bangladesh with the vernacular
soil classification of local farmers. The study revealed that farmers’ knowledge of most
soil properties, including soil salinity, corresponded well with the qualitative interpreta-
tion of the respective scientific data. Similarly, Bouarfa et al. (2009) found a good
agreement of farmers’ evaluation of the level of soil salinity in their plots with verifying
soil analysis in an irrigation scheme in Algeria. In 56 out of 60 cases farmers’ assess-
ment was clearly confirmed on the basis of EC measurements. Kielen (1996), in turn,
compared farmers’ soil salinity and sodicity typology with EC and SAR measurements
in an irrigation scheme in Pakistan. Mean values of EC and SAR segregated into farm-
ers’ categories indicated a good agreement of the local perception with the scientific
assessment. The variability of EC and SAR was higher within the farmers categories of
high salinity and sodicity; which resembles the findings of the present study.
Even though these case studies implicate a generally good agreement of local and
scientific assessments of soil salinity, farmers’ typologies cannot comprehensively sub-
stitute for scientific approaches. The present study, for example, suggests that farmers
don’t comprehensively distinguish between soil and water salinity, while other case
studies indicate rather imprecise differentiations of salinity and sodicity by farmers
(Bouarfa et al. 2009; Kielen 1996). Such differentiations, however, are often decisive
for the effective site specific management of salt-affected soils (compare chapter 2).
Integrative approaches for soil evaluation are thus increasingly advocated for, in order
to profit from the respective strengths of local and scientific assessments (Bouarfa et
al. 2009; Kielen 1996; Mairura et al. 2008; Pereira et al. 2017).

67
7 Discussion of Potential Management Approaches Adapted
to the Local Context
Within the previous chapters, key agro-ecological and socio-economic aspects of the
peri-urban vegetable production system of Maputo linked to soil salinity have been de-
scribed and discussed. The present chapter builds on these insights and discusses
entry points for potential future management approaches. Two different scales will be
distinguished. Firstly, recommendations for action on the regional level are outlined.
This mainly refers to the institutionalized management of soil salinity through the re-
sponsible municipal entities and potential partner institutions. Secondly, specific agro-
nomic management options are discussed; taking into account the current realities of
local farmers.
7.1 Regional Management Approaches
The present study revealed that Maputos’ municipal institutions responsible for urban
agriculture, namely the DAE and the attached Casas Agrarias, are aware of the signifi-
cant impact of soil salinity on the local vegetable production system. However, currently
there doesn’t exist a comprehensive and institutionalized strategy to approach the is-
sue. According to representatives of the DAE, the main limitations for an effective re-
gional management of soil salinity are financial constraints, as well as an unclear and
overlapping distribution of competences between different state and municipal institu-
tions. In particular, these circumstances currently impede the restoration of the Green
Zones’ drainage systems. Furthermore, they hamper the effective monitoring of the
local land resources and the sustainable regulation of land use change in the context of
Maputos’ urbanization dynamics (I27). This situation exemplifies the importance to re-
organize and strengthen local institutions in order to promote an enabling environment
for farmers and other stakeholders to actively tackle the problem of soil salinity. Against
a similar background, Nhantumbo (2009) makes a strong case for the integrated in-
volvement of different stakeholder groups to develop formal comprehensive manage-
ment strategies with regard to soil salinity. In the case of Maputo, a respective ap-
proach should integrate state institutions (DAE, Casas Agrarias), the farmers associa-
tions, non-governmental organizations (ABIODES), and research and educational insti-
tutions (IIAM, UEM). A joint strategy of the named local institutions should tackle bio-
physical as well as socio-economic aspects. Table 8 summarizes potential focus points
for a respective strategy. However, it needs to be stressed that most of the listed rec-
ommendations are only valid under the assumption that the current financial and or-
ganizational limitations could be largely overcome.

68
Table 8: Recommendations for regional management approaches.
Approach Explanations
Hydrological management restoration and effective maintenance of the Green Zones’ drainage
system in order to halt and potentially reverse current salinization
trends
Soil and water monitoring regular monitoring of the state of soil salinity would facilitate its spatial-
ly and temporally precise management; the application of portable EC-
meters could complement the use of local salinity indicators
Field trials of agronomic
management approaches
participatory field experimentation in the frame of demonstration plots
and farmer field schools could be applied to test the feasibility of po-
tential agronomic management approaches under local conditions;
furthermore, it would facilitate respective knowledge transfer and may
trigger adaptive experimentation and innovation among local farmers
Overall improvement of
agricultural value chains
an overall strengthening of the local agricultural value chains, includ-
ing the improved access to high valuable inputs as well as more fa-
vorable marketing channels, could increase the farmers’ adaptive
capacity towards soil salinity
As has been demonstrated by the present study, the current insufficiency of the local
drainage systems has to be considered as the most important regional/long-term driver
for salinization in Maputos’ Green Zones (compare chapter 6.3). The restoration and
effective maintenance of the existing drainage structures thus would constitute a far-
reaching and sustainable measure to limit and potentially reverse current salinization
trends. However, such an effort would require a high financial and technological in-
vestment as well as an intensive cooperation of all local stakeholders.
Lower investment costs would be required to support farmers in their management of
soil salinity on the plot level. Local farmers already have a profound and differentiated
understanding of the spatio-temporal dynamics of soil salinity and its agronomic man-
agement. However, the present study suggests that the targeted introduction of tech-
nical management innovations could effectively complement respective local
knowledge and practice (compare chapters 6.2-6.5). Such an approach could easily
build on the comparatively well established extension structures of the Casas Agrarias
and ABIODES. Nonetheless, as a decisive prerequisite it would require an in-depth
training of the local extension personnel in order to establish a more profound technical
understanding of soil salinity and its agronomic management (van de Fliert et al. 2002).
On the one hand, local extension services could support farmers through the estab-
lishment of an improved soil and water monitoring system. The application of easy-to-
use portable EC-meters or comparable devices, for example, would facilitate a more
precise evaluation of the spatio-temporal dynamics of salinity, and thus improve deci-
sion making on its management (compare chapters 6.2 and 6.5). On the other hand,
the local extension structures could be used to facilitate participatory field testing of

69
innovative management approaches. The existing system of demonstration plots and
farmer field schools can be considered as a suitable platform for respective experimen-
tation. Participatory field trials require intensive supervision and maintenance. Howev-
er, they could effectively validate the feasibility of a given management approach under
the local conditions. Additionally, they thus facilitate the respective knowledge transfer
and may trigger further adaptive experimentation and innovation among local farmers
(Descheemaeker et al. 2016; van de Fliert et al. 2002). Chapter 7.2 discusses specific
agronomic management strategies, potentially to be tested under the suggested partic-
ipatory framework.
Lastly, there exists the potential option of indirectly improving the farmers’ adaptive
capacity towards soil salinity. The present study demonstrated that farmers have a lim-
ited flexibility to respond to the effects of soil salinity. To a considerable degree this is
due to unfavorable socio-economic frame conditions, such as constrained overall re-
source endowment, restricted excess to high quality agronomic inputs, or the strong
dependence on intermediaries for marketing vegetable products (compare chapters 6.1
and 6.4). Institutionalized efforts to tackle these shortcomings would not only improve
the functioning of the local agricultural value chains, but may indirectly allow farmers to
implement more sophisticated coping strategies with regard to soil salinity.
7.2 Agronomic Management Approaches
The present study demonstrated that local farmers already effectively apply a set of
agronomic measures to manage soil salinity; including the use of organic soil amend-
ments, mineral fertilizer application, simple land shaping techniques, the targeted
choice of tolerant crop species, increased watering intensity, and land use
extensification. The respective approaches are highly determined by the current bio-
physical and socio-economic frame conditions; as has been recapitulated and dis-
cussed in chapters 6.1 and 6.4. The recommendation of any additional approach thus
has to take into account the limited flexibility of local farmers to modify their current
management practices. In order to achieve a high probability of adoption, local salinity
management innovations should directly build on already established practices
(Descheemaeker et al. 2016; van de Fliert et al. 2002). Against the background of gen-
erally low resource endowment of local farmers and the restricted excess to high quali-
ty inputs via the existing supply channels, currently, only low-cost and low-external-
input technologies can be considered as feasible options (compare chapter 7.1). Table
9 summarizes potential entry points which largely meet these requirements. The sug-
gested approaches include: (a) improved irrigation management, (b) mulching, (c) in-
tensified and diversified use of organic soil amendments, (d) targeted fertilizer man-

70
agement, (e) selection of tolerant crop varieties, (f) promotion of previously under-
utilized tolerant crop species, and (g) targeted catch and intercropping. These recom-
mendations are based on the recent standard of technical knowledge, as outlined in
chapter 2.3.
Table 9: Recommendations for agronomic management approaches.
Approach Explanations
Adapted irrigation management
consistent compliance with below canopy application of irrigation wa-
ter could limit the risk of leaf burn; simple drip irrigation installations
could improve water use efficiencies and counteract root zone salini-
zation
Mulching the use of locally available organic mulch material may improve water
use efficiencies and counteract root zone salinization; the potential
promotion of disease development has to be considered
Organic soil amendments
diversification and intensification of the use of locally available organic
soil amendments could balance the negative effects of soil salinity;
improved composting methods for animal manures, household wastes
and farm residues as well as intensified green manuring could consti-
tute feasible entry points
Adapted management of
mineral fertilizers
alternative application patterns for the conventional mineral fertilizers
(urea, NPK) could improve nutrient use efficiencies under saline condi-
tions; sub surface placement and split applications could constitute
feasible entry points
Biofertilizers
biofertilizer products on the basis of local substrates could be hypoth-
esized to alleviate salt stress conditions; intensification and diversifica-
tion of current practices may lead to the identification effective formu-
lations
Tolerant crop varieties systematic evaluation of the locally available intraspecific variability of
salt tolerance may lead to the identification of crop varieties with an
increased adaptability to the local stress conditions
Tolerant previously
under-utilized crop species
several crop species which are known to be comparatively salt tolerant
are currently only minor crops within the local production system; this
includes Amaranthus spp., Brassica juncea, Diplotaxis tenuifolia, Por-
tulaca oleracea, Talinum triangulare, and Tetragonia tetragonioides;
the promotion of these species as cash crops or for home consump-
tion can be considered a feasible adaptation strategy
Ameliorating intercrops
the use of herbaceous salt accumulating intercrops may improve the
growing conditions for the main vegetable crop and thus potentially
leads to increased yields; the respective intercrop may be additionally
used as a leafy vegetable; potential candidate species are, inter alia,
Atriplex hortensis and Portulaca oleracea
Ameliorating catch crops
a large share of the local salt-affected plots is typically left fallow for
several month during the rainy season; this could constitute an entry
point for the targeted use of catch crops with phytoremediating capaci-
ties; potential candidate species are plants which tolerate water log-
ging, such as Sesbania aculeata and Leptochloa fusca

71
However, it needs to be stressed that participatory field trials would be indispensable to
actually validate their practicability under local conditions (Descheemaeker et al. 2016;
Hoffmann et al. 2007). For example, the consistent implementation of most of the pro-
posed approaches implies an increased labor input. The fact that labor availability cur-
rently already is a relevant constraining factor within Maputos’ Green Zones may ren-
der some of the recommendations less feasible. Further aspects which may limit the
adoptability of selected approaches are local market demands and marketing struc-
tures. In particular, this refers to the recommended use of more tolerant crop species
and cultivars. As long as respective crops can’t be successfully marketed, they don’t
constitute viable alternatives to current conventional vegetable products (compare
chapter 6.1). Apart from socio-economic frame conditions, the spatio-temporal variabil-
ity of bio-physical factors should be taken into account (Ojiem et al. 2006). In particular
this refers to the spatial pattern of soil salinity, which has been demonstrated to be
highly variable within Maputos’ Green Zones (compare chapter 6.5). The feasibility of
the listed approaches potentially differs between slightly and highly salt-affected pro-
duction zones. A further factor which complicates generalized recommendations is the
high heterogeneity of local hydrological and pedological conditions (compare chapter
3.4). Taking the example of targeted catch cropping; this strategy presumably would
prove more feasible in zones of high salinity and/or proneness to water logging. Since
these areas are typically left fallow throughout the rainy season, the use of catch crops
wouldn’t compete with the cultivation of marketable vegetable crops.

72
8 Conclusion and Outlook
The present study confirmed that soil salinity is a significant agronomic constraint to the
farmers in the peri-urban vegetable production zones of Maputo, Mozambique. Hence,
it constitutes a significant factor which shapes local production and livelihood ration-
ales. The investigation of local knowledge, perception and agronomic management,
through predominantly qualitative and participatory methods, proved effective in the
initial description of the extend of soil salinity and its embedding into the local bio-
physical and socio-economic context. Nonetheless, due to resource constraints, the
present study was limited to a biased exploratory approach. More in-depth studies,
including randomized stakeholder surveys and large-scale soil and water mapping,
would be required to gain a comprehensive and fully conclusive estimation of the local
situation.
Maputos’ market gardening zones are located in two extensive coastal lowlands bor-
dering the central built up city, where the influence of seawater intrusion and saline
marine sediments traditionally has been of relevance. However, throughout the last
decades, progressing salinization of horticulturally used land is perceived as an in-
creasing problem. It is mostly ascribed to an insufficient management and maintenance
of the local drainage systems. The present study indicates that Maputos’ farmers and
extension workers have a profound and differentiated understanding of the spatio-
temporal dynamics of soil salinity and its agronomic management. Typically, farmers
detect elevated salt levels in the fields through the observation of plant symptoms and
salt crusts, or by tasting soil and irrigation water. In the long term, farmers evaluate soil
salinity levels on the overall productivity of their respective fields. Common agronomic
strategies to cope with salinity include: (a) use of organic soil amendments, (b) mineral
fertilizer application, (c) simple land-shaping techniques, (d) increased watering intensi-
ties, (e) the use of salt tolerant crop species, and (f) land use extensification. On a so-
cio-economic level, the problem is met by a balanced allocation of plots, direct market-
ing strategies, and land use change initiatives. The participatory soil and water survey
demonstrated that the assessment of soil salinity through local farmers is largely sup-
ported by technical ECe and ECw measurements.
Generally speaking, the local knowledge and management system of soil salinity thus
proves to be largely in accordance with existing reports from other smallholder settings
and also with common scientific explanations and recommendations. Nonetheless, the
study identified several entry points for technical and institutional innovations that could
support and improve current management practices. Respective approaches are how-
ever highly conditioned by the present bio-physical and socio-economic frame condi-

73
tions which limit the capacity of local farmers and relevant state institutions to effective-
ly approach the issue. According to the studies’ insights, the low overall resource en-
dowment of farmers, the restricted access to high quality agricultural inputs, as well as
the financial and organizational shortcomings of state institutions have to be consid-
ered as the most significant constraining factors. This situation exemplifies the im-
portance to reorganize and strengthen local institutions, in order to promote an ena-
bling environment for farmers and other stakeholders to actively tackle the problem of
soil salinity. Most importantly this would need to involve the sustained restoration of the
existing drainage systems. Only in this way continued salinization could be prevented
and effective land reclamation realized.
But already under the current circumstances, the introduction of innovative agronomic
management strategies might be feasibly promoted by the local extension services.
Low-cost technologies such as (a) improved irrigation management, (b) mulching, (c)
intensified and diversified use of organic soil amendments, (d) targeted fertilizer man-
agement, (e) selection of tolerant crop varieties, (f) cultivation of previously under-
utilized tolerant crop species, and (g) targeted catch and intercropping would respond
to the low financial and technological resource endowment of local farmers, and could
easily build on already existing strategies. Regular technical monitoring of soil and wa-
ter resources should be considered as a complementary strategy, in order to facilitate
agronomic decision making. It needs to be stressed that participatory field testing of the
above listed agronomic approaches would be indispensable to validate their practicabil-
ity under the local conditions.
On a global scale, more in depth case studies are necessary to reveal universal pat-
terns of farmers’ knowledge, perception, and management with regard to soil salinity.
To allow for maximum comparability, respective studies should follow consistent con-
ceptual and methodological frameworks. In this regard, the present study may provide
first directions. However, explorative approaches have to be combined with application-
oriented research. Especially participatory field trials of scientifically proven technolo-
gies should be forced, in order to evaluate their practicability under field conditions,
promote their adoption in smallholder vegetable production systems, and to steer local
innovation processes.

9 References Abdel Latef AAH, Chaoxing H (2011) Effect of arbuscular mycorrhizal fungi on growth,
mineral nutrition, antioxidant enzymes activity and fruit yield of tomato grown under
salinity stress. Scientia Horticulturae 127:228–233. doi:
10.1016/j.scienta.2010.09.020
Abdel-Mawgoud AMR, El-Nemr MA, Tantawy AS, Habib HA (2010) Alleviation of salini-
ty effects on green bean plants using some environmental friendly materials. Jour-
nal of Applied Sciences Research 6:871–878
Ado MN, Guero Y, Michot D, Soubeiga B, Senga Kiesse T, Walter C (2016)
Phytodesalinization of irrigated saline Vertisols in the Niger Valley by Echinochloa
stagnina. Agricultural Water Management 177:229–240. doi:
10.1016/j.agwat.2016.07.024
Agong SG, Schittenhelm S, Friedt W (1997) Assessment of tolerance to salt stress in
Kenyan tomato germplasm. Euphytica 95:57–66. doi: 10.1023/A:1002933325347
Ahmad S, Ghafoor A, Akhtar ME, Khan MZ (2013) Ionic displacement and reclamation
of saline‐sodic soils using chemical amendments and crop rotation. Land Degrada-
tion & Development 24:170–178
Akhtar M, Hussain F, Ashraf MY, Qureshi TM, Akhter J, Awan AR (2012) Influence of
Salinity on Nitrogen Transformations in Soil. Communications in Soil Science and
Plant Analysis 43:1674–1683. doi: 10.1080/00103624.2012.681738
Alam MA, Juraimi AS, Rafii MY, Hamid AA, Aslani F (2014) Screening of purslane
(Portulaca oleracea L.) accessions for high salt tolerance. The Scientific World
Journal 2014. doi: 10.1155/2014/627916
Alfa MI, Adie DB, Igboro SB, Oranusi US, Dahunsi SO, Akali DM (2014) Assessment of
biofertilizer quality and health implications of anaerobic digestion effluent of cow
dung and chicken droppings. Renewable Energy 63:681–686. doi:
10.1016/j.renene.2013.09.049
Ali AMS (2003) Farmers' knowledge of soils and the sustainability of agriculture in a
saline water ecosystem in Southwestern Bangladesh. Geoderma 111:333–353.
doi: 10.1016/S0016-7061(02)00271-9
Al-Sadi AM, Al-Masoudi RS, Al-Habsi N, Al-Said FA, Al-Rawahy SA, Ahmed M,
Deadman ML (2010) Effect of salinity on pythium damping-off of cucumber and on
the tolerance of Pythium aphanidermatum. Plant Pathology 59:112–120. doi:
10.1111/j.1365-3059.2009.02176.x
Ammari TG, Tahboub AB, Saoub HM, Hattar BI, Al-Zu’bi YA (2008) Salt removal effi-
ciency as influenced by phyto-amelioration of salt-affected soils. Journal of Food,
Agriculture and Environment 6:456–460. doi: 10.1234/4.2008.1372
Amukali O, Obadoni BO, Mensah JK (2015) Effects of different NaCl concentrations on
germination and seedling growth of Amaranthus hybridus and Celosia argentea.
African Journal of Environmental Science and Technology 9:301–306. doi:
10.5897/AJEST2014.1819
Armazia HDRL, Chilundo M, Brito R, Munguambe P (2014) Avaliação de qualidade da
água “QA” no rio Mulaúze-vale do infulene, Universidade Eduardo Mondlane,
Faculdade de Agronomia e Engenharia Florestal, Maputo
Aroca R, Ruiz-Lozano JM, Zamarreño AM, Paz JA, García-Mina JM, Pozo MJ, López-
Ráez JA (2013) Arbuscular mycorrhizal symbiosis influences strigolactone produc-
tion under salinity and alleviates salt stress in lettuce plants. Journal of Plant Phys-
iology 170:47–55. doi: 10.1016/j.jplph.2012.08.020

Ashraf M, Bashir A (2003) Salt stress induced changes in some organic metabolites
and ionic relations in nodules and other plant parts of two crop legumes differing in
salt tolerance. Flora 198:486–498. doi: 10.1078/0367-2530-00121
Ashraf M, Harris PJC (2004) Potential biochemical indicators of salinity tolerance in
plants. Plant Science 166:3–16. doi: 10.1016/j.plantsci.2003.10.024
Ashraf MY, Ashraf M, Mahmood K, Akhter J, Hussain F, Arshad M (2010) Phytoreme-
diation of Saline Soils for Sustainable Agricultural Productivity. In: Ashraf M, Ozturk
M, Ahmad MSA (eds) Plant Adaptation and Phytoremediation. Springer Nether-
lands, Dordrecht, pp 335–355
Assaha DVM, Mekawy AMM, Liu L, Noori MS, Kokulan KS, Ueda A, Nagaoka T,
Saneoka H (2017) Na+ Retention in the Root is a Key Adaptive Mechanism to Low
and High Salinity in the Glycophyte, Talinum paniculatum (Jacq.) Gaertn.
(Portulacaceae). Journal of Agronomy and Crop Science 203:56–67. doi:
10.1111/jac.12184
Atkinson NJ, Urwin PE (2012) The interaction of plant biotic and abiotic stresses: From
genes to the field. Journal of Experimental Botany 63:3523–3543. doi:
10.1093/jxb/ers100
Ayers RS, Westcot DW (1985) Water quality for agriculture. Irrigation and drainage
paper, vol 29. FAO, Rome
Bacci M (2014) Climate Change Hazard Identification in the Maputo Area. In: Macchi S,
Tiepolo M (eds) Climate Change Vulnerability in Southern African Cities: Building
Knowledge for Adaptation. Springer International Publishing, Cham, pp 143–154
Balasankar D, Praneetha S, Arumugam T, Manivannan N, Jeyakumar P,
Arulmozhiselvan K (2017) Assessment of salinity tolerance in chilli (Capsicum
annuum L.) genotypes. International Journal of Chemical Studies 5:1194–1198
Barbero-Sierra C, Marques MJ, Ruíz-Pérez M, Bienes R, Cruz-Maceín JL, Goss M
(2016) Farmer knowledge, perception and management of soils in the Las Vegas
agricultural district, Madrid, Spain. Soil Use and Management 32:446–454. doi:
10.1111/sum.12278
Barghusen R, Bayer ST, Kiesler T, Krupp L, Mahlkow H, Feitosa Maia E, Müller LFC,
Neuwald M, Späth K, Wagner N (2016) Urban Agriculture in Maputo: Status Quo.
Final report of the study project “Urban Agriculture in Maputo, Mozambique”, Hum-
boldt-University of Berlin, Berlin
Barrett-Lennard EG, Shabala S (2013) The waterlogging/salinity interaction in higher
plants revisited?: Focusing on the hypoxia-induced disturbance to K+ homeostasis.
Functional Plant Biology. doi: 10.1071/FP12235
Bartha C, Fodorpataki L, Székely G, Popescu O (2010) Physiological diversity of let-
tuce cultivars exposed to salinity stress. Contribuţii Botanice 45:47–56
Baum C, El-Tohamy W, Gruda N (2015) Increasing the productivity and product quality
of vegetable crops using arbuscular mycorrhizal fungi: A review. Scientia
Horticulturae 187:131–141. doi: 10.1016/j.scienta.2015.03.002
Bazihizina N, Barrett-Lennard EG, Colmer TD (2012) Plant growth and physiology un-
der heterogeneous salinity. Plant Soil 354:1–19. doi: 10.1007/s11104-012-1193-8
Bernard HR (2011) Research methods in anthropology: Qualitative and quantitative
approaches, 5th ed. AltaMira, Lanham
Bhardwaj D, Ansari MW, Sahoo RK, Tuteja N (2014) Biofertilizers function as key play-
er in sustainable agriculture by improving soil fertility, plant tolerance and crop
productivity. Microbial Cell Factories 13:66. doi: 10.1186/1475-2859-13-66

Biggs TW, Jiang B (2009) Soil salinity and exchangeable cations in a wastewater irri-
gated area, India. Journal of Environmental Quality 38:887–896. doi:
10.2134/jeq2008.0247
Bing Maps. https://www.bing.com/maps/
Binns JA, Maconachie RA, Tanko AI (2003) Water, land and health in urban and peri-
urban food production: The case of Kano, Nigeria. Land Degradation & Develop-
ment 14:431–444. doi: 10.1002/ldr.571
Bouarfa S, Marlet S, Douaoui A, Hartani T, Mekki I, Ghazouani W, Aissa IB, Vincent B,
Hassani F, Kuper M (2009) Salinity patterns in irrigation systems, a threat to be
demystified, a constraint to be managed: Field evidence from Algeria and Tunisia.
Irrigation and Drainage 58:273-284. doi: 10.1002/ird.524
Braccio S (2014) Flood-Prone Areas Due to Heavy Rains and Sea Level Rise in the
Municipality of Maputo. In: Macchi S, Tiepolo M (eds) Climate Change Vulnerability
in Southern African Cities: Building Knowledge for Adaptation. Springer Interna-
tional Publishing, Cham, pp 171–185
Buechler S, Mekala GD (2016) Local Responses to Water Resource Degradation in
India: Groundwater Farmer Innovations and the Reversal of Knowledge Flows. The
Journal of Environment & Development 14:410–438. doi:
10.1177/1070496505281840
Burman D, Mandal S, Bandopadhyay BK, Maji B, Sharma DK, Mahanta KK, Sarangi
SK, Mandal UK, Patra S, De S, Mandal B, Maitra NJ, Ghoshal TK, Velmurugan A
(2015) Unlocking Production Potential of Degraded Coastal Land through Innova-
tive Land Management Practices: A Synthesis. Journal of Soil Salinity and Water
Quality 7:12–18
Cachomba IS, Smart JC, Snyder J, Tschirley D (2016) Risk Perception and Behavior in
Pesticide Use by the Horticultural Producers of Maputo. In: Smart JC (ed) Special
Issue Collection of Short Papers Focused on Horticultural Production in the Areas
Supplying Maputo. Mozambique: Directorate of Economics, Ministry of Agriculture,
Maputo, pp 40–49
Canellas LP, Olivares FL, Aguiar NO, Jones DL, Nebbioso A, Mazzei P, Piccolo A
(2015) Humic and fulvic acids as biostimulants in horticulture. Scientia
Horticulturae 196:15–27. doi: 10.1016/j.scienta.2015.09.013
Capiati DA, País SM, Téllez-Iñón MT (2006) Wounding increases salt tolerance in to-
mato plants: Evidence on the participation of calmodulin-like activities in cross-
tolerance signalling. Journal of Experimental Botany 57:2391–2400. doi:
10.1093/jxb/erj212
Carter CT, Grieve CM, Poss JA, Suarez DL (2005) Production and ion uptake of Celo-
sia argentea irrigated with saline wastewaters. Scientia Horticulturae 106:381–394.
doi: 10.1016/j.scienta.2005.04.007
Centofanti T, Bañuelos G (2015) Evaluation of the halophyte Salsola soda as an alter-
native crop for saline soils high in selenium and boron. Journal of Environmental
Management 157:96–102. doi: 10.1016/j.jenvman.2015.04.005
Cheeseman JM (2013) The integration of activity in saline environments: Problems and
perspectives. Functional Plant Biology 40:759. doi: 10.1071/FP12285
Cheeseman JM (2015) The evolution of halophytes, glycophytes and crops, and its
implications for food security under saline conditions. The New Phytologist
206:557–570. doi: 10.1111/nph.13217
Chibantão GVG (2012) Controlo da qualidade da água do rio Infulene para fins de
irrigação. Bachelor Thesis, Universidade Eduardo Mondlane, Maputo

Choudhary OP, Yaduvanshi NPS (2016) Nutrient Management in Salt-affected Soils.
Indian Journal of Fertilisers 12:20–35
Choudhary OP, Ghuman BS, Bijay-Singh, Thuy N, Buresh RJ (2011) Effects of long-
term use of sodic water irrigation, amendments and crop residues on soil proper-
ties and crop yields in rice–wheat cropping system in a calcareous soil. Field Crops
Research 121:363–372. doi: 10.1016/j.fcr.2011.01.004
Cochet H (2012) The systeme agraire concept in francophone peasant studies.
Geoforum 43:128–136. doi: 10.1016/j.geoforum.2011.04.002
Colla G, Rouphael Y, Fallovo C, Cardarelli M, Graifenberg A (2006) Use of Salsola
soda as a companion plant to improve greenhouse pepper (Capsicum annuum)
performance under saline conditions. New Zealand Journal of Crop and Horticul-
tural Science 34:283–290. doi: 10.1080/01140671.2006.9514418
Colla G, Rouphael Y, Leonardi C, Bie Z (2010) Role of grafting in vegetable crops
grown under saline conditions. Scientia Horticulturae 127:147–155. doi:
10.1016/j.scienta.2010.08.004
Colla G, Rouphael Y, Jawad R, Kumar P, Rea E, Cardarelli M (2013) The effectiveness
of grafting to improve NaCl and CaCl2 tolerance in cucumber. Scientia
Horticulturae 164:380–391. doi: 10.1016/j.scienta.2013.09.023
Cox M (2015) A basic guide for empirical environmental social science. Ecology and
Society 20:63. doi: 10.5751/ES-07400-200163
Crane TA (2014) Bringing Science and Technology Studies into Agricultural Anthropol-
ogy: Technology Development as Cultural Encounter between Farmers and Re-
searchers. Culture, Agriculture, Food and Environment 36:45–55. doi:
10.1111/cuag.12028
Creswell JW, Creswell JD (2018) Research design: Qualitative, quantitative, and mixed
methods approaches, 5th edn. Sage, Los Angeles, London, New Delhi
Crush J, Hovorka A, Tevera D (2011) Food security in Southern African cities. Pro-
gress in Development Studies 11:285–305. doi: 10.1177/146499341001100402
da Silva FLB, de Lacerda CF, de Sousa GG, Neves ALR, da Silva GL, Sousa CHC
(2011) Interação entre salinidade e biofertilizante bovino na cultura do feijão-de-
corda. Revista Brasileira de Engenharia Agricola e Ambiental 15:383–389
Dalton FN, Maggio A, Piccinni G (1997) Effect of root temperature on plant response
functions for tomato: comparison of static and dynamic salinity stress indices. Plant
and Soil 192:307–319. doi: 10.1023/A:1004263505595
DASACM (2017) Ponto de Situação do Plano de Accão de Produção Agrária e
Pesqueira, Presentation given by: Direção da Agricultura e da Segurança
Alimentar da Cidade de Maputo (DASACM), Maputo
de Oliveira FdA, Carrilho MJSdO, de Medeiros JF, Maracajá PB, de Oliveira MKT
(2011) Desempenho de cultivares de alface submetidas a diferentes níveis de
salinidade da água de irrigação. Revista Brasileira de Engenharia Agrícola e
Ambiental 15:771–777. doi: 10.1590/S1415-43662011000800002
de Oliveira DS, Dias TJ, de Oliveira EP, Santos HC, de Magalhaes WB, Matos BF, de
Melo Cavalcante Sousa L, de Melo Filho JS (2016) Growth and physiology of pea-
nut (Arachis hypogaea L.) irrigated with saline water and biofertilizer application
times. African Journal of Agricultural Research 11:4517–4524
de Sousa LV (2014) Experiências de agricultura (peri)urbana coletiva: outras
experiências económicas? Doctoral Dissertation, University of Coimbra, Coimbra
de Sousa GG, Azevedo BMd, Albuquerque AHP, Mesquita JBRd, Viana TVdA (2012)
Características agronômicas do amendoinzeiro sob irrigação com águas salinas

em solo com biofertilizantes. REVISTA AGRO@MBIENTE ON-LINE 6:124. doi:
10.18227/1982-8470ragro.v6i2.708
de Vos AC, Broekman R, Almeida Guerra CC de, van Rijsselberghe M, Rozema J
(2013) Developing and testing new halophyte crops: A case study of salt tolerance
of two species of the Brassicaceae, Diplotaxis tenuifolia and Cochlearia officinalis.
Environmental and Experimental Botany 92:154–164. doi:
10.1016/j.envexpbot.2012.08.003
Descheemaeker K, Ronner E, Ollenburger M, Franke AC, Klapwijk CJ, Falconnier GN,
Wichern J, Giller KE (2016) Which options fit best?: Operationalizing the socio-
ecological niche concept. Experimental Agriculture 4:1–22. doi:
10.1017/S001447971600048X
Devkota M, Gupta RK, Martius C, Lamers J, Devkota KP, Sayre KD, Vlek P (2015) Soil
salinity management on raised beds with different furrow irrigation modes in salt-
affected lands. Agricultural Water Management 152:243–250. doi:
10.1016/j.agwat.2015.01.013
DeWalt KM, DeWalt BR (2011) Participant observation: A guide for fieldworkers, 2nd
edn. AltaMira Press, Lanham
DeWalt BR (1994) Using Indigenous Knowledge to Improve Agriculture and Natural
Resource Management. Human Organization 53:123–131. doi:
10.17730/humo.53.2.ku60563817m03n73
Diacono M, Montemurro F (2015) Effectiveness of Organic Wastes as Fertilizers and
Amendments in Salt-Affected Soils. Agriculture 5:221–230. doi:
10.3390/agriculture5020221
Dörrbecker M (n.d.) Map of the districts of Maputo.
https://en.wikipedia.org/wiki/Maputo#/media/File:Map_Districts_of_Maputo.png.
Accessed 27 February 2019
Dykshoorn JA, Marques M, Serno G (1988) Estudo pedo-hidrológico do Vale do
Infulene parte sul da via rápida da Moamba: Parte A: Solos, INIA, Maputo
Ebert AW, Schafleitner R (2015) Utilization of Wild Relatives in the Breeding of Tomato
and Other Major Vegetables. In: Redden R, Yadav SS, Maxted N, Dulloo ME,
Guarino L, Smith P (eds) Crop Wild Relatives and Climate Change. John Wiley &
Sons, Hoboken, pp 141–172
Egamberdieva D, Davranov K, Wirth S, Hashem A, Abd Allah EF (2017) Impact of soil
salinity on the plant-growth-promoting and biological control abilities of root associ-
ated bacteria. Saudi Journal of Biological Sciences 24:1601–1608. doi:
10.1016/j.sjbs.2017.07.004
El-Fadel M, Deeb T, Alameddine I, Zurayk R, Chaaban J (2018) Impact of groundwater
salinity on agricultural productivity with climate change implications. International
Journal of Sustainable Development and Planning 13:445–456. doi: 10.2495/SDP-
V13-N3-445-456
Elhindi KM, El-Din AS, Elgorban AM (2017) The impact of arbuscular mycorrhizal fungi
in mitigating salt-induced adverse effects in sweet basil (Ocimum basilicum L.).
Saudi Journal of Biological Sciences 24:170–179. doi: 10.1016/j.sjbs.2016.02.010
El-Mageed TAA, Semida WM, Abd El-Wahed MH (2016) Effect of mulching on plant
water status, soil salinity and yield of squash under summer-fall deficit irrigation in
salt affected soil. Agricultural Water Management 173:1–12. doi:
10.1016/j.agwat.2016.04.025

Eschweiler JA (1986) As Possibilidades para Agricultura de uma Parte da Baixa
Costeira. (Distrito de Maputo): Parte A: Aspectos Pedologicos - A Terra e sua
Aptidao Agricola, INIA, Maputo
Evelin H, Giri B, Kapoor R (2012) Contribution of Glomus intraradices inoculation to
nutrient acquisition and mitigation of ionic imbalance in NaCl-stressed Trigonella
foenum-graecum. Mycorrhiza 22:203–217. doi: 10.1007/s00572-011-0392-0
FAO (2015) Status of the world's soil resources: Main report. FAO; ITPS, Rome
Flowers TJ, Colmer TD (2008) Salinity tolerance in halophytes. The New Phytologist
179:945–963. doi: 10.1111/j.1469-8137.2008.02531.x
Flowers TJ, Galal HK, Bromham L (2010) Evolution of halophytes: Multiple origins of
salt tolerance in land plants. Functional Plant Biology 37:604. doi:
10.1071/FP09269
Geurts P (1996) Manual Para a Classificação, Quantificação e Interpretação de
Análises Laboratoriais de Solo e Água. Série Terra e Água. Instituto de
Investigação Agrária de Moçambique (IIAM), Maputo
Ghassemi F, Jakeman AJ, Nix HA (1995) Salinisation of land and water resources:
Human causes, extent, management and case studies. UNSW Press, Sydney
Giller KE (2013) Can We Define the Term ‘Farming Systems’?: A Question of Scale.
Outlook on Agriculture 42:149–153. doi: 10.5367/oa.2013.0139
Giordano R, Liersch S, Vurro M, Hirsch D (2010) Integrating local and technical
knowledge to support soil salinity monitoring in the Amudarya river basin. Journal
of Environmental Management 91:1718–1729. doi: 10.1016/j.jenvman.2010.03.010
Glaeser B (1995) Environment, development, agriculture: Integrated policy through
human ecology. Sharpe, Armonk, New York
Gomes F, Mafalacusser J, Marques MR (1998) Mozambique country paper: Wetlands
for agricultural development. In: FAO (ed) Wetland Characterization and Classifica-
tion for Sustainable Agricultural Development: Proceedings of the Sub-Regional
Consultation, Harare, Zimbabwe
Graifenberg A, Botrini L, Giustiniani L, Filippi F, Curadi M (2003) Tomato Growing in
Saline Conditions with Biodesalinating Plants: Salsola soda L., and Portulaca
oleracea L. Acta Horticulturae:301–305. doi: 10.17660/ActaHortic.2003.609.45
Grattan SR, Grieve CM (1999) Salinity-mineral nutrient relations in horticultural crops.
Scientia Horticulturae 78:127–157
Grieve CM (2011) Salinity-Induced Enhancement of Horticultural Crop Quality. In:
Pessarakli M (ed) Handbook of plant and crop stress. CRC Press, Boca Raton,
pp 1173–1194
Grieve CM, Suarez DL (1997) Purslane (Portulaca oleracea L.): A halophytic crop for
drainage water reuse systems. Plant and Soil 192:277–283. doi:
10.1023/A:1004276804529
Grieve CM, Grattan SR, Maas EV (2012) Plant Salt Tolerance. In: Wallender WW,
Tanji KK (eds) Agricultural salinity assessment and management. ASCE, Reston,
pp 405–459
Grubben GJH, Denton OA (eds) (2004) Vegetables. Plant resources of tropical Africa,
vol 2. PROTA, Wageningen
Haber LL, Ecole CC, Bowen W, Resende FV (eds) (2015) Horticultura em
Moçambique: Características, Tecnologias de Produção e de Pós-Colheita.
Embrapa; Instituto de Investigação Agrária de Moçambique (IIAM); University of
Florida, Brasília

Haider MZ, Hossain MZ (2013) Impact of salinity on livelihood strategies of farmers.
Journal of Soil Science and Plant Nutrition 13:417–431. doi: 10.4067/S0718-
95162013005000033
Halder S, Agüero J, Dolle P, Fernández E, Schmidt C, Yang M (2018) Perspectives of
urban agriculture in Maputo and Cape Town: Dialogue, networks and future sce-
narios, S 275. SLE, Berlin
Hamidov A, Beltrao J, Costa C, Khaydarova V, Sharipova S (2007a) Environmentally
Useful Technique - Portulaca oleracea Golden Purslane as a Salt Removal Spe-
cies. WSEAS Transactions on Environment and Development 3:117–122
Hamidov A, Khaydarova V, Khamidov M, Neves A, Beltrao J (2007b) Remediation of
Saline Soils using Apocynum lancifolium and Chenopodium album. In: Markatos N
(ed) Proceedings of the 3rd IASME/WSEAS International Conference on Energy,
Environment, Ecosystems and Sustainable Development: Agios Nikolaos, Greece,
July 24 - 26, 2007. WSEAS Press, Athen, pp 157–164
Hannachi S, van Labeke M-C (2018) Salt stress affects germination, seedling growth
and physiological responses differentially in eggplant cultivars (Solanum
melongena L.). Scientia Horticulturae 228:56–65. doi:
10.1016/j.scienta.2017.10.002
Hanson BR, Grattan SR (2012) Field Sampling of Soil, Water, and Plants. In:
Wallender WW, Tanji KK (eds) Agricultural salinity assessment and management.
ASCE, Reston, pp 275–293
Hanson BR, Grattan SR, Fulton A (2006) Agricultural Salinity and Drainage. Division of
Agriculture and Natural Resources Publication. Regents of the University of Cali-
fornia, Davis
Hargreaves JC, Adl MS, Warman PR (2008) A review of the use of composted munici-
pal solid waste in agriculture. Agriculture, Ecosystems & Environment 123:1–14.
doi: 10.1016/j.agee.2007.07.004
Hasaneen MN, Younis ME, Tourky SM (2009) Plant growth, metabolism and adapta-
tion in relation to stress conditions XXIII: Salinity-biofertility interactive effects on
growth, carbohydrates and photosynthetic efficiency of lactuca sativa. Plant Omics
2:60–69
Hoffmann V, Probst K, Christinck A (2007) Farmers and researchers: How can collabo-
rative advantages be created in participatory research and technology develop-
ment? Agriculture and Human Values 24:355–368. doi: 10.1007/s10460-007-9072-
2
Hu Y, Schmidhalter U (2005) Drought and salinity: A comparison of their effects on
mineral nutrition of plants. Journal of Plant Nutrition and Soil Science 168:541–549.
doi: 10.1002/jpln.200420516
Ilangumaran G, Smith DL (2017) Plant Growth Promoting Rhizobacteria in Amelioration
of Salinity Stress: A Systems Biology Perspective. Frontiers in Plant Science
8:1768. doi: 10.3389/fpls.2017.01768
INE (2017) Censo 2017, Recenseamento Geral da População e Habitação: Divulgação
os Resultados Preliminares. http://www.ine.gov.mz/operacoes-
estatisticas/censos/censo-2007/censo-2017/divulgacao-os-resultados-
preliminares-iv-rgph-2017. Accessed 27 February 2019
Jesus JM, Danko AS, Fiúza A, Borges M-T (2015) Phytoremediation of salt-affected
soils: A review of processes, applicability, and the impact of climate change. Envi-
ronmental Science and Pollution Research International 22:6511–6525. doi:
10.1007/s11356-015-4205-4

Karakas S, Cullu MA, Kaya C, Dikilitas M (2016) Halophytic Companion Plants Improve
Growth and Physiological Parameters of Tomato Plants Grown under Salinity. Pa-
kistan Journal of Botany 48:21–28
Karlberg L, Penning de Vries FW (2004) Exploring potentials and constraints of low-
cost drip irrigation with saline water in sub-Saharan Africa. Physics and Chemistry
of the Earth 29:1035–1042. doi: 10.1016/j.pce.2004.08.004
Karlberg L, Rockström J, Annandale JG, Steyn JM (2007) Low-cost drip irrigation - A
suitable technology for southern Africa?: An example with tomatoes using saline ir-
rigation water. Agricultural Water Management 89:59–70. doi:
10.1016/j.agwat.2006.12.011
Kashenge-Killenga S, Tongoona P, Derera J, Kanyeka Z (2014) Farmers’ perception of
salt affected soils and rice varieties preferences in the north-eastern Tanzania and
their implications in breeding. International Journal of Development and Sustaina-
bility 3:1257–1271
Kielen N (1996) Farmers' Perceptions on Salinity and Sodicity: A case study into farm-
ers' knowledge of salinity and sodicity, and their strategies and practices to deal
with salinity and sodicity in their farm systems, International Irrigation Management
Institute, Lahore
Kiliç CC, Kukul YS, Anaç D (2008) Performance of purslane (Portulaca oleracea L.) as
a salt-removing crop. Agricultural Water Management 95:854–858. doi:
10.1016/j.agwat.2008.01.019
Kirkwood D (n.d.) Southeastern Africa: Mozambique, Swaziland, and So.
https://www.worldwildlife.org/ecoregions/at0119. Accessed 26 February 2019
Kohler J, Hernández JA, Caravaca F, Roldán A (2009) Induction of antioxidant en-
zymes is involved in the greater effectiveness of a PGPR versus AM fungi with re-
spect to increasing the tolerance of lettuce to severe salt stress. Environmental and
Experimental Botany 65:245–252. doi: 10.1016/j.envexpbot.2008.09.008
Lakhdar A, Rabhi M, Ghnaya T, Montemurro F, Jedidi N, Abdelly C (2009) Effective-
ness of compost use in salt-affected soil. Journal of Hazardous Materials 171:29–
37. doi: 10.1016/j.jhazmat.2009.05.132
Läuchli A, Grattan SR (2007) Plant Growth And Development Under Salinity Stress. In:
Jenks MA, Hasegawa PM, Jain SM (eds) Advances in Molecular Breeding Toward
Drought and Salt Tolerant Crops. Springer Netherlands, Dordrecht, pp 1–32
Leogrande R, Lopedota O, Vitti C, Ventrella D, Montemurro F (2016) Saline water and
municipal solid waste compost application on tomato crop: Effects on plant and
soil. Journal of Plant Nutrition 39:491–501. doi: 10.1080/01904167.2015.1084325
Letey J, Hoffman GJ, Hopmans JW, Grattan SR, Suarez D, Corwin DL, Oster JD, Wu
L, Amrhein C (2011) Evaluation of soil salinity leaching requirement guidelines. Ag-
ricultural Water Management 98:502–506. doi: 10.1016/j.agwat.2010.08.009
Ligate EJ, Martin Kitila M, Chen C, Wu C (2017) Impacts of Salt Water Intrusion on
Maize (Zea mays) and Rice (Oryza sativa) Production under Climate Change Sce-
narios in Bagamoyo District-Tanzania. Universal Journal of Agricultural Research
5:148–158. doi: 10.13189/ujar.2017.050210
Li-Xian Y, Guo-Liang L, Shi-Hua T, Gavin S, Zhao-Huan H (2007) Salinity of animal
manure and potential risk of secondary soil salinization through successive manure
application. The Science of the Total Environment 383:106–114. doi:
10.1016/j.scitotenv.2007.05.027
Lokhande VH, Gor BK, Desai NS, Nikam TD, Suprasanna P (2013) Sesuvium
portulacastrum, a plant for drought, salt stress, sand fixation, food and phytoreme-

diation: A review. Agronomy for Sustainable Development 33:329–348. doi:
10.1007/s13593-012-0113-x
Maas EV, Grattan SR (1999) Crop Yields as Affected by Salinity. In: Skaggs RW, van
Schilfgaarde J (eds) Agricultural Drainage. American Society of Agronomy, Crop
Science Society of America, Soil Science Society of America, pp 55–108
Maas EV, Hoffmann GJ (1977) Crop Salt Tolerance - Current Assessment. Journal of
the Irrigation and Drainage Division 103:115–134
Machado R, Serralheiro R (2017) Soil Salinity: Effect on Vegetable Crop Growth. Man-
agement Practices to Prevent and Mitigate Soil Salinization. Horticulturae 3:30. doi:
10.3390/horticulturae3020030
Maggio A, Dalton F, Piccinni G (2002) The effects of elevated carbon dioxide on static
and dynamic indices for tomato salt tolerance. European Journal of Agronomy
16:197–206. doi: 10.1016/S1161-0301(01)00128-9
Mahanty T, Bhattacharjee S, Goswami M, Bhattacharyya P, Das B, Ghosh A, Tribedi P
(2017) Biofertilizers: A potential approach for sustainable agriculture development.
Environmental Science and Pollution Research International 24:3315–3335. doi:
10.1007/s11356-016-8104-0
Mahmood S, Daur I, Al-Solaimani SG, Ahmad S, Madkour MH, Yasir M, Hirt H, Ali S,
Ali Z (2016) Plant Growth Promoting Rhizobacteria and Silicon Synergistically En-
hance Salinity Tolerance of Mung Bean. Frontiers in Plant Science 7:876. doi:
10.3389/fpls.2016.00876
Mahmoodabadi M, Yazdanpanah N, Sinobas LR, Pazira E, Neshat A (2013) Reclama-
tion of calcareous saline sodic soil with different amendments (I): Redistribution of
soluble cations within the soil profile. Agricultural Water Management 120:30–38.
doi: 10.1016/j.agwat.2012.08.018
Mairura FS, Mugendi DN, Mwanje JI, Ramisch JJ, Mbugua PK, Chianu JN (2008) Sci-
entific evaluation of smallholder land use knowledge in Central Kenya. Land Deg-
radation & Development 19:77–90. doi: 10.1002/ldr.815
Maji B, Lama TD (2016) Improving productivity of vulnerable coastal soils under chang-
ing climate. SATSA Mukhaptra Annual Technical Issue 20:46–52
Malash NM, Flowers TJ, Ragab R (2008) Effect of irrigation methods, management
and salinity of irrigation water on tomato yield, soil moisture and salinity distribu-
tion. Irrigation Science 26:313–323. doi: 10.1007/s00271-007-0095-7
Malik KA, Bilal R, Mehnaz S, Rasul G, Mirza MS, Ali S (1997) Association of nitrogen-
fixing, plant-growth-promoting rhizobacteria (PGPR) with kallar grass and rice. In:
Ladha JK, Bruijn FJ de, Malik KA (eds) Opportunities for Biological Nitrogen Fixa-
tion in Rice and Other Non-Legumes. Springer Netherlands, Dordrecht, pp 37–44
Malla A (2018) SW Maps. Softwel (P) Ltd., Kathmandu, Nepal.
http://swmaps.softwel.com.np/
Matabeia EJL (2015) Distribuição Espacial Da Salinidade Ao Longo Do Rio Mulauze E
Seu Impacto Na Produção De Hortícolas. Bachelor Thesis, Universidade Eduardo
Mondlane, Faculdade de Agronomia e Engenharia Florestal, Maputo
Materechera SA (2011) Soil salinity in irrigated fields used for urban agriculture under a
semi-arid environment of South Africa. African Journal of Agricultural Research
6:3747–3754. doi: 10.5897/AJAR11.510
Matsinhe NP, JuízoI D, Rietveld LC, Persson KM (2008) Water services with inde-
pendent providers in peri-urban Maputo: Challenges and opportunities for long-
term development. Water SA 34:411–420

Mawois M, Aubry C, Le Bail M (2011) Can farmers extend their cultivation areas in ur-
ban agriculture?: A contribution from agronomic analysis of market gardening sys-
tems around Mahajanga (Madagascar). Land Use Policy 28:434–445. doi:
10.1016/j.landusepol.2010.09.004
Mendiburu F (2010) Agricolae: Statistical Procedures for Agricultural Research: R
package version
Midmore DJ (2015) Principles of Tropical Horticulture. Modular texts. CABI, Walling-
ford, Boston
Mishra J, Fatima T, Arora NK (2018) Role of Secondary Metabolites from Plant
Growth-Promoting Rhizobacteria in Combating Salinity Stress. In: Egamberdieva
D, Ahmad P (eds) Plant Microbiome: Stress Response. Springer Singapore, Sin-
gapore, pp 127–163
Mitran T, Mani PK, Basak N, Biswas S, Mandal B (2016) Organic Amendments Influ-
ence on Soil Biological Indices and Yield in Rice-Based Cropping System in
Coastal Sundarbans of India. Communications in Soil Science and Plant Analysis
48:170–185. doi: 10.1080/00103624.2016.1254229
Mittler R (2006) Abiotic stress, the field environment and stress combination. Trends in
Plant Science 11:15–19. doi: 10.1016/j.tplants.2005.11.002
Mohamed HI, Gomaa EZ (2012) Effect of plant growth promoting Bacillus subtilis and
Pseudomonas fluorescens on growth and pigment composition of radish plants
(Raphanus sativus) under NaCl stress. Photosynthetica 50:263–272. doi:
10.1007/s11099-012-0032-8
Montero E, Francisco AM, Montes E, Herrera A (2018) Salinity induction of recycling
Crassulacean acid metabolism and salt tolerance in plants of Talinum triangulare.
Annals of Botany 121:1333–1342. doi: 10.1093/aob/mcy030
Muchimbane ABDA (2010) Estudo dos indicadores de contaminação das águas
subterrâneas por sistemas de saneamento "in situ": Distrito Urbano 4, Cidade de
Maputo - Moçambique. Master Thesis, Universidade de São Paulo, São Paulo
Munns R, Gilliham M (2015) Salinity tolerance of crops - what is the cost? The New
Phytologist 208:668–673. doi: 10.1111/nph.13519
Munns R, Tester M (2008) Mechanisms of salinity tolerance. Annual Review of Plant
Biology 59:651–681. doi: 10.1146/annurev.arplant.59.032607.092911
Munns R, James RA, Gilliham M, Flowers TJ, Colmer TD (2016) Tissue tolerance: An
essential but elusive trait for salt-tolerant crops. Functional Plant Biology 43:1103.
doi: 10.1071/FP16187
Muthukumar T, Bagyaraj DJ, Ashwin R (2017) Arbuscular Mycorrhizal Fungi: Role in
Alleviating Salt Stress in Crop Plants. In: Bagyaraj DJ, Jamaluddin (eds) Microbes
for plant stress management. New India Publishing Agency, New Delhi, pp 221–
243
Nagaz K, Masmoudi MM, Mechlia NB (2012) Effects of deficit drip-irrigation scheduling
regimes with saline water on pepper yield, water productivity and soil salinity under
arid conditions of Tunisia. Journal of Agriculture and Environment for International
Development 106:85-103. doi: 10.12895/jaeid.20122.60
Nascimento JAM, Cavalcante LV, Santos PD, Silva SA, Vieira MS, Oliveira AP (2011)
Efeito da utilização de biofertilizante bovino na produção de mudas de pimentão
irrigadas com água salina. Agraria 6:258–264. doi: 10.5039/agraria.v6i2a1069
Neef A, Neubert D (2011) Stakeholder participation in agricultural research projects: A
conceptual framework for reflection and decision-making. Agriculture and Human
Values 28:179–194. doi: 10.1007/s10460-010-9272-z

Neves A, Miguel MG, Marques C, Panagopoulos T (2007) Tetragonia tetragonioides -
a potential salt removing species: Response to the combined effects of salts and
calcium. In: Markatos N (ed) Proceedings of the 3rd IASME/WSEAS International
Conference on Energy, Environment, Ecosystems and Sustainable Development:
Agios Nikolaos, Greece, July 24 - 26, 2007. WSEAS Press, Athen
Nhantumbo NS (2009) Perceptions about salinity and the existing strategies to cope
with the hazard in the Chókwè irrigated perimeter, Mozambique. Master Thesis,
Wageningen University, Wageningen
Niu G, Rodriguez DS, Call E, Bosland PW, Ulery A, Acosta E (2010) Responses of
eight chile peppers to saline water irrigation. Scientia Horticulturae 126:215–222.
doi: 10.1016/j.scienta.2010.07.016
Ntatsi G, Aliferis KA, Rouphael Y, Napolitano F, Makris K, Kalala G, Katopodis G,
Savvas D (2017) Salinity source alters mineral composition and metabolism of
Cichorium spinosum. Environmental and Experimental Botany 141:113–123. doi:
10.1016/j.envexpbot.2017.07.002
Ojiem JO, de Ridder N, Vanlauwe B, Giller KE (2006) Socio-ecological niche: A con-
ceptual framework for integration of legumes in smallholder farming systems. In-
ternational Journal of Agricultural Sustainability 4:79–93
Oudwater N, Martin A (2003) Methods and issues in exploring local knowledge of soils.
Geoderma 111:387–401. doi: 10.1016/S0016-7061(02)00273-2
Ouni Y, Ghnaya T, Montemurro F, Abdelly C, Lakhdar A (2014) The role of humic sub-
stances in mitigating the harmful effects of soil salinity and improve plant productiv-
ity. International Journal of Plant Production 8:353–374
Oustani M, Halilat M, Chenchouni H (2015) Effect of poultry manure on the yield and
nutriments uptake of potato under saline conditions of arid regions. Emirates Jour-
nal of Food and Agriculture 27:106. doi: 10.9755/ejfa.v27i1.17971
Paganini N, Schelchen A (2018a) Urban Agriculture in Cape Town and Maputo: Urban
Agriculture’s role for Sustainable Urban Food Systems - a regional characterization
and early evidence, SLE, Berlin
Paganini N, Mahalambe A, Luís A (2018b) UrbanGAPs, Como Tornar a Agricultura
Urbana mais Sustentável: Manual de Boas Práticas Agrícolas e Agroecologia para
Agricultores Urbanos, SLE, ABIODES, Berlin
Paganini N, Lemke S, Raimundod I (2019) The potential of urban agriculture towards a
more sustainable urban food system in food-insecure neighbourhoods in Cape
Town and Maputo. Economia Agro-alimentare:401–423. doi: 10.3280/ECAG2018-
003008
Panta S, Flowers T, Lane P, Doyle R, Haros G, Shabala S (2014) Halophyte agricul-
ture: Success stories. Environmental and Experimental Botany 107:71–83. doi:
10.1016/j.envexpbot.2014.05.006
Parida AK, Das AB (2005) Salt tolerance and salinity effects on plants: A review. Eco-
toxicology and Environmental Safety 60:324–349. doi:
10.1016/j.ecoenv.2004.06.010
Patetsos E, Moises AM, Antonio, Maloa R, Artur PL, Mastimbe JF, Mudacuane CT,
Vaz V, Maria A, Monjane, Baliteau S, Courret J, Albouy MP (2016) Manual de
Práticas Agroecológicas na Produção de Hortícolas em Maputo: Compilação da
Experiência de Terreno, ESSOR, Maputo
Payton RW, Barr J, Martin A, Sillitoe P, Deckers JF, Gowing JW, Hatibu N, Naseem
SB, Tenywa M, Zuberi MI (2003) Contrasting approaches to integrating indigenous

knowledge about soils and scientific soil survey in East Africa and Bangladesh.
Geoderma 111:355–386. doi: 10.1016/S0016-7061(02)00272-0
Peel MC, Finlayson BL, McMahon TA (2007) Updated world map of the Köppen-Geiger
climate classification. Hydrology and Earth System Sciences 11:1633–1644. doi:
10.5194/hess-11-1633-2007
Pennock D, Yates T, Braidek J (2007) Soil Sampling Designs. In: Carter MR, Gregorich
E (eds) Soil Sampling and Methods of Analysis, 2nd ed. Taylor & Francis Ltd, Ho-
boken, pp 1–14
Pereira P, Brevik EC, Oliva M, Estebaranz F, Depellegrin D, Novara A, Cerdà A,
Menshov O (2017) Goal Oriented Soil Mapping: Applying Modern Methods Sup-
ported by Local Knowledge. In: Pereira P, Brevik EC, Muñoz-Rojas M, Miller BA
(eds) Soil Mapping and Process Modeling for Sustainable Land Use Management.
Elsevier, Amsterdam, pp 61–83
Pérez-Gómez JdJ, Abud-Archila M, Villalobos-Maldonado JJ, Enciso-Saenz S, Her-
nández de León H, Ruiz-Valdiviezo VM, Gutiérrez-Miceli FA (2017) Vermicompost
and Vermiwash Minimized the Influence of Salinity Stress on Growth Parameters in
Potato Plants. Compost Science & Utilization 25:282–287. doi:
10.1080/1065657X.2017.1333932
Pessarakli M (1991) Formation of saline and sodic soils and their reclamation. Journal
of Environmental Science and Health 26:1303–1320. doi:
10.1080/10934529109375698
Pessarakli M, Szabolcs I (2011) Soil Salinity and Sodicity as Particular Plant/Crop
Stress Factors. In: Pessarakli M (ed) Handbook of plant and crop stress. CRC
Press, Boca Raton, pp 3–21
Plaut Z, Edelstein M, Ben-Hur M (2013) Overcoming Salinity Barriers to Crop Produc-
tion Using Traditional Methods. Critical Reviews in Plant Sciences 32:250–291.
doi: 10.1080/07352689.2012.752236
Pulido J, Bocco G (2014) Local Perception of Land Degradation in Developing Coun-
tries: A Simplified Analytical Framework of Driving Forces, Processes, Indicators
and Coping Strategies. Living Reviews in Landscape Research 8. doi:
10.12942/lrlr-2014-4
Qadir M, Schubert S (2002) Degradation processes and nutrient constraints in sodic
soils. Land Degradation & Development 13:275–294. doi: 10.1002/ldr.504
Qadir M, Ghafoor A, Murtaza G (2000) Amelioration strategies for saline soils: A re-
view. Land Degradation & Development 11:501–521. doi: 10.1002/1099-
145X(200011/12)11:6<501:AID-LDR405>3.0.CO;2-S
Qadir M, Oster JD, Schubert S, Noble AD, Sahrawat KL (2007) Phytoremediation of
Sodic and Saline‐Sodic Soils. In: Sparks DL (ed) Advances in Agronomy, vol 96.
Elsevier, Amsterdam, pp 197–247
Qadir M, Tubeileh A, Akhtar J, Larbi A, Minhas PS, Khan MA (2008) Productivity en-
hancement of salt-affected environments through crop diversification. Land Degra-
dation & Development 19:429–453. doi: 10.1002/ldr.853
Qadir M, Quillérou E, Nangia V, Murtaza G, Singh M, Thomas RJ, Drechsel P, Noble
AD (2014) Economics of salt-induced land degradation and restoration. Natural
Resources Forum 38:282–295. doi: 10.1111/1477-8947.12054
QGIS (2016) QGIS Geographic Information System: Open Source Geospatial Founda-
tion Project. https://qgis.org/de/site/
Rabhi M, Ferchichi S, Jouini J, Hamrouni MH, Koyro H-W, Ranieri A, Abdelly C,
Smaoui A (2010) Phytodesalination of a salt-affected soil with the halophyte

Sesuvium portulacastrum L. to arrange in advance the requirements for the suc-
cessful growth of a glycophytic crop. Bioresource Technology 101:6822–6828. doi:
10.1016/j.biortech.2010.03.097
Rady MM, Abd El-Azeem MMM (2018) Integrative Potassium Humate and Biochar
Application Reduces Salinity Effects and Contaminants, And Improves Growth and
Yield of Eggplant Grown Under Saline Conditions. International Journal For Empir-
ical Education and Research 2:37–56
Rahman MH, Lund T, Bryceson I (2011) Salinity impacts on agro-biodiversity in three
coastal, rural villages of Bangladesh. Ocean & Coastal Management 54:455–468.
doi: 10.1016/j.ocecoaman.2011.03.003
Rao NK, Shahid M, Al Shankiti A, Elouafi I (2014) Neglected and underutilized species
for food and income security in marginal environments. Acta Horticulturae:91–103.
doi: 10.17660/ActaHortic.2014.1051.8
Ravindran KC, Venkatesan K, Balakrishnan V, Chellappan KP, Balasubramanian T
(2007) Restoration of saline land by halophytes for Indian soils. Soil Biology and
Biochemistry 39:2661–2664. doi: 10.1016/j.soilbio.2007.02.005
Rehm S, Espig G (1984) Die Kulturpflanzen der Tropen und Subtropen: Anbau,
wirtschaftliche Bedeutung, Verwertung, 2nd edn. Ulmer, Stuttgart
Rengasamy P (2006) World salinization with emphasis on Australia. Journal of Experi-
mental Botany 57:1017–1023. doi: 10.1093/jxb/erj108
Rengasamy P (2010) Soil processes affecting crop production in salt-affected soils.
Functional Plant Biology 37:613. doi: 10.1071/FP09249
Rengasamy P (2016) Soil Chemistry Factors Confounding Crop Salinity Tolerance: A
Review. Agronomy 6:53. doi: 10.3390/agronomy6040053
Rhoades JD (2012) Diagnosis of Salinity Problems and Selection of Control Practices:
An Overview. In: Wallender WW, Tanji KK (eds) Agricultural salinity assessment
and management. ASCE, Reston, pp 27–55
Richards LA (ed) (1954) Diagnosis and improvement of saline and alkali soils: U.S.
Department Agriculture Handbook 60. U.S. Gov. Printing Office, Washington DC
Rivero RM, Mestre TC, Mittler R, Rubio F, Garcia-Sanchez F, Martinez V (2014) The
combined effect of salinity and heat reveals a specific physiological, biochemical
and molecular response in tomato plants. Plant, Cell & Environment 37:1059–
1073. doi: 10.1111/pce.12199
Romic D, Ondrasek G, Romic M, Josip B, Vranjes M, Petosic D (2008) Salinity and
irrigation method affect crop yield and soil quality in watermelon (Citrullus lanatus
L.) growing. Irrigation and Drainage 57:463–469. doi: 10.1002/ird.358
Rouphael Y, Petropoulos SA, Cardarelli M, Colla G (2018) Salinity as eustressor for
enhancing quality of vegetables. Scientia Horticulturae 234:361–369. doi:
10.1016/j.scienta.2018.02.048
Roy SJ, Negrão S, Tester M (2014) Salt resistant crop plants. Current Opinion in Bio-
technology 26:115–124. doi: 10.1016/j.copbio.2013.12.004
Rozema J, Schat H (2013) Salt tolerance of halophytes, research questions reviewed
in the perspective of saline agriculture. Environmental and Experimental Botany
92:83–95. doi: 10.1016/j.envexpbot.2012.08.004
RStudio (2016) RStudio: Integrated Development for R, Boston.
https://www.rstudio.com/
Saeed R, Gul H, Zehra A, Ahmad R (2014) Organic Mulch Ameliorates the Sea Salt
Stress in Cherry Tomato (Solanum lycopersicum l. var. cerasiforme). International
Journal of Economic and Environmental Geology 5:25–31

Sambo S (2016) Plano de Accão de Produção Agrária e Pesqueira, Presentation given
by: Direção da Agricultura e da Segurança Alimentar da Cidade de Maputo
(DASACM), Maputo
Sango S (2004) Response of Chile Pepper to Phytophthora capsici in Relation to Soil
Salinity. Plant Disease 88:205–209
Schmidt M (2017) Status quo and value chains of urban agricultural activities in Mapu-
to: Analysis of vegetable and poultry value chains, SLE, Berlin
Serno G, Neto V (1989) Estudo das Relações entre CE1:2.5 e CEe para Diferentes
Grupos de Textura do Solo. Série Terra e Água. Instituto de Investigação Agrária
de Moçambique (IIAM), Maputo
Setia R, Marschner P, Baldock J, Chittleborough D, Smith P, Smith J (2011) Salinity
effects on carbon mineralization in soils of varying texture. Soil Biology and Bio-
chemistry 43:1908–1916. doi: 10.1016/j.soilbio.2011.05.013
Shabala S, Munns R (2017) Salinity Stress: Physiological Constraints and Adaptive
Mechanisms. In: Shabala S (ed) Plant stress physiology. CABI, Wallingford, pp 24–
63
Shahbaz M, Ashraf M, Al-Qurainy F, Harris PJC (2012) Salt Tolerance in Selected
Vegetable Crops. Critical Reviews in Plant Sciences 31:303–320. doi:
10.1080/07352689.2012.656496
Shahid SA, Rahman Ku (2011) Soil Salinity Development, Classification, Assessment,
and Management in Irrigated Agriculture. In: Pessarakli M (ed) Handbook of plant
and crop stress. CRC Press, Boca Raton, pp 23–39
Shalaby OAE-S, El-Messairy MM (2018) Humic acid and boron treatment to mitigate
salt stress on the melon plant. Acta Agriculturae Slovenica 111:349–356
Shannon MC, Grieve CM (1998) Tolerance of vegetable crops to salinity. Scientia
Horticulturae 78:5–38
Shannon MC, Grieve CM, Lesch SM, Draper JH (2000) Analysis of Salt Tolerance in
Nine Leafy Vegetables Irrigated with Saline Drainage Water. Journal of the Ameri-
can Society for Horticultural Science 125:658–664
Sharma DK, Singh A, Sharma PC, Dagar JC, Chaudhari SK (2016) Sustainable Man-
agement of Sodic Soils for Crop Production: Opportunities and Challenges. Journal
of Soil Salinity and Water Quality 8:109–130
Shiferaw BA, Okello J, Reddy RV (2009) Adoption and adaptation of natural resource
management innovations in smallholder agriculture: Reflections on key lessons
and best practices. Environment, Development and Sustainability 11:601–619. doi:
10.1007/s10668-007-9132-1
Sillitoe P (2013) Interdisciplinary experiences: Working with indigenous knowledge in
development. Interdisciplinary Science Reviews 29:6–23. doi:
10.1179/030801804225012428
Simpson C, Franco J, King S, Volder A (2018) Intercropping Halophytes to Mitigate
Salinity Stress in Watermelon. Sustainability 10:681. doi: 10.3390/su10030681
Singh A, Panda SN (2012) Effect of Saline Irrigation Water on Mustard (Brassica
juncea) Crop Yield and Soil Salinity in a Semi-Arid Area of North India. Experi-
mental Agriculture 48:99–110. doi: 10.1017/S0014479711000780
Singh K, Mishra AK, Singh B, Singh RP, Patra DD (2014) Tillage Effects on Crop Yield
and Physicochemical Properties of Sodic Soils. Land Degradation & Development
27:223–230
Sitoe TA (2016) The Effect of Horticultural Diversification on Income: Evidence from
Small Producers in the Green Belt of Maputo. In: Smart JC (ed) Special Issue Col-

lection of Short Papers Focused on Horticultural Production in the Areas Supplying
Maputo. Mozambique: Directorate of Economics, Ministry of Agriculture, Maputo,
pp 8–18
Smart JC (2016) A Case Study of Lettuce, Kale, Tomato and Onion Gross Margins and
Costs of Production Among the Horticultural Producers Supplying Maputo. In:
Smart JC (ed) Special Issue Collection of Short Papers Focused on Horticultural
Production in the Areas Supplying Maputo. Mozambique: Directorate of Econom-
ics, Ministry of Agriculture, Maputo, pp 96–103
Smart JC, Cachomba IS, Tschirley D (2016a) Input Use, Input Purchase Channels,
Sale Channels and other General Characteristics of the Horticultural Producers of
Maputo. In: Smart JC (ed) Special Issue Collection of Short Papers Focused on
Horticultural Production in the Areas Supplying Maputo. Mozambique: Directorate
of Economics, Ministry of Agriculture, Maputo, pp 19–29
Smart JC, Cachomba IS, Tschirley D (2016b) Typology of Horticultural Producers Sup-
plying Maputo. In: Smart JC (ed) Special Issue Collection of Short Papers Focused
on Horticultural Production in the Areas Supplying Maputo. Mozambique: Direc-
torate of Economics, Ministry of Agriculture, Maputo, pp 30–39
Smidt EH, Chutumia II, Egidio NM, Haas P (1989) Groundwater Exploitation in the Ar-
ea of Maputo, Mozambique. In: Custodio E, Gurguí A (eds) Groundwater Econom-
ics: Selected Papers from A United Nations Symposium Held in Barcelona, vol 39.
Elsevier, Amsterdam, Oxford, New York, Tokyo, pp 581–591
Snapp SS, Shennan C, Bruggen AHC (1991) Effects of salinity on severity of infection
by Phytophthora parasitica Dast., ion concentrations and growth of tomato,
Lycopersicon esculentum Mill. The New Phytologist 119:275–284. doi:
10.1111/j.1469-8137.1991.tb01031.x
Song J, Wang B (2015) Using euhalophytes to understand salt tolerance and to devel-
op saline agriculture: Suaeda salsa as a promising model. Annals of Botany
115:541–553. doi: 10.1093/aob/mcu194
Spoon J (2014) Quantitative, qualitative, and collaborative methods: Approaching in-
digenous ecological knowledge heterogeneity. Ecology and Society 19. doi:
10.5751/ES-06549-190333
Srivastava PK, Gupta M, Shikha, Singh N, Tewari SK (2016) Amelioration of Sodic Soil
for Wheat Cultivation Using Bioaugmented Organic Soil Amendment. Land Degra-
dation & Development 27:1245–1254. doi: 10.1002/ldr.2292
Su J, Wu S, Xu Z, Qiu S, Luo T, Yang Y, Chen Q, Xia Y, Zou S, Huang B-L, Huang B
(2013) Comparison of Salt Tolerance in Brassicas and Some Related Species.
American Journal of Plant Sciences 4:1911–1917. doi: 10.4236/ajps.2013.410234
Sun H, Wei C, Xu W, Yang J, Wang X, Qiu Y (2019) Characteristics of salt contents in
soils under greenhouse conditions in China. Environmental Science and Pollution
Research International 26:3882–3892. doi: 10.1007/s11356-018-3865-2
Suthar H, Hingurao K, Vaghashiya J, Parmar J (2017) Fermentation: A Process for
Biofertilizer Production. In: Panpatte DG, Jhala YK, Vyas RV, Shelat HN (eds) Mi-
croorganisms for Green Revolution: Volume 1: Microbes for Sustainable Crop Pro-
duction. Springer, Singapore, pp 229–252
Taiz L, Zeiger E, Møller IM, Murphy A (2015) Plant physiology and development.
Sinauer Associates, Sunderland
Tang X, Mu X, Shao H, Wang H, Brestic M (2015) Global plant-responding mecha-
nisms to salt stress: Physiological and molecular levels and implications in bio-

technology. Critical Reviews in Biotechnology 35:425–437. doi:
10.3109/07388551.2014.889080
Tank N, Saraf M (2010) Salinity-resistant plant growth promoting rhizobacteria amelio-
rates sodium chloride stress on tomato plants. Journal of Plant Interactions 5:51–
58. doi: 10.1080/17429140903125848
Thorup-Kristensen K (2006) Root growth and nitrogen uptake of carrot, early cabbage,
onion and lettuce following a range of green manures. Soil Use and Management
22:29–38. doi: 10.1111/j.1475-2743.2005.00012.x
Tostao E (2009) Estudo sobre a agricultura urbana e peri-urbana na Cidade de Mapu-
to, Universidade Eduardo Mondlane, Faculdade de Agronomia e Engenharia
Florestal, Maputo
Triky-Dotan S, Yermiyahu U, Katan J, Gamliel A (2005) Development of crown and root
rot disease of tomato under irrigation with saline water. Phytopathology 95:1438–
1444. doi: 10.1094/PHYTO-95-1438
van de Fliert E, Braun AR (2002) Conceptualizing integrative, farmer participatory re-
search for sustainable agriculture: From opportunities to impact. Agriculture and
Human Values 19:25–38. doi: 10.1023/A:1015081030682
Ventura Y, Sagi M (2013) Halophyte crop cultivation: The case for Salicornia and
Sarcocornia. Environmental and Experimental Botany 92:144–153. doi:
10.1016/j.envexpbot.2012.07.010
Ventura Y, Eshel A, Pasternak D, Sagi M (2015) The development of halophyte-based
agriculture: Past and present. Annals of Botany 115:529–540. doi:
10.1093/aob/mcu173
Vicente EM (2011) Aspects of the Engineering Geology of Maputo City, Mozambique.
Doctoral Dissertation, University of KwaZulu-Natal, Durban
Wallender WW, Tanji KK (eds) (2012) Agricultural salinity assessment and manage-
ment. ASCE manuals and reports on engineering practice, vol 71. ASCE, Reston
Wan S, Kang Y, Wang D, Liu S-P, Feng L-P (2007) Effect of drip irrigation with saline
water on tomato (Lycopersicon esculentum Mill) yield and water use in semi-humid
area. Agricultural Water Management 90:63–74. doi: 10.1016/j.agwat.2007.02.011
Wickham H (2007) Reshaping data with the reshape package. Journal of Statistical
Software 21
Wickham H (2016) ggplot2: Elegant graphics for data analysis. Use R! Springer, Cham
Wijnhoud JD (1997) Manual dos Métodos de Análise Química e Física de Solos e
Apresentação e Interpretação das Análises Laboratoriais. Série Terra e Água.
Instituto de Investigação Agrária de Moçambique (IIAM), Maputo
Wilson C (2000) Growth Stage Modulates Salinity Tolerance of New Zealand Spinach
(Tetragonia tetragonioides, Pall.) and Red Orach (Atriplex hortensis L.). Annals of
Botany 85:501–509. doi: 10.1006/anbo.1999.1086
Wouyou A, Gandonou C, Komlan F, Montcho D, Zanklan A, Lutts S, Gnancadja S
(2017) Salinity Resistance of Five Amaranth (Amaranthus cruentus) Cultivars at
Young Plants Stage. International Journal of Plant & Soil Science 14:1–11. doi:
10.9734/IJPSS/2017/31611
Yan N, Marschner P, Cao W, Zuo C, Qin W (2015) Influence of salinity and water con-
tent on soil microorganisms. International Soil and Water Conservation Research
3:316–323. doi: 10.1016/j.iswcr.2015.11.003
Yao S, Chen S, Xu D, Lan H (2010) Plant growth and responses of antioxidants of
Chenopodium album to long-term NaCl and KCl stress. Plant Growth Regulation
60:115–125. doi: 10.1007/s10725-009-9426-4

Yin RK (2018) Case study research and applications: Design and methods, 6th edn.
Sage, Los Angeles, London, New Dehli, Singapore, Washington DC, Melbourne
You MP, Colmer TD, Barbetti MJ (2011) Salinity drives host reaction in Phaseolus vul-
garis (common bean) to Macrophomina phaseolina. Functional Plant Biology
38:984. doi: 10.1071/FP11137
Zaidi A, Ahmad E, Khan MS, Saif S, Rizvi A (2015) Role of plant growth promoting
rhizobacteria in sustainable production of vegetables: Current perspective. Scientia
Horticulturae 193:231–239. doi: 10.1016/j.scienta.2015.07.020
Zaki HEM, Yokoi S (2016) A comparative in vitro study of salt tolerance in cultivated
tomato and related wild species. Plant Biotechnology 33:361–372. doi:
10.5511/plantbiotechnology.16.1006a
Zhang QT, Ahmed OAB, Inoue M, Saxena MC, Inosako K, Kondo K (2009) Effects of
mulching on evapotranspiration, yield and water use efficiency of Swiss chard (Be-
ta vulgaris L. var. flavescens) irrigated with diluted seawater. Journal of Food, Agri-
culture & Environment 7:650–654
Zuccarini P (2008) Ion uptake by halophytic plants to mitigate saline stress in Solanum
lycopersicon L., and different effect of soil and water salinity. Soil and Water Re-
search 3:62–73. doi: 10.17221/25/2008-SWR

Annex I:
Salt Tolerance of Selected Vegetable Crops*
Common Name Botanical Name Tolerance based on**
Threshold (ECe in dS m
-1)
Slope (% per dS m
-1)
Rating***
Artichoke Cynara scolymus Bud yield 6.1 11.5 MT
Asparagus Asparagus officinalis Spear yield 4.1 2.0 T
Bean, common Phaseolus vulgaris Seed yield 1.0 19 S
Bean, mung Vigna radiata Seed yield 1.8 20.7 S
Beetroot Beta vulgaris
(Conditatva Group)
Storage root 4.0 9.0 MT
Broccoli Brassica oleracea
(Botrytis Group)
Head FW 1.3 15.8 MT
Cabbage Brassica oleracea
(Capitata Group)
Head FW 1.8 9.7 MS
Carrot Daucus carota Storage root 1.0 14 S
Cassava Manihot esculenta Tuber yield - - MS
Cauliflower Brassica oleracea
(Botrytis Group)
1.5 14.4 MS
Celery Apium graveolens
var. dulce
Petiole FW 1.8 6.2 MT
Cowpea Vigna unguiculata Seed yield 4.9 12 MT
Cucumber Cucumis sativus Fruit yield 2.5 13 MS
Eggplant Solanum melongena Fruit yield 1.1 6.9 MS
Garlic Allium sativum Bulb yield 3.9 14.3 MS
*adapted from Grieve et al. (2012). **FW=fresh weight, DW=dry weight. ***S=sensitive, MS=moderately sensitive, MT=moderately tolerant, T=tolerant.
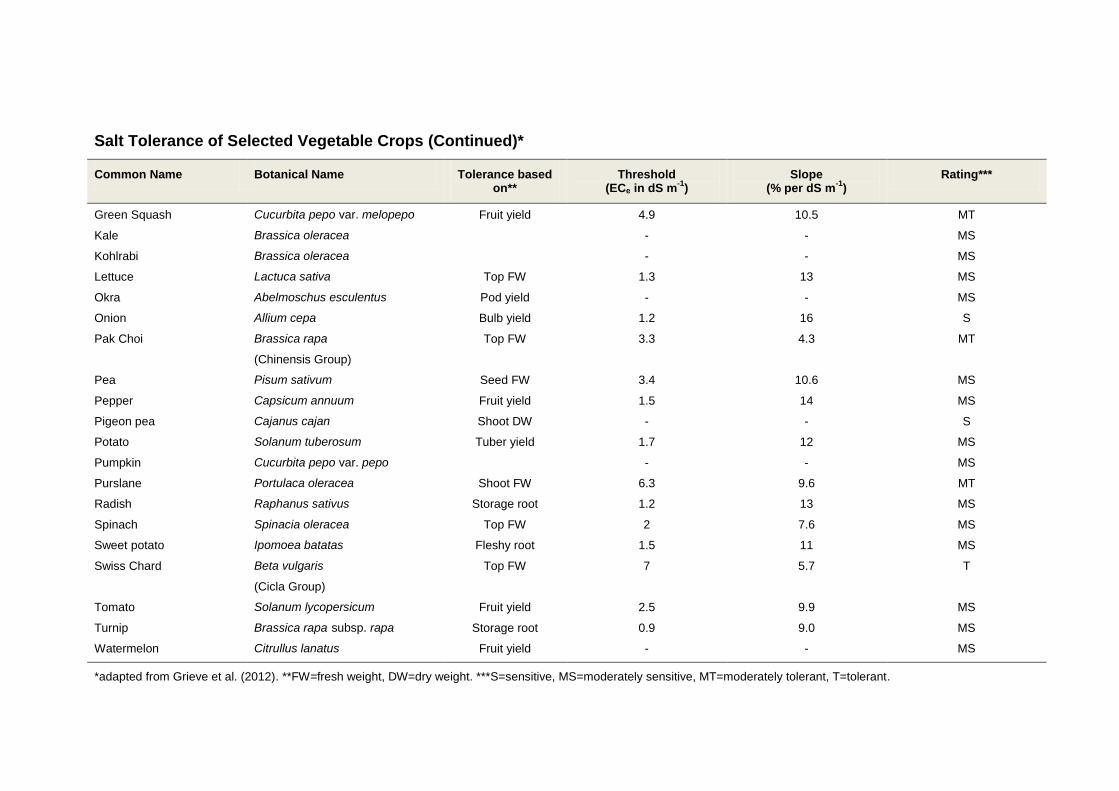
Salt Tolerance of Selected Vegetable Crops (Continued)*
Common Name Botanical Name Tolerance based on**
Threshold (ECe in dS m
-1)
Slope (% per dS m
-1)
Rating***
Green Squash Cucurbita pepo var. melopepo Fruit yield 4.9 10.5 MT
Kale Brassica oleracea - - MS
Kohlrabi Brassica oleracea - - MS
Lettuce Lactuca sativa Top FW 1.3 13 MS
Okra Abelmoschus esculentus Pod yield - - MS
Onion Allium cepa Bulb yield 1.2 16 S
Pak Choi Brassica rapa
(Chinensis Group)
Top FW 3.3 4.3 MT
Pea Pisum sativum Seed FW 3.4 10.6 MS
Pepper Capsicum annuum Fruit yield 1.5 14 MS
Pigeon pea Cajanus cajan Shoot DW - - S
Potato Solanum tuberosum Tuber yield 1.7 12 MS
Pumpkin Cucurbita pepo var. pepo - - MS
Purslane Portulaca oleracea Shoot FW 6.3 9.6 MT
Radish Raphanus sativus Storage root 1.2 13 MS
Spinach Spinacia oleracea Top FW 2 7.6 MS
Sweet potato Ipomoea batatas Fleshy root 1.5 11 MS
Swiss Chard Beta vulgaris
(Cicla Group)
Top FW 7 5.7 T
Tomato Solanum lycopersicum Fruit yield 2.5 9.9 MS
Turnip Brassica rapa subsp. rapa Storage root 0.9 9.0 MS
Watermelon Citrullus lanatus Fruit yield - - MS
*adapted from Grieve et al. (2012). **FW=fresh weight, DW=dry weight. ***S=sensitive, MS=moderately sensitive, MT=moderately tolerant, T=tolerant.

Annex II:
Index of Informants and Respective Interviews
Code of Informant
Gender Age Group (Years)
Stakeholder Group
Association Location of (first) Interview
Date of (first) Interview
Follow up Meetings and
Field Visits
Type of Interview
I1 f >40 farmer A. Thomas Sankara A. Thomas Sankara 23.04.2018 no formal, semi-structured
I2 m >40 farmer A. Graça Machel A. Graça Machel 24.04.2018 no formal, semi-structured
I3 m >40 farmer A. Lirandzo A. Lirandzo 30.04.2018 no formal, semi-structured
I4 m >40 farmer A. Lirandzo A. Lirandzo 05.05.2018 yes formal, semi-structured
I5 m >40 farmer A. Lirandzo A. Lirandzo 07.05.2018 no formal, semi-structured
I6 m <40 farmer A. Costa do Sol A. Costa do Sol 09.05.2018 yes informal
I7 f >40 farmer A. Costa do Sol A. Costa do Sol 07.06.2018 no informal
I8 f >40 farmer A. Costa do Sol A. Costa do Sol 19.06.2018 yes informal
I9 f >40 farmer A. Costa do Sol A. Costa do Sol 19.06.2018 yes informal
I10 f >40 farmer A. Thomas Sankara A. Thomas Sankara 07.06.2018 yes informal
I11 m >40 farmer A. Thomas Sankara A. Thomas Sankara 15.05.2018 yes informal
I12 m >40 farmer A. Thomas Sankara A. Thomas Sankara 18.05.2018 yes informal
I13 m >40 farmer A. Thomas Sankara A. Thomas Sankara 17.05.2018 no informal
I14 f >40 farmer A. Thomas Sankara A. Thomas Sankara 24.05.2018 yes informal
I15 f >40 farmer A. Djaulane A. Djaulane 02.07.2018 no informal

Index of Informants and Respective Interviews (continued)
Code of Informant
Gender Age Group (Years)
Stakeholder Group
Institution Location of (first) Interview
Date of (first) Interview
Follow up Meetings and
Field Visits
Type of Interview
I16 m <40 extensionist ABIODES A. Thomas Sankara 08.05.2018 yes formal, semi-structured
I17 f <40 extensionist Casa Agraria Casa Agraria 14.05.2018 yes formal, semi-structured
I18 m <40 extensionist Casa Agraria Casa Agraria 24.05.2018 no formal, semi-structured
I19 m <40 extensionist Casa Agraria Casa Agraria 30.05.2018 no formal, semi-structured
I20 m <40 extensionist ABIODES Agricultural Fair, Maputo 29.06.2018 no formal, semi-structured
I21 m <40 extensionist Casa Agraria Casa Agraria 02.07.2018 no formal, semi-structured
I22 m >40 expert University Eduardo
Mondlane, Maputo
University Eduardo
Mondlane, Maputo 28.05.2018 no formal, unstructured
I23 m <40 expert GAPI GAPI office, Maputo 13.06.2018 no formal, unstructured
I24 m/f various expert ABIODES ABIODES office, Maputo 19.06.2018 no group, formal, unstructured
I25 f <40 expert AMOR AMOR office, Maputo 22.06.2018 no formal, unstructured
I26 m <40 expert DMPUA DMPUA office, Maputo 04.07.2018 no formal, unstructured
I27 m >40 expert DAE DAE office, Maputo 04.07.2018 no formal, unstructured
I28 m <40 input provider MozaSem MozaSem Office 11.05.2018 no formal, unstructured
I29 m <40 input provider TECAP TECAP shop, Maputo 11.06.2018 no formal, unstructured
I30 f <40 input provider Soluções Rurais Soluções Rurais shop,
Maputo 06.06.2018 no informal, unstructured
I31 m <40 input provider Soluções Rurais Soluções Rurais office,
Matola 12.06.2018 no formal, unstructured

Annex III:
Guiding Questions for Interviews with Farmers and Extension Workers
(Portuguese and English Translation)
1 Basic Information on the Informant
a. Nome
Name
b. Sexo
Gender
c. Idade
Age
d. Função na associação / institução
Function within the association / institution
e. Profissão / Formação
Profession / Formation
f. Há quanto tempo pratica actividade agrícola / trabalha como extensionista?
Since when do you practice agriculture / work as an extension worker?
g. Há quanto tempo cultiva / trabalha na Zona Verde de KaMavota?
Since when do you cultivate / work in the Green Zone of KaMavota?
2 General Agro-Ecological Aspects
a. Como se pode descrever as condições da associação / da Zona Verde de
KaMavota; em termos de solos, recursos de água, vegetação natural, cultivos, etc?
How would you describe the local conditions of the association / the Green Zone of
KaMavota, in terms of soils, water resources, natural vegetation, cultivated crops,
etc?
b. Dentro da associação / da Zona Verde de KaMavota se destacam áreas com
diferentes características?
Are there any spatial differences within the association / the Green Zone of
KaMavota?

c. Pode indicar o período de cultivo?
Could you indicate the cultivation period?
d. Quais são as problemas ecológicas / agronómicas que enfrentam as associações?
What kind of ecological/agronomic constraints are the associations facing?
e. Neste contexto, existem dinâmicas temporais, durante o ano ou ao longo dos anos?
In this regard, are there any temporal dynamics, within a year or in the course of the
years?
3 Agronomic Practices
a. Quais são os principais cultivos, de cada época e/ou de cada zona?
Which are the principal crops, for the respective period and/or zone?
b. Pode indicar as variedades dos cultivos usados?
Could you indicate the crop varieties used?
c. Onde compra as sementes / as plântulas?
Where do you purchase your seeds / seedlings?
d. Como faz o preparo do solo?
How is the soil preparation realized?
e. Qual e a forma de rega usada?
Which irrigation method is applied?
f. Pode explicar o uso de fertilizantes e adubos?
Could you describe the use of fertilizers and manures?
4 Soil Salinity
a. Pretendo falar sobre o assunto da salinidade. O que me pode dizer sobre isso?
I intend to talk about the issue of salinity. What can you tell me about it?
b. Como se manifesta? Como é determinado/medido?
How does it manifests itself? How is it determined/measured?
c. Afecta o rendimento? Até que ponto?
Does it affect the yields? To which extend?

d. Quais são os cultivos mais/menos resistentes?
Which are the crops more/less tolerant?
e. Quais são as causas presumidas para a salinização?
Which are the assumed causes for salinization?
f. Qual é a área que é afectado?
Which area is affected?
g. Perderam áreas previamente cultivadas devido à salinização?
Have previously cultivated areas been lost due to salinization?
h. Existem dinâmicas no espaço e no tempo, durante o ano e/ou ao longo dos anos?
Are there any spatial or temporal dynamics, within a year or over the years?
i. Quais são as estratégias usadas para lidar com o problema?
Which are the strategies applied to deal with the problem?
j. Tem ideais ou visões do que poderia ser feito para evitar / reduzir / superar o
problema?
Do you have any ideas or visions of how the problem could be prevented / reduced /
overcome?

Annex IV:
Codebook – Themes Identified from Interviews and Field Notes
1. General agro-ecological setting
1.1. Soils
1.2. Water
1.3. Vegetation
1.4. Land Use
1.5. Temporal Aspects
2. Agronomic Practices
2.1. Soil and Fertility Management
2.2. Water and Irrigation Management
2.3. Crop Management
3. Salinity and it’s Impacts on Crop Production
3.1. Local Soil Salinity Indicators
3.2. Perception of Soil Salinity
3.2.1. Local / Short-term Causes*
3.2.2. Regional / Long-term Causes*
3.2.3. Spatio-Temporal Trends
3.3. Effects on Crop Production and Urban Agricultural System
3.3.1. Agronomically (Plant-Plot)
3.3.2. Economically (Farmer-Business)
3.3.3. Socio-economic (Local Politics of Land Use Change)*
3.4. Local Management of Soil Salinity
3.4.1. Agronomic Approaches
3.4.2. Socio-economic Approaches*
3.4.3. Visions for future Scenarios*
* inductive codes, themes which emerged during the research process.

Annex V:
Index of Crops Grown in the Green Zones of Maputo*
Common name Botanical name Local name Prevalence**
Leafy Vegetables
Amaranth Amaranthus spp. tseque common
Cabbage Brassica oleracea convar.
capitata var. alba
repolho common
Cassava Manihot esculenta mandioca common
Cowpea Vigna unguiculata feijão nhemba common
Kale (Galega type) Brassica oleracea var. acephala couve estaca less common
Kale (Tronchuda type) Brassica oleracea var. costata couve tronchuda common
Leaf mustard Brassica juncea tsunga less common
Lettuce Lactuca sativa alface common
Momordica balsamina Momordica balsamina cacana less common
New Zealand spinach Tetragonia tetragonioides espinafre less common
Pak Choi Brassica rapa subsp. chinnensis couve china rare
Pumpkin leaves Cucurbita spp. abóbora common
Purslane Portulaca oleracea occurring as a weed,
rarely used
Rocket Eruca sativa rúcula rare
Sweet potato Ipomoea batatas batata doce common
Swiss Chard Beta vulgaris var. cicla acelga less common
Watercress Nasturtium officinale agrião rare
Waterleaf Talinum triangulare rare
Other Vegetables
Beetroot Beta vulgaris subsp. rapacea
var. conditiva
beterraba common
Bell Pepper Capsicum annuum pimento less common
Carrot Daucus carota subsp. sativus cenoura common
Common bean Phaseolus vulgaris feijão verde common
Cucumber Cucumis sativus pepino less common
Eggplant Solanum melongena berinjela common
Green squash Cucurbita pepo abobrinha rare
Leek Allium porrum alho-frances rare
Okra Abelmoschus esculentus quiabo common
Onion Allium cepa cebola common
Tomato Solanum lycopersicum tomate common
*all listed plant species have been identified in the field by the author; see additionally Barghusen et al.
(2016) and Schmidt (2017).
**assessment based on authors’ field observations.

Index of Crops Grown in the Green Zones of Maputo (continued)*
Common name Botanical name Local name Prevalence**
Herbs
Basilicum Ocimum basilicum manjericão rare
Chives Allium schoenoprasum cebolinho less common
Cilantro Coriandrum sativum coentro less common
Garlic Allium sativum alho less common
Mint Mentha spp. hortelã rare
Parsley Petroselinum crispum salsa less common
Tuber Crops
Cassava Manihot esculenta mandioca common
Potato Solanum tuberosum batata less common
Sweet potato Ipomoea batatas batata doce common
Taro Dioscorea spp. inhame common
Grain Crops
Common bean Phaseolus vulgaris feijão verde common
Cowpea Vigna unguiculata feijão nhemba common
Groundnut Arachis hypogaea amendoím rare
Maize Zea mays milho common
Pearl millet Pennisetum glaucum mexoeira rare
Pigeon pea Cajanus cajan rare
Rice Oryza sativa arroz rare
Sorghum Sorghum bicolor mapira rare
Fruit Trees and other Perennials
African mangosteen Garcinia livingstonei less common
African medlar Vangueria infausta maphilua less common
Amarula Sclerocarya birrea subsp. caffra canhoeiro less common
Avocado Persea americana pêra abacate common
Banana Musa × paradisiaca bananeira common
Cashew Anacardium occidentale cajueiro less common
Moringa Moringa oleifera moringueira less common
Natal mahogany Trichilia emetica mafurreira less common
Neem Azadirachta indica amargosa less common
Papaya Carica papaya papaeira common
Sugarcane Saccharum officinarum cana de açúcar common
Sycamore Ficus sycomorus less common
*all listed plant species have been identified in the field by the author; see additionally Barghusen et al.
(2016) and Schmidt (2017).
**assessment based on authors’ field observations.

Annex VI:
Data Table of the Participatory Soil and Water Survey
Sample ID Transect Position*
x coordinate y coordinate ECe
(0-20 cm) ECe
(20-40 cm) ECw**
1 a 463740.00 7137318.00 1.89 0.71 NA
2 b 463938.00 7137252.00 0.70 0.67 1.05
3 c 464130.00 7137210.00 0.54 0.60 NA
4 d 464314.00 7137146.00 5.61 4.46 NA
5 e 464514.00 7137080.00 6.16 4.18 NA
6 a 463686.00 7137129.00 0.70 0.49 1.86
7 b 463878.00 7137073.00 1.21 0.89 2.27
8 c 464044.00 7137028.00 0.44 0.71 NA
9 d 464264.00 7136949.00 4.14 4.19 NA
10 e 464454.00 7136890.00 14.26 10.21 NA
11 a 463623.00 7136939.00 0.60 0.44 1.01
12 b 463824.00 7136883.00 1.71 1.07 2.37
13 c 464026.00 7136828.00 0.23 0.31 NA
14 d 464208.00 7136764.00 0.36 0.42 NA
15 e 464393.00 7136704.00 8.61 9.47 NA
16 a 463575.00 7136743.00 2.94 1.64 1.51
17 b 463761.00 7136698.00 0.33 0.28 1.41
18 c 463956.00 7136628.00 2.35 1.92 3.47
19 d 464145.00 7136568.00 1.88 1.01 8.75
20 e 464336.00 7136511.00 8.48 2.40 1.41
21 a 463526.00 7136553.00 1.43 1.29 1.01
22 b 463707.00 7136497.00 2.30 2.52 2.42
23 c 463900.00 7136426.00 2.34 1.19 2.04
24 d 464090.00 7136383.00 3.40 3.28 1.52
25 e 464283.00 7136334.00 15.66 13.55 NA
26 a 463458.00 7136363.00 2.34 2.49 1.53
27 b 463651.00 7136307.00 0.78 0.99 1.56
28 c 463841.00 7136240.00 1.08 1.16 8.68
29 d 464034.00 7136192.00 2.47 2.19 NA
30 e 464223.00 7136128.00 17.99 12.05 NA
31 a 463399.00 7136172.00 0.71 0.69 1.73
32 b 463592.00 7136113.00 1.94 1.78 1.97
33 c 463784.00 7136052.00 5.25 2.74 4.29
34 d 463974.00 7135998.00 4.86 5.80 NA
35 e 464169.00 7135944.00 8.71 5.77 4.28
36 a 463342.00 7135979.00 1.46 1.70 1.45
37 b 463534.00 7135923.00 0.90 1.15 1.85
38 c 463728.00 7135867.00 1.08 0.84 NA
39 d 463913.00 7135810.00 11.63 7.97 2.66
40 e 464109.00 7135750.00 3.38 1.41 2.39
* sample locations where placed regularly along a transect which followed farmers categories of soil salini-
ty levels; where a = non-saline, b = slightly saline (25-50% yield loss), c = saline (50-75% yield loss), d =
too saline for crop production (75-100% yield loss), e=highly saline.
**refers to adjacent irrigation water source, if existing.
