agriculture 2 - financefinance.gov.pk/survey/chapter_10/02_agriculture.pdf · agriculture 2 the...
TRANSCRIPT

13
Agriculture 2
The Agriculture sector continues to play a central role in Pakistan’s economy. It is the second largest sector, accounting for over 21 percent of GDP, and remains by far the largest employer, absorbing 45 percent of the country’s total labour force. Nearly 62 percent of the country’s population resides in rural areas, and is directly or indirectly linked with agriculture for their livelihood. The Agriculture sector’s strong linkages with the rest of the economy are not fully captured in the statistics. While on the one hand, the sector is a primary supplier of raw materials to downstream industry, contributing substantially to Pakistan’s exports, on the other, it is a large market for industrial products such as fertilizer, pesticides, tractors and agricultural implements.
Despite its critical importance to growth, exports, incomes, and food security, the Agriculture sector has been suffering from secular decline (Table 2.1). Growth in the sector, particularly in the crop sub‐sector, has been falling for the past three decades. Productivity remains low, with yield gaps rising (Table 2.2). Critical investments in new seeds, farming technology and techniques, and the water infrastructure are not being made. Without major new investments in Agriculture, it is unclear how prepared Pakistan would be to tackle emerging challenges such as declining water availability, and climate change (for a fuller discussion, see Special Section at end of chapter).
Table 2.2: Yield Gap (Major Crops)
Country Wheat Difference From Best*
Sugarcane Difference From Best*
Rice (Paddy) Difference From Best*
Cotton Seed Difference From Best*
World 3086 65 71510 59 4309 44 2099 54
China 4762 100 73114 60 6556 67 3906 100
India 2802 59 68877 57 3370 35 1206 31
Pakistan 2451 52 51494 43 3520 36 2046 52
USA 3018 63 73765 61 7672 79 2250 58
Brazil ‐ ‐ 79709 66 4229 44 3757 96
Egypt ‐ ‐ 121136 100 9731 100 2333 60
*Best = 100 Source: Ministry of Food and Agriculture Data pertains to 2008
Table 2.1: Historical growth performanceAgriculture Growth
Years Percent1960's 5.1 1970's 2.4 1980's 5.4 1990's 4.4 2000's 3.2
Source: Federal Bureau of Statistics

Economic Survey 2009‐10
14
Recent performance
Table 2.3: Agriculture Growth (Percent)Year Agriculture Major Crops Minor Crops Livestock Fishery Forestry2003‐04 2.4 1.7 3.9 2.9 2.0 ‐3.22004‐05 6.5 17.7 1.5 2.3 0.6 ‐32.42005‐06 6.3 ‐3.9 0.4 15.8 20.8 ‐1.12006‐07 4.1 7.7 ‐ 1.0 2.8 15.4 ‐5.12007‐08 1.0 ‐6.4 10.9 4.2 9.2 ‐13.02008‐09 4.0 7.3 ‐1.7 3.5 2.3 ‐3.02009‐10(P) 2.0 ‐0.2 ‐1.2 4.1 1.4 2.2P= Provisional Source: Federal Bureau of Statistics Over the past six years, Agriculture has grown at an average rate of 3.7 percent per annum. However, volatility in the sector is high, with the range of growth varying between 6.5 percent and 1.0 percent. The fluctuation in overall agriculture has been largely dependent on the contribution of major crops. The trend in agriculture growth since 2003‐04 is reported in Table 2.3.
During the outgoing year 2009‐10, the overall performance of agriculture sector has been weaker than target. Against a target of 3.8 percent, and previous year’s performance of 4.0 percent, agriculture is estimated to have grown by 2.0 percent. Major crops, accounting for 32.8 percent of agricultural value added, registered a negative growth of 0.2 percent as against robust growth of 7.3 percent last year. Minor crops contributing 11.1 percent to overall agriculture posted negative growth of 1.2 percent. Production of Minor crops has declined for the three years since 2004‐05, a worrying trend which is partially contributing to food price inflation.
The performance of Livestock – the single largest contributor to overall agriculture (53.2 percent) however, grew by 4.1 percent in 2009‐10 as against 3.5 percent last year. The Fishery sector expanded by 1.4 percent, against its previous year’s growth of 2.3 percent. Forestry which has experienced negative growth for the last six years, exhibited positive growth of 2.2 percent this year. Nonetheless, over the past several years, the forest sector has contracted, underscoring the scale of the environment challenge facing a country that already has amongst the highest rates of deforestation in the world.
Pakistan’s agricultural performance is closely linked with the supply of irrigation water. As shown in Table 2.4, against the normal surface water availability at canal heads of 103.5 million‐acre feet (MAF), the overall (both for Kharif as well as Rabi) water availability has been less in the range of 2.5 percent (2005‐06) to 20.6 percent (2004‐05). However, it remained less by 2.5 percent in 2005‐06 against the normal availability. Relatively speaking, Rabi season faced shortage of water during 2009‐10.
During the current fiscal year (2009‐10), the availability of water as an important input for Kharif 2009 (for the crops such as rice, sugarcane and cotton) has been 0.3 percent more than the normal supplies and 0.6 percent more than last year’s Kharif (see Table 2.4). The water availability during Rabi season (for major crop such as wheat), is, however, estimated at 26.0 MAF, which is 28.6 percent less than the normal availability, and 4.4 percent more than last year’s Rabi.

Agriculture
15
Table 2.4: Actual Surface Water Availability (Million Acre Feet)
Period Kharif Rabi Total %age incr/decr. Over the Avg.
Average system usage 67.1 36.4 103.5 ‐ 2003‐04 65.9 31.5 97.4 ‐ 5.9 2004‐05 59.1 23.1 82.2 ‐ 20.6 2005‐06 70.8 30.1 100.9 ‐ 2.5 2006‐07 63.1 31.2 94.3 ‐ 8.9 2007‐08 70.8 27.9 98.7 ‐ 4.6 2008‐09 66.9 24.9 91.8 ‐11.3 2009‐10 67.3 26.0 93.3 ‐9.9
Source: IRSA
Efficient irrigation system is a pre‐requisite for higher agricultural production since it helps increase the crop intensity. Despite the existence of a good irrigation canal network in the Pakistan, it still suffers from wastage of a large amount of water in the irrigation process. Position of rainfall during monsoon and winter season is detailed given in Table 2.5:‐
Table 2.5: Rainfall* Recorded During 2009‐10 (In Millimeter)
Monsoon Rainfall(Jul‐Sep) 2009
Winter Rainfall(Jan‐Mar) 2010
Normal 137.5 70.5 Actual 101.8 49.2 Shortage (‐)/excess (+) ‐35.7 ‐21.3 % Shortage (‐)/excess (+) ‐26.0 ‐30.2 *:Area weighted Source: Pakistan Meteorological Department During the monsoon season (July‐September, 2009) the normal rainfall is 137.5 mm while the actual rainfall received stood at 101.8 mm, indicating a decrease of 26.0 percent. Likewise, during the winter (January to March 2010), the actual rainfall received was 49.2 mm while the normal rainfall during this period has been 70.5 mm, indicating a decrease of 30.2 percent over the normal rainfall.
I. Crop Situation
There are two principal crop seasons in Pakistan, namely the "Kharif", the sowing season of which begins in April‐June and harvesting during October‐December; and the "Rabi", which begins in October‐December and ends in April‐May. Rice, sugarcane, cotton, maize, mong, mash, bajra and jowar are “Kharif" crops while wheat, gram, lentil (masoor), tobacco, rapeseed, barley and mustard are "Rabi" crops. Major crops, such as, wheat, rice, cotton and sugarcane account for 82.0 percent of the value added in the major crops. The value added in major crops accounts for 32.8 percent of the value added in overall agriculture. Thus, the four major crops (wheat, rice, cotton, and sugarcane), on average, contribute 33.1 percent to the value added in overall agriculture and 7.1 percent to GDP. The minor crops account for 11.1 percent of the value added in overall agriculture. Livestock contributes 53.2 percent to agricultural value added – much more than the combined contribution of major and minor crops (43.9%). See Table‐2.6

Economic Survey 2009‐10
16
Table 2.6: Production of Major Crops (000 Tons)
Year Cotton
(000 bales) Sugarcane Rice Maize Wheat
2004‐05 14265 47244 5025 2797 21612(42.0) (‐11.6) (3.6) (47.4) (10.8)
2005‐06 13019 44666 5547 3110 21277(‐8.7) (‐5.5) (10.4) (11.2) (‐1.6)
2006‐07 12856 54742 5438 3088 23295(‐1.2) (22.6) (‐2.0) (‐0.7) (9.5)
2007‐08 11655 63920 5563 3605 20959(‐9.3) (16.8) (2.3) (16.7) (‐10.0)
2008‐09 11819 50045 6952 3593 24033(1.4) (‐21.7) (25.0) (‐0.3) (14.7)
2009‐10(P) 12698 49373 6883 3487 23864 (7.4) (‐1.3) (‐1.0) (‐3.0) (‐0.7)
P:Provisional (July‐March) *:Figures in parentheses are growth rates Source: Ministry of Food and Agriculture a) Major Crops:
i) Cotton:
Cotton being a non‐food cash crop contributes significantly in foreign exchange earning. Cotton accounts for 8.6 percent of the value added in agriculture and about 1.8 percent to GDP. The crop was sown on the area of 3106 thousand hectares, 10.1 percent more than last year (2820 thousand hectares). The production is estimated at 12.7 million bales for 2009‐10, higher by 7.4 percent over the last year’s production of 11.8 million bales. However, the cotton production was 5.0 percent less than the target of 13.36 million bales mainly due to the shortage of irrigation water, high temperatures in the month of August resulting in excessive fruit shedding, flare up of sucking pest complexes and wide spread of Cotton Leaf Curl Virus (CLCV). Area, production and yield of cotton for the last five years are given in Table 2.7 and Fig. 2.1.
8000
9000
10000
11000
12000
13000
14000
15000
97‐98
98‐99
99‐00
00‐01
01‐02
02‐03
03‐04
04‐05
05‐06
06‐07
07‐08
08‐09
09‐10(P)
Fig 2.1: Cotton Production (000 bales)
Source: M/o Food and Agriculture, FBS

Agriculture
17
Table 2.7: Area, Production and Yield of Cotton
Year Area Production Yield
(000 Hectare) % Change (000 Bales) % Change (Kgs/Hec) % Change2005‐06 3103 ‐2.8 13019 ‐8.7 714 ‐6.02006‐07 3075 ‐0.9 12856 ‐1.2 711 ‐0.42007‐08 3054 ‐ 0.7 11655 ‐ 9.3 649 ‐8.72008‐09 2820 ‐7.7 11819 1.4 713 9.92009‐10(P) 3106 10.1 12698 7.4 695 ‐2.5P: Provisional (July‐March) Source: Ministry of Food and Agriculture, Federal Bureau of Statistics. During this 2009‐10 Kharif, an important development was the increasing usage of Bt: Cotton by farmers. In Sindh, it was observed almost 80% of cotton growing area has become under Bt. cotton (Australian Bt) with high incidence (60‐100%) of Cotton Leaf Curl Virus (CLCV) infection. In Punjab, Bt cotton is grown on almost 80% areas with different names, i.e. Bt‐121and Bt‐131 with a range of segregation (10‐20%) in the fields of Bt cotton. MinFA has finalized and got approved from ECC an LOI and MoU with action plan to introduce Bt cotton variety and Bt Hybrid in Pakistan in collaboration with M/s Monsanto.
Bt. Cotton:
Bt cotton is developed by Genetic Engineering techniques (Biotechnology). Bt cotton contains Genes from Bacillus thuringiensis (Bt.)
Eight countries commercially grew Bt cotton (USA, Australia, China, India etc.). Protein of this gene is deadly for the Chewing Pests i.e. American, Army, Pink and Spotted worm but not for sucking pest like Mealy bug etc.
There may be 30% increase in cotton yield due to resistance against chewing pest and hence additional income to poor farmers in Pakistan.
The Bt. cotton varieties including Bt hybrids currently grown in Pakistan are from exotic sources which are given to farmers for cultivation without validating its performance and without providing production technologies based on research conducted according to local environment.
None of these planting materials have been imported legally and have not been tested so far according to rules and regulations set by Government agencies at Federal and Provincial levels.
As a rule and principle chalked out by Federal and Provincial Governments all the Bt cotton varieties/Hybrids, it has to pass through the procedures designed for testing and evaluation of these materials by Pakistan Central Cotton Committee (PCCC), Federal Seed Certification and Registration Department (FSC&RD), National Bio‐safety Committee (NBC), Department of Plant Protection (DPP) and provincial Seed Councils.
Private seed company M/s Aurega Lahore has sold Bt hybrid seed for an area of almost 10 thousand acres with the name as “White Gold” without following prescribed rule.
Another private seed company M/s Alseeme Multan has sold non Bt cotton hybrid for almost an area of 10 thousand acres without following prescribed rules.
All the Bt. cotton varieties grown are susceptible to Cotton Leaf Curl Virus (CLCV) and sucking pest i.e. mealy bug, Jassid and White fly which are a major threat to cotton crop in Pakistan.
Most of the Bt cotton varieties were marketed with wrong notation of resistance to all pest. In some instances Bt. cotton seed was mixed with non‐Bt cotton seed and affected the yield.

Economic Survey 2009‐10
18
It is worth mentioning that Sitara, ARS‐802, ARS‐703, CEMB‐1, CEMB‐2, Neelum‐121, FH‐113, MG‐6 and Hybrid Bt GN‐2085 and GN‐31 are the only Bt cotton varieties/hybrid which is being introduced in Pakistan during next crop season following the rules and regulations designed by Federal and Provincial governments.
It is important to mention that during current year Pakistan Agricultural research Council (PARC) has imported almost 950 kg of five different Bt cotton seed from China under special permission for conducting trials directly on farmer fields without following the rules and regulations designed by NBC, PCCC, FSC & RD.
ii) Sugarcane:
Sugarcane is one of the major crops of Pakistan, grown in Kharif season. It provides raw material to sugar and sugar‐ related products. It generates income and employment for the farming community of the country. It helps in value addition to essential item for industries like sugar, chipboard and paper. Its share in value added of agriculture and GDP are 3.6 percent and 0.8 percent, respectively. For 2009‐10, sugarcane has been sown in the area of 943 thousand hectares, 8.4 percent lower than last year (1029 thousand hectares). Sugarcane production for the year 2009‐10 is estimated at 49.4 million tons, against 50.0 million tons last year. This indicates a decline of 1.3 percent over the production of last year. Main factors contributing for lesser production are maximum area under wheat crop during 2008‐09 restricted the sugarcane acreage, shortage of canal water, load shedding of electricity, realization of lower prices in the preceding season and high rate of inputs also discouraged the farmers to grow more sugarcane crop. The area, production and yield per hectare for the last five years are given in Table 2.8 (see also Fig. 2.2)
Table 2.8: Area, Production and Yield of Sugarcane
Year Area Production Yield
(000 Hectare) % Change (000 Tons) % Change (Kgs/Hec.) % Change2005‐06 907 ‐6.1 44666 ‐5.5 49246 0.72006‐07 1029 13.5 54742 22.6 53199 8.02007‐08 1241 20.6 63920 16.8 51507 ‐3.22008‐09 1029 ‐17.1 50045 ‐21.7 48635 ‐5.62009‐10(P) 943 ‐8.4 49373 ‐1.3 52357 7.7P: Provisional (July‐March) Source: Ministry of Food and Agriculture, Federal Bureau of Statistics.
39000
44000
49000
54000
59000
64000
69000
98‐99 99‐00 00‐01 01‐02 02‐03 03‐04 04‐05 05‐06 06‐07 07‐08 08‐09 09‐10 (P)
Fig: 2.2: Sugarcane Production (000 Tons)
Source: M/o Food and Agriculture, FBS

Agriculture
19
iii) Rice:
Rice is an essential cash crop and one of the main export items of the country. It accounts for 6.4 percent of value added in agriculture and 1.4 percent in GDP. Pakistan grows high quality rice to meet both domestic demand and for exports. Area sown for rice is estimated at 2883 thousand hectares, 2.7 percent less than last year. The size of the crop is estimated at 6883 thousand tons 1.0 percent less than last year. In Punjab sugarcane area was also shifted to rice crop, as the growers were discouraged due to non‐payment of their dues in time by the sugar mills. The area, production and yield of rice for the last five years are given in Table 2.9 and Fig 2.3.
Table 2.9: Area, Production and Yield of Rice
Year Area Production Yield
(000 Hectare) % Change (000 Tons) % Change (Kgs/Hec.) % Change2005‐06 2621 4.0 5547 10.4 2116 6.12006‐07 2581 ‐1.5 5438 ‐2.0 2107 ‐0.42007‐08 2515 ‐2.6 5563 2.3 2212 5.02008‐09 2963 17.8 6952 25.0 2346 6.12009‐10(P) 2883 ‐2.7 6883 ‐1.0 2387 1.7P: Provisional (July‐March) Source: Ministry of Food and Agriculture, Federal Bureau of Statistics. iv) Wheat:
Wheat is the leading food grain of Pakistan and being staple diet of the people, it occupies a central position in formulation of agricultural policies. It contributes 14.4 percent to the value added in agriculture and 3.1 percent to GDP. Area and production target of wheat for the year 2009‐10 had been set at 9045 thousand hectares and 25 million tons, respectively. Wheat was cultivated on an area of 9042 thousand hectares, showing a decrease of 0.04 percent over last year’s area of 9046 thousand hectares. The impact of water shortages (availability at farm gate) and lower rainfall during the sowing period has been the main reason for lesser acreage under wheat crop. The size of wheat crop is provisionally estimated at 23864 million tons, 0.7 percent less than last year crop. The prospects for wheat harvest improved somewhat with healthy fertilizer off take and reasonable rainfall in pre harvesting period. However, the impact of lower acreage and water shortages is likely take its toll and wheat harvest is estimated to be lower than the 2009‐2010 targets of 25.0 million tons. The Area, Production and Yield per hectare of wheat for the last five years are given in Fig 2.4 and Table 2.10.
350040004500500055006000650070007500
98‐99 99‐00 00‐01 01‐02 02‐03 03‐04 04‐05 05‐06 06‐07 07‐08 08‐09 09‐10 (P)
Fig 2.3: Rice Production (000 Tons)
Source: M/o Food and Agriculture, FBS

Economic Survey 2009‐10
20
Table 2.10: Area, Production and Yield of Wheat
Year Area Production Yield
(000 hectares) % Change (000 tons) % Change (Kgs /Hec.) % Changes2005‐06 8448 1.1 21277 ‐1.6 2519 ‐1.92006‐07 8578 1.5 23295 9.5 2716 7.82007‐08 8550 ‐0.3 20959 ‐10.0 2451 ‐9.82008‐09 9046 5.8 24033 14.7 2657 8.42009‐10(P) 9042 ‐0.04 23864 ‐0.7 2639 2.1P:Provisional(July‐March) Source: Ministry of Food and Agriculture, Federal Bureau of Statistics
v) Other Major Crops
During 2009‐10, the production of only rapeseed and mustard increased by 7.4 percent. Gram, the largest Rabi pulses crop in Pakistan, stood at 5.7 million tons against 7.4 million tons of last year showing a significant decrease of 23.0 percent during 2009‐10 due to reduction in area cultivated and unfavourable climatic change. The production of jawar, barley, maize, bajra and tobacco decreased by 6.7, 4.9, 3.0, 1.0 and 1.0 percent respectively during 2009‐10. The area and production of major crops are given in Table 2.11.
17000
19000
21000
23000
25000
97‐98 98‐99 99‐00 00‐01 01‐02 02‐03 03‐04 04‐05 05‐06 06‐07 07‐08 08‐09 09‐10 P
Fig 2.4: Wheat Production (000 Tons)
Source: M/o Food and Agriculture, FBS
500
1,000
1,500
2,000
2,500
3,000
3,500
4,000
FY05 FY06 FY07 FY08 FY09 FY10
Million US $
Source: State Bank of Pakistan
Fig‐2.5: Food Group Import
Agriculture
21
Table 2.11: Area and Production of Other Major Kharif and Rabi Crops
Crops 2008‐09 2009‐10(P)
% Change In production
Area(000 hectares)
Production(000 tons)
Area(000 hectares)
Production (000 tons)
KHARIF Maize 1052 3593 950 3487 ‐3.0Bajra 470 296 476 293 ‐1.0Jawar 263 165 248 154 ‐6.7RABI Gram 1081 741 1050 571 ‐23.0Barley 86 82 80 78 ‐4.9Rapeseed & Mustard
233 188 185 202 7.4
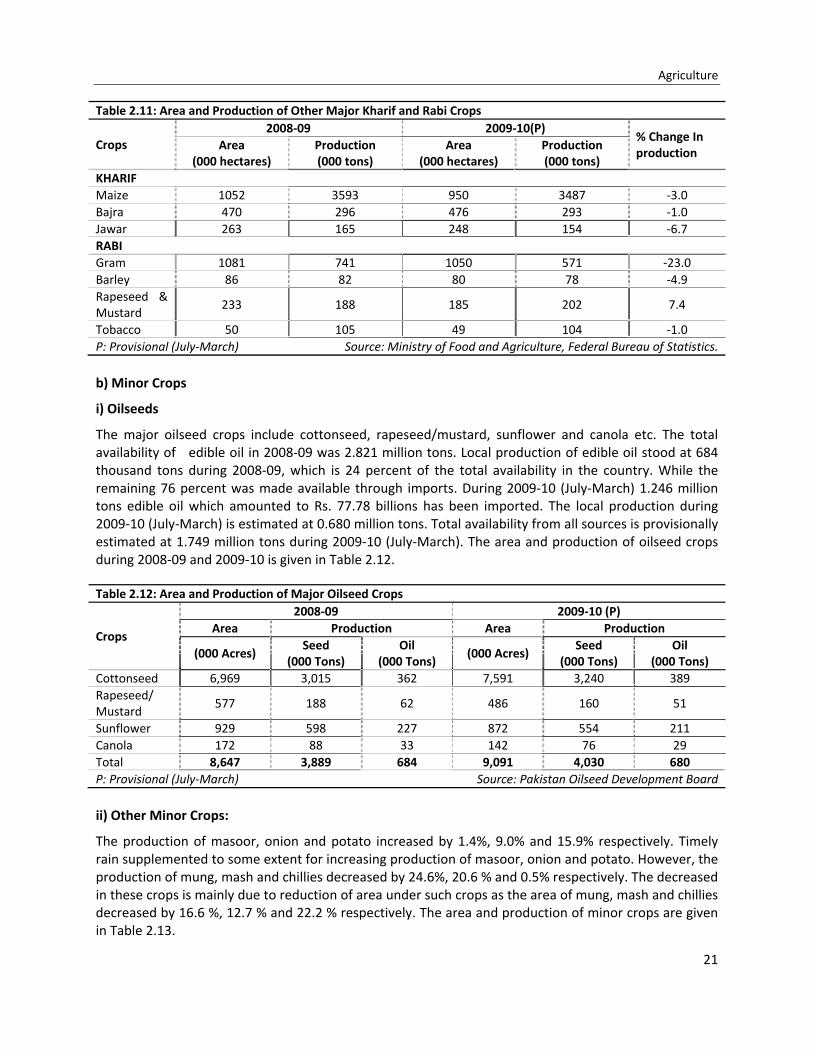
Tobacco 50 105 49 104 ‐1.0P: Provisional (July‐March) Source: Ministry of Food and Agriculture, Federal Bureau of Statistics. b) Minor Crops
i) Oilseeds
The major oilseed crops include cottonseed, rapeseed/mustard, sunflower and canola etc. The total availability of edible oil in 2008‐09 was 2.821 million tons. Local production of edible oil stood at 684 thousand tons during 2008‐09, which is 24 percent of the total availability in the country. While the remaining 76 percent was made available through imports. During 2009‐10 (July‐March) 1.246 million tons edible oil which amounted to Rs. 77.78 billions has been imported. The local production during 2009‐10 (July‐March) is estimated at 0.680 million tons. Total availability from all sources is provisionally estimated at 1.749 million tons during 2009‐10 (July‐March). The area and production of oilseed crops during 2008‐09 and 2009‐10 is given in Table 2.12.
Table 2.12: Area and Production of Major Oilseed Crops
Crops
2008‐09 2009‐10 (P) Area Production Area Production
(000 Acres) Seed
(000 Tons) Oil
(000 Tons) (000 Acres)
Seed (000 Tons)
Oil(000 Tons)
Cottonseed 6,969 3,015 362 7,591 3,240 389Rapeseed/ Mustard
577 188 62 486 160 51
Sunflower 929 598 227 872 554 211Canola 172 88 33 142 76 29Total 8,647 3,889 684 9,091 4,030 680P: Provisional (July‐March) Source: Pakistan Oilseed Development Board ii) Other Minor Crops:
The production of masoor, onion and potato increased by 1.4%, 9.0% and 15.9% respectively. Timely rain supplemented to some extent for increasing production of masoor, onion and potato. However, the production of mung, mash and chillies decreased by 24.6%, 20.6 % and 0.5% respectively. The decreased in these crops is mainly due to reduction of area under such crops as the area of mung, mash and chillies decreased by 16.6 %, 12.7 % and 22.2 % respectively. The area and production of minor crops are given in Table 2.13.

Economic Survey 2009‐10
22
Table‐2.13 : Area and Production of Minor Crops
Crops
2008‐09 2009‐10 (P)%Change In Production
Area (000 hectares)
Production(000 tons)
Area(000 hectares)
Production (000 tons)
Masoor 30.9 14.4 35.5 14.6 1.4Mung 219.7 157.4 183.3 118.7 ‐24.6Mash 27.6 13.6 24.1 10.8 ‐20.6Potato 145.0 2941.3 149.0 3411.6 15.9Onion 129.6 1704.1 141.9 1858.0 9.0Chillies 73.8 187.7 57.44 186.7 ‐0.5P: Provisional (July‐March) Source: Ministry of Food and Agriculture. Federal Bureau of Statistics II. Farm Inputs
i) Fertilizer:
The Government has taken several significant steps to boost agricultural production over the last five years. The domestic production of fertilizer during the first nine months (July‐March, 2009‐10) of the current fiscal year was up by 4.5 percent. The import of fertilizer increased by 133 percent; hence, the total availability of fertilizer also increased by 25.3 percent. Total off take of fertilizer surged by 23.8 percent (Table 2.14) due to a subsidy of Rs. 500 per bag of Sulphate of Potash (SOP)/ Muriate of Potash (MOP) has been announced. Nitrogen off‐take increased by 15.4 percent while that of phosphate by 66.2 percent. Main reasons for increased off‐take of fertilizers were affordable price of DAP and higher support price of wheat. Average retail sale prices of nitrogenous fertilizers increased while that of phosphate decreased considerably.
Table 2.14: Production and Off‐take of Fertilizer (‘000’ N/tons)
Year Domestic Production
%Change
Import %
Change Total
% Change
Off‐take%
Change 2004‐05 2718 7.1 785 2.7 3503 6.1 3694 14.62005‐06 2832 4.2 1268 61.5 4100 17.0 3804 3.02006‐07 2747 ‐3.0 796 ‐37.2 3543 ‐13.6 3672 ‐3.52007‐08 2822 2.7 876 10.1 3698 4.4 3581 ‐2.52008‐09 2907 3.0 568 ‐35.2 3475 ‐6.0 3711 3.62008‐09 (Jul‐Mar) 2141 ‐ 416 ‐ 2557 ‐ 2767 ‐2009‐10 (Jul‐Mar) P 2237 4.5 968 132.7 3205 25.3 3426 23.8P : Provisional Source: National Fertilizer Development Centre ii) Improved Seed:
Improved high‐quality seed or planting material is the most desirable input for improving crop yield. Seed is an important component in agriculture productivity system. Seed has the basic position among various agricultural inputs because the effectiveness of all other inputs mainly depends on the potential of seeds. Seed is a high technology product and is an innovation most readily adapted. Improving access to good quality seed is a critical requirement for sustainable agricultural growth and food security. Effective use of improved seed can result in higher agricultural production and increase net incomes of farming families, which has a positive impact on rural poverty. Hence, availability of quality seed of improved varieties is essential to achieve the production target.
Agriculture
23
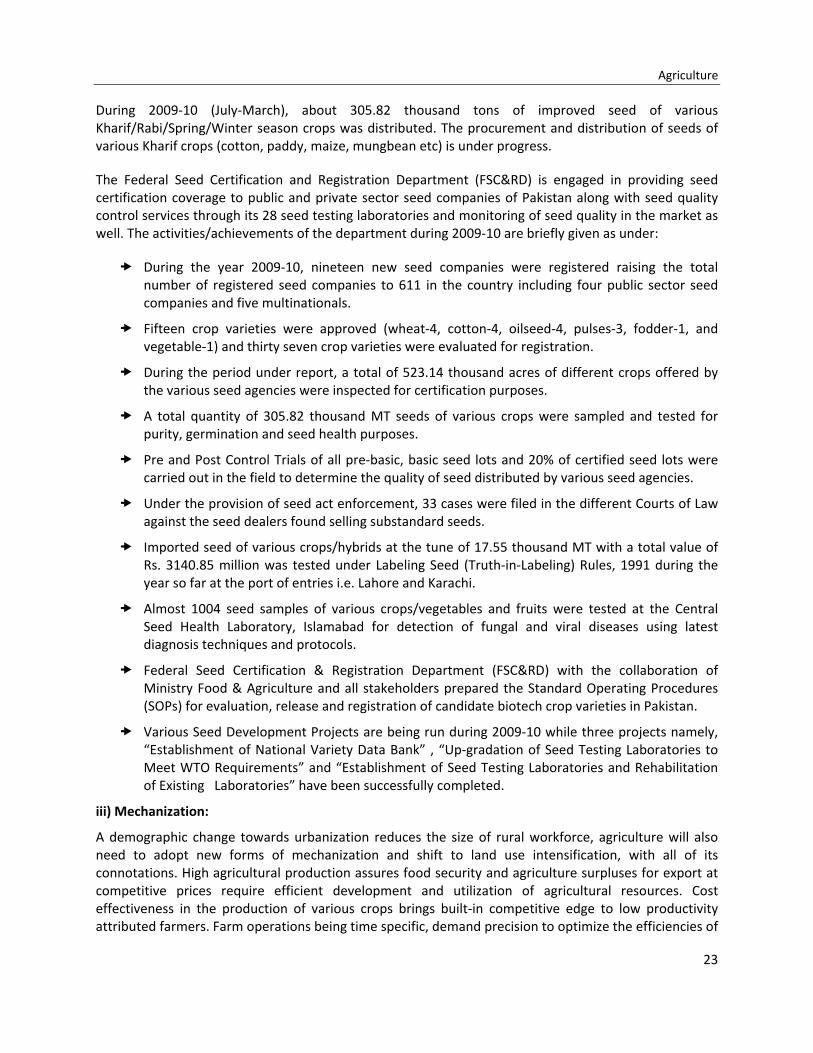
During 2009‐10 (July‐March), about 305.82 thousand tons of improved seed of various Kharif/Rabi/Spring/Winter season crops was distributed. The procurement and distribution of seeds of various Kharif crops (cotton, paddy, maize, mungbean etc) is under progress.
The Federal Seed Certification and Registration Department (FSC&RD) is engaged in providing seed certification coverage to public and private sector seed companies of Pakistan along with seed quality control services through its 28 seed testing laboratories and monitoring of seed quality in the market as well. The activities/achievements of the department during 2009‐10 are briefly given as under:
During the year 2009‐10, nineteen new seed companies were registered raising the total number of registered seed companies to 611 in the country including four public sector seed companies and five multinationals.
Fifteen crop varieties were approved (wheat‐4, cotton‐4, oilseed‐4, pulses‐3, fodder‐1, and vegetable‐1) and thirty seven crop varieties were evaluated for registration.
During the period under report, a total of 523.14 thousand acres of different crops offered by the various seed agencies were inspected for certification purposes.
A total quantity of 305.82 thousand MT seeds of various crops were sampled and tested for purity, germination and seed health purposes.
Pre and Post Control Trials of all pre‐basic, basic seed lots and 20% of certified seed lots were carried out in the field to determine the quality of seed distributed by various seed agencies.
Under the provision of seed act enforcement, 33 cases were filed in the different Courts of Law against the seed dealers found selling substandard seeds.
Imported seed of various crops/hybrids at the tune of 17.55 thousand MT with a total value of Rs. 3140.85 million was tested under Labeling Seed (Truth‐in‐Labeling) Rules, 1991 during the year so far at the port of entries i.e. Lahore and Karachi.
Almost 1004 seed samples of various crops/vegetables and fruits were tested at the Central Seed Health Laboratory, Islamabad for detection of fungal and viral diseases using latest diagnosis techniques and protocols.
Federal Seed Certification & Registration Department (FSC&RD) with the collaboration of Ministry Food & Agriculture and all stakeholders prepared the Standard Operating Procedures (SOPs) for evaluation, release and registration of candidate biotech crop varieties in Pakistan.
Various Seed Development Projects are being run during 2009‐10 while three projects namely, “Establishment of National Variety Data Bank” , “Up‐gradation of Seed Testing Laboratories to Meet WTO Requirements” and “Establishment of Seed Testing Laboratories and Rehabilitation of Existing Laboratories” have been successfully completed.
iii) Mechanization:
A demographic change towards urbanization reduces the size of rural workforce, agriculture will also need to adopt new forms of mechanization and shift to land use intensification, with all of its connotations. High agricultural production assures food security and agriculture surpluses for export at competitive prices require efficient development and utilization of agricultural resources. Cost effectiveness in the production of various crops brings built‐in competitive edge to low productivity attributed farmers. Farm operations being time specific, demand precision to optimize the efficiencies of

Economic Survey 2009‐10
24
agricultural input for higher productivity. The future changes of free market economy and faster globalization have further necessitated modernization of agricultural machinery through transfer of latest, efficient and cost effective technologies to the farming community. Efficient use of scarce agriculture resources and accelerated agricultural mechanization are, therefore, vital to meet the challenges of future scenario that need a comprehensive strategic loaning for future.
Further, to promote use of efficient and quality machinery & equipment etc, the Federal Government has allowed import of agricultural machinery not being manufactured locally, at zero tariffs. Other interventions like use of laser land leveler, ridge and broad bed framing system are being encouraged in the country at concessional rates to the farmers. To bring more land under cultivation a project titled “Land and Water Resources Development Project for Poverty Reduction in Pakistan” envisaging providing 300 bulldozers (200 bulldozers Balochistan and 100 units to Khyber Pakhtunkhwa) is under implementation.
iv) Plant Protection
Plant protection is an important agriculture input as it effectively contributes in achieving higher production by saving it from ravages of insect and disease pests. In this regard, the Department of Plant Protection (DPP) provides facilities such as Locust Survey and Control, Plant Quarantine Service, Aerial Pest Control, Pesticide Registration, Testing and Management.
1. DPP has conducted Desert Locust Survey of Sindh and Punjab deserts w.e.f. 1st June 2009 to 30th September 2009. During this period 6 border meetings with Indian counterparts were conducted on monthly basis at Khokhropar‐Monabao border for exchange of locust information. The Survey of Locust potential areas in Balochistan is in progress since 1st February, 2010 which remain continue up to 31st May, 2010 and joint Pak‐Iran Costal area survey by a combined locust survey team of both countries under the auspices of FAO is also in progress with effect from 1st April 2010 for one month.
2. The department remained in regular coordination with all the Provincial Agriculture Extension Departments to meet any emergent demand of aerial spray.
3. Efforts are underway by the department in order to get the new Pesticides Act passed by the parliament. This act will help in improving quality control inspection and monitoring in the field with the help of the provincial governments. Environmental safeguards will also be improved with the collaboration of Ministry of Environment at manufacturing and formulation stages of pesticides.
4. A project of “Establishment of Pesticide Quality Control and Research Laboratory” Quetta has been completed in last five years by the Department of Plant Protection with a cost of Rs. 19.262 million and handed over to Agriculture Extension Department of Balochistan on 2‐1‐2010 for improving quality control inspection and monitoring of pesticides in Balochistan province.
v) Irrigation
The canal head withdrawals in Kharif 2009 (April‐September) have increased by 1.0 percent and stood at 67.3 Million Acre Feet (MAF), as compared to 66.93 MAF during the same period last year. During the Rabi season 2009‐10 (October‐March), the canal head withdrawals shows a slight change, as it remained at 25.02 MAF compared to 24.9 MAF during the same period last year. Province‐wise details are given in Table 2.15.

Agriculture
25
Table 2.15: Canal Head Withdrawals (Below Rim Station) Million Acre Feet (MAF)
Provinces Kharif
(Apr‐Sep) 2008
Kharif(Apr ‐Sep)
2009
% Change inKharif 2009 over 2008
Rabi(Oct‐Mar) 2008‐09
Rabi (Oct –Mar) 2009‐10
% Change inRabi 2009‐10 Over 2008‐09
Punjab 34.23 34.57 1 13.28 13.36 1Sindh 29.51 29.58 0 10.30 10.25 ‐1Baluchistan 2.13 2.11 ‐1 0.61 0.79 31Khyber Pakhtunkhwa
1.06 1.04 ‐2 0.74 0.62 ‐16
Total 66.93 67.30 1.0 24.94 25.02 0Source: Indus River System Authority.
The Government of Pakistan’s Vision for the welfare, poverty alleviation and well being of people is being come true through GDP enhancement. Water is a key source for GDP growth and poverty alleviation; therefore, the water sector gained major focus throughout the last decade. Per capita water availability is diminishing as Pakistan’s population is increasing. In this context, the challenge will be the formulation and effective implementation of a comprehensive set of measures for the development and management of water resources.
The main areas of investments in water sector were:
a. Augmentation of water resources
b. Conservation measures
c. Protection of infrastructure from onslaught of floods
d. Significantly enhanced public sector investment
e. Construction of small & medium dams, lining of irrigation channels, rehabilitation of irrigation system, surface and sub‐surface drainage, lining of watercourses.
The strategy is inline with the Medium Term Development Framework (MTDF) Program 2005‐2010 and also provides a benchmark for moving forward in the next five years. Water being a critical input to agriculture in arid and semi arid climate zone has been provided financial resources amounting to Rs. 59.92 billion including water management programme (during 2009‐10), despite economic and financial recession and transition economy in Pakistan.
WATER SECTOR FISCAL PROGRAMMES DURING (2009‐10)
Works on Gomal Zam Dam Project is Tribal/Khyber Pakhtunkhwa area continues despite of law & order situation.
A sum of Rs. 5.71 billion was spent for lining of irrigation channels in Punjab, Sindh and Khyber Pakhtunkhwa.
An amount of Rs. 16.067 billion was spent for the improvement/remodeling of existing irrigating system.
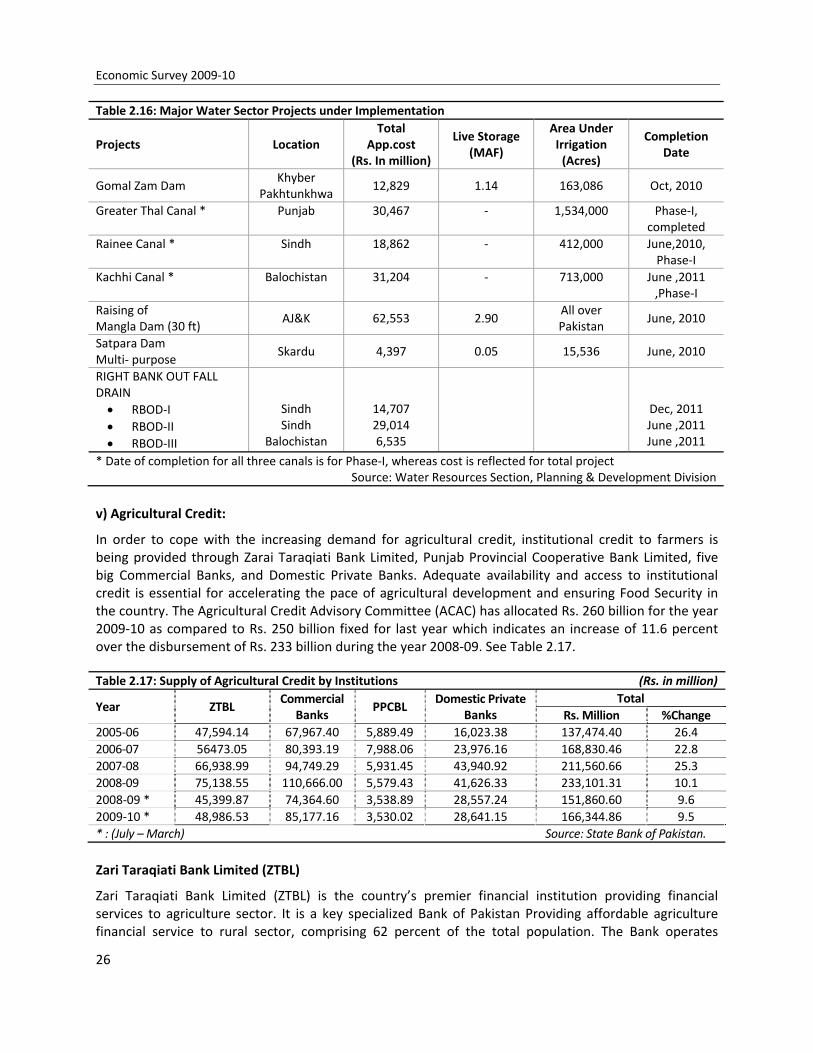
Major water sector projects under implementation are given in Table 2.16.
Economic Survey 2009‐10
26
Table 2.16: Major Water Sector Projects under Implementation
Projects Location Total
App.cost (Rs. In million)
Live Storage (MAF)
Area Under Irrigation (Acres)
Completion Date
Gomal Zam Dam Khyber
Pakhtunkhwa 12,829 1.14 163,086 Oct, 2010
Greater Thal Canal * Punjab 30,467 ‐ 1,534,000 Phase‐I, completed
Rainee Canal * Sindh 18,862 ‐ 412,000 June,2010, Phase‐I
Kachhi Canal * Balochistan 31,204 ‐ 713,000 June ,2011 ,Phase‐I
Raising of Mangla Dam (30 ft)
AJ&K 62,553 2.90 All over Pakistan
June, 2010
Satpara Dam Multi‐ purpose
Skardu 4,397 0.05 15,536 June, 2010
RIGHT BANK OUT FALL DRAIN • RBOD‐I • RBOD‐II • RBOD‐III
Sindh Sindh
Balochistan
14,707 29,014 6,535
Dec, 2011 June ,2011 June ,2011
* Date of completion for all three canals is for Phase‐I, whereas cost is reflected for total project Source: Water Resources Section, Planning & Development Division
v) Agricultural Credit:
In order to cope with the increasing demand for agricultural credit, institutional credit to farmers is being provided through Zarai Taraqiati Bank Limited, Punjab Provincial Cooperative Bank Limited, five big Commercial Banks, and Domestic Private Banks. Adequate availability and access to institutional credit is essential for accelerating the pace of agricultural development and ensuring Food Security in the country. The Agricultural Credit Advisory Committee (ACAC) has allocated Rs. 260 billion for the year 2009‐10 as compared to Rs. 250 billion fixed for last year which indicates an increase of 11.6 percent over the disbursement of Rs. 233 billion during the year 2008‐09. See Table 2.17.
Table 2.17: Supply of Agricultural Credit by Institutions (Rs. in million)
Year ZTBL Commercial
Banks PPCBL
Domestic Private Banks
Total Rs. Million %Change
2005‐06 47,594.14 67,967.40 5,889.49 16,023.38 137,474.40 26.42006‐07 56473.05 80,393.19 7,988.06 23,976.16 168,830.46 22.82007‐08 66,938.99 94,749.29 5,931.45 43,940.92 211,560.66 25.32008‐09 75,138.55 110,666.00 5,579.43 41,626.33 233,101.31 10.12008‐09 * 45,399.87 74,364.60 3,538.89 28,557.24 151,860.60 9.62009‐10 * 48,986.53 85,177.16 3,530.02 28,641.15 166,344.86 9.5* : (July – March) Source: State Bank of Pakistan. Zari Taraqiati Bank Limited (ZTBL)
Zari Taraqiati Bank Limited (ZTBL) is the country’s premier financial institution providing financial services to agriculture sector. It is a key specialized Bank of Pakistan Providing affordable agriculture financial service to rural sector, comprising 62 percent of the total population. The Bank operates

Agriculture
27
through a country‐wide network of 26 Zonal Offices and 347 branches and a team of 1392 Mobile Credit Officers in the field. ZTBL alone serves about half a million farmers annually and has a share of around 28.6 percent of the total institutional agricultural credit. Since inception up to March 31, 2010, the Bank has disbursed loan amounting to Rs. 648.313 billion. The bank so far has financed 532,254 tractors and 148,486 tube‐wells besides being the major source of financing for farm inputs including seeds, fertilizer, pesticides and insecticides. Priority was also accorded to the provision of more credit for livestock, dairy farming, poultry farming, aquaculture and financing of oil seed crops.
NEW PRODUCTS INTRODUCED BY ZTBL
1. Benazir Tractor Scheme
In order to bridge the gap between demand and supply position of tractors in the country, the Federal Government has decided to launch Accelerated Agricultural Mechanization for Productivity Enhancement, “Benazir Tractor Scheme” through ZTBL.
The scheme envisages supply of 10,000 tractors during 2009‐10 to the farmers to be selected through computerized balloting for grant of subsidy up to 50% of the cost of the tractor subject to maximum of Rs. 200,000 per beneficiary/tractor.
2. Awami Zarai Scheme
All new borrowers of crop production loans will have to avail revolving limit under Awami Zarai Scheme to get inputs through M/S KSSL under kind system. This scheme is optional for existing borrowers to the Bank.
3. Rural Development Scheme
This Project is initiated to provide credit assistance for dairy, poultry, sheep & goat farming in the rural areas of AJ&K state especially in Earthquake affected areas.
III. Forestry
Forests are crucial for the well being of humanity. They provide foundations of life on earth through ecological functions, by regulating the climate and water resources and by serving as habitats for plants and animals. Forests also furnish a wide range of essential goods such as wood, food fodder and medicines in addition to opportunities for recreation, and other services. Forests are under pressure for expanding human and livestock populations with frequently leads to conversion or degradations of forests into unsustainable forms of land use. When forests are lost or severely degraded, their capacity to function as regulators of the environment is also lost, increasing floods and erosion hazards, reducing soil fertility and contributing to the loss of plant and animal life. Under Millennium Development Goals of Forestry sector, Pakistan is committed to increase forest cover from existing 5.2 percent to 5.7 percent by the year 2011 and 6 percent by the year 2015. An increase of 1 percent implies that an additional 1.051 million hectares area has to be brought under forest cover by 2015.
Measures to enhance forest cover
Mass Afforestation and Tree Planting Campaigns: In order to enhance tree cover in the country, tree planting campaigns are held each year. During the tree planting campaigns all the Government Departments, Private organizations, Defence organizations and NGOs were involved in planting activities.
Economic Survey 2009‐10
28
By 2030, Pakistan will be managing all types of forests on ecosystem approach, enabling them to perform potential functions of conserving biodiversity, providing sustainable livelihood to dependent communities, meeting national demands for wood and contributing positively to mitigate global environmental problems.
Pakistan has set a new Guinness World Record in maximum tree planting during 24 hours on July 15, 2009, three hundred planters form the local communities planted 541,176 propagules of mangrove tree on 796 acres on an island at Keti Bundar in the Indus Delta. This event was organized by the Forestry Wing of Ministry of Environment in collaboration with the Sindh Forest Department and National Bank of Pakistan.
Prime Minister of Pakistan declared 18th August as National Tree Planting Day (NTPD). Underlying objective of celebration of NTPD is to address deforestation and associated environmental problems being faced by the nation through motivation and involvement of all segments of the society in tree plantation campaign. This was to be achieved by inducing a culture and sense of ownership among the public for forest conservation and trees cultivation through an extensive but systematic and organized awareness campaign involving print and electronic media. On 18 August 2009 massive plantation was carried out throughout Pakistan with the help of Provincial Forest Departments and Federal line Ministries/agencies.
Mangroves for the Future (MFF) initiative focus on the countries worst‐affected by the tsunami. However, MFF will also include other countries of the Region that face similar issues, with an overall aim to promote an integrated ocean wide approach to coastal zone management. Pakistan joined MFF as dialogue country in 2008. Subsequently, in October 2009 Pakistan’s National Coordinating Body for the MFF was decided that Pakistan will prepare its draft National Strategy & Action Plan (NSAP) as per requirements of Regional Steering Committee of MFF hosted by IUCN and UNDP to become regular member of this regional programme.
During the year 2009‐10 forests have contributed 93 thousand cubic meters of timber and 263 thousand cubic meters of firewood as compared to 89 thousand cubic meters timber and 258 thousand cubic meters firewood in 2008‐09. In order to enhance tree cover in the country, tree planting campaigns are held each year.
IV. Livestock and Poultry
A. Livestock
The overall thrust of Government livestock policy is to foster “private sector‐led development with public sector providing enabling environment through policy interventions and play capacity building role for improved livestock husbandry practices”. The emphasis will be on improving per unit animal productivity and moving from subsistence to market oriented and then commercial livestock farming in the country to meet the domestic demand and surplus for export. The livestock development strategy revolves around the following:
1. Public Private Partnership led development. 2. National Economic growth. 3. Poverty Alleviation. 4. Food Security. 5. Improve Livestock service delivery. 6. Expand opportunities for livelihood needs of farmers.
Agriculture
29
7. Enhance Foreign Exchange Earnings.
Livestock plays an important role in the economy of the country. Livestock sector contributed approximately 53.2 percent of the agriculture value added and 11.4 percent to national GDP during 2009‐10.While other development sector experienced saturation and decline there has been an increase in livestock sector in 2009‐10. Gross value addition of livestock at current factor cost has increased from Rs. 1304.6 billion (2008‐09) to Rs. 1537.5 billion (2009‐10) showing an increase of 17.8 percent as compared to previous year.
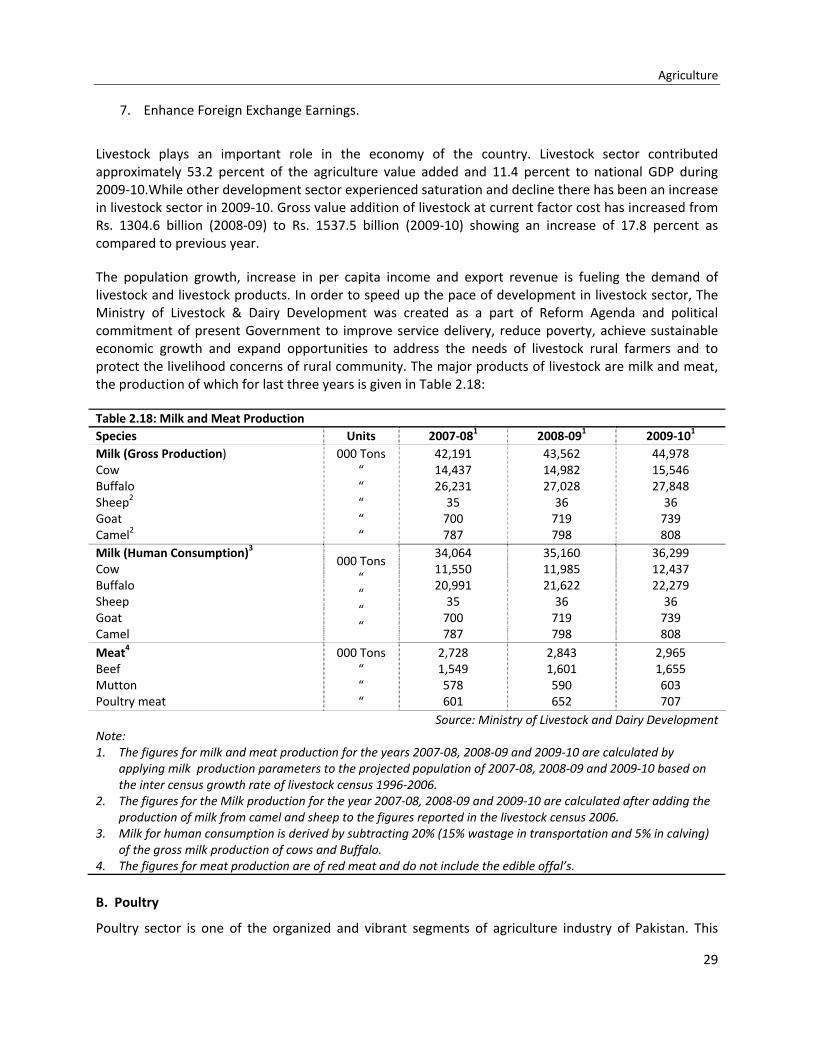
The population growth, increase in per capita income and export revenue is fueling the demand of livestock and livestock products. In order to speed up the pace of development in livestock sector, The Ministry of Livestock & Dairy Development was created as a part of Reform Agenda and political commitment of present Government to improve service delivery, reduce poverty, achieve sustainable economic growth and expand opportunities to address the needs of livestock rural farmers and to protect the livelihood concerns of rural community. The major products of livestock are milk and meat, the production of which for last three years is given in Table 2.18:
Table 2.18: Milk and Meat Production Species Units 2007‐081 2008‐091 2009‐101
Milk (Gross Production) Cow Buffalo Sheep2 Goat Camel2
000 Tons “ “ “ “ “
42,191 14,437 26,231 35 700 787
43,562 14,982 27,028 36 719 798
44,978 15,546 27,848 36 739 808
Milk (Human Consumption)3 Cow Buffalo Sheep Goat Camel
000 Tons “ “ “ “
34,064 11,550 20,991 35 700 787
35,160 11,985 21,622 36 719 798
36,299 12,437 22,279 36 739 808
Meat4 Beef Mutton Poultry meat
000 Tons “ “ “
2,728 1,549 578 601
2,843 1,601 590 652
2,965 1,655 603 707
Source: Ministry of Livestock and Dairy DevelopmentNote: 1. The figures for milk and meat production for the years 2007‐08, 2008‐09 and 2009‐10 are calculated by
applying milk production parameters to the projected population of 2007‐08, 2008‐09 and 2009‐10 based on the inter census growth rate of livestock census 1996‐2006.
2. The figures for the Milk production for the year 2007‐08, 2008‐09 and 2009‐10 are calculated after adding the production of milk from camel and sheep to the figures reported in the livestock census 2006.
3. Milk for human consumption is derived by subtracting 20% (15% wastage in transportation and 5% in calving) of the gross milk production of cows and Buffalo.
4. The figures for meat production are of red meat and do not include the edible offal’s. B. Poultry
Poultry sector is one of the organized and vibrant segments of agriculture industry of Pakistan. This
Economic Survey 2009‐10
30
sector generates employment (direct/indirect) and income for about 1.5 million people. Poultry meat contributes 23.8 percent of the total meat production in the country .Poultry Development Policy visions sustainable supply of wholesome poultry meat; eggs and value added products to the local and international markets at competitive prices and aimed at facilitating and support private sector‐led development for sustainable poultry production. The strategy revolves around Improving regulatory framework; disease control and genetic improvement in rural poultry; hi‐tech poultry production under environmentally –controlled housing; processing and value addition; Improving bio‐security; need based research and development and farmers training & education. It envisages poultry sectors growth of 15‐20 percent per annum.
C. Mega Development Projects
The Government has substantially increased public sector investment and has initiated mega development project for strengthening Livestock services for improved disease diagnosis and control, milk and meat production, breed improvement, animal husbandry and management procedures in the country. The Ministry of Livestock & Dairy Development is presently executing seven (07) projects in Livestock sector at an estimated cost of Rs. 8.8 billion. These projects were approved during the last 3 to 4 years. The progress is an under:
Strengthening of Livestock Services Project (SLSP)
Project is of Seven years duration (2003‐2010) with total cost of Rs. 1992.66 million. The project is aimed at to eradicate rinderpest disease from the country, to enhance efficiency and effectiveness of delivery of livestock services, improvement of disease diagnosis, monitoring and reporting system, Vaccine production particularly against newly emerging and trans‐boundary Animal Disease and capacity building of veterinary staff. The major achievements of the project are:‐
Field studies on 05 models of service delivery are in progress: Community Animal Health Extension Worker (CAHEW), Women Livestock Extension Worker (WLEW),Dairy Farmers Cooperative Model (DFCM) , Wool Producers Association, Rural Poultry Support Model (RPSM)
Introduced Pest Des Petites Ruminants (PPR) vaccine production in the country, and
Established National Epidemiology Net work for Livestock Disease Surveillance and Reporting.
Livestock Production & Development of Meat Production
This project is of five years duration (2005‐2010) and has total allocation of Rs. 1520 million. It is assisting in the establishment of 2590 fattening farms (1040 beef and 1550 mutton), 08 Slaughter houses and 20 butcheries in Private Sector. Under this project more than 9000 feed‐lot fattening operations have been completed in which more than 8,000 tons of quality beef and more than 2,000 tons of mutton have been produced.
Milk Collection Processing and Dairy Production & Development Programme
This project is of five years duration (2005‐2010) and has total allocation of Rs. 1588 million. More than 10,000 rural subsistence dairy farmers are likely to enter into the milk marketing chain due to project interventions. 15,000 to 20,000 additional breeding animals of better genetic potential for milk production will become available in the project area. The major achievements of the project includes:‐
Formed 207 Milk Producer Groups (MPG) in all the four provinces, Azad Jammu & Kashmir and
Agriculture
31
Northern Area,
Installed 150 milk cooling tanks,
Provided 63.3 tons of fodder seeds and 663 tons of animal ration/feed on cost basis to the members of MPGs,
Registered 1004 Sindhi, Sahiwal and NiliRavi livestock breeders for production of quality breeding animals.
Prime Minister’s Special Initiative for Livestock (PMSIL)
This project is of 05 years duration (2005‐2010) having total allocation of Rs. 1992 million. It is aimed at enhancing the livestock productivity through the provision of livestock production and extension services at farmer’s doorsteps, targeting 13 million rural poor in 1963 union council in 80 districts of the country. Its activities will assist in the production of additional milk and meat to the tune of 12 million liters and 0.2 million tons per annum respectively, after the completion of the project. The major achievements achieved under this project are:‐
290 veterinary clinics have been established providing veterinary services at 70 percent reduced cost to rural farmer at their door steps i.e. 100 percent achievement
Quality medicines/vaccines are available to rural farmer at 30 percent reduced cost as compared market prices
3000 number of rural community persons have been trained by imparting one month training in basic veterinary services through livestock Government institutes
44265 rural livestock female farmers have been trained in better animal husbandry practices to enhance their income through enhanced milk productivity.
National Programme for the control and prevention of Avian Influenza
This project is of three years duration (2007‐2010) having total allocation of Rs. 1180.142 million. The project is aimed at Development Avian Influenza (Al) Surveillance & Reporting System & Handling Al outbreaks strengthening diagnostic capabilities & Al vaccine quality control in country. The major achievements of this project are:‐
Established 40 Surveillance unit, 66 Rapid Response Units (RRUs),
Processed 0.4 million samples of blood, tissues & swabs for screening against Avian Influenza,
Establishment of Bio security Lab.‐3 is under process,
The project collected and analyzed 190,000 swab samples and more than 200,000 blood samples.
Disbursed Rs. 23.5 million as compensation to Avian Influenza affected farmers,
Pakistan is maintaining Avian Influenza (bird flu) free status since June 2008.
Improving Reproductive Efficiency of Cattle and Buffaloes in smallholder’s production system
This project is of five years duration (2007‐2010) and has total allocation of Rs. 495.15 million. The project aimed at establishment of Embryo Transfer Technology Center, Semen Production and Processing Center, Strengthening of Provincial Semen Production Units and Support of semen Production in private sector. The center will produce 5000 embryo per year for farm use and supply to
Economic Survey 2009‐10
32
others:‐
Civil work of Embryo Transfer Technology Centre at Okara has completed,
Embryo Transfer Technology Centre has produced 75,498 semen doses and 640 embryos from elite exotic animals for cross breeding purposes,
Carried out 10,834 Artificial Insemination and transferred embryos in79 animals, and
Provided training to Artificial Insemination Technicians.
Up gradation and Establishment of Animal Quarantine Stations in Pakistan
This project is of five years of duration (2006‐2011) having total allocation of Rs. 336 million. The project is aimed at improving quarantine facilities and establishing new entry/exit points to facilitate trade of animal and animal products:‐
05 Animal Quarantine Stations (AQS) have been up‐graded in order to facilitate import/export of livestock and its products,
02 new AQS are being established at Khunjrab and Khokhrapar.
D. New Initiative
Ministry of Livestock & Dairy Development has conceived and initiated new projects worth of Rs. 5500 million during 2009‐10. PC‐II (Feasibility studies) of the following projects is underway:
A feasibility study project on “Establishment of Halal Food Certification system in Pakistan” was proposed at a total cost of Rs. 1000 million against which a token amount of Rs. 10.0 million is allocated for the year 2009‐10. The objective of the feasibility study is to develop PC‐I regarding establishment of Halal Food Certification System in Pakistan.
A feasibility study “Establishment of National Research & Extension Network” is under implementation at a cost of Rs. 20.0 million. The project will assist in developing PC‐I with a total cost of Rs. 1500 million regarding establishing National Camel Research & Extension Network in the country.
A feasibility study titled “Progressive Control of Foot and Mouth Disease (FMD) in Pakistan” is under implementation. It is aimed at undertaking studies on Foot and Mouth Disease prevalence; study its various strain, prepare control strategy and establish modern Foot and Mouth Disease vaccine production facility in the country. The allocation for the year 2009‐10 is Rs. 9.390 million. A national program worth of Rs. 3.0 billion will be initiated on conclusion of feasibility study in 2009‐10.
Poverty Reduction through Small holder Livestock Development at a total cost of Rs.3539.132 million during the year 2009‐10. The project envisages establishing 400 smallholders’ livestock farms in the country specifically designed to cater the needs of poor farmers and landless livestock smallholders. The farms will be managed by the Members of the community farm on commercial basis in specifically designed animal sheds with facilities of fodder and water management as well as recycling of organic wastes to produce biogas/compost/electricity.
During 2008‐09, the Animal Quarantine Department (AQD) provided quarantine services and issued 18729 Health Certificates for the import of live animals, mutton beef, eggs and other livestock products

Agriculture
33
having a value of more than 201.7 million US$. The AQD generated non‐tax revenue of Rs. 54.38 million which exceeded the target of Rs. 40.00 million fixed for 2008‐09, showing an increase of 26.44 percent.
The export of meat (beef, mutton & camel meat) during 2006‐07 was US $ 47.64 million as compared to US $ 74.4 million in 2008‐09 showing an increase of 56 percent. The meat export (beef, mutton & camel meat) from July to January 2009‐10 is to the tune of US $ 60.2 million while live animals export was US$ 13.95 million. With the current pace, it is expected that export of meat during the year 2009‐10 may exceed well beyond 2008‐09 figures. Malaysian Government has shown interest to import 60,000 M. tons meat from Pakistan annually.
V. Fisheries
Fishery plays an important role in Pakistan’s economy and is considered to be a source of livelihood for the coastal inhabitants. A part from marine fisheries, inland fisheries (based in river, lakes, ponds, dams etc.) is also very important activity through out the country. Fisheries share in GDP although very little but it adds substantially to the national income through export earnings. During the year 2008‐09, a total of 134,000 m. tons of fish and fishery products were exported earning US$ 236 million. Government of Pakistan is taking a number of fruitful steps to improve fisheries sector which include inter alia strengthening of extension services, introduction of new fishing methodologies, increased production through aquaculture, development of value added products, enhancement of per capita consumption of fish, up‐gradation of socio‐economic conditions of the fishermen’s community.
Marine Fisheries Department is executing two development projects i.e. the project “Stock assessment survey programme in EEZ of Pakistan through chartering Research vessel and capacity building of Marine Fisheries Department”, is aimed to charter a suitable vessel of conducting stock assessment resource surveys in the coastal and offshore waters of Pakistan, including Exclusive Economic Zone. The project is also aimed to strengthen Marine Fisheries Department by capacity building to conduct resource survey and stock assessment on regular basis and to develop management strategy for the fish exploitation and utilization. For this purposes Iranian research vessel was chartered and first trip of stock assessment survey was undertaken during 30th October to 7th November 2009. The data collected during the survey have been analyzed and cruise report has been prepared and submitted to concerned agencies.
Two other projects i.e. “Accreditations of quality control laboratories of Marine Fisheries Department” and Establishment of Integrated National Animal and Plant Health Inspection Service (NAPHIS) (MFD component), are also being implemented to provide improved quality control services to the seafood export industry. These two projects are aimed to get the laboratories of the Marine Fisheries Department accredited with international bodies and meet the requirements of ISO 17025. It also aimed to improve the human resources capabilities of the department by inducting trained manpower and also to provide training to existing staff and officers. Microbiological and Chemical Laboratories were Accredited by the Norwegian Accreditation Agency under ISO/IEC‐17025 will now be got accredited from P.N.A.C
A hatchery complex was established under the auspices of a development project entitled “Established of hatchery complex for production of seeds of fish and shrimps” in 2001 is being renovated from funds provided by Fisheries Development Board. The renovation work will be completed by December 2010.
During the period July‐March 2009‐10 the total marine and inland fish production was estimated

Economic Survey 2009‐10
34
952,735 M. tons out which 667,762 M. tons was marine production and the remaining catch come from inland waters. Whereas the Production for the July‐March 2008‐09 was estimated to be 914,141 M. tons in which 660,141 M. tons was for marine and the remaining was produced by inland fishery sector. There is an increase of 1.3 percent in the quantity compared to the last year.
Special Section: Water Availability, Conservation & Management in Pakistan
Water is essential for sustenance of life in all forms and fresh water is a finite resource, progressively becoming scarcer due to persistent increases in its competing demands. Pakistan possesses the world’s largest contiguous irrigation system commonly called as Indus Basin Irrigation system. It commands an area of about 14.3 million hectares (35 million acres) and encompasses the Indus River and its major tributaries. The system includes three large reservoirs (Tarbela, Mangla and Chashma), 23 barrages/ headworks /siphons, 12 inter‐river links and 45 canal commands extending for about 60,800 km to serve over 140,000 farmer operated watercourses. Irrigated agriculture is the backbone of the national economy. The level of agricultural production is directly related to the availability and effective use of water as a major input. The demand for water is increasing rapidly while the opportunities for further development of water resources or maintaining their use to existing levels are diminishing. The shortage of water particularly in Rabi season has further aggravated the ongoing water crisis.
Consumption Pattern of Water
The consumption pattern of water in domestic, industrial and agriculture sector is shown in Table.1 and Fig‐1 as percentage of total use.
Emerging Issues
• Water Shortage: Pakistan is one of the world's most arid countries, with an average rainfall of under 240 mm a year. According to the benchmark water scarcity indicator (the Faulkenmark Indicator), Pakistan’s estimated current per capita water availability of around 1,066 M3 (Table 2) places it in the “high water stress” category (Table 3).
• The water shortage scenario in Pakistan is further aggravated with high variability of rainfall. The onset of climate change and global warming is likely to severely affect the availability of water. To aggravate the situation, after the loss of 3 major rivers, Ravi, Sutlej and Beas, to India under the Indus Waters Treaty 1960, India’s construction of water storage infrastructure at Baghlihar and Kishanganga, is threatening to disrupt the uninterrupted flow of water downstream into Pakistan.
Table‐ 1: Uses of Water Sectors Percentage Agriculture 69% Industry 23% Domestic uses 8%
Source: Ministry of Environment
Table‐2: Per Capita Water Availability
Year Population (Million)
Per Capita WaterAvailability (M3)
19511961 1971 1981 1991 2002 2010 2020 2025
3446 65 84 115 139.5 167.7 195.5 208.4
52603888 2751 2129 1565 1282 1066 915 858
Source: Planning Commission
69%
23%
8%
Fig‐1: Uses of Water AgricultureIndustryDomestic uses
Source: M/O Environment

Agriculture
35
• Compounding lower availability is the issue of inadequate water storage. Pakistan stores around 40% of the world’s average in terms of storage. In comparison, the storage capacity of Colorado is 497%, Nile 347%, India 33%, while Pakistan has just 9% storage capacity. As population size increases, resources become scarce in terms of per capita the same is in case with Water Resources that are statistic in nature we may conserve and manage them only. The current per capita water availability at 1066 m3/person is low, with Pakistan in the category of a high water stress country (Table‐2), that requires to concentrate on water resource development, urban and rural water supply and sanitation, industrial water supply ,irrigation and drainage, hydropower and environment protection.
Table‐3: Water Scarcity Indicators (Faulkenmark Indicator)>1700M3 /Capita Water Scarcity Rare<1700M3 /Capita Country faces seasonal or regular water‐stressed conditions <1000M3/Capita Water shortages hamper the health and well being of the human beings‐
Economic activities are affected <500M3/Capita Shortages are severe constraints to human life
Source: IRSA
• Low Water Productivity: Whatever water is available is utilized in an inefficient manner. Water production in Pakistan is less than 0.1 kg/m3 as compared to 0.39 kg/m3 in India.
• Aging and Outdated Infrastructure: Pakistan is blessed with one of the largest contiguous irrigation infrastructure. However, it was designed for water requirements of the 20th century and not for the 21st century. The design of system was for 60% cropping intensity and now the cropping intensity has crossed over 120%. Further the cropping pattern on which water demands and withdrawals were worked out was not supposed to cater to crops like sugarcane and rice which require high water use. The system maintenance also requires a lot more attention due to deferred maintenance over the last 100 years.
• Innovative Knowledge Based Management: Challenges of the 21st century require the frontiers of knowledge and innovative approaches rather than historic practices. The institutions need redefining of their roles and to develop their capacities according to new responsibilities.
• Ownership, Reforms and Joint Management: The irrigation infrastructure operation and on‐farm practices need ownership of the stakeholders such as farmers, professionals and revenue collectors. A joint management mode needs to be devised as area water boards and farmer’s organizations.
• Equity: Water provides prosperity and jobs, and acts as a “force multiplier” in the national economy. However, serious concerns exist with respect to spending common pool money to the benefit of selected groups in the absence of policy on equity. The disadvantaged groups are: i. Users at tail end of canal commands ii. Farmers outside Indus Basin
30
80
130
180
230
0
1000
2000
3000
4000
5000
6000
1951 1961 1971 1981 1991 2002 2010 2020 2025
Popu
lation
(Million)
Per Ca
pita Availability (M
)3
Fig‐2 Water Availability Vs Population Growth Per Capita availability
Population Growth
Source:Planning Commission

Economic Survey 2009‐10
36
iii. Farmers using groundwater with options of costly diesel/electricity
Water Resources of Pakistan consists mainly of rainfall, rivers, glacier, groundwater etc. There are two major sources of rainfall in Pakistan. The Monsoon and Western disturbances. Flow of Indus basin depends heavily upon the glaciers of Western Himalayas. Various sources of river flows are shown in Table‐4.
Table‐4: Contribution of Snow, Rain & Glaciers in Upper Indus Basin Flows
Location Snow (%) Rain (%) Glaciers (%)
River Indus above Tarbela 30‐35 5‐10 60‐80
River Jhelum above Mangla 65 35 ‐‐
River Kabul above Nowshera 20‐30 20‐30 30‐35
Source: WAPDA
In 1960, the Indus Waters Treaty was signed by India and Pakistan. According to this treaty, Pakistan got full rights on its Western rivers i.e. Indus, Kabul, Jhelum and Chenab. The average annual runoff of these rivers is 140 MAF, with minimum recorded so far as low as 97 MAF and maximum 172 MAF. Corresponding to this, annual diversion at the barrages for irrigation purposes is about 104 MAF.
There are three primary storage reservoirs at Tarbela, Mangla and Chashma with an original total storage capacity totaling 18.37 MAF. The reservoirs regulate the natural flows for irrigation purposes and hydropower generation and help in utilizing the stored water during the low‐flow season. From 15.75 MAF of live storage of reservoir 4.18 MAF about 27 percent has lost due to sedimentation. Due to loss storage, agriculture of Pakistan is facing shortage during low‐flow season. According to Indus River System Authority (IRSA) the shortage has gone up to 30 percent. Consequently it is becoming difficult for IRSA to fulfill the demand of provinces during Rabi. Loss of storage of reservoirs is given below in Table‐5.
The surface water of the Indus system is utilized through 19 barrages, 12 links canals, 43 canal commands and 100,000 tertiary irrigation commands (Chaks). Irrigation releases from the reservoirs are planned by the Indus River System Authority (IRSA).
Table‐5: Loss of Storage of Reservoirs (MAF)Reservoir Original Present Loss
Gross Live Dead Gross Live Dead Gross Live Dead Tarbela 11.62 9.69 1.92 7.95 6.77 1.18 3.67
32% 2.92 30%
0.7439%
Mangla 5.88 5.34 0.54 4.67 4.54 0.13 1.2121%
0.80 15%
0.4176%
Chashma 0.87 0.72 0.15 0.32 0.26 0.06 0.5563%
0.45 63%
0.1062%
Total 18.37 15.75 2.62 12.95 11.58 1.37 5.4230%
4.18 27%
1.2548%
Source: WAPDA Escapage to Sea
Despite acute water shortage in the system, data shows that a substantial amount of water escapes below Kotri to the Arabian Sea. The data shows that post‐construction of Tarbela (1976‐2008) average annual escapages below Kotri are 31.48 MAF, with a maximum of 91.83 MAF in 1994‐95 and minimum of 0.79 MAF in 2000‐01. Most of the flow to the sea occurs during Kharif season and very little during Rabi season.
Agriculture
37
Groundwater
Groundwater under the Indus Irrigation System is plentiful and is derived from infiltration of surface water as well as local rainfall. However, depending upon the quality, the useable groundwater is confined to an area of 10 million hectares. The development of this resource is through private tubewells and account for a gross abstraction of about 40 MAF per annum. The surface water and groundwater and all canal commands are being used in conjunctive environment. In many canal commands, pumpage is greater than recharge, thus causing subsidence. There is no regular and proper monitoring of private tubewells capacity, their pumping hours and utilization.
Water Availability and Requirement Gap
According to the Water Accord 1991, 117 MAF water is required for irrigation by the provinces. The water resources available for future development are 36 MAF of river flow 6.4 MAF of groundwater contribution and 3 MAF of rainfall harvesting. Besides, agriculture requirements, the estimated additional water needs to meet the municipal water supply, rural potable and sanitation industry and environment are estimated at 8 MAF (as per National Water Policy, 2003).
Future Strategic Areas to Combat Water Security Risk
The following core areas require immediate attention while formulating contingency action plan and management/policy plans:
a) Water demand management b) Climate change impacts in Pakistan c) Potential use of saline water d) Asset protection of irrigation infrastructure
a. Water demand management
Water availability is diminishing with a growing population and increasing urbanization. The need for better water demand management is well established. The following represent some areas of immediate attention:
• Promoting efficient use • Pricing water better • Optimizing cropping pattern • Integrated use and recycling of water
b. Climate Change Impact
Pakistan has been cited as amongst the most vulnerable group due to Extreme weather, change in temperature +rainfall.
Potential Impacts
• Glaciers melting. • Droughts. • Flood Event. • Change in Rainfall Pattern.
The climate change requires the following actions e.g. Potential offsets
• Need for carry over dams
• Efficient irrigation (water conservation & demand management)
• Controlling population growth rate
• Changed cropping pattern

Economic Survey 2009‐10
38
c. Saline water potential
Pakistan’s groundwater aquifer consists of join layers of fresh and saline waters and the proportional percentage of these layers varies from place to place. Today’s groundwater pumpage is around 50 MAF which can be increased by harnessing additional 25 MAF pumpage of saline water and utilization of saline drainage surplus of 3‐5 MAF. The bio‐saline technology is to be promoted. The investment will be required in future adoption of bio‐saline agricultural technology. d. Asset Protection of Irrigation Infrastructure
Pakistan has the largest contiguous irrigation system in the world which commands an area of 42 million acres. The Indus River and its western tributaries on an average bring about 142 million acre feet (MAF) of water annually and the average annual canal withdrawal is 104 MAF. The System has three major reservoirs, 19 barrages, 12 inter‐river link canals, 45 independent irrigation canal systems and more than 110,000 water courses. The total length of the canal system is about 64000 Km, the system also utilizes an estimated 42 MAF of ground water pumped through more than 921,229 tube wells (mostly private) to supplement the canal supplies.
Pakistan needs more water, however there is less likelihood that new water storage projects could be completed in next 3‐4 years. Pakistan is extra‐ordinary dependent on its water infrastructure, and it has invested in it massively. The natural state of heavily‐silt laden river Indus is to meander. This is because as silt builds up in their beds, the rivers seek lower lands and change their courses. This creates havoc with human settlements and so, throughout the world, such rivers have been trained and confined by embankments within relatively narrow beds. Over time, the likelihood of embankment breaching increases from floods.
The Indus Basin is a single, massive, highly complex interconnected ecosystem, upon which man has left a huge footprint. When a dam or barrage is constructed the water and sediment cycles are changed dramatically. When water is diverted onto deserts, the water and salt balances seek new equilibriums. The Investment in building knowledge base and the accompanying institutional and human systems is Key for efficient operation of the massive irrigation works.
Conclusion:
It is important to ensure water security for the people through a national water policy laying down the outlines of an integrated water management strategy that aims at maximizing the sustainable economic, social and environmental returns on the water resource development, allocation among its competing demands, its use by consumers and safe disposal of post‐use effluents.

TABLE 2.1 (A)
1980-81 Base 1999-2000 BaseFiscal All major Food Fibre Other All major Food Fibre OtherYear crops crops crops crops crops crops crops crops1991-92 143.7 122.5 305.9 120.5 - - - -1992-93 141.0 124.0 216.0 118.0 - - - -1993-94 155.0 123.6 191.8 137.5 - - - -1994-95 165.4 133.1 207.5 146.0 - - - -1995-96 163.3 137.0 252.8 140.1 - - - -1996-97 155.3 136.5 223.6 130.3 - - - -1997-98 186.2 150.2 219.1 164.5 - - - -1998-99 189.8 147.6 209.7 170.9 - - - -1999-00 178.4 167.7 268.2 143.7 100 100 100 1002000-01 165.9 152.8 256.0 135.1 93 91 95 942001-02 172.1 142.9 253.2 148.7 97 85 94 1042002-03 185.4 153.9 243.6 160.9 104 92 91 1122003-04 190.7 159.6 239.7 165.1 107 95 89 1152004-05 - - - - 104 106 127 1022005-06 - - - - 101 107 116 962006-07 - - - - 117 115 114 1182007-08 - - - - 126 108 104 1382008-09 - - - - 114 124 105 1082009-10 P - - - - 112 122 113 106P : Provisional, Jul-Mar Source: Federal Bureau of Statistics
INDEX OF AGRICULTURAL PRODUCTION
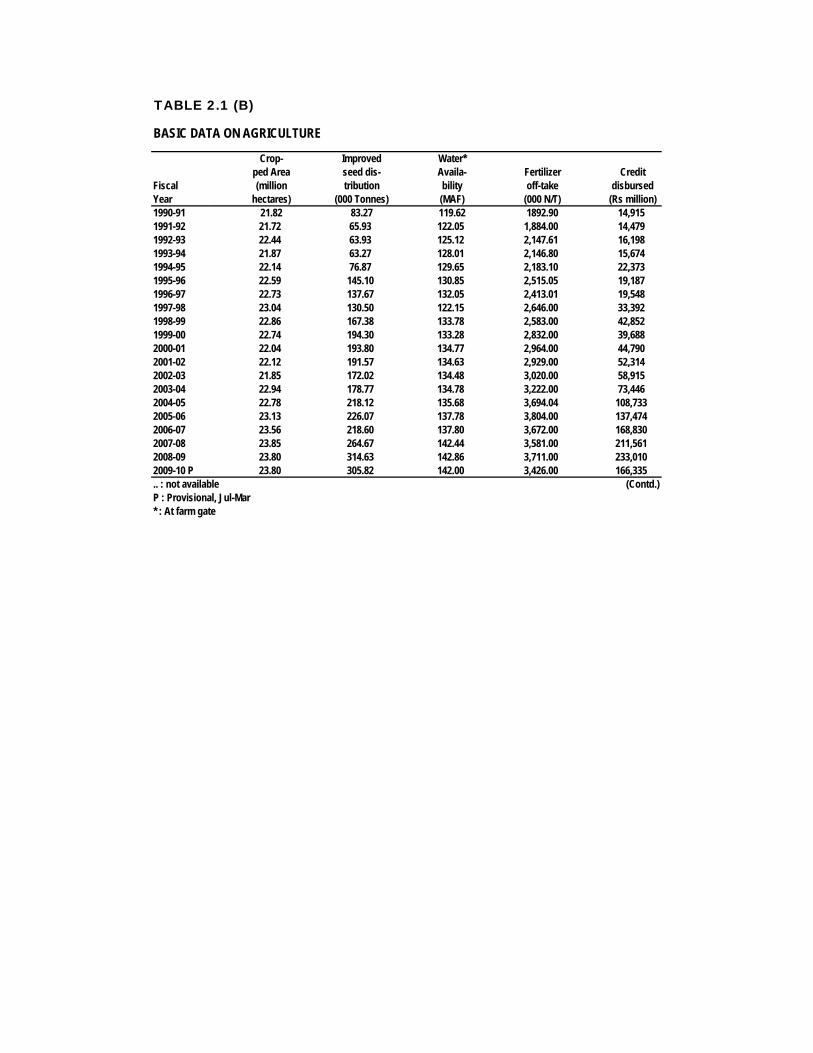
TABLE 2.1 (B)
BASIC DATA ON AGRICULTURE
Crop- Improved Water*ped Area seed dis- Availa- Fertilizer Credit
Fiscal (million tribution bility off-take disbursedYear hectares) (000 Tonnes) (MAF) (000 N/T) (Rs million)1990-91 21.82 83.27 119.62 1892.90 14,9151991-92 21.72 65.93 122.05 1,884.00 14,4791992-93 22.44 63.93 125.12 2,147.61 16,1981993-94 21.87 63.27 128.01 2,146.80 15,6741994-95 22.14 76.87 129.65 2,183.10 22,3731995-96 22.59 145.10 130.85 2,515.05 19,1871996-97 22.73 137.67 132.05 2,413.01 19,5481997-98 23.04 130.50 122.15 2,646.00 33,3921998-99 22.86 167.38 133.78 2,583.00 42,8521999-00 22.74 194.30 133.28 2,832.00 39,6882000-01 22.04 193.80 134.77 2,964.00 44,7902001-02 22.12 191.57 134.63 2,929.00 52,3142002-03 21.85 172.02 134.48 3,020.00 58,9152003-04 22.94 178.77 134.78 3,222.00 73,4462004-05 22.78 218.12 135.68 3,694.04 108,7332005-06 23.13 226.07 137.78 3,804.00 137,4742006-07 23.56 218.60 137.80 3,672.00 168,8302007-08 23.85 264.67 142.44 3,581.00 211,5612008-09 23.80 314.63 142.86 3,711.00 233,0102009-10 P 23.80 305.82 142.00 3,426.00 166,335.. : not available (Contd.)P : Provisional, Jul-Mar* : At farm gate

TABLE 2.1 (B)
BASIC DATA ON AGRICULTURE
Number of Production of Production Fish TotalFiscal Tube wells Tractors of meat Milk Production Forest ProductionYear (a) (Nos) (000 Tonnes) (000 Tonnes) (000 Tonnes) (000 cu.mtr.)1990-91 339,840 13,841 1,581 15,481 483.0 1,0721991-92 355,840 10,077 1,685 16,280 553.1 4911992-93 374,099 16,628 1,872 17,120 621.7 6911993-94 444,179 15,129 2,000 18,006 558.1 7031994-95 463,463 17,063 2,114 18,966 541.9 6841995-96 485,050 16,218 1,841 22,970 555.5 7201996-97 506,824 10,121 1,908 23,580 589.7 3431997-98 531,259 14,242 1,841 24,215 597.0 3861998-99 563,226 26,885 1,906 24,876 654.5 4361999-00 609,775 35,038 1,957 25,566 614.8 3642000-01 659,278 32,553 2,015 26,284 629.6 472 *2001-02 707,273 24,311 2,072 27,031 637.8 487 *2002-03 768,962 27,101 2,132 27,811 566.2 266 *2003-04 950,144 36,059 2,188 28,624 573.5 313 *2004-05 984,294 44,095 2,271 29,438 580.6 282 *2005-06 999,569 49,642 2,515 31,970 604.9 265 *2006-07 931,306 54,431 2,618 32,986 640.0 373 *2007-08 921,121 53,598 2,728 34,064 885.0 3632008-09 921,229 60,561 2,843 35,160 914.1 3472009-10 P 921,229 69,245 2,965 36,299 925.7 356.. : not available (a) : Public and private tube wells. Source: 1. Federal Bureau of Statistics.P : Provisional (July-March) E : Estimated 2. Ministry of Food and Agriculture* : Revised
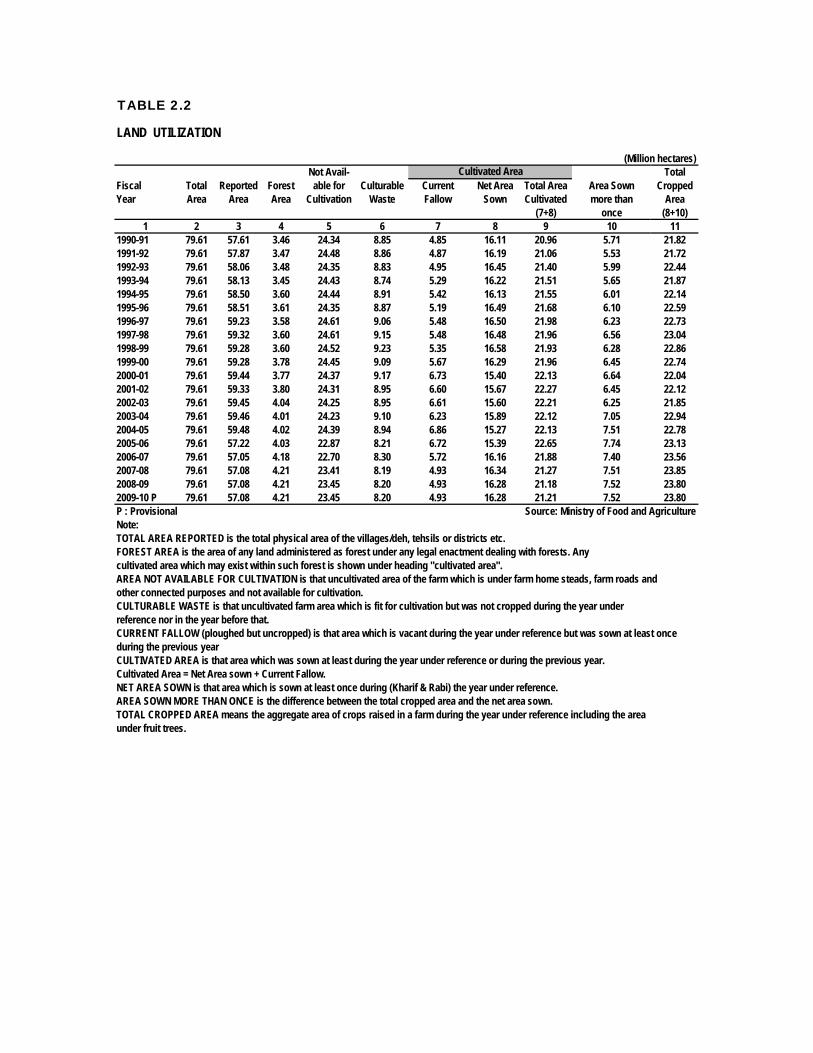
TABLE 2.2
(Million hectares)Not Avail- Total
Fiscal Total Reported Forest able for Culturable Current Net Area Total Area Area Sown CroppedYear Area Area Area Cultivation Waste Fallow Sown Cultivated more than Area
(7+8) once (8+10)1 2 3 4 5 6 7 8 9 10 11
1990-91 79.61 57.61 3.46 24.34 8.85 4.85 16.11 20.96 5.71 21.821991-92 79.61 57.87 3.47 24.48 8.86 4.87 16.19 21.06 5.53 21.721992-93 79.61 58.06 3.48 24.35 8.83 4.95 16.45 21.40 5.99 22.441993-94 79.61 58.13 3.45 24.43 8.74 5.29 16.22 21.51 5.65 21.871994-95 79.61 58.50 3.60 24.44 8.91 5.42 16.13 21.55 6.01 22.141995-96 79.61 58.51 3.61 24.35 8.87 5.19 16.49 21.68 6.10 22.591996-97 79.61 59.23 3.58 24.61 9.06 5.48 16.50 21.98 6.23 22.731997-98 79.61 59.32 3.60 24.61 9.15 5.48 16.48 21.96 6.56 23.041998-99 79.61 59.28 3.60 24.52 9.23 5.35 16.58 21.93 6.28 22.861999-00 79.61 59.28 3.78 24.45 9.09 5.67 16.29 21.96 6.45 22.742000-01 79.61 59.44 3.77 24.37 9.17 6.73 15.40 22.13 6.64 22.042001-02 79.61 59.33 3.80 24.31 8.95 6.60 15.67 22.27 6.45 22.122002-03 79.61 59.45 4.04 24.25 8.95 6.61 15.60 22.21 6.25 21.852003-04 79.61 59.46 4.01 24.23 9.10 6.23 15.89 22.12 7.05 22.942004-05 79.61 59.48 4.02 24.39 8.94 6.86 15.27 22.13 7.51 22.782005-06 79.61 57.22 4.03 22.87 8.21 6.72 15.39 22.65 7.74 23.132006-07 79.61 57.05 4.18 22.70 8.30 5.72 16.16 21.88 7.40 23.562007-08 79.61 57.08 4.21 23.41 8.19 4.93 16.34 21.27 7.51 23.852008-09 79.61 57.08 4.21 23.45 8.20 4.93 16.28 21.18 7.52 23.802009-10 P 79.61 57.08 4.21 23.45 8.20 4.93 16.28 21.21 7.52 23.80P : Provisional Source: Ministry of Food and AgricultureNote:TOTAL AREA REPORTED is the total physical area of the villages/deh, tehsils or districts etc.FOREST AREA is the area of any land administered as forest under any legal enactment dealing with forests. Anycultivated area which may exist within such forest is shown under heading "cultivated area".AREA NOT AVAILABLE FOR CULTIVATION is that uncultivated area of the farm which is under farm home steads, farm roads andother connected purposes and not available for cultivation.CULTURABLE WASTE is that uncultivated farm area which is fit for cultivation but was not cropped during the year underreference nor in the year before that.CURRENT FALLOW (ploughed but uncropped) is that area which is vacant during the year under reference but was sown at least onceduring the previous yearCULTIVATED AREA is that area which was sown at least during the year under reference or during the previous year.Cultivated Area = Net Area sown + Current Fallow.NET AREA SOWN is that area which is sown at least once during (Kharif & Rabi) the year under reference.AREA SOWN MORE THAN ONCE is the difference between the total cropped area and the net area sown.TOTAL CROPPED AREA means the aggregate area of crops raised in a farm during the year under reference including the areaunder fruit trees.
LAND UTILIZATION
Cultivated Area

TABLE 2.3
(000 hectares)Total Rapeseed
Fiscal Food Sugar- and Sesa-Year Wheat Rice Bajra Jowar Maize Barley Grains Gram cane Mustard mum Cotton Tobacco1990-91 7,911 2,113 491 417 845 157 11,934 1,092 884 304 53 2,662 441991-92 7,878 2,097 313 383 848 149 11,667 997 896 287 70 2,836 541992-93 8,300 1,973 487 403 868 160 12,191 1,008 885 285 82 2,836 581993-94 8,034 2,187 303 365 879 151 11,919 1,045 963 269 73 2,805 571994-95 8,170 2,125 509 438 890 165 12,297 1,065 1,009 301 80 2,653 471995-96 8,376 2,162 407 418 939 171 12,473 1,119 963 320 90 2,997 461996-97 8,109 2,251 303 370 928 152 12,113 1,100 965 354 100 3,149 491997-98 8,355 2,317 460 390 933 163 12,618 1,102 1,056 340 96 2,960 531998-99 8,230 2,424 463 383 962 137 12,599 1,077 1,155 327 71 2,923 571999-00 8,463 2,515 313 357 962 124 12,734 972 1,010 321 72 2,983 562000-01 8,181 2,377 390 354 944 113 12,359 905 961 273 101 2,927 462001-02 8,058 2,114 417 358 942 111 12,000 934 1,000 269 136 3,116 492002-03 8,034 2,225 349 338 935 108 11,989 963 1,100 256 88 2,794 472003-04 8,216 2,461 539 392 947 102 12,657 982 1,074 259 60 2,989 462004-05 8,358 2,520 343 308 982 93 12,603 1,094 966 243 66 3,193 502005-06 8,448 2,621 441 254 1,042 90 12,896 1,029 907 217 82 3,103 562006-07 8,578 2,581 504 292 1,017 94 13,066 1,052 1,029 256 71 3,075 512007-08 8,550 2,515 531 281 1,052 91 13,020 1,107 1,241 224 76 3,054 512008-09 9,046 2,963 470 263 1,052 86 13,880 1,081 1,029 233 91 2,820 502009-10 P 9,042 2,883 476 248 950 80 13,679 1,050 943 185 80 3,106 49Note : 1 ha = 2.47 acres Source: 1. Ministry of Food and Agriculture P : Provisional (Jul-Mar) 2. Federal Bureau of Statistics
AREA UNDER IMPORTANT CROPS
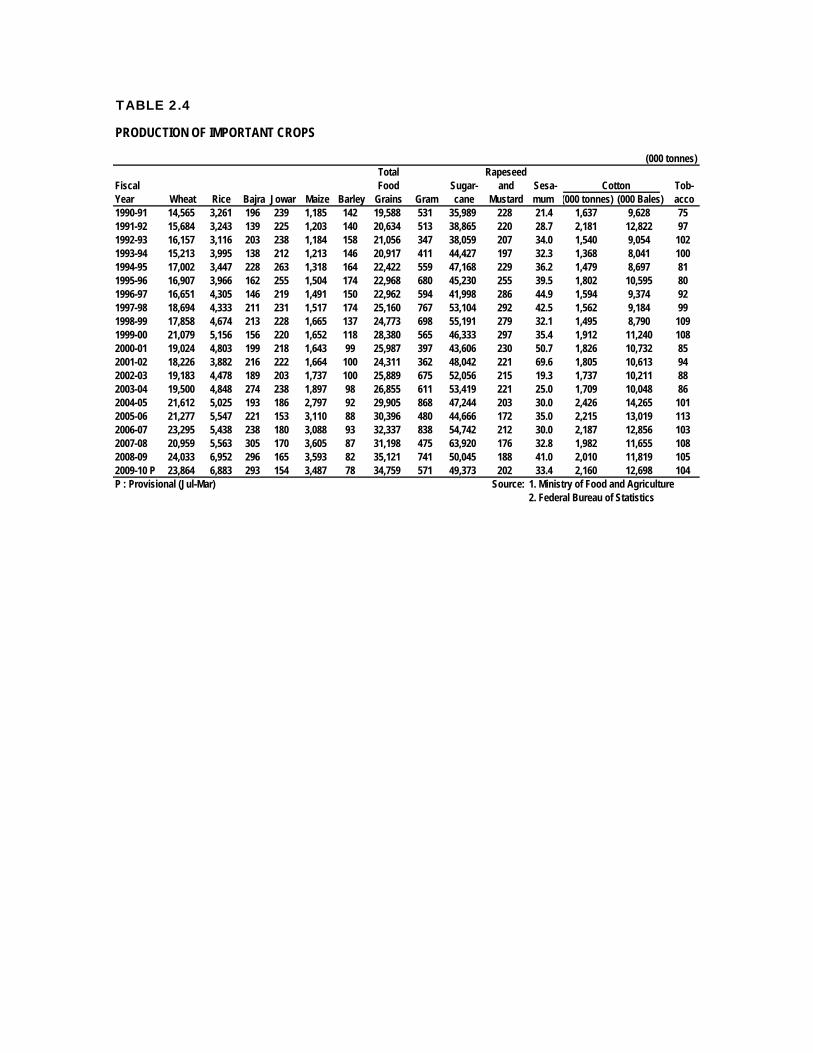
TABLE 2.4
(000 tonnes)Total Rapeseed
Fiscal Food Sugar- and Sesa- Cotton Tob-Year Wheat Rice Bajra Jowar Maize Barley Grains Gram cane Mustard mum (000 tonnes) (000 Bales) acco1990-91 14,565 3,261 196 239 1,185 142 19,588 531 35,989 228 21.4 1,637 9,628 751991-92 15,684 3,243 139 225 1,203 140 20,634 513 38,865 220 28.7 2,181 12,822 971992-93 16,157 3,116 203 238 1,184 158 21,056 347 38,059 207 34.0 1,540 9,054 1021993-94 15,213 3,995 138 212 1,213 146 20,917 411 44,427 197 32.3 1,368 8,041 1001994-95 17,002 3,447 228 263 1,318 164 22,422 559 47,168 229 36.2 1,479 8,697 811995-96 16,907 3,966 162 255 1,504 174 22,968 680 45,230 255 39.5 1,802 10,595 801996-97 16,651 4,305 146 219 1,491 150 22,962 594 41,998 286 44.9 1,594 9,374 921997-98 18,694 4,333 211 231 1,517 174 25,160 767 53,104 292 42.5 1,562 9,184 991998-99 17,858 4,674 213 228 1,665 137 24,773 698 55,191 279 32.1 1,495 8,790 1091999-00 21,079 5,156 156 220 1,652 118 28,380 565 46,333 297 35.4 1,912 11,240 1082000-01 19,024 4,803 199 218 1,643 99 25,987 397 43,606 230 50.7 1,826 10,732 852001-02 18,226 3,882 216 222 1,664 100 24,311 362 48,042 221 69.6 1,805 10,613 942002-03 19,183 4,478 189 203 1,737 100 25,889 675 52,056 215 19.3 1,737 10,211 882003-04 19,500 4,848 274 238 1,897 98 26,855 611 53,419 221 25.0 1,709 10,048 862004-05 21,612 5,025 193 186 2,797 92 29,905 868 47,244 203 30.0 2,426 14,265 1012005-06 21,277 5,547 221 153 3,110 88 30,396 480 44,666 172 35.0 2,215 13,019 1132006-07 23,295 5,438 238 180 3,088 93 32,337 838 54,742 212 30.0 2,187 12,856 1032007-08 20,959 5,563 305 170 3,605 87 31,198 475 63,920 176 32.8 1,982 11,655 1082008-09 24,033 6,952 296 165 3,593 82 35,121 741 50,045 188 41.0 2,010 11,819 1052009-10 P 23,864 6,883 293 154 3,487 78 34,759 571 49,373 202 33.4 2,160 12,698 104P : Provisional (Jul-Mar) Source: 1. Ministry of Food and Agriculture
2. Federal Bureau of Statistics
PRODUCTION OF IMPORTANT CROPS
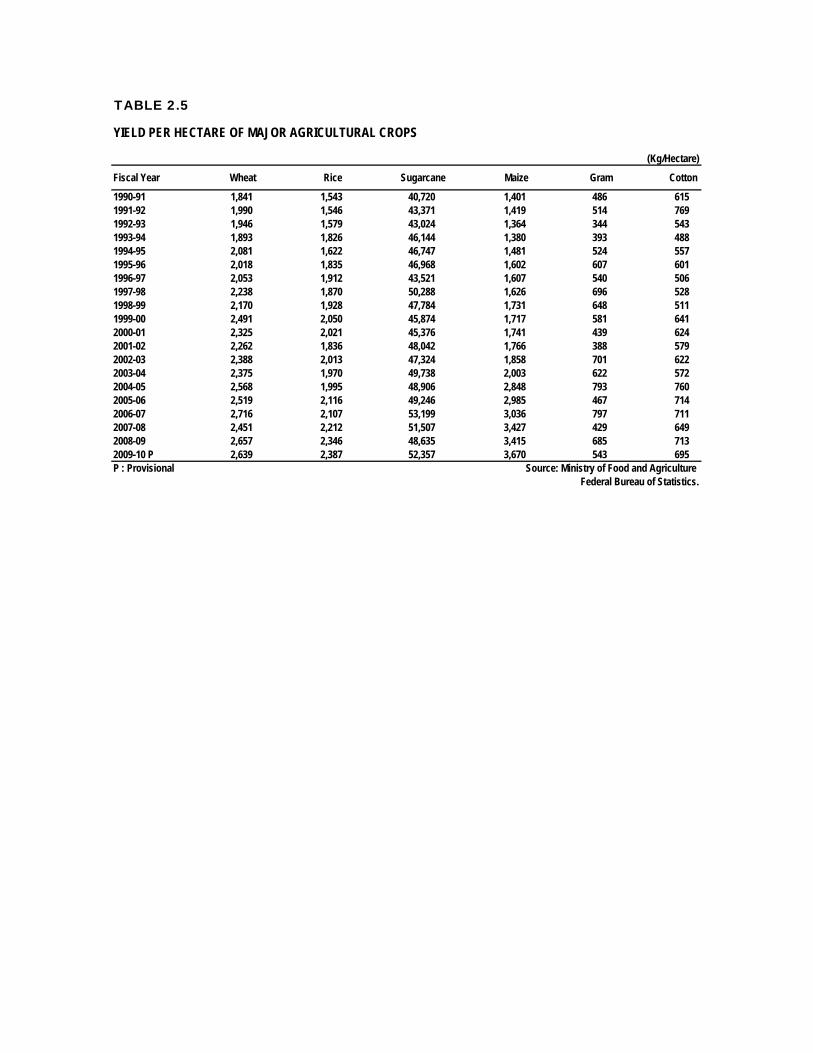
TABLE 2.5
(Kg/Hectare)
Fiscal Year Wheat Rice Sugarcane Maize Gram Cotton
1990-91 1,841 1,543 40,720 1,401 486 6151991-92 1,990 1,546 43,371 1,419 514 7691992-93 1,946 1,579 43,024 1,364 344 5431993-94 1,893 1,826 46,144 1,380 393 4881994-95 2,081 1,622 46,747 1,481 524 5571995-96 2,018 1,835 46,968 1,602 607 6011996-97 2,053 1,912 43,521 1,607 540 5061997-98 2,238 1,870 50,288 1,626 696 5281998-99 2,170 1,928 47,784 1,731 648 5111999-00 2,491 2,050 45,874 1,717 581 6412000-01 2,325 2,021 45,376 1,741 439 6242001-02 2,262 1,836 48,042 1,766 388 5792002-03 2,388 2,013 47,324 1,858 701 6222003-04 2,375 1,970 49,738 2,003 622 5722004-05 2,568 1,995 48,906 2,848 793 7602005-06 2,519 2,116 49,246 2,985 467 7142006-07 2,716 2,107 53,199 3,036 797 7112007-08 2,451 2,212 51,507 3,427 429 6492008-09 2,657 2,346 48,635 3,415 685 7132009-10 P 2,639 2,387 52,357 3,670 543 695P : Provisional Source: Ministry of Food and Agriculture Federal Bureau of Statistics.
YIELD PER HECTARE OF MAJOR AGRICULTURAL CROPS
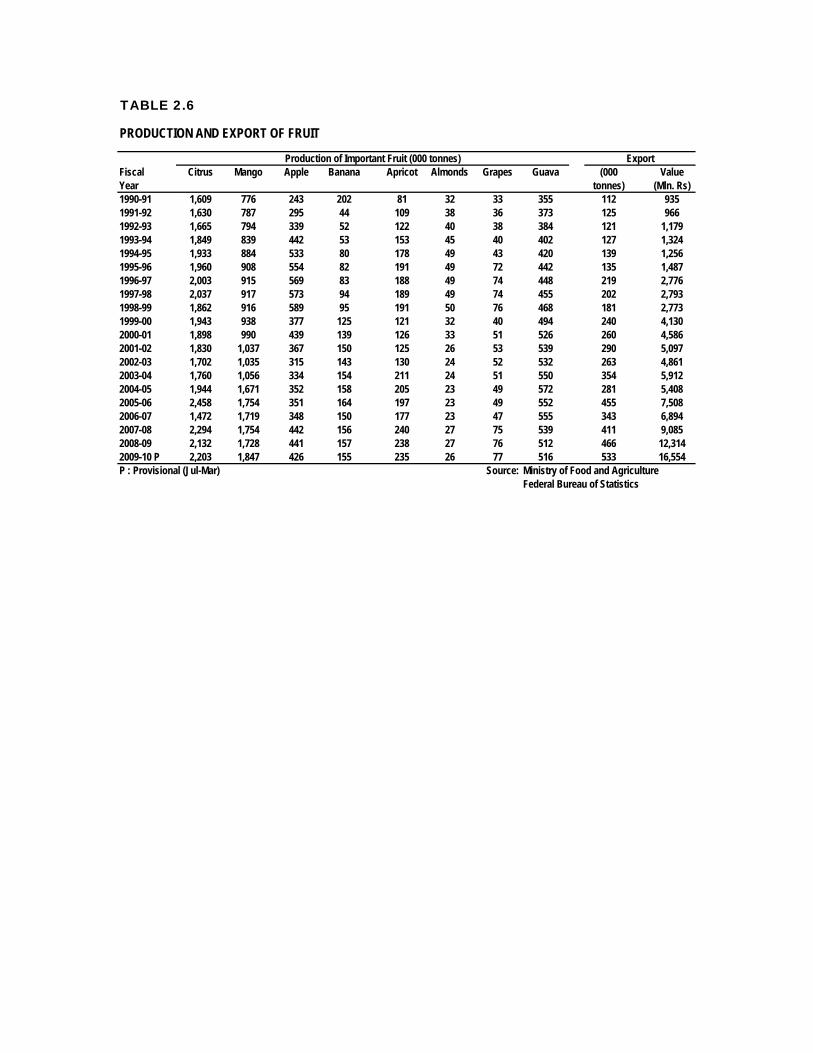
TABLE 2.6
PRODUCTION AND EXPORT OF FRUIT
Production of Important Fruit (000 tonnes) ExportFiscal Citrus Mango Apple Banana Apricot Almonds Grapes Guava (000 ValueYear tonnes) (Mln. Rs)1990-91 1,609 776 243 202 81 32 33 355 112 9351991-92 1,630 787 295 44 109 38 36 373 125 9661992-93 1,665 794 339 52 122 40 38 384 121 1,1791993-94 1,849 839 442 53 153 45 40 402 127 1,3241994-95 1,933 884 533 80 178 49 43 420 139 1,2561995-96 1,960 908 554 82 191 49 72 442 135 1,4871996-97 2,003 915 569 83 188 49 74 448 219 2,7761997-98 2,037 917 573 94 189 49 74 455 202 2,7931998-99 1,862 916 589 95 191 50 76 468 181 2,7731999-00 1,943 938 377 125 121 32 40 494 240 4,1302000-01 1,898 990 439 139 126 33 51 526 260 4,5862001-02 1,830 1,037 367 150 125 26 53 539 290 5,0972002-03 1,702 1,035 315 143 130 24 52 532 263 4,8612003-04 1,760 1,056 334 154 211 24 51 550 354 5,9122004-05 1,944 1,671 352 158 205 23 49 572 281 5,4082005-06 2,458 1,754 351 164 197 23 49 552 455 7,5082006-07 1,472 1,719 348 150 177 23 47 555 343 6,8942007-08 2,294 1,754 442 156 240 27 75 539 411 9,0852008-09 2,132 1,728 441 157 238 27 76 512 466 12,3142009-10 P 2,203 1,847 426 155 235 26 77 516 533 16,554P : Provisional (Jul-Mar) Source: Ministry of Food and Agriculture
Federal Bureau of Statistics
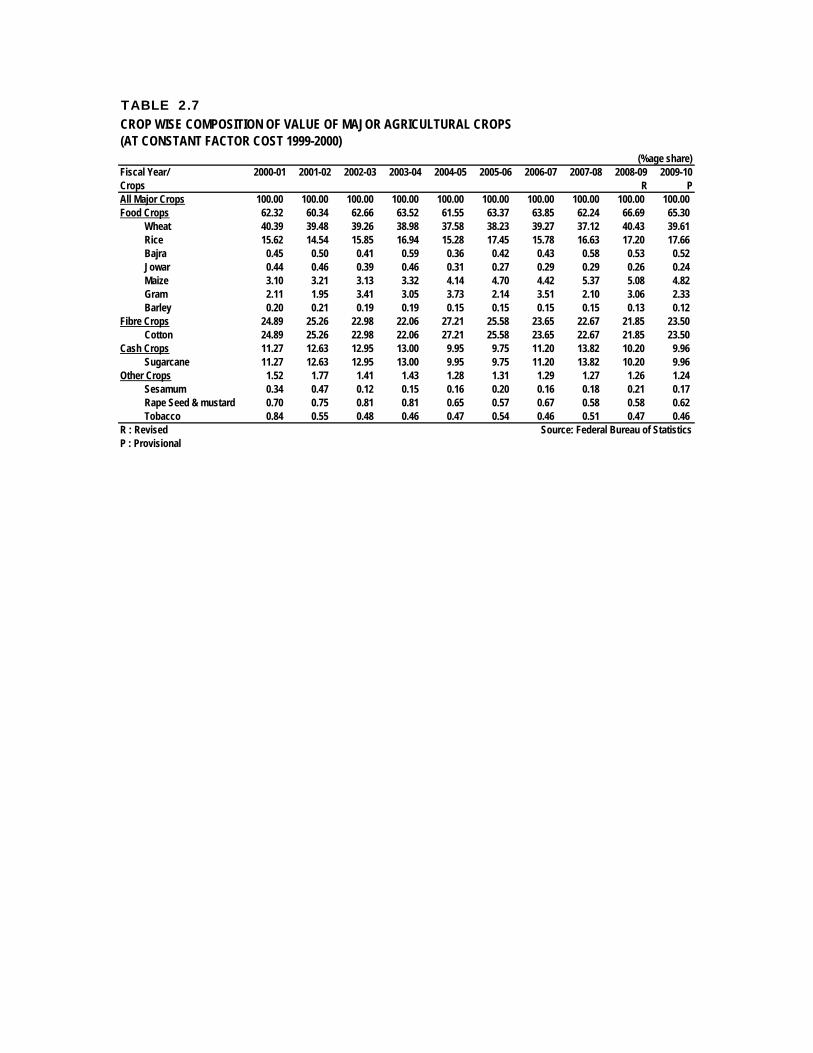
TABLE 2.7
(%age share)Fiscal Year/ 2000-01 2001-02 2002-03 2003-04 2004-05 2005-06 2006-07 2007-08 2008-09 2009-10Crops R PAll Major Crops 100.00 100.00 100.00 100.00 100.00 100.00 100.00 100.00 100.00 100.00Food Crops 62.32 60.34 62.66 63.52 61.55 63.37 63.85 62.24 66.69 65.30
Wheat 40.39 39.48 39.26 38.98 37.58 38.23 39.27 37.12 40.43 39.61Rice 15.62 14.54 15.85 16.94 15.28 17.45 15.78 16.63 17.20 17.66Bajra 0.45 0.50 0.41 0.59 0.36 0.42 0.43 0.58 0.53 0.52Jowar 0.44 0.46 0.39 0.46 0.31 0.27 0.29 0.29 0.26 0.24Maize 3.10 3.21 3.13 3.32 4.14 4.70 4.42 5.37 5.08 4.82Gram 2.11 1.95 3.41 3.05 3.73 2.14 3.51 2.10 3.06 2.33Barley 0.20 0.21 0.19 0.19 0.15 0.15 0.15 0.15 0.13 0.12
Fibre Crops 24.89 25.26 22.98 22.06 27.21 25.58 23.65 22.67 21.85 23.50Cotton 24.89 25.26 22.98 22.06 27.21 25.58 23.65 22.67 21.85 23.50
Cash Crops 11.27 12.63 12.95 13.00 9.95 9.75 11.20 13.82 10.20 9.96Sugarcane 11.27 12.63 12.95 13.00 9.95 9.75 11.20 13.82 10.20 9.96
Other Crops 1.52 1.77 1.41 1.43 1.28 1.31 1.29 1.27 1.26 1.24Sesamum 0.34 0.47 0.12 0.15 0.16 0.20 0.16 0.18 0.21 0.17Rape Seed & mustard 0.70 0.75 0.81 0.81 0.65 0.57 0.67 0.58 0.58 0.62Tobacco 0.84 0.55 0.48 0.46 0.47 0.54 0.46 0.51 0.47 0.46
R : Revised Source: Federal Bureau of StatisticsP : Provisional
CROP WISE COMPOSITION OF VALUE OF MAJOR AGRICULTURAL CROPS(AT CONSTANT FACTOR COST 1999-2000)
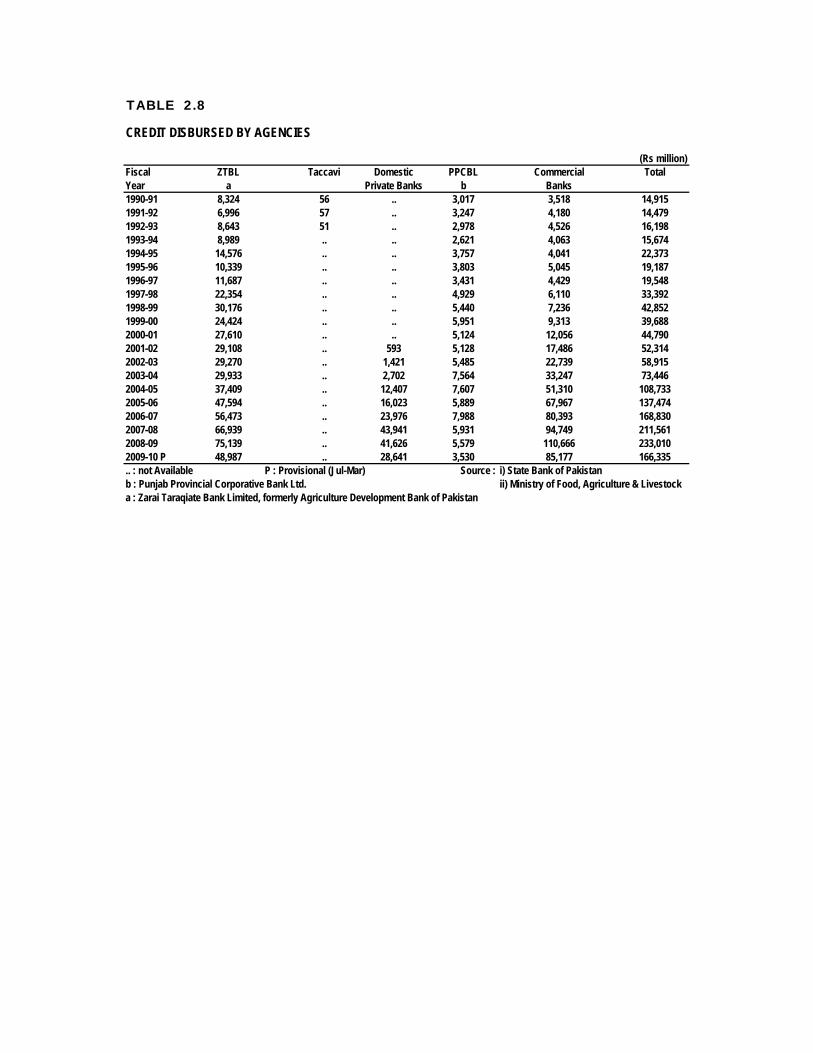
TABLE 2.8
(Rs million)Fiscal ZTBL Taccavi Domestic PPCBL Commercial TotalYear a Private Banks b Banks1990-91 8,324 56 .. 3,017 3,518 14,9151991-92 6,996 57 .. 3,247 4,180 14,4791992-93 8,643 51 .. 2,978 4,526 16,1981993-94 8,989 .. .. 2,621 4,063 15,6741994-95 14,576 .. .. 3,757 4,041 22,3731995-96 10,339 .. .. 3,803 5,045 19,1871996-97 11,687 .. .. 3,431 4,429 19,5481997-98 22,354 .. .. 4,929 6,110 33,3921998-99 30,176 .. .. 5,440 7,236 42,8521999-00 24,424 .. .. 5,951 9,313 39,6882000-01 27,610 .. .. 5,124 12,056 44,7902001-02 29,108 .. 593 5,128 17,486 52,3142002-03 29,270 .. 1,421 5,485 22,739 58,9152003-04 29,933 .. 2,702 7,564 33,247 73,4462004-05 37,409 .. 12,407 7,607 51,310 108,7332005-06 47,594 .. 16,023 5,889 67,967 137,4742006-07 56,473 .. 23,976 7,988 80,393 168,8302007-08 66,939 .. 43,941 5,931 94,749 211,5612008-09 75,139 .. 41,626 5,579 110,666 233,0102009-10 P 48,987 .. 28,641 3,530 85,177 166,335.. : not Available P : Provisional (Jul-Mar) Source : i) State Bank of Pakistanb : Punjab Provincial Corporative Bank Ltd. ii) Ministry of Food, Agriculture & Livestocka : Zarai Taraqiate Bank Limited, formerly Agriculture Development Bank of Pakistan
CREDIT DISBURSED BY AGENCIES
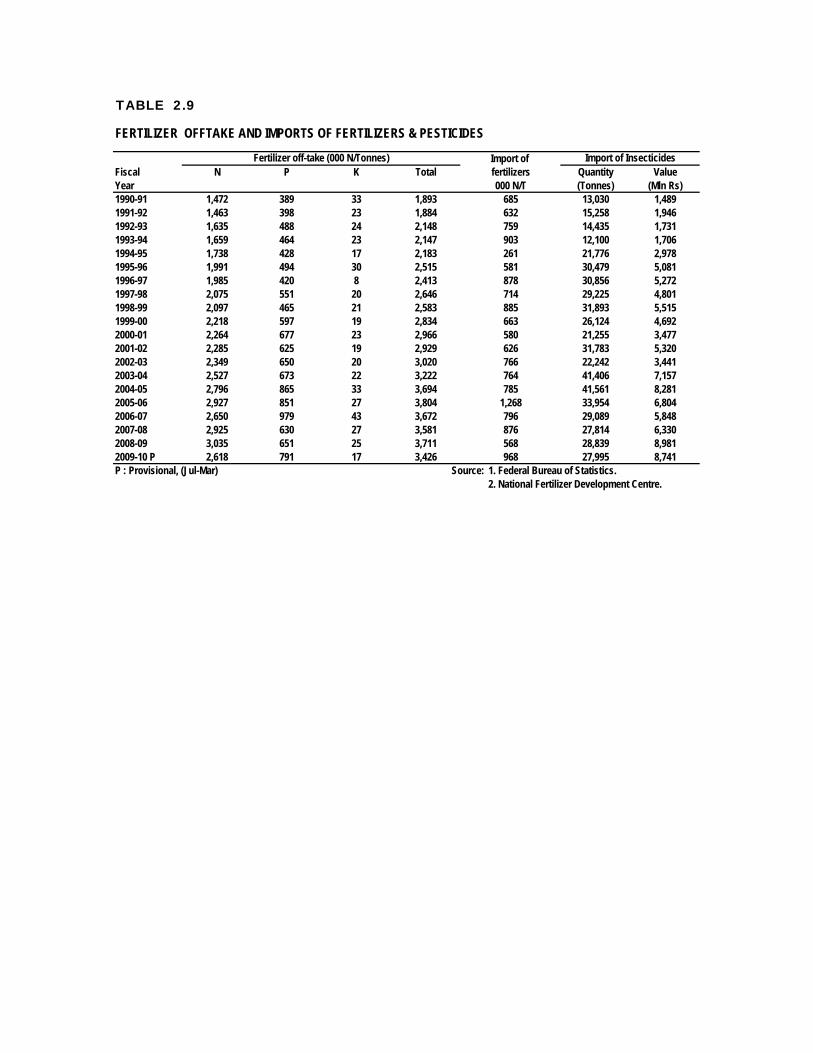
TABLE 2.9
FERTILIZER OFFTAKE AND IMPORTS OF FERTILIZERS & PESTICIDES
Import of Fiscal N P K Total fertilizers Quantity ValueYear 000 N/T (Tonnes) (Mln Rs)1990-91 1,472 389 33 1,893 685 13,030 1,4891991-92 1,463 398 23 1,884 632 15,258 1,9461992-93 1,635 488 24 2,148 759 14,435 1,7311993-94 1,659 464 23 2,147 903 12,100 1,7061994-95 1,738 428 17 2,183 261 21,776 2,9781995-96 1,991 494 30 2,515 581 30,479 5,0811996-97 1,985 420 8 2,413 878 30,856 5,2721997-98 2,075 551 20 2,646 714 29,225 4,8011998-99 2,097 465 21 2,583 885 31,893 5,5151999-00 2,218 597 19 2,834 663 26,124 4,6922000-01 2,264 677 23 2,966 580 21,255 3,4772001-02 2,285 625 19 2,929 626 31,783 5,3202002-03 2,349 650 20 3,020 766 22,242 3,4412003-04 2,527 673 22 3,222 764 41,406 7,1572004-05 2,796 865 33 3,694 785 41,561 8,2812005-06 2,927 851 27 3,804 1,268 33,954 6,8042006-07 2,650 979 43 3,672 796 29,089 5,8482007-08 2,925 630 27 3,581 876 27,814 6,3302008-09 3,035 651 25 3,711 568 28,839 8,9812009-10 P 2,618 791 17 3,426 968 27,995 8,741P : Provisional, (Jul-Mar) Source: 1. Federal Bureau of Statistics.
2. National Fertilizer Development Centre.
Import of InsecticidesFertilizer off-take (000 N/Tonnes)
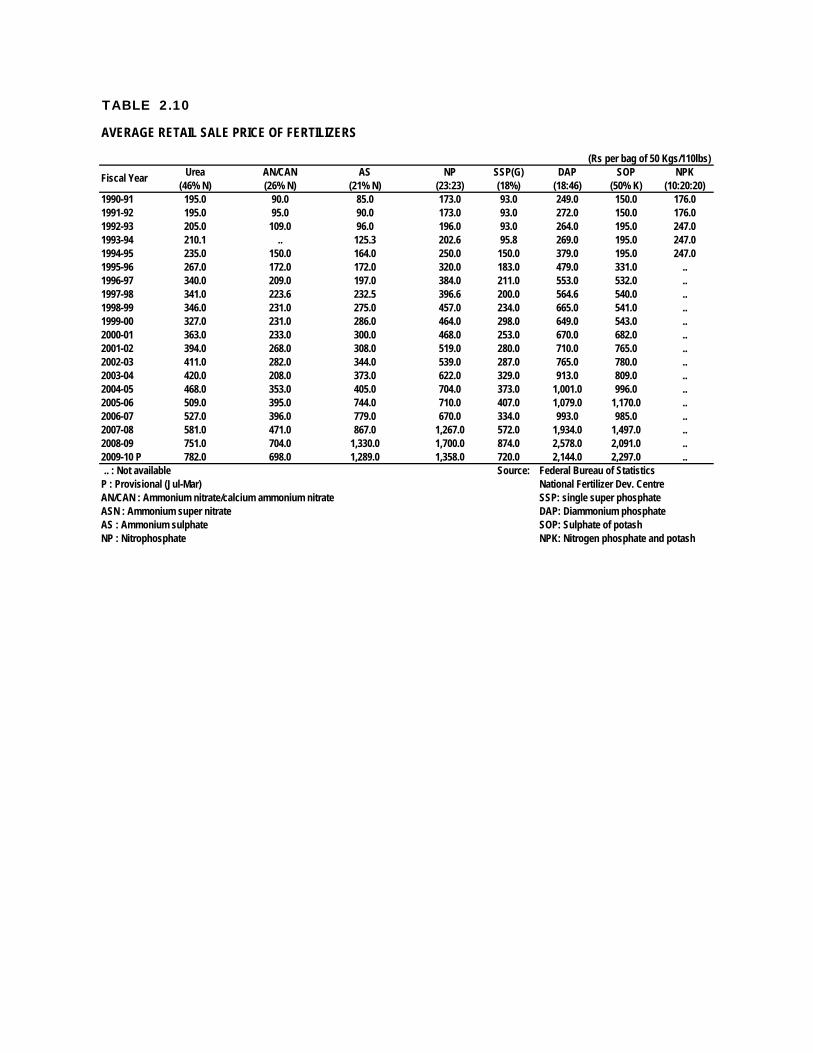
TABLE 2.10
(Rs per bag of 50 Kgs/110lbs)Urea AN/CAN AS NP SSP(G) DAP SOP NPK
(46% N) (26% N) (21% N) (23:23) (18%) (18:46) (50% K) (10:20:20)1990-91 195.0 90.0 85.0 173.0 93.0 249.0 150.0 176.01991-92 195.0 95.0 90.0 173.0 93.0 272.0 150.0 176.01992-93 205.0 109.0 96.0 196.0 93.0 264.0 195.0 247.01993-94 210.1 .. 125.3 202.6 95.8 269.0 195.0 247.01994-95 235.0 150.0 164.0 250.0 150.0 379.0 195.0 247.01995-96 267.0 172.0 172.0 320.0 183.0 479.0 331.0 ..1996-97 340.0 209.0 197.0 384.0 211.0 553.0 532.0 ..1997-98 341.0 223.6 232.5 396.6 200.0 564.6 540.0 ..1998-99 346.0 231.0 275.0 457.0 234.0 665.0 541.0 ..1999-00 327.0 231.0 286.0 464.0 298.0 649.0 543.0 ..2000-01 363.0 233.0 300.0 468.0 253.0 670.0 682.0 ..2001-02 394.0 268.0 308.0 519.0 280.0 710.0 765.0 ..2002-03 411.0 282.0 344.0 539.0 287.0 765.0 780.0 ..2003-04 420.0 208.0 373.0 622.0 329.0 913.0 809.0 ..2004-05 468.0 353.0 405.0 704.0 373.0 1,001.0 996.0 ..2005-06 509.0 395.0 744.0 710.0 407.0 1,079.0 1,170.0 ..2006-07 527.0 396.0 779.0 670.0 334.0 993.0 985.0 ..2007-08 581.0 471.0 867.0 1,267.0 572.0 1,934.0 1,497.0 ..2008-09 751.0 704.0 1,330.0 1,700.0 874.0 2,578.0 2,091.0 ..2009-10 P 782.0 698.0 1,289.0 1,358.0 720.0 2,144.0 2,297.0 .... : Not available Source: Federal Bureau of Statistics
P : Provisional (Jul-Mar) National Fertilizer Dev. CentreAN/CAN : Ammonium nitrate/calcium ammonium nitrate SSP: single super phosphateASN : Ammonium super nitrate DAP: Diammonium phosphateAS : Ammonium sulphate SOP: Sulphate of potashNP : Nitrophosphate NPK: Nitrogen phosphate and potash
AVERAGE RETAIL SALE PRICE OF FERTILIZERS
Fiscal Year
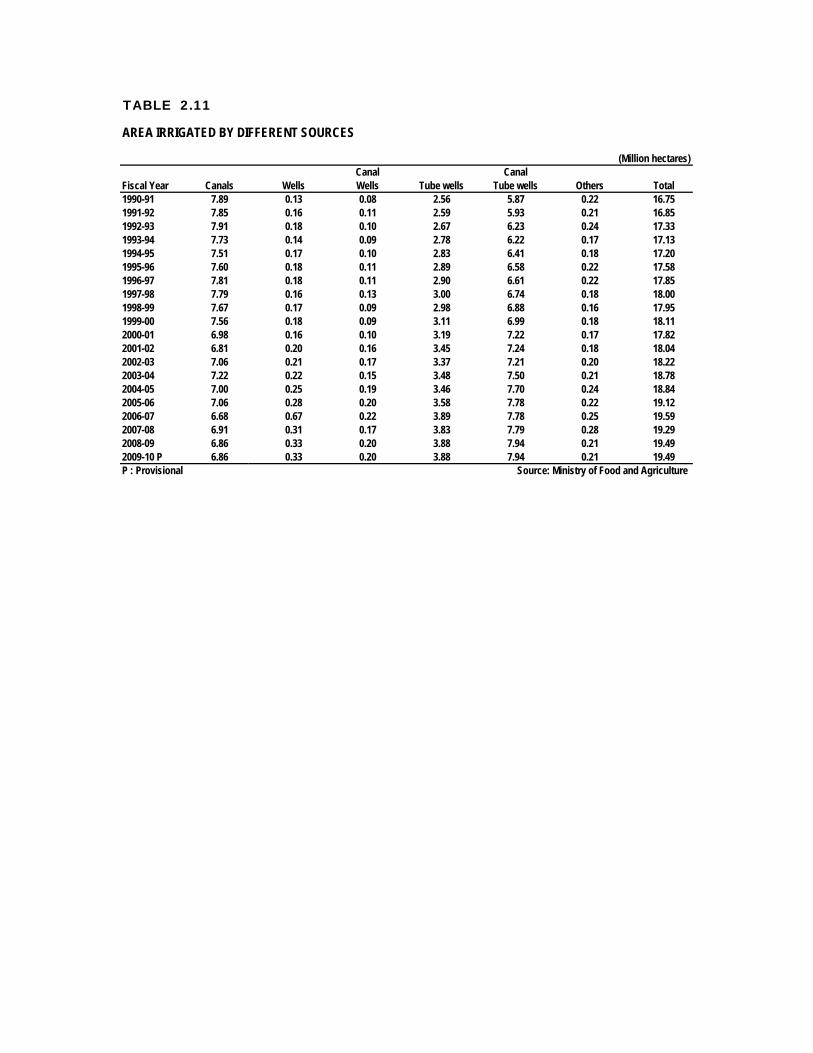
TABLE 2.11
(Million hectares)Canal Canal
Fiscal Year Canals Wells Wells Tube wells Tube wells Others Total1990-91 7.89 0.13 0.08 2.56 5.87 0.22 16.751991-92 7.85 0.16 0.11 2.59 5.93 0.21 16.851992-93 7.91 0.18 0.10 2.67 6.23 0.24 17.331993-94 7.73 0.14 0.09 2.78 6.22 0.17 17.131994-95 7.51 0.17 0.10 2.83 6.41 0.18 17.201995-96 7.60 0.18 0.11 2.89 6.58 0.22 17.581996-97 7.81 0.18 0.11 2.90 6.61 0.22 17.851997-98 7.79 0.16 0.13 3.00 6.74 0.18 18.001998-99 7.67 0.17 0.09 2.98 6.88 0.16 17.951999-00 7.56 0.18 0.09 3.11 6.99 0.18 18.112000-01 6.98 0.16 0.10 3.19 7.22 0.17 17.822001-02 6.81 0.20 0.16 3.45 7.24 0.18 18.042002-03 7.06 0.21 0.17 3.37 7.21 0.20 18.222003-04 7.22 0.22 0.15 3.48 7.50 0.21 18.782004-05 7.00 0.25 0.19 3.46 7.70 0.24 18.842005-06 7.06 0.28 0.20 3.58 7.78 0.22 19.122006-07 6.68 0.67 0.22 3.89 7.78 0.25 19.592007-08 6.91 0.31 0.17 3.83 7.79 0.28 19.292008-09 6.86 0.33 0.20 3.88 7.94 0.21 19.492009-10 P 6.86 0.33 0.20 3.88 7.94 0.21 19.49P : Provisional Source: Ministry of Food and Agriculture
AREA IRRIGATED BY DIFFERENT SOURCES
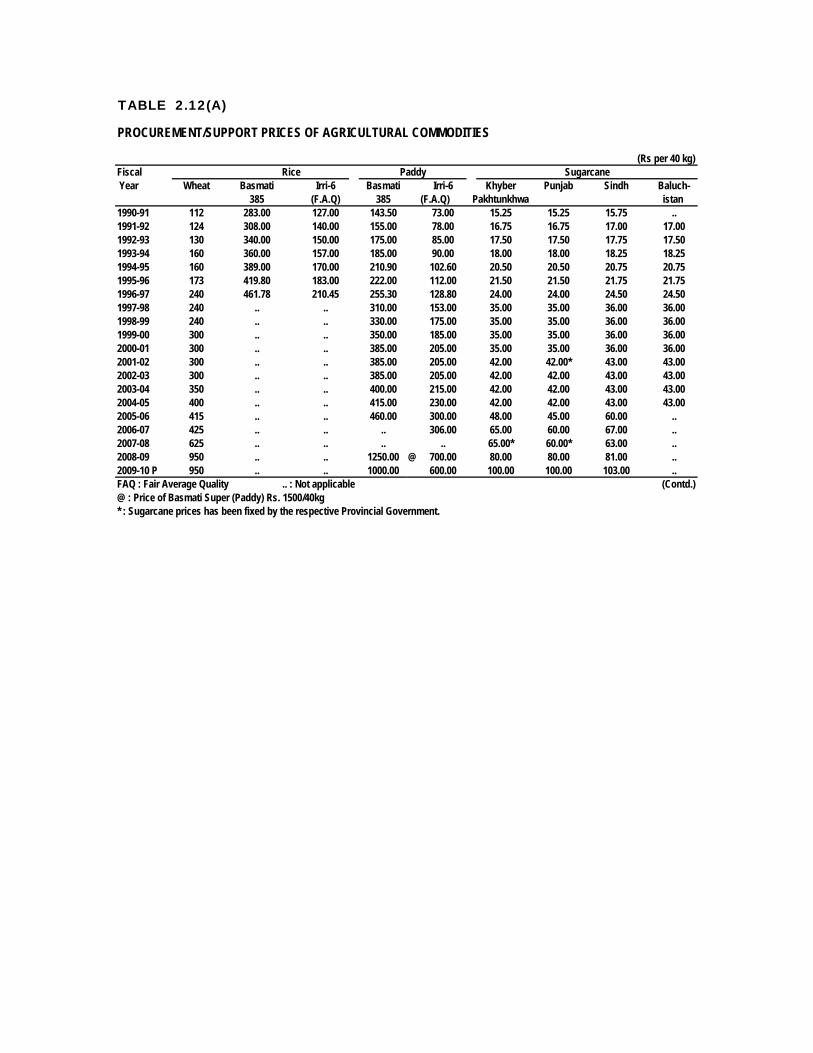
TABLE 2.12(A)
(Rs per 40 kg)Fiscal Rice Paddy SugarcaneYear Wheat Basmati Irri-6 Basmati Irri-6 Khyber Punjab Sindh Baluch-
385 (F.A.Q) 385 (F.A.Q) Pakhtunkhwa istan 1990-91 112 283.00 127.00 143.50 73.00 15.25 15.25 15.75 ..1991-92 124 308.00 140.00 155.00 78.00 16.75 16.75 17.00 17.001992-93 130 340.00 150.00 175.00 85.00 17.50 17.50 17.75 17.501993-94 160 360.00 157.00 185.00 90.00 18.00 18.00 18.25 18.251994-95 160 389.00 170.00 210.90 102.60 20.50 20.50 20.75 20.751995-96 173 419.80 183.00 222.00 112.00 21.50 21.50 21.75 21.751996-97 240 461.78 210.45 255.30 128.80 24.00 24.00 24.50 24.501997-98 240 .. .. 310.00 153.00 35.00 35.00 36.00 36.001998-99 240 .. .. 330.00 175.00 35.00 35.00 36.00 36.001999-00 300 .. .. 350.00 185.00 35.00 35.00 36.00 36.002000-01 300 .. .. 385.00 205.00 35.00 35.00 36.00 36.002001-02 300 .. .. 385.00 205.00 42.00 42.00* 43.00 43.002002-03 300 .. .. 385.00 205.00 42.00 42.00 43.00 43.002003-04 350 .. .. 400.00 215.00 42.00 42.00 43.00 43.002004-05 400 .. .. 415.00 230.00 42.00 42.00 43.00 43.002005-06 415 .. .. 460.00 300.00 48.00 45.00 60.00 ..2006-07 425 .. .. .. 306.00 65.00 60.00 67.00 ..2007-08 625 .. .. .. .. 65.00* 60.00* 63.00 ..2008-09 950 .. .. 1250.00 @ 700.00 80.00 80.00 81.00 ..2009-10 P 950 .. .. 1000.00 600.00 100.00 100.00 103.00 ..FAQ : Fair Average Quality .. : Not applicable (Contd.)@ : Price of Basmati Super (Paddy) Rs. 1500/40kg * : Sugarcane prices has been fixed by the respective Provincial Government.
PROCUREMENT/SUPPORT PRICES OF AGRICULTURAL COMMODITIES
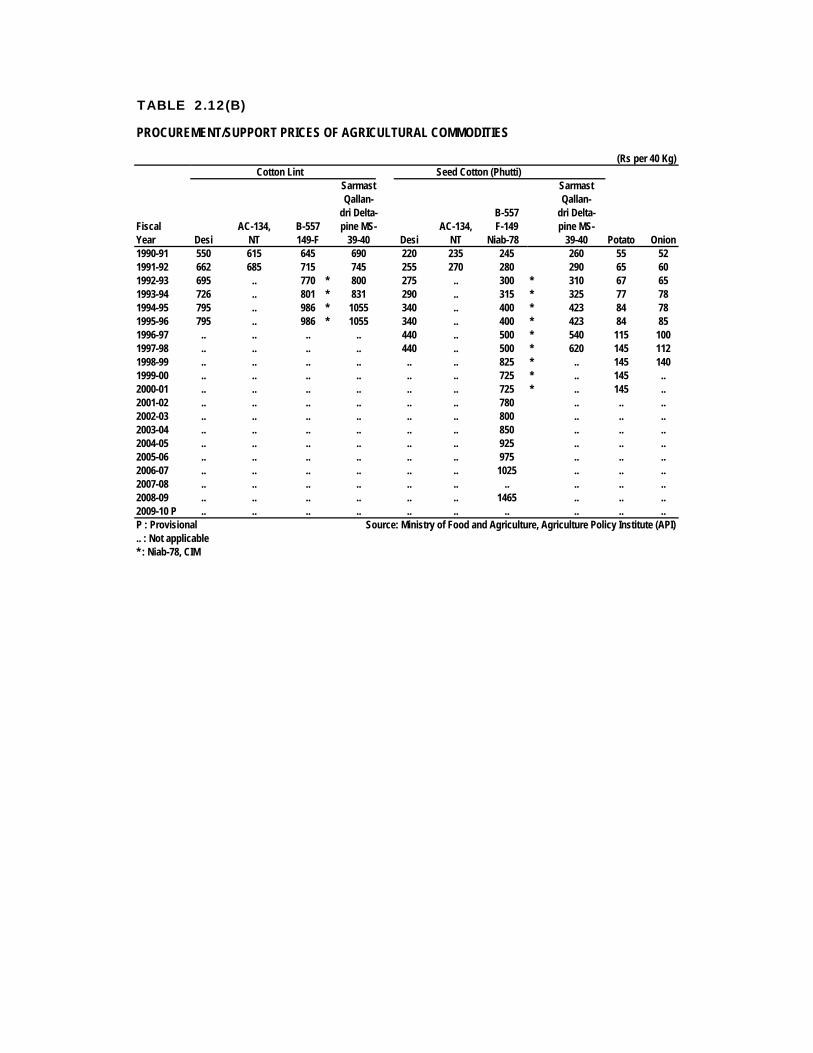
TABLE 2.12(B)
(Rs per 40 Kg)Cotton Lint Seed Cotton (Phutti)
Sarmast SarmastQallan- Qallan-
dri Delta- B-557 dri Delta-Fiscal AC-134, B-557 pine MS- AC-134, F-149 pine MS-Year Desi NT 149-F 39-40 Desi NT Niab-78 39-40 Potato Onion1990-91 550 615 645 690 220 235 245 260 55 521991-92 662 685 715 745 255 270 280 290 65 601992-93 695 .. 770 * 800 275 .. 300 * 310 67 651993-94 726 .. 801 * 831 290 .. 315 * 325 77 781994-95 795 .. 986 * 1055 340 .. 400 * 423 84 781995-96 795 .. 986 * 1055 340 .. 400 * 423 84 851996-97 .. .. .. .. 440 .. 500 * 540 115 1001997-98 .. .. .. .. 440 .. 500 * 620 145 1121998-99 .. .. .. .. .. .. 825 * .. 145 1401999-00 .. .. .. .. .. .. 725 * .. 145 ..2000-01 .. .. .. .. .. .. 725 * .. 145 ..2001-02 .. .. .. .. .. .. 780 .. .. ..2002-03 .. .. .. .. .. .. 800 .. .. ..2003-04 .. .. .. .. .. .. 850 .. .. ..2004-05 .. .. .. .. .. .. 925 .. .. ..2005-06 .. .. .. .. .. .. 975 .. .. ..2006-07 .. .. .. .. .. .. 1025 .. .. ..2007-08 .. .. .. .. .. .. .. .. .. ..2008-09 .. .. .. .. .. .. 1465 .. .. ..2009-10 P .. .. .. .. .. .. .. .. .. ..P : Provisional Source: Ministry of Food and Agriculture, Agriculture Policy Institute (API).. : Not applicable* : Niab-78, CIM
PROCUREMENT/SUPPORT PRICES OF AGRICULTURAL COMMODITIES

TABLE 2.13
(000 tonnes)Wheat (May-April) Rice Procured Stocks Balance (on 1st July)
Fiscal Procure- Releases Stocks Basmati Others Basmati OthersYear ment1990-91 3,159.0 5,608.0 1,508.0 142.7 673.8 719.3 117.51991-92 3,249.0 5,431.0 1,000.0 121.6 370.3 486.8 314.71992-93 4,120.0 5,143.0 505.0 500.5 454.0 285.2 540.51993-94 3,644.0 5,982.0 1,007.0 144.9 681.4 224.8 541.21994-95 3,740.0 5,999.0 776.0 284.0 .. 236.4 848.51995-96 3,448.0 5,139.0 385.0 50.8 154.6 494.3 117.71996-97 2,725.0 5,987.0 456.0 .. .. 159.4 187.91997-98 3,984.0 5,794.0 902.0 .. .. .. ..1998-99 4,070.0 6,165.0 981.0 .. .. .. ..1999-00 8,582.0 6,131.0 702.0 .. .. .. ..2000-01 4,081.0 5,537.0 3,552.0 .. .. .. ..2001-02 4,045.0 3,376.0 3,683.0 .. .. .. ..2002-03 3,514.0 5,130.0 992.0 .. .. .. ..2003-04 3,456.0 4,104.0 161.0 .. .. .. ..2004-05 3,939.0 4,500.0 350.0 .. .. .. ..2005-06 4,514.0 2,088.0 2,107.0 .. .. .. ..2006-07 4,422.0 5,985.4 499.1 .. .. .. ..2007-08 3,917.0 6,357.9 136.9 .. .. .. ..2008-09 9,231.0 5,784.4 821.9 .. .. .. ..2009-10 P 4,788.1 @ 5,984.7 4,223.0 * .. .. .. .... : not available P : Provisional Source: Ministry of Food and Agriculture * : as on 1st May, 2010@ : upto 10th May 2010 (2009-10 Crop)
PROCUREMENT, RELEASES AND STOCKS OF WHEAT AND RICE

TABLE 2.14
(million numbers)
Fiscal Year Buffaloes Cattle Goats Sheep Poultry Camels Asses Horses Mules
1990-91 17.8 17.7 37.0 26.3 146.9 1.1 3.5 0.4 0.11991-92 18.3 17.7 38.7 27.4 156.2 1.1 3.8 0.5 0.11992-93 18.7 17.8 40.2 27.7 182.6 1.1 3.8 0.4 0.11993-94 19.2 17.8 42.0 28.3 250.0 1.1 3.9 0.4 0.11994-95 19.7 17.8 43.8 29.1 318.8 1.1 4.0 0.4 0.11995-96 20.3 20.4 41.2 23.5 350.0 0.8 3.6 0.3 0.11996-97 20.8 20.8 42.6 23.7 382.0 0.8 3.6 0.3 0.11997-98 21.4 21.2 44.2 23.8 276.0 0.8 3.2 0.3 0.11998-99 22.0 21.6 45.8 23.9 278.0 0.8 3.8 0.3 0.11999-00 22.7 22.0 47.4 24.1 282.0 0.8 3.8 0.3 0.22000-01 23.3 22.4 49.1 24.2 292.4 0.8 3.9 0.3 0.22001-02 24.0 22.8 50.9 24.4 330.0 0.8 3.9 0.3 0.22002-03 24.8 23.3 52.8 24.6 346.1 0.8 4.1 0.3 0.22003-04 25.5 23.8 54.7 24.7 352.6 0.7 4.1 0.3 0.22004-05 26.3 24.2 56.7 24.9 372.0 0.7 4.2 0.3 0.32005-06 * 27.3 29.6 53.8 26.5 433.8 0.9 4.3 0.3 0.22006-07 @ 28.2 30.7 55.2 26.8 477.0 0.9 4.3 0.3 0.22007-08 29.0 31.8 56.7 27.1 518.0 1.0 4.4 0.3 0.22008-09 29.9 33.0 58.3 27.4 562.0 1.0 4.5 0.4 0.22009-10 30.8 34.3 59.9 27.8 610.0 1.0 4.6 0.4 0.2
Source: Ministry of Livestock & Dairy Development.* : Population figures are actual figures of Livestock Census 2006@ : From 2006-07 onward figures estimates are based on Inter census growth rate of livestock census 1996 & 2006
LIVESTOCK POPULATION
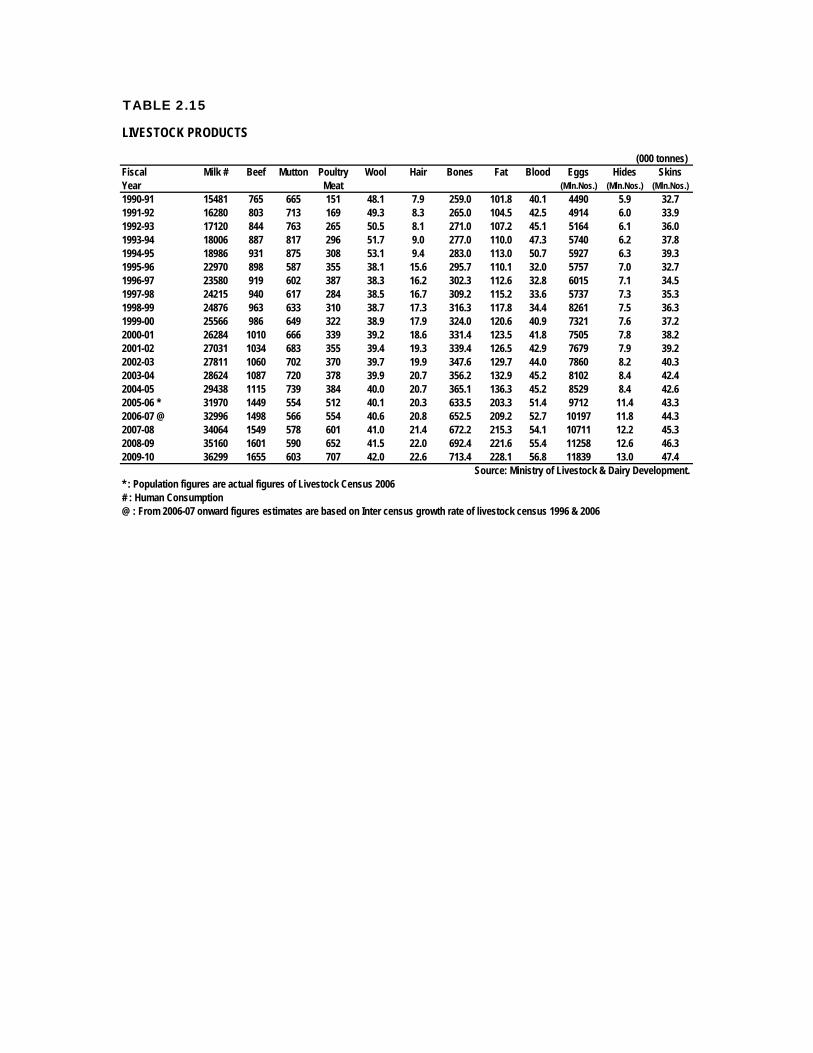
TABLE 2.15
(000 tonnes)Fiscal Milk # Beef Mutton Poultry Wool Hair Bones Fat Blood Eggs Hides SkinsYear Meat (Mln.Nos.) (Mln.Nos.) (Mln.Nos.)1990-91 15481 765 665 151 48.1 7.9 259.0 101.8 40.1 4490 5.9 32.71991-92 16280 803 713 169 49.3 8.3 265.0 104.5 42.5 4914 6.0 33.91992-93 17120 844 763 265 50.5 8.1 271.0 107.2 45.1 5164 6.1 36.01993-94 18006 887 817 296 51.7 9.0 277.0 110.0 47.3 5740 6.2 37.81994-95 18986 931 875 308 53.1 9.4 283.0 113.0 50.7 5927 6.3 39.31995-96 22970 898 587 355 38.1 15.6 295.7 110.1 32.0 5757 7.0 32.71996-97 23580 919 602 387 38.3 16.2 302.3 112.6 32.8 6015 7.1 34.51997-98 24215 940 617 284 38.5 16.7 309.2 115.2 33.6 5737 7.3 35.31998-99 24876 963 633 310 38.7 17.3 316.3 117.8 34.4 8261 7.5 36.31999-00 25566 986 649 322 38.9 17.9 324.0 120.6 40.9 7321 7.6 37.22000-01 26284 1010 666 339 39.2 18.6 331.4 123.5 41.8 7505 7.8 38.22001-02 27031 1034 683 355 39.4 19.3 339.4 126.5 42.9 7679 7.9 39.22002-03 27811 1060 702 370 39.7 19.9 347.6 129.7 44.0 7860 8.2 40.32003-04 28624 1087 720 378 39.9 20.7 356.2 132.9 45.2 8102 8.4 42.42004-05 29438 1115 739 384 40.0 20.7 365.1 136.3 45.2 8529 8.4 42.62005-06 * 31970 1449 554 512 40.1 20.3 633.5 203.3 51.4 9712 11.4 43.32006-07 @ 32996 1498 566 554 40.6 20.8 652.5 209.2 52.7 10197 11.8 44.32007-08 34064 1549 578 601 41.0 21.4 672.2 215.3 54.1 10711 12.2 45.32008-09 35160 1601 590 652 41.5 22.0 692.4 221.6 55.4 11258 12.6 46.32009-10 36299 1655 603 707 42.0 22.6 713.4 228.1 56.8 11839 13.0 47.4
Source: Ministry of Livestock & Dairy Development.* : Population figures are actual figures of Livestock Census 2006# : Human Consumption@ : From 2006-07 onward figures estimates are based on Inter census growth rate of livestock census 1996 & 2006
LIVESTOCK PRODUCTS