agriculture, technology, and conflict a thesis cody …
TRANSCRIPT

AGRICULTURE, TECHNOLOGY, AND CONFLICT
A Thesis
by
CODY JOHN ZILVERBERG
Submitted to the Office of Graduate Studies of Texas A&M University
in partial fulfillment of the requirements for the degree of
MASTER OF SCIENCE
May 2007
Major Subject: Agricultural Economics

AGRICULTURE, TECHNOLOGY, AND CONFLICT
A Thesis
by
CODY JOHN ZILVERBERG
Submitted to the Office of Graduate Studies of Texas A&M University
in partial fulfillment of the requirements for the degree of
MASTER OF SCIENCE
Approved by: Co-Chairs of Committee, Edwin Price Richard Woodward Committee Member, Cecilia Giusti Head of Department, John Nichols
May 2007
Major Subject: Agricultural Economics

iii
ABSTRACT
Agriculture, Technology, and Conflict. (May 2007)
Cody John Zilverberg, B.A., St. John’s University
Co-Chairs of Advisory Committee: Dr. Edwin Price Dr. Richard Woodward Conflict and agriculture have a long, shared history. The purpose of this research
is to look at the relationships between agriculture, agricultural technologies, and conflict
during current and recent conflicts, large scale and localized. Agriculture and its related
technologies are often affected by conflict, but rarely acknowledged as a cause or
solution to conflict. Literature reviews in six topic areas illustrate various facets of the
relationship between agriculture and conflict.
Research conducted in Santa Cruz del Quiché, Guatemala illustrates the ways
farmers were impacted by the country’s civil war. It also examines farmer survival
strategies during the war, and reveals the presence of minor localized conflict over water
resources. Conflict over land is not a major concern at present. Market access for inputs
and outputs are shown to have been a problem for a number of farmers during the civil
war. The poverty of Santa Cruz farmers indicates that much could be gained by rural
development. Research is unable to support the hypotheses that agricultural technologies
have prevented or caused conflict in Santa Cruz del Quiché, or that they have played a
large role in recovery from the country’s civil war.
The author recommends that future research be undertaken in regions with a
diverse set of agricultural technologies, and/or a recent history of significant
iv
technological change in agriculture. Policy recommendations include providing secure
access to markets during war time, increasing capacity for home-based rural production,
and continuing research into resilient crops. Finally, the author suggests that the
responsible decision to develop, adopt, or introduce an agricultural technology must take
into account the social consequences of that decision, including how the new technology
may alleviate or contribute to conflict.
v
ACKNOWLEDGEMENTS
I would like to thank Hector, Angélica, Juan Carlos, Maria Isabel, Francisca,
Lucía, and everybody at Acción Cultural Guatemalteca for their assistance in carrying out
this research. Thank you to Domhnall and Myriam for their hospitality, and to my
advisors and everyone at the Borlaug Institute for their support and advice. Finally, I
would like to thank Wesley for her loving support and understanding throughout the
entire process.

vi
NOMENCLATURE
ACG Acción Cultural Guatemalteca (Guatemalan Cultural Action)
CEH Comisión para Esclarecimiento Histórico (Commission for
Historical Clarification)
CGIAR Consultative Group on International Agricultural Research
CIIDH Centro Internacional para Investigaciones en Derechos Humanos
(International Center for Human Rights Research)
CPR Comunidad de Población en Resistencia (Community in Resistance)
departamento A Guatemalan political unit similar to a U.S. state
municipio A Guatemalan political unit similar to a U.S. county
PCA Principal Components Analysis

vii
TABLE OF CONTENTS
Page
ABSTRACT................................................................................................... iii
ACKNOWLEDGEMENTS........................................................................... v
NOMENCLATURE ...................................................................................... vi
TABLE OF CONTENTS............................................................................... vii
LIST OF TABLES......................................................................................... ix
LIST OF FIGURES ....................................................................................... x
CHAPTER
I INTRODUCTION ................................................................. 1
II METHODOLOGY ................................................................ 3
A. Definition of Terms............................................... 3 B. Choice of Research Location ................................ 4 C. The Questionnaire ................................................. 4 D. Data Collection ..................................................... 7 E. Statistical Methods ................................................ 9 III REGIONAL HISTORY AND GEOGRAPHY ..................... 15
A. From Pre-Conquest to Early Independence .......... 15 B. Bananas and Conflict ............................................ 16 C. Recent Conflict...................................................... 19 D. Santa Cruz del Quiché........................................... 20 IV CONFLICT AND AGRICULTURE ..................................... 25
A. Conflict’s Impact on Agriculture .......................... 25 B. Natural Resources as Sources of Conflict ............. 37 C. Agriculture, Technology, and Survival Strategies During Conflict ................................................. 46 D. Agricultural Technology in Conflict Reduction and Prevention .................................................. 60 E. Agricultural Technology as a Cause of Conflict ... 71 F. Agricultural Technology and Recovery from Conflict ............................................................. 85

viii
CHAPTER Page
V CONCLUSIONS AND RECOMMENDATIONS ................ 98
A. Introduction........................................................... 98 B. Important Findings and Recommendations........... 98 C. Implications for Future Research .......................... 103 REFERENCES .............................................................................................. 105
APPENDIX A ENGLISH VERSION QUESTIONNAIRE ......................... 115
APPENDIX B SPANISH VERSION QUESTIONNAIRE.......................... 128
APPENDIX C REGRESSION RESULTS ................................................... 141
VITA.............................................................................................................. 144

ix
LIST OF TABLES
Page
Table 1. Total variance explained, conflict index......................................... 12
Table 2. Principal component values, conflict index.................................... 12
Table 3. Total variance explained, crime index............................................ 13
Table 4. Principal component values, crime index ....................................... 14
Table 5. Selected impacts of the civil war upon farm families..................... 32
Table 6. Perception that water and land are sources of conflict ................... 43
Table 7. Response to the civil war ................................................................ 54
Table 8. All reported impacts of the civil war upon farm families............... 55
Table 9. People who reported no change to agricultural practices ............... 57
Table 10. Perception that technologies resolved or prevent conflict ............ 67
Table 11. Parameter estimates with dependent variable: Conflict index...... 80
Table 12. Parameter estimates with dependent variable: Crime index......... 81
Table 13. Correlations................................................................................... 82
Table 14. Parameter estimates with dependent variable: Binary fertilizer type 93
Table 15. Performance of binary fertilizer type model................................. 93
Table 16. Conflict between people who speak different languages.............. 95

x
LIST OF FIGURES
Page
Figure 1. Conflict’s impact on agriculture.................................................... 30
Figure 2. Population increase and resulting “unmet demand” for resources 40
Figure 3. Natural resource conflict ............................................................... 41
Figure 4. Conflict survival strategies ............................................................ 51
Figure 5. Labor intensity of different crops .................................................. 52
Figure 6. Technological change reduces conflict and terrorism................... 61
Figure 7. Conflict increase/decrease as a result of technological change..... 64
Figure 8. Rwanda’s total merchandise exports and coffee exports .............. 69
Figure 9. World coffee price and Rwandan conflict intensity ...................... 70
Figure 10. Change in agricultural technology as a result of conflict ............ 89
Figure 11. Pessimistic view of future conflict .............................................. 97

1
CHAPTER I
INTRODUCTION
Conflict has surely existed since humanity came into being, and when agriculture
entered the scene, it was quickly caught up in conflict as well. The book of Genesis
describes the creation of the world in chapters one and two, records the first human
conflict in chapter three when “gatherers” Adam and Eve eat of the forbidden fruit, and
records the first instances of agriculture and agriculture-related conflict in chapter four.
Whether historical or mythological, this biblical story demonstrates the long, shared
history of agriculture and conflict.
Much has changed in the practice of agriculture and conflict since Biblical times,
but the purpose of this research is not to provide a history of conflict and agriculture.
Rather, it is to look at the relationship between the two in current and recent conflicts,
paying special attention to the role played by agricultural technologies. Natural
resources, especially land and water, are an important part of the interaction because
their control is necessary for agricultural production.
Agriculture is often affected by conflict, but rarely acknowledged as a primary
cause of conflict. Consequently, in order to resolve conflict, leaders tend to look for
political solutions and overlook technical ones. While this is the correct approach for
many situations, there are others where a more appropriate response would be to
combine political efforts with a recognition of the role that technology may have had in
causing the conflict and/or the role that technology may play in resolving the conflict.
This thesis follows the format of the American Journal of Agricultural Economics.

2
The investigation into this topic continues with an explanation of the methods
that were used to conduct field research in Guatemala and the statistical tools used to
analyze the data that was collected (Chapter II), followed by a brief history of Guatemala
and the communities where the research was conducted, with special emphasis placed on
agriculture and conflict (Chapter III). Together, these two chapters provide the
background for understanding the rest of the study. The next chapter (Chapter IV) is
divided into six sections, each focusing on a particular relationship between agriculture
and conflict. Each of the sections begins with a literature review and a general
conceptual model. They are followed by one or more hypotheses specific to Santa Cruz
del Quiché, Guatemala, and the methodology used to test the specific hypotheses. Each
section concludes with the results of the tested hypotheses and a discussion of the topic.
The final chapter (Chapter V) includes conclusions and recommendations. The
bibliography and appendices follow.
3
CHAPTER II
METHODOLOGY
A. Definition of Terms
It is necessary to explain what is meant by the words technology and conflict.
For this research, both terms will be defined very broadly. The first two definitions of
conflict given by The American Heritage College Dictionary (1993) are “A state of
open, often prolonged fighting; a battle or war” and “A state of disharmony between
incompatible or antithetical persons, ideas, or interests; a clash.” Throughout this
research, conflict will be understood to include both of these definitions, meaning
anything from interstate and intrastate war, to community-level conflict and domestic
disputes. Conflict does not imply violence, although violence may reveal the presence
of conflict. Conflict may not manifest itself in violence when it is resolved by local
authorities or traditional conflict resolution methods, or when it goes unresolved but
remains at the level of tension without producing violence.
Technology is the “application of science” (The American Heritage College
Dictionary, 1993). Thus, technology should not be understood as merely physical tools
or machines. Using a mechanical tractor for turning the earth is an easily recognized
agricultural technology, as is the use of chemical fertilizers, herbicides, and insecticides.
However, the application of technology is not always focused upon physical tools.
Other examples of technology are the use of integrated pest management, crop rotation,
and improved seeds. Tools, machines, and ideas do not need to be considered
“advanced” in order to be technology. Thus, the use of a hoe or a plough are both
4
technologies for working the soil. This does not mean that these very different
technologies should be considered “equal.” On the contrary, we must look at
technologies from many perspectives in order to discern and differentiate their true
natures and the consequences of their use.
B. Choice of Research Location
Research was conducted in the municipio of Santa Cruz, located in the
departamento of Quiché, Guatemala. A municipio is a Guatemalan political unit similar
to a U.S. county, and a departamento is similar to a U.S. state. This site was chosen
because of its long history of conflict, including a recent thirty-six year civil war, as well
as the important role played by agriculture in the local economy and the livelihood of its
residents. A detailed description of the area is included in Chapter III.
C. The Questionnaire
A number of methods for gathering data related to the topic of this research are
available. Among them are surveys, the use of focus groups, interviews with key
persons within communities, and the use of secondary data. Recognizing that none of
these approaches is perfect, a survey was selected as the method of gathering data. The
survey format was chosen to allow for the collection of data from a large number of
respondents from a given geographic area over a short time period. Face to face
interviews permit lengthy questionnaires and allow the participation of illiterate persons,
both of which were concerns for this research. The survey format also allowed for

5
private conversations about sensitive subjects such as the civil war. Police records were
considered as a source of complementary, secondary data, but were not pursued because
of concerns regarding their reliability and accessibility.
The research questionnaire combined seventy-one questions covering the
following topics: demographics such as age, gender, and education; agricultural
practices; agricultural technology use; interaction between agricultural practices and
conflict; perceptions of conflict; and perceptions of crime. A summary of the questions
is provided at the end of this section and a complete version of the questionnaire is
included in the appendix.
An initial questionnaire was developed in Spanish and used to conduct five
interviews in July, 2006. Based on the results, questions were revised, added, and
removed before finalizing the questionnaire for use in August, 2006. Many questions
were open-ended, leaving respondents freedom to interpret the questions. Follow up
questions were permitted. All questions were asked orally and the interviewer recorded
answers by hand. Oral interviews rather than written surveys were conducted because
most respondents were illiterate. Interviews were not tape-recorded in order to preserve
the respondents’ anonymity.
For questions that had a limited, discrete set of probable answers, answers were
printed on the questionnaire form. This allowed the interviewers to check the
corresponding box, rather than write every answer by hand. However, answers were not
limited to the pre-printed choices -- interviewees were allowed to respond in the way
they felt most appropriate. If the interviewee’s answer was not listed, the interviewer
6
recorded it in the space provided. The duration of the interviews ranged from less than
half an hour to two hours, according to the depth with which the person responded to the
open-ended questions.
The first twenty-two questions were demographic in nature. Among the data
recorded were: community, gender, age group, marital status, education, family size,
native language, religion, occupation, income, materials used in home construction,
technology use, and amount of land owned.
These were followed by questions that asked for the respondents’ perceptions of
their land’s productivity and detailed descriptions of their agricultural practices, recorded
on a plot-by-plot basis. The record of the agricultural practices focused on the
technologies used and the processes undertaken at different periods, from land
preparation to harvest and storage.
The number of domestic animals owned by the family was recorded. For each
type of animal, the technologies used in the care of the animal were recorded. For
example, vaccination and a chicken house were two technologies commonly used in
raising chickens.
After detailed explanations of the raising of crops and the care of domestic
animals, respondents were asked several questions regarding the changes that had
occurred in their farming practices, as well as the communities’ reactions to these
changes. These questions were followed by questions that address the issue of conflict
more directly, explicitly asking about possible connections between conflict and the

7
agricultural changes that occurred. Then, respondents were asked to compare past and
future conflict levels with the current level of conflict.
Next came a series of questions asking the respondents to compare their use of
technology with their neighbors and surrounding communities. The series was followed
by questions relating differential technology use with conflict. Questions were also
asked to determine the families’ access to credit, ownership of tools, and access to water.
Question fifty-eight began a series of questions specifically addressing the
Guatemalan civil war and its impact upon agriculture. This was followed by questions
that addressed the reaction of people to new technologies and the perception of crime.
Finally, the survey concluded by giving the respondent the opportunity to ask questions
and make further comments.
D. Data Collection
In addition to the five preliminary interviews, eighty-two interviews were
conducted during a two-week period in August 2006. With one exception, all of the
interviews were conducted in the city of Santa Cruz or in the following communities of
the Santa Cruz municipio: Choacaman, Chicabracan I, Chicabracan II, Xatinap, Pacaja
II, and Pachó Lemoa. Some communities are reachable by public microbuses and a
short walk, but others are served by public transportation only twice a week, on market
days. To reach these communities on a non-market day, a pickup and driver may be
hired in the town square. The only other alternative is to walk for up to an hour and a
half from the nearest bus stop.

8
Three local interviewers, bilingual in Maya K’iche’ and Spanish, were employed
to conduct research. One foreign interviewer (the author) was bilingual in English and
Spanish. Due to the suspicion with which foreigners are currently viewed as a result of
mining concessions recently granted by the government, it would have been dangerous
and unproductive to enter communities and ask questions about land use and ownership,
even if accompanied by native speakers from a neighboring village. For that reason, the
research team entered several communities by accompanying the coordinators of a
women’s microcredit program run by the grassroots non-governmental organization
Acción Cultural Guatemalteca (ACG). After being introduced by the microcredit
coordinators, the team began interviewing women on an individual basis. On one
occasion, the team entered a village with a group of ACG coordinators during the
celebration of a development project. This provided the opportunity to interview men
and women who were not involved with the microcredit program. On other occasions,
interviews were conducted at the ACG offices in Santa Cruz del Quiché.
Language issues were a special challenge. Respondents who did not speak
Spanish were interviewed in K’iche’ and their answers were recorded in Spanish.
Translation from Spanish to K’iche’ was difficult for the more abstract concepts covered
by the interview, but translation was not a great concern for more concrete concepts such
as those involving farming practices. There were also challenges with language use for
interviews conducted in Spanish. These challenges were partly caused by the low level
of education and limited vocabulary of many of the respondents. Another difficulty was
that one of the interviewers (the author) was not from the area where the interviews were

9
conducted and was unfamiliar with some local expressions and words. Occasional
misunderstandings required the interviewers to diverge from the questionnaire and
attempt to rephrase questions in language that was more easily understandable by the
interviewees.
Four interviewees referred to agriculture outside of the Santa Cruz municipio,
and these were removed from the dataset. Two other interviews were also removed from
the dataset because they were poorly administered by the interviewer. Of the eighty-
seven interviews conducted, eighty-one were included in the final dataset.
E. Statistical Methods
A combination of quantitative and qualitative methods were used to analyze the
responses to the survey. Many direct quotations appear throughout this document,
chosen by the author to make a particular point. The quantitative methods used are
described in more detail in this section. The particular ways in which the described
methods are applied are discussed in more detail in Chapter IV.
One of the challenges presented by this research was the development of indices
for the perception of conflict and crime. If one is interested in knowing how much
conflict or crime another person perceives there to be, it is certainly possible to ask that
person directly. One of the survey questions (#70) was just such a direct question.
However, such a question suffers from being rather abstract in nature. How much crime
is “little” crime, or “some” crime, or “lots” of crime? Conflict, being less concrete than
crime, is even more difficult to judge. Imagine a stranger appearing and asking, “How

10
much conflict is there in your neighborhood?” These difficulties led the questionnaire to
be developed with numerous questions that addressed perception of crime and conflict,
each of which approached the topic from a different angle. The questions sought to
elicit perceptions of crime or conflict in concrete situations, or for specific issues. The
responses to these questions were then combined to form two separate indices, one each
for the perception of conflict and crime. A description of the process used to create the
indices follows.
Questions relating to conflict were grouped into one of four categories, according
to their topic. The first category, “technology type,” included questions 35, 46, 48, and
67. These questions addressed the issue of conflict caused by different agricultural
practices across time or between people. The second category, “development
organizations,” included one question, number 49. This question asked if there were
conflicts between people who participated in ACG (or other development organizations)
and those who did not. The third category, “resources,” included questions 56 and 57.
These questions asked if there were local disagreements or conflicts over the use of land
and water. The fourth category, “language,” included questions 63 and 64. This pair of
questions asked if there previously had been, or currently existed conflicts between
people who spoke different languages.
All questions were to be answered in a yes/no format. The answers were coded
as one (yes) or zero (no). Next, the means of the answers for each of the four groups
were calculated, using as many responses as were available. That is to say, if only one
question in the group was answered, that response was used as the mean. If multiple

11
questions were answered, the mean was calculated from all of the usable responses.
Forty-nine of the eighty-one respondents had responded to at least one question in each
category.
Rather than calculate a simple average, principal components analysis (PCA) was
used to calculate the principal component for the remaining forty-nine cases. PCA is a
method useful for simplifying multidimensional data so that patterns may be discerned
and similarities and differences may be highlighted (Smith, 2002). Basically, it is a
“variance maximizing (varimax) rotation of the original variable space” (StatSoft, 2003).
PCA is commonly used to reduce a large number of variables to a more manageable
number, as was done in Donald et al. (2001) and Griffith et al. (2000).
Calculating the principal component from the data was accomplished by
following a series of five steps as described by Smith (2002). First, the values for the
four conflict categories were arranged in a 49 x 4 matrix, which shall be referred to as
“A.” Second, the mean of each column was calculated and subtracted from the values
for that column, yielding matrix “B.” Next, the 4 x 4 covariance matrix, “C,” was
calculated based upon B. The fourth step required calculating the eigenvectors and their
accompanying eigenvalues for the covariance matrix, yielding 4 x 4 matrix “D.” At this
stage, the principal component (eigenvector) was identified by having the highest
eigenvalue (Table 1).
The purpose of using principal components analysis for this research was to
reduce the conflict variables to a single variable with maximum variance, therefore all
components except the principal component were discarded (Table 2). Finally, the new
12
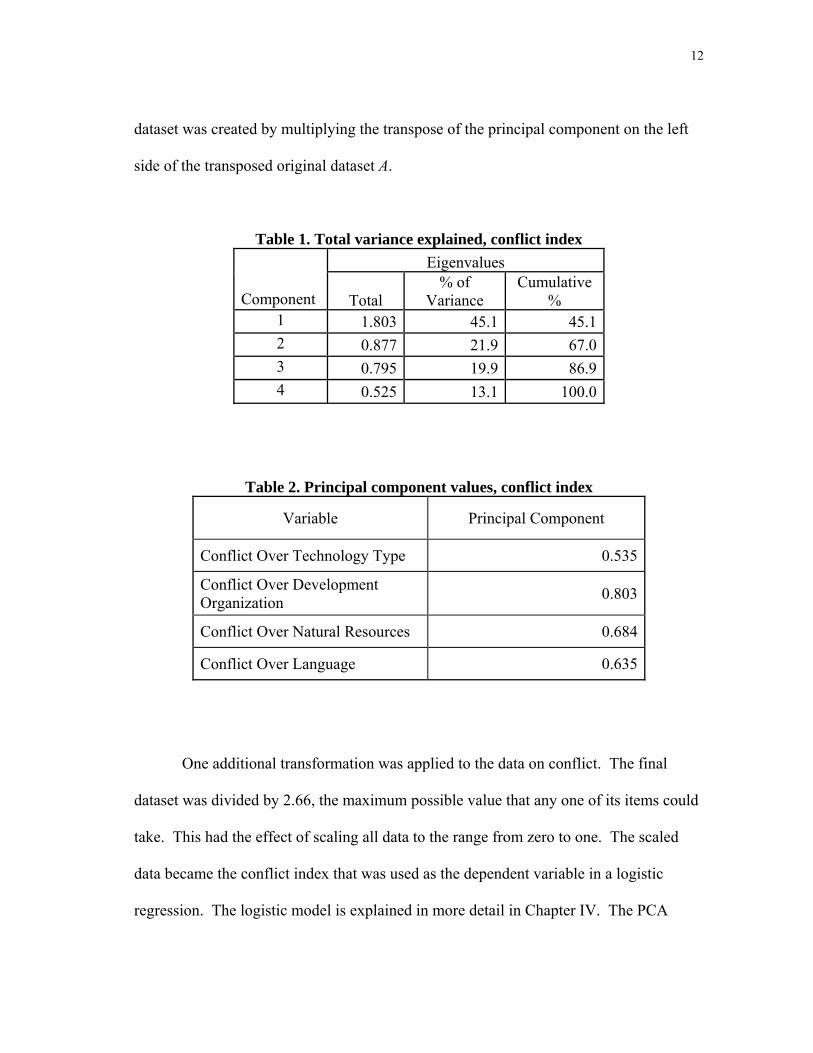
dataset was created by multiplying the transpose of the principal component on the left
side of the transposed original dataset A.
Table 1. Total variance explained, conflict index Eigenvalues
Component Total % of
Variance Cumulative
% 1 1.803 45.1 45.1 2 0.877 21.9 67.0 3 0.795 19.9 86.9 4 0.525 13.1 100.0
Table 2. Principal component values, conflict index
Variable Principal Component
Conflict Over Technology Type 0.535
Conflict Over Development Organization 0.803
Conflict Over Natural Resources 0.684
Conflict Over Language 0.635
One additional transformation was applied to the data on conflict. The final
dataset was divided by 2.66, the maximum possible value that any one of its items could
take. This had the effect of scaling all data to the range from zero to one. The scaled
data became the conflict index that was used as the dependent variable in a logistic
regression. The logistic model is explained in more detail in Chapter IV. The PCA

13
conflict index was found to be closely correlated with a simple average of the four
conflict question categories (0.98).
Creation of the crime index proceeded similarly to the process described above.
Questions 68, 69, and 70 were the only questions relating directly to crime. Possible
answers to questions 68 and 69 were “yes” or “no,” coded as: one (yes) or zero (no).
Question 70 had four possible answers and was coded on a scale from zero to three. A
principal components matrix was extracted from these three variables for the seventy-six
cases that had responded to all three questions, using the same procedure that was
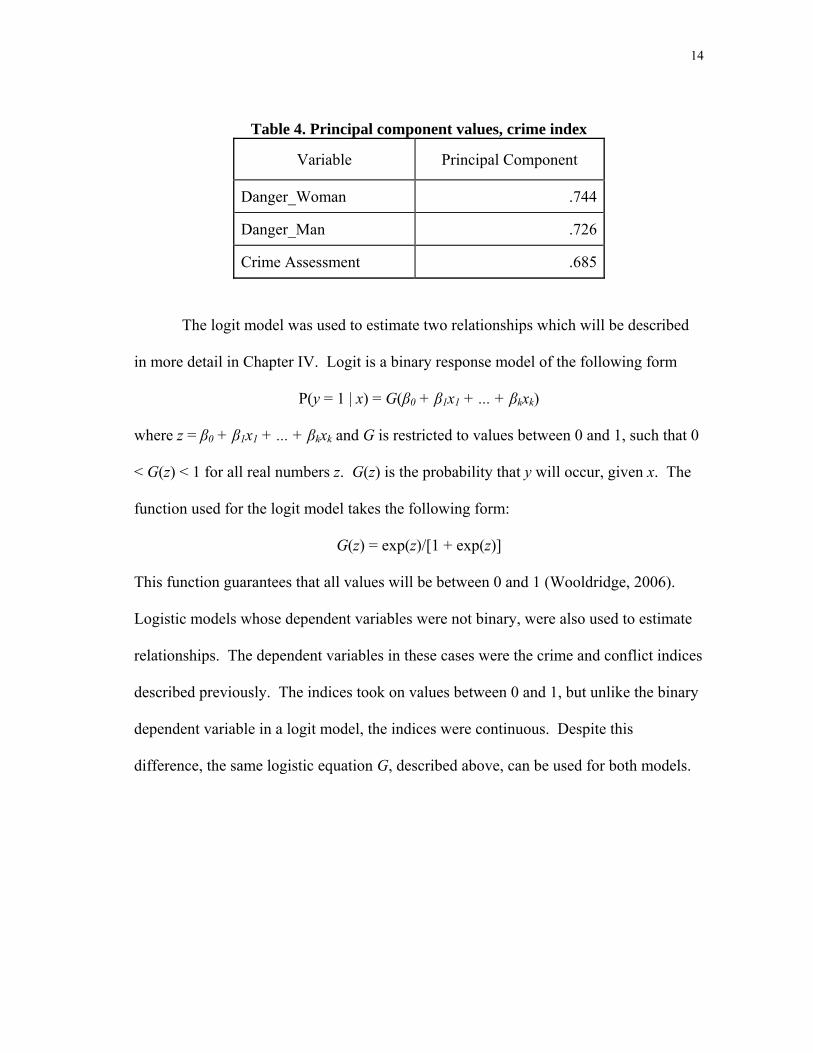
described for the conflict index (Table 3). The principle component (Table 4) was
multiplied by the original data matrix to yield a single crime index for each case. The
crime index for each case was divided by the maximum possible value, 3.53, having the
effect of scaling the data to the range from zero to one. The PCA crime index was also
found to be closely correlated with a simple average of the responses to the three crime-
related questions (0.99).
Table 3. Total variance explained, crime index Eigenvalues
Component Total % of
Variance Cumulative
% 1 1.550 51.7 51.7 2 .763 25.4 77.1 3 .687 22.9 100
14
Table 4. Principal component values, crime index
Variable Principal Component
Danger_Woman .744
Danger_Man .726
Crime Assessment .685
The logit model was used to estimate two relationships which will be described
in more detail in Chapter IV. Logit is a binary response model of the following form
P(y = 1 | x) = G(β0 + β1x1 + ... + βkxk)
where z = β0 + β1x1 + ... + βkxk and G is restricted to values between 0 and 1, such that 0
< G(z) < 1 for all real numbers z. G(z) is the probability that y will occur, given x. The
function used for the logit model takes the following form:
G(z) = exp(z)/[1 + exp(z)]
This function guarantees that all values will be between 0 and 1 (Wooldridge, 2006).
Logistic models whose dependent variables were not binary, were also used to estimate
relationships. The dependent variables in these cases were the crime and conflict indices
described previously. The indices took on values between 0 and 1, but unlike the binary
dependent variable in a logit model, the indices were continuous. Despite this
difference, the same logistic equation G, described above, can be used for both models.
15
CHAPTER III
REGIONAL HISTORY AND GEOGRAPHY
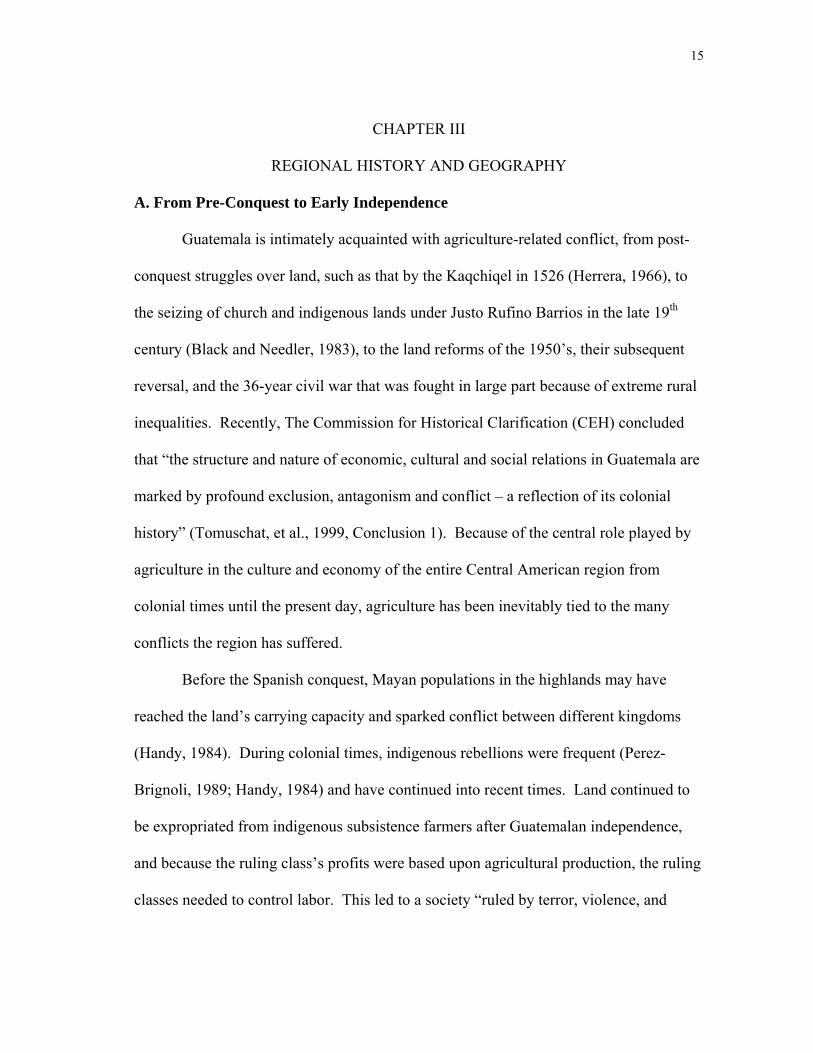
A. From Pre-Conquest to Early Independence
Guatemala is intimately acquainted with agriculture-related conflict, from post-
conquest struggles over land, such as that by the Kaqchiqel in 1526 (Herrera, 1966), to
the seizing of church and indigenous lands under Justo Rufino Barrios in the late 19th
century (Black and Needler, 1983), to the land reforms of the 1950’s, their subsequent
reversal, and the 36-year civil war that was fought in large part because of extreme rural
inequalities. Recently, The Commission for Historical Clarification (CEH) concluded
that “the structure and nature of economic, cultural and social relations in Guatemala are
marked by profound exclusion, antagonism and conflict – a reflection of its colonial
history” (Tomuschat, et al., 1999, Conclusion 1). Because of the central role played by
agriculture in the culture and economy of the entire Central American region from
colonial times until the present day, agriculture has been inevitably tied to the many
conflicts the region has suffered.
Before the Spanish conquest, Mayan populations in the highlands may have
reached the land’s carrying capacity and sparked conflict between different kingdoms
(Handy, 1984). During colonial times, indigenous rebellions were frequent (Perez-
Brignoli, 1989; Handy, 1984) and have continued into recent times. Land continued to
be expropriated from indigenous subsistence farmers after Guatemalan independence,
and because the ruling class’s profits were based upon agricultural production, the ruling
classes needed to control labor. This led to a society “ruled by terror, violence, and

16
coercion” (Handy, 1984, p. 33). Small-scale production of cochineal, a dye, in the first
half of the 19th century provided income for peasants and may have had a pacifying
effect, but in the 1850s, cochineal production declined and Guatemala began searching
for a new export crop. After a short experiment with cotton, coffee proved to be the
answer. Unlike cochineal, coffee was suitable for growth on large plantations – this led
to the further expropriation of indigenous lands (Handy, 1984). In 1877 a new law
allowed for the sale of local government and communal lands; on other occasions,
indigenous lands believed to be suitable for coffee production were seized with or
without compensation (Black and Needler, 1983). Indigenous labor was also exploited
through the use of debt peonage for work on plantations and forced labor on public
projects (Black and Needler, 1983). One of the results of the land expropriations and
forced servitude was an unsuccessful revolt that began in the highlands in 1875 (Handy,
1984). The revolt was put down, and coffee continues to be an important export to this
day.
B. Bananas and Conflict
At the end of the 19th century, the United Fruit company began acquiring land
and power in Central America, where it produced bananas for export to the United
States-- in following decades United Fruit would play a key role in Guatemalan politics
and the disastrous course of Guatemalan history. In 1904, Guatemalan dictator Manuel
Estrada Cabrera “granted the company a ninety-nine year concession to operate and
finish constructing that country’s principal rail line...Through such concessions, United
17
Fruit by 1930 had operating capital of $215 million and owned sprawling properties not
only on the three Caribbean islands [Jamaica, Cuba, and Santo Domingo] ... but also in
Panama, Honduras, Nicaragua, Colombia--and in its largest domain, Guatemala”
(Schlesinger and Kinzer, 2005, p. 67). At the beginning of the 20th century, American
Samuel Zemurray expanded his banana business by funding a successful revolution in
Honduras. The new president granted Zemurray generous concessions to purchase land,
build a railroad to the coast, protection from tax increases, and duty-free importation of
building materials. Zemurray was eventually bought out by United Fruit in exchange for
United Fruit stock. In addition to becoming the company’s largest shareholder, he was
named managing director in 1933. In the 1930’s, United Fruit was granted further
concessions from a Guatemalan dictator, General Jorge Ubico (Schlesinger and Kinzer,
2005). This time, the concessions included exemptions “from import duties on raw
materials and from local property taxes” (Black and Needler, 1983). Ubico insisted that
laborers not be paid more than 50 cents per day “in order to keep other Guatemalan
workers from demanding better pay” (Schlesinger and Kinzer, 2005, p. 70).
According to Perez-Brignoli (1989), the development of an agricultural exporting
economy in 19th and 20th century Central America resulted in:
(1) an enormous concentration of power in the hands of landowners, (2) a tendency to expropriate land from the Indian peasants thereby imposing a distribution of the nation’s lands that the peasants never accepted as legitimate, (3) a high degree of violence required for the functioning of the new economic and political structures, and (4) a strong class polarization along with structural weakness in the emerging middle sectors. (Perez-Brignoli, 1989, p. 114).

18
In a climate of polarization and Cold-war ideology, the progressive Juan José Arévalo
became president through legitimate elections in 1945. United Fruit began reporting that
its labor disputes were the result of communist intrigues and harassment from the
Guatemalan government (Schlesinger and Kinzer, 2005). Jacobo Arbenz succeeded
Arévalo as president in 1950 and formed plans to compete with United Fruit’s railroad
and electricity monopolies, as well as beginning agricultural reforms. The Agrarian
Reform Act of 1952 was aimed at altering the imbalance of landholding in the country
by forcibly purchasing privately held land, especially fallow land, and distributing it to
peasants (Perez-Brignoli, 1989). United Fruit, the major target of the new legislation,
held 550,000 acres of land, 85% of which was fallow. The Guatemalan government
offered bonds worth $627,572 to United Fruit; this was the value of the land based upon
the company’s tax declaration. United Fruit responded by claiming that the real value of
the land was $15,854,849. Further expropriations increased the government’s offer by
approximately $500,000 (Schlesinger and Kinzer, 2005). This threat to United Fruit and
Guatemala’s other large landowners led to even greater cries of “communism” and calls
for U.S. intervention. In 1954, the CIA organized an invasion force, and with the
Guatemalan army refusing to defend his government, Arbenz went into exile in Mexico.
Arbenz was followed by a series of corrupt and violent military dictators over
several decades, the first of which was Castillo Armas, who reversed the reforms that
Arévalo and Arbenz had pushed forward. The extreme inequalities within Guatemalan
society, especially in the countryside, had not been resolved and gave birth to a civil war

19
that would last for 36 years. To make matters worse, prices rose faster than wages for
rural laborers, leaving them worse off in 1982 than in 1950 (Handy, 1984).
C. Recent Conflict
Structural injustice and “the reluctance to promote substantive reforms that could
have reduced structural conflicts” are among the “underlying factors which determined
the origin and subsequent outbreak of the armed confrontation” (Tomuschat, et al., 1999,
Conclusions 12). During the 1960s and 70s, a process of militarization began,
culminating in the Army’s assumption of “almost absolute power for half a decade
during the 1980s” (Tomuschat, et al., 1999, Conclusions 36). Producer and marketing
cooperatives emerged as new forms of agricultural organization in the 1960’s and 70’s,
but the dominate powers in Guatemala saw this independent action as a threat and
moved to squelch it. Community leaders were killed and cooperatives were destroyed
(Handy, 1984), often in the name of the National Security Doctrine and anti-communism
(Tomuschat, et al., 1999, Conclusions 83).
The war was characterized by brutal repression of those identified as opponents
through the use of assassinations, “disappearances,” torture, and wholesale massacre of
indigenous farming communities located in areas where the guerrillas were active.
Among the victims were “men, women and children of all social strata: workers,
professionals, church members, politicians, peasants, students and academics; in ethnic
terms, the vast majority were Mayans” (Tomuschat, et al., 1999, Conclusions 15). State-
planned massacres and scorched-earth operations “resulted in the complete
20
extermination of many Mayan communities, along with their homes, cattle, crops and
other elements essential to survival” (Tomuschat, et al., 1999, Conclusions 86). The
department of Quiché, where the data for this research was collected, was one of the
hardest-hit areas. In his book “Massacres in the Jungle,” anthropologist Ricardo Falla
documents in detail a number of massacres that occurred in the Ixcán, the northernmost
part of the Quiché departamento (Falla, 1994). The CEH recorded 344 massacres in
Quiché, more than the rest of the country combined (Tomuschat, et al., 1999). The CEH
also estimated that country-wide, “the number of persons killed or disappeared as a
result of the fratricidal confrontation reached a total of over 200,000” (Tomuschat, et al.,
1999, Conclusions 1) and reports that estimates of internally and externally displaced
persons “vary from 500,000 to a million and a half people in the most intense period
from 1981 to 1983” (Conclusions 66). Ninety-three percent of the human rights
violations and acts of violence registered with the CEH were perpetrated by the
Guatemalan state (Tomuschat, et al., 1999). The nature of the violence led the CEH to
conclude that the Guatemalan state committed genocide (Tomuschat, et al., 1999,
Conclusions 124).
D. Santa Cruz del Quiché
1. Geography
As described in the Chapter II, all but one of the interviews were conducted in
and around Santa Cruz, the capital city of the Quiché departamento of Guatemala. The
municipio of Santa Cruz del Quiché includes the city of the same name, as well as the

21
surrounding villages and rural area. The city is located 2021 meters above sea level, at
latitude 15° 02’ 12” and longitude 91° 07’ 00” (Guatemala, Dirección General de
Cartografía, 1962). According to Simmons et al.’s (1959) extensive study on the soils of
Guatemala, the Santa Cruz del Quiché region is characterized as sandy clay loam with
good drainage, a topsoil depth of 20 cm, and a clay subsoil that is plastic when wet and
hard when dry. The soil has average fertility and capacity to maintain moisture. The
most common slopes range from 10-20 degrees, making erosion a serious danger.
Simmons et al. listed two “special problems” for the management of this soil-
“maintaining organic material” and “combating erosion.”
Traveling to Santa Cruz from Guatemala City requires several hours by public
transportation or slightly less in a private vehicle. The region is mountainous, with
narrow roads that wind their way past Chichicastenango, an indigenous town famous for
its textiles and artisans market. Though Chichicastenango is only 18 km from Santa
Cruz, the journey takes approximately 30 minutes because of the nature of the road,
which includes a number of 180 degrees cutbacks.
2. History of Santa Cruz
Pre-Columbian Guatemalan agriculture included maize, beans, chili peppers, and
squash. It was so productive that population densities in Guatemala may have reached
contemporary levels (Perez-Brignoli, 1989), approximately 400,000 for the Quiché
departamento and over 35,000 in Santa Cruz (Guatemala, Instituto Nacional de
Estadística, 1994), which was once the capital of the K’iche’ kingdom. The K’iche’
were a small warrior group that most likely invaded the region in the early 13th century

22
and later expanded their power to dominate “much of the Guatemalan highlands,
piedmont, and coast” (Fox, 1976). Carmack (1976) describes some of the parallels
between the Aztecs of Mexico and the K’iche’ of Utatlan:
they both experienced a meteoric rise to power; much of their power derived from great military conquests; they protected their political center with impregnable defenses; tributary colonies were established in order to support the ruling lords; populations near the capital were socialized into easily controlled administrative units; complex levels of stratification emerged, including middle sectors; history was secularized, filled with hero kings and conquerors; human sacrifice to patron gods on a grand scale was instituted; war captives became a large rural labor force, complementing the services of slaves; populations became urbanized, in terms of nucleation, occupational specialization, and large numbers; an elite art style was formalized and used to support authority.
Though the Spanish destroyed the ancient city of Utatlan, also known as
Gumarcaj, present-day Santa Cruz rests on the site of the pre-conquest city’s ruins.
Many K’iche’ continue to visit the ruins on the outskirts of Santa Cruz to perform
traditional Mayan religious ceremonies.
Simmons, Tarano, and Pinto’s comments on Santa Cruz, made in 1959, remain
an accurate description of present day agriculture: most production is the subsistence
cultivation of maize and beans on small plots, work is done with hand tools, much of the
cultivated area is severely eroded, and productivity could be increased. Simmons et al.
also suggested that the best use of land would be for the production of livestock and
animal products, taking care not to overgraze, causing further erosion. In addition, they
commented on the size of familial landholdings, stating that 3.5 hectares, much more
than most current residents of Santa Cruz own, were inadequate to support a family of
five, smaller than most families in Santa Cruz today. Ricardo Falla reported in 1972 that

23
the majority of residents’ livelihoods in neighboring San Antonio Ilotenango came from
their intercropped harvests consisting primarily of maize, beans, lima beans, and squash.
A large percentage, probably more than ten percent, of the population went to the coast
for at least one month per year to work as wage laborers on coffee and cotton
plantations. At the end of the nineteenth century, San Antonio was known for its wool
production, but by the 1970’s only a few small flocks remained, resulting in a lack of
natural fertilizer (Falla, 1972).
3. Modern Santa Cruz
In 2002, the population of the municipio was 62,369, of which 20,870 were urban
residents and the remaining 41,499 lived in rural areas (Guatemala, Instituto Nacional de
Estadística, 2003a). More than 82% (51,279) of the municipio’s residents identify
themselves as Mayan (Guatemala, Instituto Nacional de Estadística, 2003a), the majority
of whom speak K’iche’ as their first language. Few tourists venture all the way to Santa
Cruz; consequently, its market and businesses cater to the local population, unlike
nearby Chichicastenango. Santa Cruz includes many of the signs of a modern city, such
as ATM machines, a mall, and a movie theatre, while maintaining its indigenous
heritage; most of the women walking around town still wear the patterned skirt
traditional in the area. Like many Latin American cities, Santa Cruz suffers from air
pollution caused by dust and the exhaust from old vehicles.
4. The Communities of Santa Cruz
Most of the interviews for this study were conducted in the communities
surrounding Santa Cruz. In contrast to the city, the nearby hills offer breathtaking views

24
of green forests, corn fields, and deep ravines. Occasionally, deep scars mark the
tremendous loss of soil caused by erosion of the steep slopes. In this land surrounding
the city are many small communities of indigenous farmers. Despite the region’s dense
population, homes are dispersed throughout the countryside, rather than being clustered
around village centers. Much of the rural population has little formal education and
remains illiterate. While most men speak both Spanish and K’iche’, many women
cannot speak Spanish because they did not attend school as children.

25
CHAPTER IV
CONFLICT AND AGRICULTURE Chapter IV is divided into six sections (A through F), each of which explores a
different aspect of the connection between agriculture and conflict. The first five
sections deal with the time periods before and during conflict, and are ordered to proceed
from the most intuitive relationships between agriculture and conflict, to the least
intuitive. The chapter concludes with a final section that looks at post-conflict recovery
options. Each of the six sections is divided into six parts: a literature review, a
conceptual model, hypotheses specific to Santa Cruz del Quiché, methods of testing the
specific hypotheses, results, and discussion.
A. Conflict’s Impact on Agriculture
For all conflicts, as for all natural disasters, the most important impacts are the suffering, injury and death of men, women and children. The losses in output, means of production and infrastructure seem insignificant in comparison. Yet these material losses are also important, for they undermine the ability of conflict survivors to subsist and recover. This is most obvious in agriculture, where the destruction of crops and livestock results, at best, in reduced food security and, at worst, in famine and death. Indeed, in many cases, deaths resulting indirectly from conflict (through famine, for example) exceed deaths from direct violence. (United Nations, Food and Agriculture Organization, 2000, “Conflicts, Agriculture and Food Security”)
1. Literature Review
Agriculture has long been a target of warfare. “Ravaging of cropland was central
to warfare of most societies of the past,” from the Egyptian pharaoh Kamose in his
conquest of the Hyksos to the Assyrian king Sargon’s destruction of his enemy’s fields
and fruit trees (Hanson, 1998), to the Spartans, who timed their attacks upon Athens to
26
occur just before the harvest (de Soysa and Gleditsch, 1999). Modern examples also
abound. Take, for example, the “scorched earth” tactics carried out by General William
Sherman in the United States’ civil war from 1861-1865 and by the Guatemalan state
during the 1980’s.
Whether the destruction is intentional or not, war can devastate agriculture, as
recently occurred in Angola, where “agricultural output fell to less than 10 percent of its
pre-war level” (Addison, 2005, p. 2). During the decades of war in Afghanistan, much
of the country’s irrigation works have been damaged (United Nations, FAO/AGL, 2005)
and the increase in poppy cultivation (United Nations Office on Drugs and Crime, 2004;
United Nations, 2006) has impacted society not only through the lost production of
agricultural “goods,” but also by an increase in the production of agricultural “bads.” In
Iraq, agricultural development was used as a pretext and hydro-engineering was used as
a weapon to accomplish the destruction of 90% of the marshlands that were home to the
Ma’dan people, commonly known as the Marsh Arabs. The environmental destruction
devastated the local productivity and combined with military operations to displace over
100,000 people, from a population estimated at 250,000 in 1991 (Human Rights Watch,
2003). During Guatemala’s recent civil war, thousands of widowed women were left to
provide for their families, “often with no material resources after the scorched earth
policies [carried out by the Guatemalan state] resulted in the destruction of their homes
and crops” (Tomuschat, et al., 1999, Conclusions 29). So, although the technology of
destruction has “advanced” far beyond the limited weapons available in the pharaohs’
days, destruction of agriculture continues to be a strategy and consequence of warfare.
27
Large-scale conflict often impacts agricultural production unintentionally. De
Soysa and Gleditsch (1999) list a number of examples where agriculture was either
disrupted unintentionally or the effects of intentional destruction lasted much longer than
the perpetrators had intended. Among them are the following: French and Belgian
agriculture was severely damaged by destruction to crop lands during World War I; in
1938, Chinese forces dynamited a dyke on the Yellow River and the resulting
floodwaters carried off the crops and topsoil from millions of hectares; during the
Vietnam War, the U.S. sprayed anti-plant agents and planted mines that continue to
make agriculture a dangerous activity in Vietnam (de Soysa and Gleditsch, 1999). In
Guatemala’s recent civil war, destruction of agriculture was meant not only to weaken
the economic and social support of the guerillas, “but above all, to destroy the cultural
values that ensured cohesion and collective action in Mayan communities” (Tomuschat,
et al., 1999, Conclusions 32). Agriculture was a target because of corn’s symbolic
importance for the Mayan culture (Tomuschat, et al., 1999).
Indirect impacts of war include the breakdown of markets for agricultural
production, the loss of seed stock, and the loss of the human capital that occurs when
adult farmers are killed before they can pass on their agricultural knowledge to the next
generation (de Soysa and Gleditsch, 1999). In northern Uganda, the ongoing conflict
has disrupted cattle markets and spelled disaster for pastoral farmers (United Nations
Development Program, 2005). Guatemala lost “professionals, academics and
researchers...[creating] a vacuum during a specific period of political and cultural
history...[and resulting] in the loss of an important part of the pedagogic and intellectual

28
capacity to educate several future generations in Guatemala” (Tomuschat, et al., 1999,
Conclusions 58). Among those who were lost during the war were many indigenous
farmers who were unable to pass on their knowledge of farming practices to the next
generation.
2. Conceptual Model
The purpose of this section is to develop a general conceptual model for the way
in which conflict may disrupt agriculture. A better understanding of how this occurs will
improve our ability to use technology as prevention, relief, and cure of war’s destruction.
The following section builds upon the general conceptual model by formulating
hypotheses specific to Santa Cruz.
Figure 1 displays the way in which conflict may disrupt agriculture, and the
consequences that may result. The beige colored boxes indicate starting points – the
direct impacts of conflict. White and red boxes are intermediate and end results. Some
of the direct impacts, such as “Destruction of infrastructure and danger limit travel” are
much more likely to occur when there is widespread conflict than when the conflict is
limited to a community or family disagreement. Others, such as “Farmers killed” or
“Intentional and unintentional destruction of agriculture”, are likely in both large and
small-scale conflict situations, though the magnitude of the disruption may differ.
“Dangerous to work in fields” is one of the most direct impacts. The risk to
one’s life associated with working in fields, away from the safety of the home, increases
the marginal costs of production. When farmers are killed as a result of conflict, their
death represents a loss of expert knowledge, or technology, that must be replaced.
29
Farmers’ deaths prevent them from passing on general agricultural knowledge to their
children, but they also prevent farmers from handing down location-specific knowledge
(technology) of land that may have been farmed by the same family for generations.
General agricultural knowledge may be gathered, over time, from one’s neighbors, but
the location-specific knowledge will take longer to recuperate. The loss of general and
location-specific knowledge increases the marginal costs of production.
The destruction of infrastructure and the insecurity brought about by a conflict
situation limit travel, both by farmers and by those who supply them with inputs and
purchase their outputs. On the supply side, this reduces the marketing potential for
agricultural outputs, and reduces the supply of agricultural inputs. Both factors increase
the marginal costs of production. On the demand side, limited mobility by consumers
reduces consumption and shifts the demand curve downward
Also causing the demand curve to shift downward is the destruction of
agriculture, whether intentional or unintentional. This effect occurs indirectly, through
the impact of reducing wealth. Also reducing wealth is the loss of on-farm and off-farm
employment opportunities caused by the disruption. The direct destruction of
agriculture and its means of production, including standing crops, animals, and tools,
increases the marginal costs of production as well.
As indicated by Figure 1, the aforementioned factors impact both the supply and
demand sides, by increasing the marginal costs of production and decreasing demand.
The net result is a reduction of equilibrium production.

30
Marginal costs of
production increase
Downward shift in demand for
agricultural commodities
Dangerous to work in
fields
Lost employment opportunities
Reduced wealth
Equilibrium production decreases
Intentional and unintentional destruction of
agriculture (fields,
animals, tools)
Agricultural knowledge
lost
Farmers killed
Reduced marketing
potential for agricultural
outputs
Reduced supply of
agricultural inputs
Destruction of infrastructure and danger limit travel
Figure 1. Conflict’s impact on agriculture 3. Conflict’s Impact on Guatemalan Agriculture
The Guatemalan Commission for Historical Clarification collected 669 cases of
massacres that occurred during Guatemala’s thirty-six year civil war. More of these
31
occurred in the Quiché departamento than in the rest of the country combined
(Tomuschat, et al., 1999). One of several expected consequences of massacres,
assassinations, and the general climate of fear is a breakdown in the functioning of
markets (United Nations, Food and Agriculture Organization, 2000). This relationship is
illustrated in Figure 1 by the boxes “Reduced supply of agricultural inputs” and
“Reduced marketing potential for agricultural outputs.” A second expected consequence
of the large number of lives lost, also represented in Figure 1, is that much social capital,
in the form of farmer knowledge, was lost. These expectations led to formation of the
hypotheses H0A: The civil war caused a breakdown of Santa Cruz del Quiché markets,
and H0B: The civil war caused a loss of farmer knowledge in Santa Cruz del Quiché.
4. Methods
Interview questions 58 through 60 (Appendix A & B) asked participants if they
modified their agricultural practices during the civil war, how their agricultural practices
were modified during the war, what agricultural difficulties they faced during the war,
and how they responded to these difficulties. Each participant’s answers to the questions
were classified in two ways. The first manner of classification included twelve non-
exclusive categories: Crops destroyed, Difficult to work, Death in family, Did not have
own land, Difficult to buy inputs/sell outputs, Animals died, Sold animals, Fear of losing
a family member, Emigrated, Modified crops grown, Other, and No problem. The
answers given by a respondent were included in more than one category, if applicable.
The number and percentage of respondents who identified each of the difficulties above
were calculated and reported. In order to evaluate H0A, the percentage of respondents

32
who reported “Difficult to buy inputs/sell outputs” was examined. Individual responses
are also reported for further illustration. Without measurements of farmer knowledge
from before and after the war, it is not possible to directly measure the gain or loss of
agricultural knowledge among farmers. For that reason, a proxy was used to evaluate
H0B. An examination was made of the anecdotal stories provided by families who
identified “Death in the family” as one of the agricultural difficulties faced during the
civil war.
5. Results
Table 5 displays the quantitative results of testing H0A and H0B. Lack of market
access was a more frequently reported problem than loss of a family member, though
both were reported by small minorities of respondents.
Table 5. Selected impacts of the civil war upon farm
families. Categorization of questions 58 – 60 (N = 81) Frequency Percent
Difficult to buy inputs/sell outputs 5 6%
Death in family 3 4%
Qualitative evidence relating to the hypotheses was also gathered. Fear was
frequently mentioned when interviewees spoke about the time of the civil war. Two
respondents explicitly connected fear or danger to difficulties associated with market
access: “We planted less land because one didn’t know if they were going to live to eat,
and there wasn’t time, and you couldn’t sell in the market because the army grabbed
33
people to integrate them into the army....” (#2)1, “A person was afraid to go to the
market. You couldn’t buy anything...We didn’t sell corn anymore” (#33), and another
made the connection by implication: “In those days, you couldn’t go to the market, or
only for a little bit. You couldn’t get the best seed, but after five or eight years you
could work more peacefully” (#37). Other indications of market failure were price
distortions: “We didn’t have animals; we sold them cheap. We sold a whole chicken for
fifty cents when a pound of chicken cost sixty cents” (#34) and “We used to plant a lot,
now we plant very little. There were many setbacks, loss of life. Also because of the
increase in price of fertilizer and we couldn’t pay a hired hand” (#39).
In all three cases of death reported by interviewees, the victim was an adult male.
Two of the respondents explicitly link the death with agricultural difficulties: “We were
little. I was three years old when my father died. We didn’t farm anymore. There were
seven of us. My mom looked for work so she could feed us...” (#55) and “My father
‘disappeared’ when the maize was ready to harvest. We went to the capital and when we
came back, the paramilitaries had taken the harvest. My mom cried. We didn’t have
seeds anymore. We bought seeds and planted, but it didn’t produce maize. We planted,
but my brothers were little and they didn’t worry about the maize...We didn’t have
money to buy chemical fertilizer...We put dead leaves on it but it didn’t produce” (#60).
The third respondent who reported a family death, related the death to general difficulty
1 The number in parentheses indicates the number of the interview particpant. The names of participants were not recorded, in order to protect their identity. Researchers made the best effot to record participants’ responses literally, but when that was not possible, interviewers recorded abbreviated versions. All quotations from the interviews have been translated by the author from the written Spanish recorded by the interviewer.

34
rather than explicitly linking the death to agricultural problems: “My dad died. They
killed him and we were left without a dad and we couldn’t do anything” (#63).
The Guatemalan civil war impacted agriculture in other ways not directly related
to the two hypotheses. They were results of the climate of fear and insecurity, caused by
incidents like this one: “We endured hunger because we didn’t want to go out.
Helicopters went by. Many people were going to the fair in Panaxic, Quiché and they
grabbed them and killed them like animals in the ravine” (#54). Section C, “Agricultural
Technology and Survival Strategies During Conflict,” further explores the theme of
response to the violence.
6. Discussion
While both problems -- the breakdown of the market and the loss of farmer
knowledge -- most likely presented serious difficulties for those who were impacted, it is
not clear from the data that they affected a large portion of the population, since neither
was mentioned by more than 6% of survey respondents. The five people who reported
difficulty in purchasing inputs or selling outputs came from four different villages.
Possible explanations for this are that these five people were specifically targeted by
security forces and for that reason had more cause to fear venturing into the market, or
that these five people were among a few people who, previous to the outbreak of the
conflict, had strong ties to the market and thus felt its loss most keenly. On the other
hand, while it is possible that only five of the survey respondents experienced difficulties
because they were unable to access the market, it is quite likely that these issues affected
many people who did not explicitly mention them as difficulties. The fact that the five

35
people who reported difficulties relating to market access came from four different
communities shows that accessing markets was not a problem limited to a small
geographic area.
Three respondents, 4% of the total, reported a death in the family. For two of the
three respondents, the death of the family member clearly represented lost knowledge as
well as an important source of labor. Is this an accurate representation of the percentage
of families who experienced a death or “disappearance?” For comparison, a rough
calculation can be made of the proportion of Santa Cruz families who experienced a
death as a result of the war. Of the deaths and disappearances recorded in the CIIDH
database (Ball, 1999), approximately 1.9% occurred in the Santa Cruz municipio. The
CEH (Tomuschat, et al., 1999) estimates that 200,000 people were killed or disappeared
nationwide. Multiplying 200,000 by 1.9% gives an estimate of 3,800 victims in Santa
Cruz, which is more than 10% of the 1981 population and approximately 6% of the
population in the 2002 census (Guatemala, Instituto Nacional de Estadística, 2003a). If
every one of the violations had affected a different household, the proportion of
households affected would be approximately 57% of the 1981 population and 35% of the
2002 population, based on an average household size of 5.7 and 5.9 in 1981 and 2002,
respectively (Guatemala, Instituto Nacional de Estadística, 2003a). Of course, many of
the violations affected the same family, but based on the numbers above, it seems that
the proportion of families that lost a family member must be higher than the 4% reported
to this research team. There are several possible explanations: 1) The communities
covered by the interviews had lower rates of war related deaths than other Santa Cruz

36
communities, or 2) The participants did not report all of the deaths to the research team,
or 3) The family members of the victims also died, or moved away from the municipio,
and therefore did not participate in this survey, or 4) A combination of the
aforementioned factors occurred. The third possibility is almost certain to have
occurred, while the second is also probable, since participants were not directly asked if
they had lost family members, and many participants may have purposely withheld that
information out of fear, or for other reasons.
The following sections will continue to explore the ways that agriculture is
impacted by conflict, but before concluding this discussion, it is worth sharing one more
quotation that came out of the interviews. When asked if the family had continued to
farm in the same manner during the war (question 45), one middle-aged man replied,
“The quality of planting wasn’t the same. Ears of corn were big before, with more
kernels. The armies burned the fields and they don’t produce the same anymore” (#4).
It may be difficult to believe that a corn field stopped producing as it had in the past due
having been burnt, but this belief points to another important impact of the war—the
psychological effect it had upon farmers. Fear was widespread, certainly having a great
impact upon agriculture: “Everyone was scared. The army was hidden in the forest. A
person couldn’t work” (#41). Though the peace accords were signed more than ten
years ago, and major fighting ended in Guatemala long before that, many people still
fear returning to their homes and their fields.

37
The following are additional responses with relevance to the war’s impact on
Santa Cruz’s farmers:
The army killed many people. They blamed the indigenous people (#36). The violence is a little better now. The animals died. It’s hard to recover that. They burned houses too. I was 12 or 10 years old. They killed people (#54).
B. Natural Resources as Sources of Conflict
Severe environmental scarcities often contribute to major civil violence. Poor countries are more vulnerable to this violence, because large fractions of their populations depend for their day-to-day livelihoods on local renewable resources, such as cropland, forests, lakes and streams, and coastal fish stocks.” (Homer-Dixon and Blitt, 1998, p. 15)
1. Literature Review
The role of natural resources in civil conflict has been much studied in recent
years, but research has not yet provided conclusive results (Ross, 2004). History, on the
other hand, provides numerous examples of conflict involving water resources, such as
the Six Day War of 1967 and a 1989 incident in which Syrian jets shot down a Turkish
survey plane. Other conflicts over water have occurred or are brewing in East Africa,
the Middle East, southeast Asia, North America, and South America (Ward, 2002;
Gleick, 1993). Land has often shown to be a source of conflict, as in the examples of the
Philippines and Guatemala given below.
Thomas Homer-Dixon’s (1994) research into the causal relationship between
environmental scarcity and violent conflict links resource scarcity and/or degradation to

38
reduced agricultural and economic productivity that can result in conflict. His comment
that “undue attention” is paid to “climate change and stratospheric ozone depletion” and
assertion that the world is already suffering from “shortages of good land, water, forests,
and fish” is supported by a number of case studies. In the Middle East, competition for
water between Israeli and Palestinian farmers contributes to the long-lasting conflict in
the region. The drying up and salinization of Palestinian wells has led many to abandon
farming and look for work elsewhere. In the Philippines, population growth combined
with scarcity of good farm land has led rural residents to move to the cities or open
marginal land for farming. These fragile forest ecosystems are severely damaged by the
switch to agricultural production; the result is “horrendous environmental damage,
particularly water erosion, landslides, and changes in the hydrological cycle. This has
set in motion a cycle of falling food production, the clearing of new plots, and further
land degradation.” This exacerbation of the economic situation contributed to the
country suffering from “serious strife for many decades.” In India, tensions are high and
violent conflict has erupted on at least one occasion as a result of the large number of
migrants from Bangladesh, where population pressure that causes reduced farm plot
sizes combines with water use restrictions to create a “push” effect, moving people out
of the country in search of better opportunities. The Shining Path guerrillas of Peru were
based in an area of the country that had experienced increasing population and soil
degradation which resulted in serious reductions in per-capita income and caloric intake.
Haiti and South Africa have shown similar connections between environmental
degradation, overpopulation, and conflict. Among the consequences of environmental

39
degradation is the weakening of states, which could lead them to fragment or become
more authoritarian (Homer-Dixon, 1994).
Disputes over land have been closely related to violent conflict throughout
Guatemala’s history, as recounted in Chapter III of this document. Other documented
conflicts include the construction of the Chixoy dam and the return of refugees to
Huehuetenango. Several thousand Guatemalans were relocated by their government
without just compensation for their land when a hydroelectric dam was built on the
Chixoy river between 1975 and 1983. The ongoing civil war provided the opportunity to
label as subversive the communities that resisted relocation, and by the time the dam
waters began to rise in January 1983, ten communities of the Chixoy River Basin had
been massacred, including 444 people in the community of Rio Negro (Rose Johnston,
2005). A smaller scale conflict is reported by César Castañeda (1998). During the war,
residents of Unión Ojo de Agua, Huehuetenango, Guatemala, fled their homes to escape
the violence. When they returned, they found that the army had brought settlers to
occupy land adjacent to their own, and that an irrigation project, supported in part by the
Taiwanese government, had taken their water for the use of the new settlers. When the
situation was not resolved to their liking, the returning owners broke the irrigation pipe
and took hostage an agricultural technician (Castañeda, 1998).
2. Conceptual Model
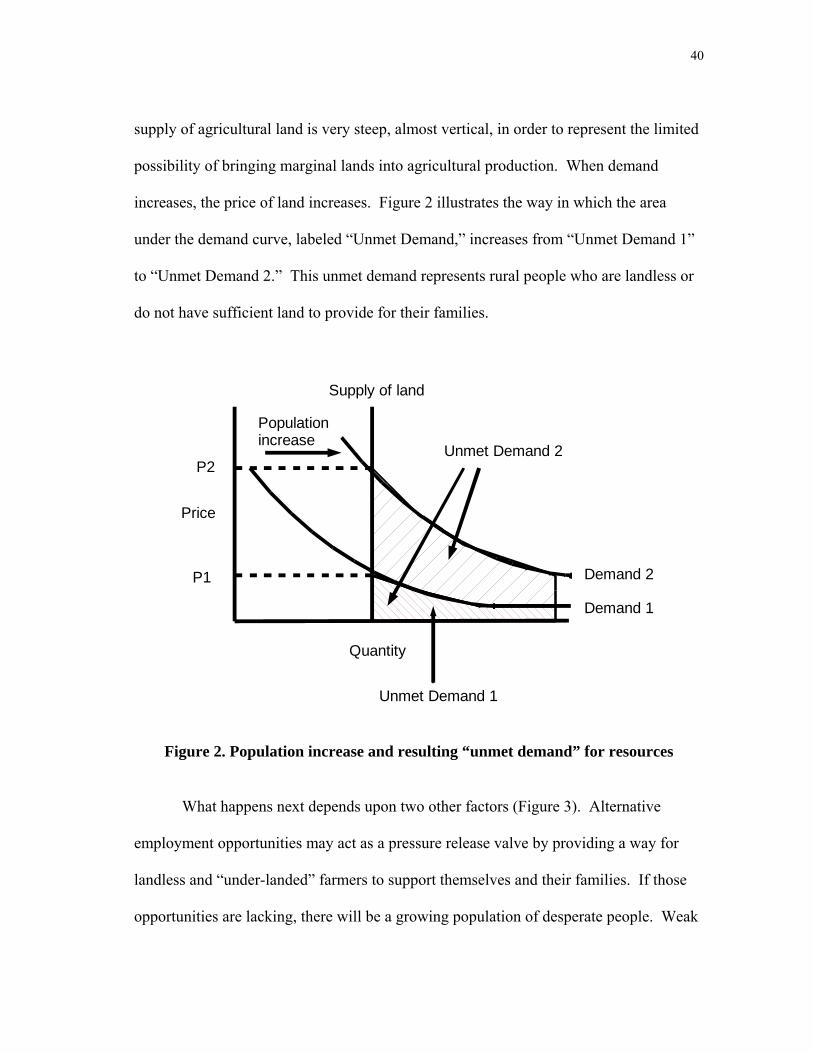
As population increases, the demand for scarce natural resources increases. This
is especially true in rural areas, where land and water are means of production. Figure 2
represents the increase in rural population as a rightward shift of the demand curve. The
40
supply of agricultural land is very steep, almost vertical, in order to represent the limited
possibility of bringing marginal lands into agricultural production. When demand
increases, the price of land increases. Figure 2 illustrates the way in which the area
under the demand curve, labeled “Unmet Demand,” increases from “Unmet Demand 1”
to “Unmet Demand 2.” This unmet demand represents rural people who are landless or
do not have sufficient land to provide for their families.
Quantity
Price
Demand 1
Demand 2
P2
Supply of land
P1
Population increase
Unmet Demand 1
Unmet Demand 2
Figure 2. Population increase and resulting “unmet demand” for resources
What happens next depends upon two other factors (Figure 3). Alternative
employment opportunities may act as a pressure release valve by providing a way for
landless and “under-landed” farmers to support themselves and their families. If those
opportunities are lacking, there will be a growing population of desperate people. Weak
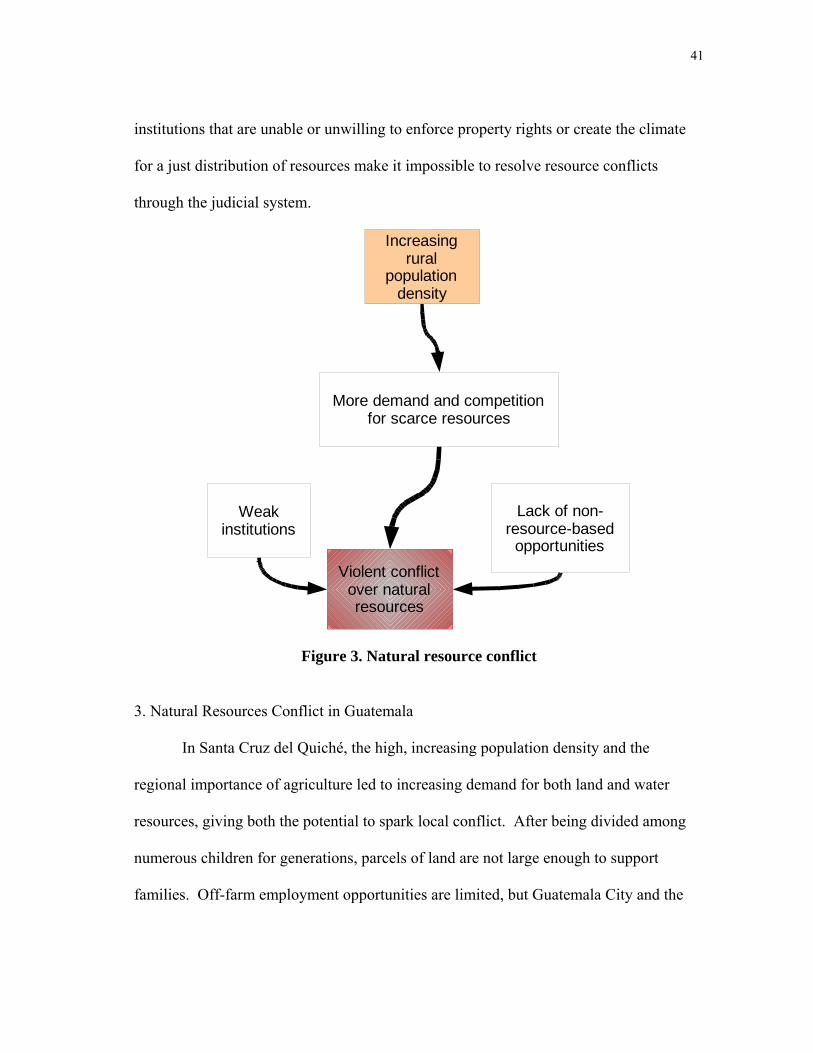
41
institutions that are unable or unwilling to enforce property rights or create the climate
for a just distribution of resources make it impossible to resolve resource conflicts
through the judicial system.
Increasing rural
population density
More demand and competition for scarce resources
Violent conflict over natural resources
Weak institutions
Lack of non-resource-based
opportunities
Figure 3. Natural resource conflict
3. Natural Resources Conflict in Guatemala
In Santa Cruz del Quiché, the high, increasing population density and the
regional importance of agriculture led to increasing demand for both land and water
resources, giving both the potential to spark local conflict. After being divided among
numerous children for generations, parcels of land are not large enough to support
families. Off-farm employment opportunities are limited, but Guatemala City and the

42
United States are able to relieve some of the social pressure by providing employment.
The Guatemalan government has repeatedly shown itself unwilling to undertake major
land reform, and the judicial system and police force are corrupt. Based on these
conditions, two hypotheses are formed: H1A: Farmers of Santa Cruz del Quiché perceive
that water is a source of conflict, and H1B: Farmers of Santa Cruz del Quiché perceive
that land is a source of conflict.
4. Methods
Interview questions 56 and 57 are used to address the hypotheses H1A and H1B.
The interview questions asked if there had been local conflicts or disagreements over the
use of water and land. A “yes/no” answer was recorded, and if the respondent replied in
the affirmative, the interviewer followed-up by asking what happened and how the
conflict was resolved. The percentage of affirmative answers to each of these questions
is reported, as well as selected responses that illustrate the particular conflict, or lack of
conflict, that occurred.
5. Results
Table 6 presents the results of testing hypotheses H1A and H1B. There is some
support for both hypotheses, albeit not overwhelming. Approximately one-third of
respondents said that water use had been a source of disagreement or conflict. The
percentage was higher in the communities of Xatinap I and San José Pachó Lemoa,
where 42% (5 of 12 cases) and 46% (6 of 13 cases) of respondents answered in the
affirmative.

43
Table 6. Perception that water and land are sources of conflict (N = 81)
Frequency Percent Yes 27 33% No 29 36% Water Conflict
Question 56 NA 25 31% Yes 8 10% No 53 65%
Land Conflict Question 57
NA 20 25%
Some of the respondents provided detail on water use issues in their
communities. The following explain water regulation: “There’s a water construction
committee, and a maintenance one, too. So there’s a work party, but some people don’t
go. If they don’t go three times, they lose their right to water for two or three months”
(#36); “Every ten years there is a potable water project. If you don’t sign up, you don’t
have the right to the water of your father, or brother, etc. You have to get water from
somewhere else. If you want to use the water from your family, the rest of the
community will not be in agreement. The conflict remains at the level of discussions”
(#2). Both of the aforementioned conflicts arose from the noncompliance of certain
individuals with decisions made by their communities. In both cases, though, water
remains at the heart of the issue. If there hadn’t been competition for the scarce water
resource, the community water regulation organizations would not have been formed,
and the conflict brought about by noncompliance would not have arisen.
Many respondents maintained that the conflicts associated with water do not
become violent. Instead, they remain at the level of “discussions.” An exception to this
was the community of Xatinap I, which actively protected its water from being taken for

44
other uses: “They wanted to take our water. We protested and the water stayed. When
we went to protest, they said we were going to burn something, but we just protested.
It’s our right” (#50), “They said they would take it somewhere else. The neighbors
didn’t agree that they take the water. They got together and the water wasn’t taken
elsewhere because they completed documents and protested” (#51).
For the most part, conflicts about water use had to do with home consumption
rather than agricultural use. The lack of conflict over water for agricultural purposes is
explainable, because during the rainy season there is ordinarily sufficient water for crops
without resorting to irrigation, and during the dry season, water is in such short supply
that irrigation is prohibited.
Only one-in-ten people said that land had been a source of conflict or
disagreement. A typical response to this question was: “No, because everyone has their
own land” (#211). Nevertheless, there were responses such as “Sometimes people move
the boundary stone to increase their land” (#2), and at least one person identified the
civil war as engendering land-based conflict because of the loss of land titles: “If you
don’t have the legal papers? Parents buried the papers. They killed the parents. The
people who were left didn’t know where the papers were” (#5).
6. Discussion
Water is clearly a source of conflict for many farmers in Santa Cruz, though not
necessarily for agricultural purposes. Residents have developed methods to deal with
water use issues, such as “well associations” and restrictions on what the water can be
used for, and who can use it. However, the water projects can themselves be sources of

45
conflict, as one respondent explained: “Through the projects there are many
disagreements. Some say that other people use more water, and there isn’t enough for
other people” (#39). Others responded that conflict arises because other people misuse
water (#211), or don’t pay for using a community well (#228). The rapid population
growth in Santa Cruz is likely to increase demand for water, creating the potential for
elevated conflict levels in the future.
Surprisingly, land was not frequently mentioned as a source of conflict. This was
contrary to expectations, because Guatemala’s civil war is often linked with land conflict
by commentators. In addition, peasant land invasions of large plantations continue to be
reported in the national newspaper, and the amount of land held by the average
interviewee is not enough to support a family. So, why wasn’t land more frequently
mentioned as a source of conflict? It is possible to speculate, but there is no clear
answer. Perhaps land conflict is not as serious a problem as is often reported. Perhaps it
is a less serious problem in Santa Cruz than in other parts of the country. Or, perhaps
the poverty caused by insufficient landholding among farmers is interpreted by outsiders
as a problem of land, but seen by local residents more directly, as a problem of poverty.
While there is clearly an unjust distribution of land in Guatemala, where the land
distribution Gini coefficient is 0.84 (Guatemala, Instituto Nacional de Estadística,
2003b), articulating land as a source of conflict may be unlikely unless it has been taught
as such by activist leaders.
46
The following are additional responses with relevance to land and water
resources:
Sometimes there’s water, but it doesn’t get here anymore. Right now we’re in a well association. [The conflicts are] just discussions (#31). Each person has their limit and there’s no reason for someone to fight (#33). There were conflicts. Some had lots of land and others didn’t have any. People move the ‘monjon’ that marks the edge of the land (#37). No, [there isn’t conflict]. Every one has their hydrant (chorro). Before, everyone went to wash in the river (#40). They say that some people were going to buy mining company land. Some people tried to buy land for the mining company’s use. But the people “went on strike” (se pusieron en huelga) and prevented it (#53). Yes, [there is conflict], because the water must be taken care of and some people don’t use it well (#211). Yes, [there is conflict], because some people don’t pay because it’s a common hydrant (chorro) (#228).
C. Agriculture, Technology, and Survival Strategies During Conflict
Little by little we got some chickens and seeds, but you could only cook at night so that we wouldn’t be discovered because of the smoke. When the moon’s out, you can’t build a fire. Case 0928, Ixcán, Quiché, s.f. (ODHAG, 1998, p. 163)
1. Literature Review
Given that farmers living in conflict areas face high levels of risk, the risk
aversion literature may be expected to shed some light on the strategies farmers adopt
under such circumstances. However, based on his research in Southern Sudan, Deng
(2002) found that households tended to specialize their assets and livelihood activities

47
rather than diversify them in response to risk arising from exposure to civil war. Tofte
(2004) reports that the Aluakluak and Ngop peoples of Southern Sudan came to rely
more upon subsistence farming as a result of regional war. This change came in
response to the loss of markets and employment opportunities. Farmers also cultivated
the same fields for longer periods of time due to insecurity, and displaced people
depended upon fishing and the gathering of wild foods (Tofte, 2004).
Famine survival strategies is another area of research that may provide insight to
conflict survival strategies. Among rural Ethiopian peasants, famine survival strategy
causes a shift in thinking from a subsistence economy to a cash economy. Animals, for
instance, are sold for cash which is used to buy food (Rahmato, 1991). The crises
precipitated by conflict may cause similar reactions, though conflict may restrict certain
options that are available to the victims of famine. For example, while Ethiopian
peasants may travel longer distances than normal during famine in order to find a market
with better prices for both buying and selling (Rahmato, 1991), during conflict peasants
may be unable to attend local markets, let alone travel to more distant ones. Another of
the Ethiopian peasants’ famine survival strategies is to migrate in search of wage labor
(Rahmato, 1991). The strategy of selling one’s labor is also used by households in times
of conflict. Other conflict survival strategies include collecting wild foods, looking for
credit, and reducing consumption (Hussain and Herens, 1997). Meludu (2006) found
that Nigerian farmers adopted a number of survival strategies during conflict, including
relocation, a reduction of labor utilization, and the cultivation of new crops as a result of
not hiring labor, among others.

48
An interesting example of conflict survival strategies is that of the Guatemalan
Communities in Resistance (CPRs). The CPRs were composed of villagers in northern
Quiché who were forced by the Guatemalan army to flee their homes. They entered the
jungle where the army had difficulty locating them because of the terrain and the
presence of guerillas. Even so, vigilance was constant and danger was never far away,
forcing the communities to move from place to place for their own protection (ODHAG,
1998). The following testimony illustrates some of the challenges faced by the CPRs:
This went on for fourteen years, and the organization was born with the help of the refugees in Mexico. Little by little we got some chickens and seeds, but you could only cook at night so that we wouldn’t be discovered because of the smoke. When the moon’s out, you can’t build a fire. One time the people were desperate and built a fire during the day. A helicopter came and dropped bombs, but we went to one of our refuges and nobody died. Case 0928, Ixcán, Quiché, s.f. (ODHAG, 1998, p. 163).2
Individuals and communities left their homes in haste in order to save their lives,
but once in the jungle, they began to organize. Ironically, the communities fled from an
army that acted in the name of anti-communism, but it was in the jungle that
community-based work and distribution were developed as strategies to survive the
attacks of the army:
On repeated occasions, the army and the patrols destroyed the crops or carried off the harvest to cut off the food supply of the population that it considered combatant, that is, with the guerillas. The practice of collective work and the distribution of production were basic survival mechanisms, but with time they developed into teachings of new forms of distribution of work and community values. (ODHAG, 1998, p. 163).
2 All quotations from ODHAG, 1998 have been translated from Spanish by the thesis author
49
Agricultural changes were not limited to collective work. The CPRs stopped
hunting animals to avoid attracting the army’s attention, and the resultant proliferation of
animals meant greater agricultural losses. In response, the CPRs shifted production from
many small fields to a small number of large fields. This strengthened the transition to
collective work, as did the recurring displacement which weakened ownership claims
over particular plots of land (Falla, 1994). Collective agricultural work was done by
most men between 7 a.m. and 3 p.m. from Monday through Saturday. After 3 p.m., the
men collaborated with the women in “individual cultivation or personal interests”
(Manz, 1994).
In addition to organizational changes, desperation and insecurity led to changes
in diet, as the people searched for resources not traditionally used:
During five or six months without eating tortillas, we were dying of hunger, and because of that we began to eat lots of things that we found while walking, sometimes a little water, sometimes a banana was what we ate, and that’s why sometimes companions began to kill animals. For example, they ate snakes, mice, other animals, we even ate a horse. Why did our people have to go through things and eat things we could call undignified? Because of the conflict, the armed confrontation that is here. Case 2052, Chamá, Alta Verapaz, 1982. (ODHAG, 1998, p. 159).
Here, we ourselves looked for the solution to our life, that’s why we’re here, because here we think: we find the solution to our food and defend our life, because we can’t die of hunger because there were edible plants in that place, like the “mojón,” and other plants too. We thought: here are lands to work and we planted maize. Case 4079, Aldea Sumal, Quiché, 1984. (ODHAG, 1998, p. 184).

50
The army’s efforts to destroy the livelihood of the CPRs was more successful
with relation to corn than certain other crops. A witness explains:
The army cut the banana trees to the ground, but new shoots sprang up. It also cut down the cassava that had just been planted, but it also started sprouting again. The same happened to the sugar cane: The soldiers cut it to bits, but it began to grow again. More appear. That’s what happens to us—one dies, but more are on their way. (Falla, 1994, p. 176).
2. Conceptual Model
This model continues from the point where the model in section A ended.
Increasing marginal costs and decreasing demand lead to reduced equilibrium
agricultural output (Figure 4). Because the cost of agricultural labor has risen, farmers
may choose to abandon agriculture completely or to reduce the amount of agricultural
labor used. If they choose to reduce their labor, farmers may choose to employ new,
labor saving techniques, or they may find that it is optimal to switch to raising crops that
give higher returns to low quantities of labor input, represented by “Crop 2” in Figure 5.

51
Reduced agricultural labor
Shift to less labor intensive crops
Abandon agriculture
Increasing marginal costs, and decreasing
demand
Reduced equilibrium agricultural production
Use of labor-saving techniques
Figure 4. Conflict survival strategies

52
Labor
Yield Crop 2
Crop 1
Figure 5. Labor intensity of different crops 3. Conflict Survival Strategies in Guatemala
Individuals react differently to the adversity that conflict brings. During the civil
war, insecurity was clearly a part of life for Quiché residents, including farmers. How
did they react? Four hypotheses are suggested as possible responses by Santa Cruz
farmers, based upon the conceptual model presented above. The first is general in
nature: H2A: Santa Cruz farmers responded to the civil war by modifying their
agricultural practices. The second is more specific. Because of the personal danger
associated with working alone or in small groups, the following hypothesis is suggested:
H2B: Santa Cruz farmers reduced the amount of agricultural labor used during the civil
war. The third hypothesis builds upon the second. If agricultural labor is dangerous
during times of conflict, and if farmers reduce their risk by reducing the amount of time
invested in agricultural labor, they may choose to shift the focus of their efforts to
productive activities that require less labor. The hypothesis takes the following form:
H2C: Santa Cruz farmers shifted to less labor-intensive crops during the civil war. The

53
fourth and final response is hypothesized to happen under the most extreme conditions
of insecurity, H2D: Santa Cruz farmers abandoned agriculture during the civil war.
4. Methods
Interview questions 58 through 60 asked participants if they modified their
agricultural practices during the civil war, how their agricultural practices were modified
during the war, what agricultural difficulties they faced during the war, and how they
responded to these difficulties. Each participant’s answers to the questions were
classified in two ways. First, the way in which each farmer responded to the war was
placed in one of three exclusive categories: “Abandoned agriculture for one or more
seasons,” “Modified agriculture,” or “Did not change agriculture.” This classification
was used to examine hypotheses H2A and H2D by calculating the percentage of farmers
that responded in each of these fashions.
The second manner of classifying questions 58 through 60 included twelve non-
exclusive categories: “Crops destroyed,” “Difficult to work,” “Death in family,” “Did
not have own land,” “Difficult to buy inputs/sell outputs,” “Animals died,” “Sold
animals,” “Fear of losing a family member,” “Emigrated,” “Modified crops grown,”
“Other,” and “No problem.” Respondents were classified in multiple categories when
applicable. The “Difficult to work” category was used to examine H2B. The “Modified
crops grown” category was used to test H2C.
5. Results
Of the Santa Cruz farmers interviewed, more than one in five modified their
agricultural practices during the civil war (Table 7), providing support for H2A.

54
However, 21% is lower than expected, and the most common change was a reduction in
the amount of labor. Twice as many farmers (44%) reported no change to their
agricultural practices during the civil war. This will be discussed in more detail in the
following section.
Table 7. Response to the civil war. Categorization of questions 58 – 60 (N = 81)
Frequency Percentage Abandoned agriculture for one or more seasons 13 16%
Modified agriculture 17 21%
No change to agriculture 36 44%
NA 15 19%
Total 81 100% In addition to those farmers who modified their agricultural practices, a high
percentage (16%) of farmers completely abandoned agriculture, as hypothesized by H2D.
Many returned to agriculture after a year, but others did not return to agriculture for two
or more years.
As seen in Table 8, more than one fourth of all farmers reduced the amount of
agricultural labor used during the civil war, supporting H2B. One of the reasons for
reducing agricultural labor was that a death occurred in the family. Two examples of
this were previously mentioned in section A: “My father ‘disappeared’ when the maize
was ready to harvest. We went to the capital and when we came back, the paramilitaries
had taken the harvest. My mom cried. We didn’t have seeds anymore. We bought
seeds and planted, but it didn’t produce maize. We planted, but my brothers were little

55
and they didn’t worry about the maize...We didn’t have money to buy chemical
fertilizer...We put dead leaves on it but it didn’t produce” (#60), and “My dad died.
They killed him and we were left without a dad and we couldn’t do anything. We took
care of the land, but we couldn’t do it like him. Sometimes we didn’t have enough food
and we only ate once or twice per day” (#63).
Table 8. All reported impacts of the civil war upon farm families. Categorization of questions 58 – 60 (N = 81)
Frequency Percentage Animals died 3 4%
Sold animals 2 2%
Crops destroyed 3 4%
Modified crops grown 0 0%
Emigrated 6 7%
Did not have own land 2 2%
Difficult to buy inputs/sell outputs 5 6%
Difficult to work 18 22%
Reduced agricultural labor 21 26%
Fear of losing a family member 2 2%
Death in family 3 4%
Other 3 4%
No problem 34 42%
NA 18 22%
Total 119
Agricultural labor decreased when families completely abandoned farming, as
explained by the following respondents: “We couldn’t plant anymore because of fear,
fear of the armies because they say we are part of the guerilla, but we’re not. For one
year we didn’t plant” (#34), “You couldn’t work anymore for the fear. That’s why you
56
couldn’t care for the crops. There was a great persecution” (#42), and “We stopped
planting because of the violence” (#31).
Other farmers reduced the amount of time spent in the fields out of fear, but
continued to farm, as the following respondents explained: “The house burned. We
couldn’t travel to the capital or the coast to work. That’s why we sold the animals to get
money. We didn’t work much in the corn for fear of the army. A few went to a
different community to hide, and came back to work in the corn...We sold the animals
cheap, and others sold their land cheap. People went to the fields less” (#5), “We
stopped farming one area because there wasn’t time. There wasn’t time to work
anymore because the highway passes nearby, so the soldiers went by frequently” (#33).
Though some Santa Cruz farmers reported that their animals died or were sold
because of the conflict, there was a complete lack of support for H2C. No farmer
mentioned a change in the type of crops planted, nor a shift in the importance of one
crop over another.
6. Discussion
It is important to note that, with one exception, only people currently engaged in
farming were interviewed. For that reason, the sample excluded individuals who had
farmed previous to the war, but subsequently abandoned agriculture permanently. If
these individuals were included in the sample, the percentage of farmers who abandoned
agriculture would be higher.
Age had little if any impact on the percentage of people who reported no change
to their agricultural practices during the civil war. Table 9 shows that the 18-25 year-old
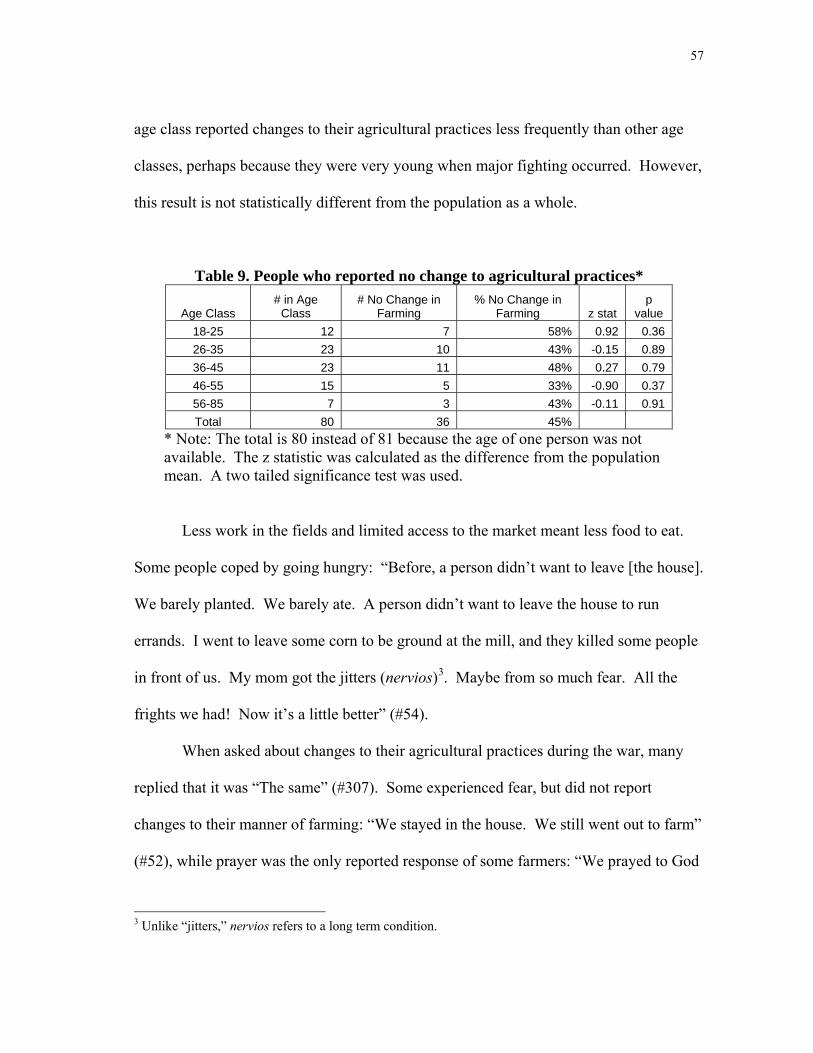
57
age class reported changes to their agricultural practices less frequently than other age
classes, perhaps because they were very young when major fighting occurred. However,
this result is not statistically different from the population as a whole.
Table 9. People who reported no change to agricultural practices*
Age Class # in Age
Class # No Change in
Farming % No Change in
Farming z stat p
value 18-25 12 7 58% 0.92 0.36 26-35 23 10 43% -0.15 0.89 36-45 23 11 48% 0.27 0.79 46-55 15 5 33% -0.90 0.37 56-85 7 3 43% -0.11 0.91 Total 80 36 45%
* Note: The total is 80 instead of 81 because the age of one person was not available. The z statistic was calculated as the difference from the population mean. A two tailed significance test was used.
Less work in the fields and limited access to the market meant less food to eat.
Some people coped by going hungry: “Before, a person didn’t want to leave [the house].
We barely planted. We barely ate. A person didn’t want to leave the house to run
errands. I went to leave some corn to be ground at the mill, and they killed some people
in front of us. My mom got the jitters (nervios)3. Maybe from so much fear. All the
frights we had! Now it’s a little better” (#54).
When asked about changes to their agricultural practices during the war, many
replied that it was “The same” (#307). Some experienced fear, but did not report
changes to their manner of farming: “We stayed in the house. We still went out to farm”
(#52), while prayer was the only reported response of some farmers: “We prayed to God
3 Unlike “jitters,” nervios refers to a long term condition.

58
that nothing would happen” (#225). Why did so many farmers report no change to their
agriculture? Was change not necessary, or were they unable to change? During the civil
war, much of the violence was targeted at community leaders. Those who were not
activists may have felt they had little to fear, and therefore no need to adapt their farming
practices. In some cases, such as the community of Cuarto Pueblo, in northern Quiché,
this false sense of security was the death of many people who were indiscriminately
killed by the army (Falla, 1994). What options did the farmers have, other than to
abandon farming? For those with few resources, there are few alternatives.
In addition to agricultural adaptations, some responses revealed alternative, non-
agricultural survival strategies. For instance, a weaver explained: “We looked for
markets we could get into. That’s why I didn’t have so much trouble to maintain my
family” (#42). This weaver was the previously mentioned exception to the rule that only
currently active farmers were interviewed. He had abandoned farming during the war
and never returned to it, perhaps because he already had a trade that was able to provide
for his family. It is likely that many other Santa Cruz farmers did the same, but were not
included in the survey because of the survey design. Another respondent (#115) sold
firewood to compensate for lost agricultural income. However, this man was from
outside the Santa Cruz municipio and is not included in the dataset.
What determined whether farmers chose to abandon, modify, or make no
changes to their agricultural practices? It appears that the most important factor was
fear. Extreme cases caused entire families to emigrate, abandoning their fields. Less
intense fear caused total or partial abandonment of fields, but did not lead families to

59
emigrate. Finally, for many families, fear was not enough of a deterrent to prevent them
from farming.
In light of the difficulties faced by farmers during the war, why did they not
switch to less labor intensive crops, as H2C suggested? If many people were unable to
work in their fields, why did so few report other income generating activities, such as
weaving or gathering firewood? The answer to both of these questions may be that they
lacked the opportunities to do so. Switching to alternative crops would require
knowledge of the crops and how to care for them, in addition to access to seeds and
other technology that may have been necessary. It is quite likely that all of these
ingredients were missing. In addition, switching to different crops requires foresight and
planning. Unless you anticipated having difficulty working in your fields, you would
not have reason to consider switching crops. The seasonality of agriculture means that
the decision to switch crops could be delayed by a full growing season.
Many farmers who emigrated to Mexico or other parts of Guatemala found
employment to support their families (Castañeda, 1998). Why didn’t more interview
respondents report using their excess labor in home based production activities? The
simplest answer is that the interview was specifically looking for agricultural strategies,
and may have overlooked non-agricultural adaptations, but there are probably other
explanations as well. Santa Cruz farmers were only partially integrated into the cash
economy, preferring to grow most of their own food. Complete reliance on a cash
income would have been unusual. However, the greatest obstacle was probably lack of
60
opportunity. Only the most fortunate would have had the combination of marketable
skills, capital, and market access necessary to engage in home-based production.
The following are additional responses relevant to survival strategies:
The community left its community because of the army. The army displaced them. Animals, people, and crops died. The people are now in a different place. They emigrated and were displaced (#4). [We overcame the difficulties of the war by] asking other people for seeds to plant (#37).
D. Agricultural Technology in Conflict Reduction and Prevention
The coming of a tool, then, can be a cultural event of great influence and power. Once that is understood, it is no longer possible to be simpleminded about technological progress. It is no longer possible to ask, What is a good tool? without asking at the same time, How well does it work? and, What is its influence? (Berry, 1981, p. 105-106)
1. Literature Review
Agricultural technology may be able to prevent or end conflict through both
indirect and direct means. The possibility of directly preventing or ending conflict will
be addressed in the “Discussion” of this section. The indirect influence is suggested by
Indra de Soysa and Nils Petter Gleditsch (1999), of the International Peace Research
Institute, Oslo, in their report on agriculture and conflict. They conclude: “Building
peace and prosperity will require greater attention to the role of agriculture in creating
livelihood, resurrecting development, alleviating poverty, and breaking the vicious cycle
of violent conflict and scarcity” (p. 60). More recently, although Per Pinstrup-Andersen
(2006) admits that there is no consensus on the issue of poverty as a cause of conflict, he

61
hypothesizes that technological change in agriculture leads to improved nutrition,
reduced poverty, and sustainable natural resource management, which in turn lead to
reduced armed conflict and terrorism (Figure 6).
Figure 6. Technological change reduces conflict and terrorism
Based on Pinstrup-Andersen (2006)
If Pinstrup-Andersen, de Soysa, and Gleditsch are correct, Norman Borlaug has
certainly prevented a number of conflicts through his efforts to develop and disseminate
agricultural technology. The technologies of the Green Revolution, which include
improved crop varieties, chemical fertilizer, herbicide, insecticide, and the increased use
of irrigation, saved millions of people from starvation and hunger. Indeed, Borlaug
himself believes in the poverty-conflict connection, as he often quotes fellow Nobel
laureate Lord John Boyd Orr as saying “you cannot build peace on empty stomachs”
(Borlaug, 1970). The United Nations has also endorsed this view in a recent Human

62
Development Report: “Failure to address pastoral destitution has encouraged the
institutionalization of violent conflict and raiding as part of pastoralism in Karamoja”
(United Nations Development Program, 2005) and in at least one other document:
Linking agricultural technology development and application to poverty alleviation and eventually to peace requires taking into account the needs of those farmers who are vulnerable to shocks of various kinds and have low ‘opportunity cost’ in turning to violence...It will be important to develop a range of technology to address issues of scale- and location-sensitivity. Likely technologies for such areas include the improvement of farming systems of arid and semi-arid lands. These include traditional drought-tolerant crops, such as millet, sorghum, and barley as well as small- and large-ruminant livestock systems. In crop management, moisture- and soil-conserving technologies are important lines of research and development, including conservation tillage, water harvesting and small-scale irrigation systems. (United Nations University Institute of Advanced Studies, 2004, p. 17)
2. Conceptual Model
The conceptual model builds upon that of Pinstrup-Andersen (2006). Figure 7
illustrates how technological change may increase or decrease armed conflict. The
upper portion of the figure will be discussed in the following section. The lower portion
of the figure traces the process by which technology may reduce conflict. Advances in
agricultural technology provide opportunities for improvements in nutrition, natural
resource management, and the reduction of poverty. Improvements in these three areas
increase the opportunity cost of conflict and consequently lead to societies with less
armed conflict and terrorism.

63
Traditional or high-tech methods of plant breeding may produce more crops with
higher vitamin levels, for example, improving the health of those who eat them.
Nutrition may also be improved by agricultural technology that produces higher yields
per unit area of land, if the farm family chooses to consume the increased production.
Alternatively, if the extra production is sold, income is increased. Other technologies
that increase efficiency may not increase production, but rather reduce costs. Such
technologies increase profits and reduce poverty. Agricultural technologies that
contribute to sustainable resource management may provide environmental stability or
enhancement, meaning that environmental resources may continue to provide benefits to
those using them in the future. Sustainable natural resource management prevents the
deterioration of wealth and the forced migration of farmers who must abandon land that
has become unproductive.
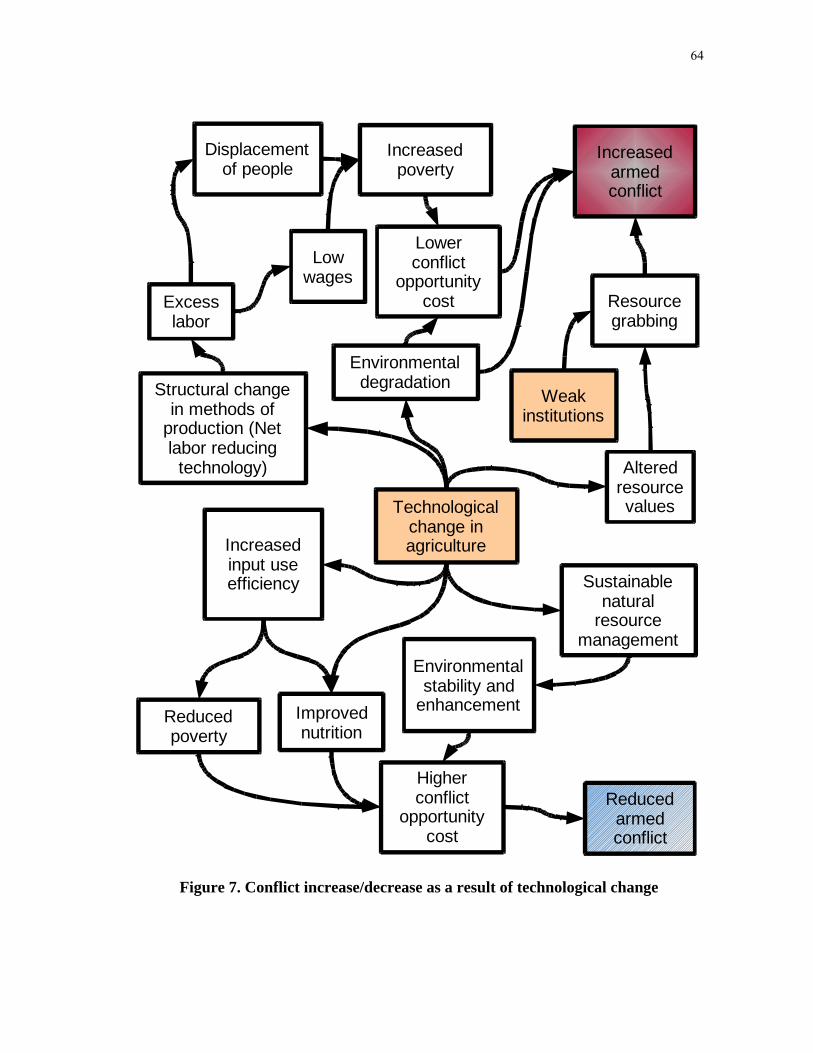
64
Technological change in agriculture
Environmental stability and
enhancement
Sustainable natural
resource management
Reduced armed conflict
Higher conflict
opportunity cost
Reduced poverty
Improved nutrition
Increased input use efficiency
Excess labor
Low wages
Structural change in methods of
production (Net labor reducing
technology)
Environmental degradation
Increased armed conflict
Increased poverty
Displacement of people
Lower conflict
opportunity cost
Altered resource values
Weak institutions
Resource grabbing
Figure 7. Conflict increase/decrease as a result of technological change

65
3. Conflict Reduction and Prevention in Guatemala
Though much more traditional than U.S. agriculture, Santa Cruz agriculture has
undergone a number of technological changes during the lifetimes of the current
generation, such as the use of synthetic fertilizers, herbicides, insecticides, and animal
vaccination. By increasing production per unit area, it is hypothesized that these or other
technologies may have eliminated or prevented conflict by their use. The hypothesis is
formally stated as H3: Agricultural technologies newly introduced to Santa Cruz have
prevented conflict through the alleviation of poverty and the reduction of competition for
natural resources.
4. Methods
There is an inherent methodological difficulty in measuring an event that does
not occur. How do you know when a conflict has been prevented? It would be possible
to set up an experiment in which a technology was introduced to various locales where
the level of conflict was measured before and after introduction. However, this type of
experiment would likely be extremely costly and time consuming, making it impossible
for this study. For that reason, a very direct approach was used—after farmers had
explained the changes that had occurred in agriculture, they were asked if the changes
had helped to resolve any conflict (question 36) or if there would have been more
conflict if the changes had not occurred (question 37). Lacking a measure of conflict,
farmers’ perception of conflict was used as a proxy for conflict. The first question relied
on the farmers’ perceptions of what happened, and the second required farmers to
speculate about events that did not occur.

66
5. Results
Both questions demanded critical thinking and an attempt to link events - new
agricultural technologies and social conflict-- that are not typically considered to be
closely related. This would present a challenge for anybody, well educated or not, and
the questions appeared to be difficult for many respondents, who, after a confused
expression on their faces, shook their heads and said “no.” Of the eighty-one individuals
in the survey, less than thirty answered both of the questions (Table 10). The small
number of responses was usually caused by one of two problems: 1) because the
respondents were confused by the questions, or 2) because the respondents did not report
any changes to their agricultural practices, rendering the questions irrelevant. In most
cases where the individual responded in the affirmative, they were either unable or
unwilling to provide further explanation, or they provided an explanation that displayed
a lack of understanding of the question’s intent. One such response was, “There would
be more dead animals [without vaccination]” (#39). As always, there were some
exceptions. One of these was the man who replied that corralling animals was a
technology that prevented conflict with neighbors, because the animals were prevented
from wandering onto others’ property (#37).

67
Table 10. Perception that technologies resolved or prevent conflict (N = 81) Frequency Percent
Yes 6 7%No 14 17%
Did the changes help to resolve any conflicts (question 36) NA 61 75%
Yes 8 10%No 19 23%
If the changes had not happened, would there have been more conflict? (question 37) NA 54 67%
6. Discussion
While the indirect impact of agricultural technology upon conflict is uncertain
because of doubt about the link from poverty to conflict, the question of a direct link
from agricultural technology to conflict prevention has gone almost unasked. Can
agricultural technology play a direct role in conflict prevention? For instance, could
advanced breeding techniques produce crops with low moisture requirements that would
eliminate the threat of “water wars?” Could they develop a hardy, fast growing shrub
used as a boundary marker to reduce disputes over land ownership? Could more
efficient irrigation and water harvesting technologies reduce local competition for scarce
water resources? The question is not whether these technologies can be developed—
many such technologies already exist or are under development. The question is
whether or not they could prevent or end conflict, and whether they have done so in the
past.
One such example provided by history follows. In the 1850’s and 1860’s,
southern U.S. cattle herders were met with violence as they drove their cattle north. The
cause was babesiosis, also known as “Texas Fever.” Southern cattle had developed

68
resistance to this tick-borne disease, but when northern cattle herds came into contact
with southern cattle or the pastures they had occupied, the northern herds were
devastated by the sickness. Some northerners reacted violently, barring the southerners
and their herds passage into their territory. Sometimes these conflicts resulted in death.
Eventually, laws were established to prevent the southern cattle from coming north, but a
final resolution was not achieved until Texas Fever was eradicated by “dipping” cattle in
chemical solutions that killed the ticks (Strom, 2000; Hope, 2005).
We may look to the future for validation of another example. It has been argued
that the genocide in Rwanda was set in motion by the crash of the price of coffee in the
1980’s (Verwimp, 2002). Figure 8 shows how highly dependent Rwanda has been on
coffee to provide it with foreign exchange. Figure 9 shows the correlation of falling
coffee prices with conflict intensity, as well as the unstable price history of commodity
coffee. Since 2001, Dr. Tim Schilling has lead an international effort to transform the
way coffee is processed and marketed in Rwanda. By linking coffee growers to
cooperative processing centers rather than processing coffee in their own homes, the
growers are able to sell a premium product on the specialty coffee market. This is
important because specialty coffee not only sells at a higher price, but also because its
price is more stable than that of commodity coffee (Schilling, 2006). By introducing
new processing technology and linking farmers more directly to their markets, Dr.
Schilling is helping to reduce the country’s reliance on the price of commodity coffee,
and may also be contributing to Rwanda’s stability.

69
0
20
40
60
80
100
120
140
160
180
200
19641974
19841994
2004
Cur
rent
U.S
. $ (M
illio
ns)
Totalmerchandiseexports
Coffeeexports
Figure 8. Rwanda’s total merchandise exports and coffee exports
Sources of data: WTO, 2006; FAOSTAT, 2006

70
0
1
2
3
1964 1974 1984 1994 2004Year
Conf
lict I
nten
sity
0
50
100
150
200
250
300
350
400
Pric
e
Conflict Intensity
Indexed CoffeePrice (2000 = 100)
Figure 9. World coffee price and Rwandan conflict intensity*
Sources of data: United Nations Conference on Trade and Development, 2006; Gleditsch, et al., 2002
* Conflict intensity is measured on a scale from 0 to 3. In order to be scored as a level one conflict, at least 25 battle-related deaths must have occurred in a given year, for a given conflict. This means that, even for years that are scored 0, there may have been low levels of conflict. Level two conflicts include “more than 25 battle-related deaths per year and a total conflict history of more than 1000 battle-related deaths, but fewer than 1,000 per year,” and level three conflicts include conflicts with “at least 1000 battle-related deaths per year.” For more detail on this data, see Gleditsch, et al. (2002) and Strand, et al. (2005).

71
E. Agricultural Technology as a Cause of Conflict
Although technology can be viewed as having a sociopolitical neutral core – as the neutralist argues – in fact much more than a technological core is transferred. The additional components of the transfer are, at the least, values which suggest how requirements generated by the core technology are to be met and, at the most, actual social, political, economic, and technological strategems [sic] for meeting these requirements. (Levy, 1982, p. 281)
1. Literature Review
Agricultural technology, Tefsa Gebremedhin (1996) reminds us, is a means
rather than an end -- the correct choice of technologies “can make a large difference in
the quality of life, health, safety, productivity, equity, and stability of society” (p. 209,
emphasis added). Case studies revealing a connection between agricultural technology
and conflict have been carried out by a number of researchers. The western Sahel,
including the countries of Mali, Burkina Faso, and Niger, was the site of drought and
famine in the final decades of the twentieth century; consequently it has been a recipient
of development aid, including projects such as the construction of dams, boreholes, and
expanded irrigation. Keith Moore’s (2005) study explains that while the previously
mentioned development efforts have led to improvements in production, they have also
increased conflict in an area where competition for access to water and arable land is
increasing. Irrigation projects have led to expanded cultivation along water access
routes, such as streams and wetlands. Livestock corridors, where cultivation is
prohibited in order to allow livestock to pass from one place to another, are provided for
in theory; in practice, however, nomadic herders find that access to water for their
livestock has been cut off by new fields, and that old migration routes enriched with

72
animal manure have come under cultivation. Multiple deaths have occurred from the
resulting conflicts and the situation has been further complicated by ethnic differences
(Moore, 2005).
Increasing irrigation agriculture has had similar results in Ethiopia as pastoralists
such as the Afar and Karrayu have been forced from their land. In contrast to the
farmer-herder conflicts of the western Sahel, the displacement of pastoral groups in
Ethiopia resulted in increased competition between pastoral groups, rather than with
farmers. At times, this conflict has "inflicted heavy losses of life and property on the
competing pastoral groups" (Gebre, 2001). A further twist in the difficulties faced by
the Afar and Karrayu is that their land was seized not only for its agricultural potential,
but also for its value as a national park (Gebre, 2001; Kassa, 2001). Thus, they find
themselves competing for land with two interest blocs, rather than one.
Another example occurred in the Sahel, where dams built in Mali and Mauritania
nearly led to an interstate war during the late 1980s. As land values along the Senegal
river increased in anticipation of the dams' construction, the Mauritanian elite "rewrote
legislation governing land ownership, effectively abrogating the rights of black Africans
[ethnically Senegalese] to continue farming, herding, and fishing along the Mauritanian
riverbank” (Homer-Dixon, 1994, p. 12). The killing of a number of farmers led to
retaliations in Senegal, and hundreds of people were killed in both countries.
Furthermore, the Mauritanians stripped ethnically Senegalese farmers of their citizenship
and seized their riverside property (Homer-Dixon, 1994). A similar case occurred in the
Sudan when elite Sudanese expanded mechanized agriculture into Southern Sudan and,

73
in the process, drove off the smallholders already there, many of whom went on to join
rebel forces in their struggle against the government (de Waal, 2005).
Africa is not the only continent to provide examples of agricultural technology
causing conflict. At the end of the 19th century, the American West was fenced in by a
new invention – barbed wire. This technology was both a symbolic and a physical
boundary designed to prevent the free movement of animals. Some men resisted this
control over access to the free range and its resources by cutting the wire fences built by
others. “Warfare” had begun (Netz, 2004, p. 32). In central Texas, farmers and small
ranchers cut the fences of larger cattlemen, but eventually “lost the battle against the
broader trend” (Brown, 1996). Also resulting in violence ranging from vandalism to
murder, was the unhappy ending to the story of Texas Fever. Though mandatory
“dipping” of cattle eradicated the disease in the southern U.S. and ended the North-South
conflict over the issue, the technological solution also caused problems. Resistance to
cattle dipping primarily came from southern smallholders, for whom the expense of
cattle dipping was prohibitive and represented a threat to their livelihood (Strom, 2000;
Hope, 2005).
According to George Collier (2005), the introduction of synthetic fertilizers and
herbicides in Chiapas, Mexico, altered the structure of agriculture. Relatively wealthy
farmers with enough money to purchase the new inputs rented land from poorer farmers,
and then hired the poor farmers to work on their own land! Use of chemical inputs
reduced the amount of agricultural labor required, and the depressed demand for labor
resulted in unemployment, contributing to hardships “comparable to the circumstances

74
that led Rolando, a major in the EZLN, to join the rebel army around 1986” (Collier,
2005, p. 104). Chemical herbicide allows weeds to be controlled in less time than it
would take to weed by hand – it substitutes capital for labor. However, the
aforementioned example from Chiapas should be considered carefully, because it is
questionable whether the use of agricultural chemicals reduces the overall demand for
labor. In fact, the use of agricultural chemicals can actually increase the quantity of
labor demanded in one of two ways. First, the application of insecticide requires
additional labor. Second, using agricultural chemicals, including herbicide, insecticide,
and fertilizer, usually increases agricultural productivity per unit area. Increased
productivity means that more labor is required to harvest the crop. It also means an
increase in the amount of money in the local economy, which may lead to increased
employment.
Mechanization of the California tomato harvester in the mid 20th century led to
the displacement of farm laborers and small farmers (Hightower, 1973), but widespread
conflict did not occur, perhaps because of the strength of the U.S.’s institutions.
Introduction of the cotton picker in the U.S. around the same time eliminated many
unskilled jobs and led to “massive migration of often poorly educated people...from the
South’s cotton farms” (Dorner, 1983), but it was the adoption of the cotton gin in the
early 19th century that increased the incentive to grow cotton, strengthened the plantation
system, and “set several forces in motion which led to the Civil War” (Rasmussen, 1977,
p. 296).

75
Rapid advances are being made in biotechnology by using methods that include
rDNA techniques and cell fusion techniques, but despite the benefits these technologies
promise, there may be reason for concern as well. Busch et al. (1991) point to the
potential development of substitutes for agricultural commodities currently grown in the
developing world. For countries that depend upon a small number of export crops,
losing the market for one of them could have serious consequences, even leading to
political instability (Busch et al., 1991).
Though not focused on agricultural technologies, there has been much recent
research into the causes of civil war. Collier and Hoeffler (2004) found that countries
with high proportion of primary commodity exports, with respect to GDP, were at higher
risk of civil war, but it has been argued that this result is “quite fragile” (Fearon, 2005).
In any case, food and non-food agriculture were among the commodity exports
considered, but Collier and Hoeffler found that “Of the many potential disaggregations
of primary commodity exports permitted by this data, only one was significant when
introduced into our baseline regression, namely oil versus non-oil” (p. 580). In other
words, reliance upon agricultural exports was not found to put countries at significantly
greater risk of civil conflict.
2. Conceptual Model
The conceptual model for this section is illustrated by the upper portion of Figure
6, where the pathways are similar to those in the lower portion of the figure, but the
outcome is, of course, more conflict rather than less. Agricultural technologies that
degrade the environment reduce its ability to provide for people in the short term, long

76
term, or both. Environmental degradation may also cause conflict more directly, as
when the harmful environmental practices of one farmer cause losses for neighbors, such
as poor water quality or a suitable environment for invasive species.
Some impacts that should have positive consequences, such as technologies that
increase the value of water and land resources by increasing their marginal production,
can have negative consequences when accompanied by weak institutions that are unable
to uphold property rights. The combination of these factors creates a situation in which
powerful members of society may become “resource grabbers,” by attempting to take
control of resources that were not worth their time before the introduction of the new
technology.
The most complex path to increased armed conflict in the upper portion of the
figure begins with technological changes that cause structural change in the methods of
production. A prime example of this, is technology that has the effect of reducing net
labor demand. Conflict may be avoided if agricultural laborers can turn to an alternative
means for their livelihood. In any case, the wage rate will fall as the demand for labor
declines. If local employment alternatives are not available, farmers will be forced to
emigrate in search of work. Both displacement and lower wages have the impact of
increasing poverty. Increased poverty and environmental degradation both decrease the
opportunity cost of conflict, making armed conflict a more attractive option.
3. Agricultural Technology as a Source of Conflict in Guatemala
The foregoing studies suggest that agricultural technologies can be a direct
source of conflict. Modern agrochemicals, such as those used in Santa Cruz, are
77
sometimes accused of causing environmental damage. If the accusation is true, farmers
who use them may experience more conflict with their neighbors. The following
hypothesis is proposed to see if agricultural technologies have had a direct impact on
conflict: Santa Cruz farmers who use nontraditional agricultural technologies perceive
higher levels of conflict. A second, similar hypothesis is also suggested. For the second
hypothesis, the word “conflict” is replaced by the word “crime.” This is done out of the
belief that vandalism and crimes of vengeance may be manifestations of conflict
associated with the use of a particular agricultural technology. The individual using the
technology may perceive this type of criminal act as crime, rather than “conflict”
associated with their use of the technology. The hypothesis is stated thus: H4B: Santa
Cruz farmers who use nontraditional agricultural technologies perceive higher levels of
crime.
4. Methods
To test H4A and H4B, two relationships were estimated by regression, with
perception of conflict and perception of crime as the dependent variables. The indices
for perception of conflict and crime were created using principal components analysis, as
described in Chapter II.
Independent variables used in the regression to test H4A included the following:
Demographic
Microcredit – 1 if a participant in microcredit, 0 if not
Total_Owned – Amount of land owned, measured in cuerdas. This variable is included
as a proxy for wealth.

78
Gender – 1 if female, 0 if male
Ed_Elementary – 1 if the highest educational level was elementary school, 0 otherwise
Ed_Middle_Plus – 1 if the highest educational level was middle school or above, 0
otherwise
Lan_Spanish – 1 if the respondent’s native language was Spanish, 0 otherwise
Lan_Kiche_and_Spanish – 1 if the respondent considered both K’iche’ and Spanish to
be native languages, 0 otherwise
Language variables are included as a proxy for ethnicity. The proxy for wealth
(Total_Owned) and the proxy for ethnicity (Lan_Spanish and Lan_Kiche_and_Spanish)
were somewhat correlated. However, the correlation was not strong enough to prevent
running the regression.
Researcher
Research_2 – 1 if the interview was conducted by researcher #2, 0 otherwise
Research_3 – 1 if the interview was conducted by researcher #3, 0 otherwise
Research_4 – 1 if the interview was conducted by researcher #4, 0 otherwise
*Research_1 was the author
Technologies Used
Vaccinate – 1 if the respondent vaccinated at least one agricultural animal, 0 otherwise
Herbicide – 1 if the respondent used herbicide, 0 otherwise
Insecticide – 1 if the respondent used insecticide, 0 otherwise

79
Chemical_Fertilizer – 1 if the respondent used chemical fertilizer, 0 otherwise
A logistic regression was run, using equation G described in Chapter II:
G(z) = exp(z)/[1 + exp(z)]
where z is equal to:
α + β1 * Microcredit + β2 * TotalOwned + β3 * Gender + β4 * Ed_Elementary + β5 * Ed_Middle_Plus + β6 * Lan_Spanish + β7 * Lan_Kiche_and_Spanish + β8 * Research_2 + β9 * Research_3 + β10 * Research_4 + β11 * Vaccinate + β12 * Herbicide + β13 * Insecticide + β14 * Chemical_Fertilizer
Stepwise deletion was used to eliminate variables with extremely high standard
errors because the algorithm was unable to converge on a solution. This presents
methodological problems because the user does not know if they have removed the
correct variable. Also, once a variable included in the theoretical model has been
removed from the regression, the significance of the coefficients of the remaining
variables is diminished and unclear. Three variables were removed in the following
order: Herbicide, Chemical_Fertilizer, and Research_2.
To test H4B, only minor changes were made to the process described above. The
dependent variable was the crime index, and the independent variables were the same as
in the previous regression. As before, a logistic regression was run, but it was not
necessary to use stepwise deletion because none of the variables suffered from extremely
high standard errors.
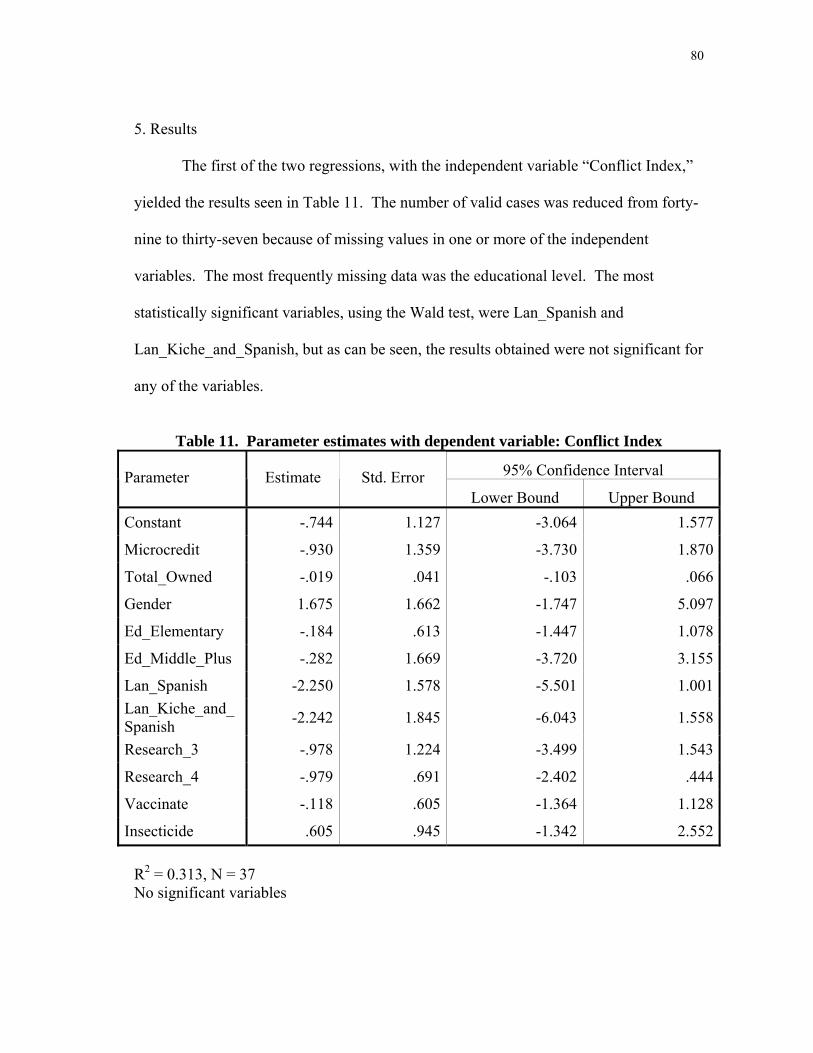
80
5. Results
The first of the two regressions, with the independent variable “Conflict Index,”
yielded the results seen in Table 11. The number of valid cases was reduced from forty-
nine to thirty-seven because of missing values in one or more of the independent
variables. The most frequently missing data was the educational level. The most
statistically significant variables, using the Wald test, were Lan_Spanish and
Lan_Kiche_and_Spanish, but as can be seen, the results obtained were not significant for
any of the variables.
Table 11. Parameter estimates with dependent variable: Conflict Index
95% Confidence Interval Parameter
Estimate
Std. Error Lower Bound Upper Bound
Constant -.744 1.127 -3.064 1.577
Microcredit -.930 1.359 -3.730 1.870
Total_Owned -.019 .041 -.103 .066
Gender 1.675 1.662 -1.747 5.097
Ed_Elementary -.184 .613 -1.447 1.078
Ed_Middle_Plus -.282 1.669 -3.720 3.155
Lan_Spanish -2.250 1.578 -5.501 1.001Lan_Kiche_and_ Spanish -2.242 1.845 -6.043 1.558
Research_3 -.978 1.224 -3.499 1.543
Research_4 -.979 .691 -2.402 .444
Vaccinate -.118 .605 -1.364 1.128
Insecticide .605 .945 -1.342 2.552 R2 = 0.313, N = 37 No significant variables

81
The second of the two regressions, with the independent variable “Crime Index,”
yielded the results seen in Table 12. The number of valid cases was reduced from
seventy-six to fifty-seven because of missing values in one or more of the independent
variables. Four variables were significant using a Wald test: Microcredit, Lan_Spanish,
Research_4, and Chemical_Fertilizer. Microcredit was negatively signed while the
other three variables were positively signed.
Table 12. Parameter estimates with dependent variable: Crime Index
95% Confidence Interval Parameter
Estimate
Std. Error Lower Bound Upper Bound
Constant -.224 .976 -2.193 1.746Microcredit** -2.515 1.023 -4.580 -.450Total_Owned -.029 .031 -.092 .034Gender 1.173 .891 -.626 2.972Ed_Elementary -.075 .317 -.716 .565Ed_Middle_Plus -1.249 .798 -2.860 .362Lan_Spanish** 1.342 .637 .057 2.628Lan_Kiche_and_ Spanish* .943 .569 -.205 2.091
Research_2 .191 .688 -1.198 1.580Research_3 -.175 .563 -1.312 .962Research_4* .678 .355 -.039 1.395Vaccinate .074 .337 -.607 .754Herbicide -1.050 1.059 -3.187 1.086Insecticide -.538 .419 -1.384 .307Chemical_ .Fertilizer* 1.706 .902 -.114 3.526
R2 = 0.374, N = 57 ** significantly different from 0 at the 0.05 level

82
* significantly different from 0 at the 0.1 level A test was also run to check the correlation between the crime and conflict
indices. The results, presented in Table 13, show very little correlation.
Table 13. Correlations
Conflict Index
N = 49
Crime Index
N = 76
.070
N = 47
6. Discussion
The most surprising of the results is that the correlation between the crime and
conflict indices is extremely weak. One possible explanation for this is that perceptions
of crime and conflict are not, in fact, closely related. This would be the case if people
are able to accurately distinguish between common criminal activity and the
manifestations of conflict between two or more parties, or it could mean that conflict is
unlikely to translate into criminal activity. An alternative explanation is that there were
methodological errors. Crime is a tangible concept—a person is typically aware of
having been the victim of a crime. Reports of crime appear in the newspaper every day.
Conflict, on the other hand, is much more abstract if it does not result in physical action.
Even when it does result in physical action, it may be difficult to connect the physical
action to the underlying conflict. Therefore, naming conflict is much more difficult than
naming crime. In the case of this study, the issue was further complicated by language
83
barriers. Many people who were interviewed in Spanish had difficulty understanding
what was meant by the word conflict, presumably because Spanish was not their first
language. For example, when asked if there was any conflict as a result of changes in
agriculture (question 35), one person replied affirmatively, and when asked for detail,
said, “Who knows what happened? (¿Saber qué pasó?)” (#62). Another who replied
affirmatively, when asked for more detail said, “There are people who don’t use organic
fertilizer and the earth knows that it is [chemical] fertilizer it’s given. That is the
conflict” (#41). Is this answer the result of misunderstanding the language, or is the
personification of the earth and the indication of a conflict between earth and farmer the
result of a different worldview? Those people who were interviewed in K’iche’ often
gave responses indicating that they did not fully understand the questions that asked
about conflict, although they were able to respond to more concrete questions regarding
their farming methods. Language issues may also be part of the explanation for why the
dummy variable indicating researcher #4 was significant at the p = 0.1 level. Researcher
#4 conducted many interviews in K’iche’ and may have used translations somewhat
different from the other interviewers.
When crime was on the left hand side, the variables Microcredit and
Lan_Spanish were significant at the p = 0.05 level. The negative sign on Microcredit
means that participants in the microcredit program were less likely to perceive elevated
levels of crime. Causation has not been established, but a possible explanation for this is
that the participants are part of an organized social group. Perhaps, participation in this
group provides a level of protection that less connected members of the community
84
don’t benefit from. Alternatively, participation in the group may merely provide the
perception of security, but in fact the members are subject to the same rates of crime as
everyone else.
The positive sign on Lan_Spanish indicates that native Spanish speakers are
more likely to perceive elevated levels of crime. This variable was included as a proxy
for ethnicity and culture. A potential explanation for the sign of this variable is that
native Spanish speakers, a minority in Santa Cruz, are to some extent outsiders, and for
that reason feel less secure. Alternatively, the ability to speak Spanish may provide
them with wider access to information, making them more aware of criminal activities
beyond the local area. Ability to read the Spanish-language El Diario, a very popular
national tabloid which frequently carries stories of violent crime, may increase the
perception of crime.
Surprisingly, Chemical_Fertilizer was the only technological variable that was
significant in either regression. Its positive sign indicates that persons who use chemical
fertilizer are more likely to perceive elevated levels of crime. This corresponds to
hypothesis H4B, but the lack of a similar relationship to conflict weakens support for the
hypothesis. Does this mean that agricultural technologies are causing relatively little
direct crime and conflict in Santa Cruz? Probably so, because of the relative
homogeneity of their use or disuse. Chemical fertilizer was a source of conflict when it
was first introduced in Quiché (Falla, 1972). Despite near-universal adoption of
chemical fertilizer, this research’s interviews indicated that there is still considerable
suspicion surrounding all types of agricultural chemicals. One indication of this is that

85
insecticide and herbicide have been adopted by very few farmers. The homogeneity of
agricultural chemical use leaves little room for differentiation between farmers who use
agricultural chemicals and those who do not. Overall, the results do not support the
hypotheses that technology affects perceptions of crime and conflict.
F. Agricultural Technology and Recovery from Conflict
...as unpopular as it may be to say, every practicing scientist, whether in the physical, biological, or social sciences has a moral responsibility to consider the implications of his or her work for contributing to the ultimate amelioration of the human condition. (Burkhardt, 1991, p. 325) [The amount of conflicts and disagreements among people today] are the same as they were before the signing of the peace. There is no change. They told us they would make reparations for the damages that they did to us, but they didn’t do it. They did not replace the burned houses. They killed people. My father disappeared. (#60, question 38)
1. Literature Review
What is agricultural technology’s role in conflict recovery? Section A reviewed
the devastating impact that conflict can have on agriculture, while section D examined
the important role investments in agricultural technology play in poverty alleviation and
conflict prevention. Taken together, one can conclude that investments in agricultural
technology in post conflict areas will work to prevent a country or region from falling
into a cycle of poverty-induced conflict. Improvements in agricultural technology and
markets in post-conflict areas can have the impact of reducing poverty and
environmental degradation, thereby eliminating the feedback loop that fuels further
conflict. However, special care should be taken when introducing net labor-saving
technologies to ensure that displaced laborers have positive options to turn to.

86
Countries that recently experienced civil conflict are likely to have many
competing demands for a small budget, therefore “aid financing can help create the
conditions for peace and human development” (United Nations Development Program,
2005). Successful examples of achieving food security by investing in agriculture are
post-war Korea, where agriculture was rebuilt with U.S. aid money in areas where it had
been completely destroyed, and post-World War II Europe, where agricultural
infrastructure “remained intact” (Messer, et al., 1998, p. 33). However, Messer and her
co-authors contend that modern civil wars do not tend to result in the two extreme cases
presented above. Instead, they leave infrastructure severely damaged, “but still-
entrenched interests render it impossible to make a fresh start. Traditional ways may no
longer be appropriate, but individuals cannot modernize because they are already fully
occupied trying to cope in the old underproductive ways” (Messer, et al., 1998, p. 33).
“Rebuilding” agriculture raises the question of what should be rebuilt, from both
material and policy perspectives. If, for instance, the conflict was fueled by an
inegalitarian social structure that oppressed rural farmers, “rebuilding” the old society is
unlikely to result in peace. Post-conflict needs and foreign aid money must improve
upon the old society to create a new society that is less likely to fall back into conflict.
The rural poor must not be neglected in this work. Tony Addison explains:
...the domestic and aid resources used in rebuilding infrastructure and services will have low returns if policies that hold back the livelihoods of smallholders and micro-entrepreneurs are retained. A thorough and early reconsideration of sector policies-especially towards agriculture which is the main livelihood of many of the poor-is therefore needed (Addison, 2005, p. 9)

87
Of course, while maintaining the goal of improving the structure of agriculture in
a country after it has been ravaged by conflict, aid agencies must address immediate
needs and avoid creating dependency. “Water may be a first priority for rural
populations, followed by tools, seeds, and animals for food production” (Messer, et al.,
1998). The CGIAR centers (Consultative Group on International Agricultural Research)
helped to rebuild Rwanda and Angola’s agriculture after the genocide and civil wars of
the mid-1990’s as part of their ‘Seeds of Hope’ and ‘Seeds of Freedom’ projects (Varma
and Winslow, 2005). In the case of Guatemala, recovery is often complicated by the
loss of the primary breadwinner. Widowed women have been left with “no material
resources...after the destruction of their homes and crops” (Tomuschat, et al., 1999,
Conclusions 29). Clearly, for recovery to occur, resources and technology must be
provided outside of the agricultural sphere in order to support agriculture. In addition,
there are effects of war upon agriculture that will not be repaired with any level of
technology or investment. As Tomuschat, et al. (1999) point out: “terror does not
automatically disappear when the levels of violence decrease; on the contrary, there are
cumulative and lasting effects, which to overcome, require time, effort and the direct
experience that things have changed” (Conclusions 47).
2. Conceptual Model
As noted, armed conflict can tremendously disrupt agriculture. When the
conflict ends, however, the flows of people and investment may reverse. People who
had fled to escape the violence may return to their homes, carrying with them the
experiences and knowledge gained while in exile. National and international

88
reconstruction efforts may invest large sums of money to rebuild the country’s or
region’s infrastructure. Figure 10 shows how conflict may result in the use of new
agricultural technology. The damage caused by large-scale conflict draws international
attention and aid money to help to rebuild the country. National governments also have
an interest in rebuilding, but may face a restricted budget as they emerge from conflict.
The influxes of money and people bring with them agricultural technologies that the
country’s farmers may not have had access to previously.
Displacement of farmers, both internally and externally, is another way in which
they are exposed to new agricultural technologies. When the conflict ends and farmers
return home, they may attempt to put into practice the techniques and tools that they saw
while exiled. The disruption brought about by displacement also causes a breakdown in
traditions that are not possible or practical under refugee conditions. Having already
broken with tradition while displaced, resettled farmers may become more open to
considering alternative farming practices. In this way, development aid and farmer
displacement may lead to the adoption of new agricultural technologies.
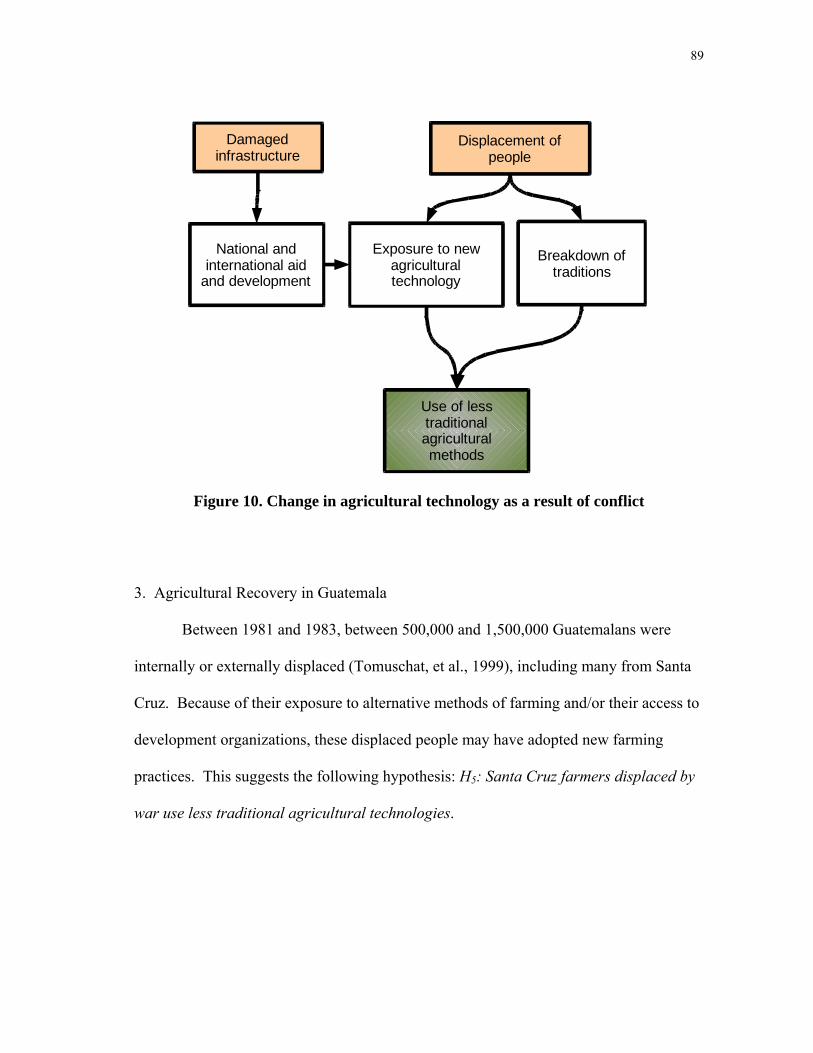
89
National and international aid
and development
Damaged infrastructure
Use of less traditional agricultural methods
Breakdown of traditions
Exposure to new agricultural technology
Displacement of people
Figure 10. Change in agricultural technology as a result of conflict
3. Agricultural Recovery in Guatemala
Between 1981 and 1983, between 500,000 and 1,500,000 Guatemalans were
internally or externally displaced (Tomuschat, et al., 1999), including many from Santa
Cruz. Because of their exposure to alternative methods of farming and/or their access to
development organizations, these displaced people may have adopted new farming
practices. This suggests the following hypothesis: H5: Santa Cruz farmers displaced by
war use less traditional agricultural technologies.

90
4. Methods
Two logit regressions and one multinomial logit regression4 were used to test H5.
For more information on these models, please see Chapter II. The multinomial logit
regression was run using the software package LIMDEP (LIMDEP, 2007). A logit
model was applied for dependent variables insecticide and animal vaccination. For each
dependent variable, a one (1) indicated that the technology was used and a zero (0)
indicated that it was not used. The dependent variable of the multinomial logit
regression included four mutually exclusive classifications of the method of fertilization
used: organic only, synthetic and active organic, synthetic and passive organic, or
synthetic only. Descriptions of the four categories follow:
• Organic only systems did not apply any synthetic fertilizers. Instead, they used
one or more of the following means to fertilize their crop: pasture animals on the
field, manually apply animal manure to the field, leave or bury plant residue in
the field, or manually apply plant residue gathered from the forest floor.
• Synthetic and active organic systems applied organic material as described in
“organic only.” In addition, they also applied synthetic fertilizer.
• Synthetic and passive organic systems applied organic material by pasturing
animals in the field. In addition, these systems supplemented the organic
fertilizer with synthetic fertilizer. The word “passive” is a bit of a misnomer,
because pasturing animals in a field is certainly not effortless. “Passive” is
4 Thank you to Justin Baker for help with the multinomial regression

91
meant to indicate that no organic fertilizer materials are added to the field by
direct human application.
• Synthetic only systems relied entirely upon purchased synthetic fertilizer. They
did not make use of any organic fertilizer.
The independent variables were the same in all three regressions. They included
many of the same variables as those used for the regressions in section E: participation in
microcredit, the amount of land owned, primary school education, middle school or
higher education, speaking Spanish as a native language, and speaking both Spanish and
K’iche’ as native languages. In addition, a binary variable was added to indicate
whether or not the interview respondent had emigrated during the war. The binary
variable for emigration was derived from the survival strategies data gathered in section
C.
5. Results
Complete results for the three regressions can be found in Appendix C. Only
one instance of a statistically significant variable occurred in the three regressions. In
the multinomial logistic regression, the microcredit variable was significant for the
“Synthetic and Active Organic” case. The interpretation of this result is that
participation in the microcredit program increases the probability of choosing the
farming system “Synthetic and Active Organic” over the baseline “Organic Only.”
Microcredit also appeared to increase the likelihood of choosing “Synthetic and Passive
Organic” or “Synthetic Only” over “Organic Only,” although the variable was not
statistically significant for these cases (p < 0.2).
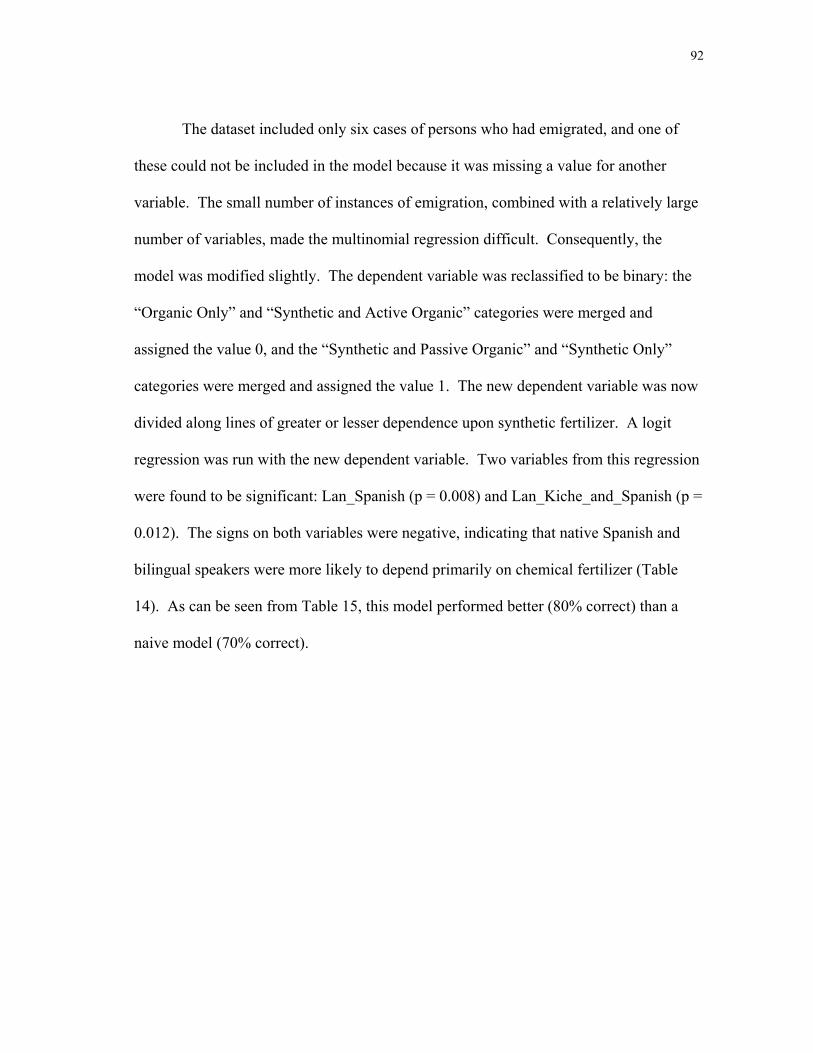
92
The dataset included only six cases of persons who had emigrated, and one of
these could not be included in the model because it was missing a value for another
variable. The small number of instances of emigration, combined with a relatively large
number of variables, made the multinomial regression difficult. Consequently, the
model was modified slightly. The dependent variable was reclassified to be binary: the
“Organic Only” and “Synthetic and Active Organic” categories were merged and
assigned the value 0, and the “Synthetic and Passive Organic” and “Synthetic Only”
categories were merged and assigned the value 1. The new dependent variable was now
divided along lines of greater or lesser dependence upon synthetic fertilizer. A logit
regression was run with the new dependent variable. Two variables from this regression
were found to be significant: Lan_Spanish (p = 0.008) and Lan_Kiche_and_Spanish (p =
0.012). The signs on both variables were negative, indicating that native Spanish and
bilingual speakers were more likely to depend primarily on chemical fertilizer (Table
14). As can be seen from Table 15, this model performed better (80% correct) than a
naive model (70% correct).

93
Table 14. Parameter estimates with dependent variable: Binary fertilizer type*
B S.E. Wald df Sig. Emigrated -0.755 1.526 0.245 1 0.621
Microcredit 0.726 0.908 0.639 1 0.424
TotalOwned -0.020 0.052 0.144 1 0.704
Ed_Elementary 1.212 0.799 2.301 1 0.129
Ed_Middle_Plus 0.954 1.945 0.241 1 0.624
Lan_Spanish*** 2.726 1.021 7.131 1 0.008
Lan_Kiche_and_Spanish** 2.468 0.987 6.251 1 0.012
Constant -2.830 1.137 6.196 1 0.013
N = 60 * Dependent variable = 0 if fertilizer type is “Organic Only” or “Synthetic and Active Organic” categories; Dependent variable = 1 if fertilizer type is “Synthetic and Passive Organic” or “Synthetic Only.” *** significantly different from 0 at the p = 0.01 level ** significantly different from 0 at the p = 0.05 level
Table 15. Performance of binary fertilizer type model*
Predicted Binary Fert Type
Observed 0 1 Percentage
Correct 0 38 4 90.5 Binary
Fert Type 1 8 10 55.6
Overall Percentage 80.0 * Binary Fert Type = 0 if fertilizer type is “Organic Only” or “Synthetic and Active Organic” categories; Binary Fert Type = 1 if fertilizer type is “Synthetic and Passive Organic” or “Synthetic Only.”

94
6. Discussion
No variable other than microcredit was remotely significant for the original three
regressions. The most obvious interpretation of this variable’s significance is that
microcredit participants are using their loans to purchase chemical inputs, although other
interpretations are certainly possible. It may be that more progressive farmers, those
who purchase chemical inputs, are also more likely to participate in microcredit.
Results from the final regression indicate that the most significant determinant of
whether or not a Santa Cruz farmer adopts the use of chemical agricultural inputs is the
farmer’s native language, a proxy for ethnicity. Of course, the significance of these
results is in question, given that the model was the result of adjusting the dependent
variable based on the results from previous models. Nevertheless, the results provide
information that is worth speculating upon, and they point to an area that may merit
future research. The results from this regression indicate that native Spanish speakers
were more likely than native K’iche’ speakers to use “Synthetic only” and “Synthetic
and passive organic” fertilization techniques. The sign for Lan_Spanish was also
positive in the regression that placed insecticide use on the left side, though the result
was not quite significant (p = 0 .102).
K’iche’ resistance to the use of agricultural chemicals may be a result of their
cultural emphases on tradition and environmental concerns. As further evidence that
there is some tension between the two ethnicities, Table 16 is presented. Twenty-three
percent of respondents said that there is conflict between persons who speak different
languages (question 63). It is encouraging to see that this is lower than the equivalent

95
number who said that there was conflict between people who spoke different languages
before and during the war (question 64).
Table 16. Conflict between people who speak different languages
Before and
during the war Currently
% N % N Yes 30% 24 23% 19 No 42% 34 54% 44 NA 28% 23 22% 18
Why was emigration not found to have a significant impact on farmers’ use of
technologies? Several explanations are possible. The first is that farmers who emigrated
may not have come into contact with agricultural technologies different than those they
were already using. This might be the case if they went to stay with relatives, sought
refuge in the city, or escaped into the jungle. None of these destinations would have
been likely to expose the refugees to new, useful agricultural technologies. Another
explanation is that farmers who emigrated did, in fact, come into contact with new
agricultural technologies but were unable or unwilling to adopt them. Question #65
asked participants if they would like to continue working with the same tools they
currently use, or if they would change something. Some farmers replied by saying that
they would like to use a tractor, if they could afford it. Many others replied that they

96
would like to continue using the same tools they currently use, but after a short pause,
would say something to the effect, “Well, if we had money, we’d hire a tractor.” The
point is that Santa Cruz farmers are very much aware of agricultural technologies that
they are not currently using, but they are prevented from using them because of financial
constraints. The tractor is an extreme case because of its high cost, but many Santa Cruz
farmers also limit their use of agricultural chemicals because they lack the money to
purchase them, despite the relatively low cost. Poor farmers have relatively few choices
regarding agricultural technology. Consequently, the technologies they employ may
change very little during and after conflict.
Peace and economic development may help to raise farmers’ wealth and lead to
more ability to choose amongst technologies. However, a decade after the end of the
civil war, Santa Cruz is not optimistic. Figure 11 shows the results of question 38,
which asked respondents to compare the current level of conflict to past conflict levels,
and question 39, which asked respondents to speculate whether there would be more
conflict in the future than there is currently. Many people (33%) said that there are less
conflicts and disagreements among people today than there were in the past, but a
majority (52%) claimed that they are equal to or greater than in the past. That’s not
good news for a country that recently ended a 36-year civil war. To make matters
worse, 26% said that there will be more conflict and disagreements in the future,
compared to 16% who said that there will be less. Does this indicate a failure of
development—or a lack of sufficient development effort? If the situation today is
comparable to the situation during the civil war, what will Guatemala’s future hold?

97
0%10%20%30%40%50%60%70%80%90%
100%
Conflict today, compared topast (question 38)
Conflict in future, comparedto past (question 39)
More
Equal
Less
NA
Figure 11. Pessimistic view of future conflict5
It would be nice to finish this chapter with a more uplifting story, so the
Rwandan recovery effort will be briefly returned to. After the genocide occurred in
1994, much of the countryside’s homes, agricultural land, and livestock had been
destroyed or severely damaged. In 2001, an agricultural development project started
with the goal of putting money in the hands of farmers, many of whom had been
widowed or orphaned by the genocide. The project aided existing coffee cooperatives
and encouraged others in the production and marketing of high-quality coffee. The
success of the project has led to its expansion and provided hope for what the future may
bring (Cleboski, 2007).
5 Responses were not found to differ significantly across age groups

98
CHAPTER V
CONCLUSIONS AND RECOMMENDATIONS
A. Introduction
Though the previous chapter was divided into six sections, the literature review
demonstrates that these six topics are closely related. For example, the case studies used
to illustrate how agricultural technology can cause conflict could have been used to
connect natural resources with conflict, and vice versa. Likewise, the agricultural
technologies used in recovery are partially determined by the nature of the conflict and
its impact upon agriculture. The recovery technologies, in turn, can provoke new
conflict, alleviate old conflict, or alter the relationship between people and natural
resources.
In the following section, the most important findings of this research are
discussed, and each is followed by one or more recommendations. Section C examines
some of the weaknesses of the current study and proposes areas for future research.
B. Important Findings and Recommendations
1. Market Access and Labor During Wartime
Poor market access and reduced use of agricultural labor are shown to be two
problems for Santa Cruz agriculture during the war. Mitigation of these difficulties
would be achieved by increasing farmers’ ability to utilize idle labor through home-
based production. Capacity to produce for the market could be increased by raising the
general level of education, as well as by focusing on trade-based education. These skills

99
would raise incomes during times of peace and provide resources to fall back on during
conflict. Of course, market-based production is not useful when one doesn’t have access
to the market, so this problem must be addressed as well. During war, market access is
largely a security issue. One way to address this is by providing a secure service that
would deliver finished products to the market and inputs to producers, without requiring
that the producers themselves leave their homes.
2. Water and Land
This research shows that in Santa Cruz, one out of three residents consider water
to be a source of conflict. Development of clean, sustainable water resources would
benefit many communities by improving health and reducing competition for existing
sources. If water resources are adequate to provide for irrigation, there is also potential
for raising agricultural productivity by growing a crop in the dry season. However,
ambitious projects such as these must proceed with caution, lest the intended
beneficiaries become victims of powerful resource grabbers. Other beneficial
technologies would include advances in water harvesting and water saving technologies,
such as more efficient irrigation works and crops that demand less water. More efficient
water use would reduce the regional demand and competition for this scarce resource.
Surprisingly, land was not perceived to be a source of conflict by a large portion
of the population, despite the unequal distribution of land in Guatemala, which may limit
a country’s agricultural productivity (Vollrath, 2007). Nevertheless, a well-planned
redistribution of land that provides beneficiaries with access to the capital, knowledge,
and technologies necessary for success may be able to play a role in stabilizing the

100
society through increased production and the resultant reduced poverty. Such a policy
must proceed with caution, keeping in mind that land redistribution was a key issue that
led to the 1954 coup and subsequent civil war. If land redistribution is done in such a
way as to anger powerful landowners, it could once again result in greater turmoil rather
than less.
3. Alternative Crops
According to the literature, displaced Guatemalans found that some crops, such
as banana, cassava, and sugar cane, grew back after having been destroyed by military
forces. Research in Santa Cruz revealed the failure of the traditional corn and bean
intercropped system in a number of cases. However, research did not indicate that
farmers switched to alternative crops during the war, nor did it reveal any crops that
were regarded as relatively more war resistant.
This lack of support for what was found in the literature may be due to the
unavailability of such alternative crops, indicating that Santa Cruz farmers may benefit
from the development of such alternative crops. Cultivation of perennial crops would
benefit farmers who are limited in their ability to work in their fields because of conflict.
Alternatively, if plant breeders were able to give other agricultural crops resilient
qualities such as those possessed by banana, cassava, and sugar cane, it would provide
farmers with insurance against periods of conflict. Imagine, for example, if corn
possessed the ability to grow back from its roots -- the destruction of indigenous
Guatemalan farmers’ fields would have been less catastrophic. This sounds far-fetched,
but similar research is already underway. Plant breeders of perennial wheat at
101
Washington State University claim to be “very close” to their goal (Washington State
Magazine Online, 2004). The Texas Agricultural Experiment Station is also testing lines
bred in Washington (AgNews, 2006). The Land Institute, founded by Wes Jackson in
Salina, KS, is striving to create “an agricultural system with the ecological stability of
the prairie and a grain yield comparable to that from annual crops” (Jackson, 1996; The
Land Institute, 2004). While The Land Institute is pursuing its research for ecological
reasons, a potential side effect is that perennial grain crops may provide increased food
security to people who live in chronic conflict areas.
4. Rural Development
Rural development is essential to breaking the chronic conflict cycle in
developing nations (Pinstrup-Andersen, 2006; Borlaug, 1970). Great opportunities for
agricultural and social advancement present themselves when fighting has come to an
end and peace agreements have been signed. Unfortunately, these opportunities are not
always seized upon. One such recent failure is Guatemala, where ideological warfare
has been replaced by escalating rates of violent crime and a lack of opportunity for
young people. Ten years after the peace accords were signed, the country has failed to
provide security and improve the quality of life for many of its citizens, including
farmers. While the problems of security and injustice in Guatemala go far beyond the
ability of rural development to solve, rural development can make a contribution.
This research shows that Santa Cruz farmers who emigrated during the war do
not utilize technologies that are different from their neighbors who did not emigrate, and
agricultural technologies appear to have changed little in recent decades. Santa Cruz,

102
where household income is extremely low and families do not own enough land to
support themselves through subsistence agriculture, is an area that is in great need of
increased development. Microcredit programs may be particularly useful forms of
development because, in addition to the economic benefits they impart, this research has
shown that they also have the ability to reduce their participants’ perceptions of crime.
5. Ethnicity and Technology Development
Illustrating the importance of ethnicity, this research finds that being a native
Spanish speaker increases the perception of crime. In addition, the results suggested that
K’iche’ speakers may be less likely to depend upon chemical fertilizer than Spanish
speakers. If this relationship is generalizable, it highlights the need for cooperative
development of technologies that are more acceptable to K’iche’ farmers. Instead of
simply exporting developed-world technologies, agricultural research should be
undertaken in conjunction with local farmers to develop scientifically, culturally, and
socially appropriate technologies. Developed-world technologies may provide an
excellent starting point for such research.
Leaders who seek to prevent, end, or reduce conflict should consider the role that
agricultural technologies may play, in addition to traditional political resolution
strategies. The responsible decision to develop, adopt, or introduce an agricultural
technology must take into account the social consequences of that decision, including
how the new technology may alleviate or contribute to conflict.

103
6. Causation and Prevention of Conflict
Technologies are not shown to have directly caused or prevented conflict in
Santa Cruz. A deeper understanding of these relationships at the community level may
require the use of alternative research methodology.
C. Implications for Future Research
Despite the lack of support for some of the hypotheses in the locality of Santa
Cruz, the general models of the relationships between agricultural technology and
conflict should not be disregarded. Research in other areas of the globe, focusing on
different technologies, may arrive at different conclusions.
One important weakness of this study was that it did not include farmers who had
abandoned agriculture as a result of the conflict. Future research examining the impacts
of war or technology should attempt to include persons who have abandoned farming,
for whatever reason. Doing so will allow a more complete perspective of the topic.
Future studies would also benefit from choosing a location where a wider variety
of agricultural technologies are employed, and/or a location that has undergone a
significant, recent change in agricultural technology. The relatively small number of
different agricultural technologies employed in Santa Cruz, combined with the lack of
many significant changes to agriculture in the preceding decades, limited the potential of
such research in Santa Cruz. When most farmers use the same technology, there are few
alternatives for comparison. When technologies have changed little in recent years,
there are few impacts of new technology to measure. The lack of technological variation

104
in Santa Cruz prevented identification of the reasons that technology did not change in
the region. A broader cross section would overcome this weakness.
This study was limited to examining impacts at a local level. Future studies may
choose to engage in cross-national research that examines how a country’s adoption or
development of agricultural technology impacts its propensity for conflict.
Finally, an investigation worthy of further research would examine the way a
technology’s development process impacts its effectiveness and social utility. For
example, Stemerding et al. (2002) found that Malian farmers who conducted their own
experiments and developed technologies for rice production, using integrated production
and pest management (IPM), not only increased profits and decreased expenses in many
cases, but were also empowered in their interactions with outsiders. This suggests that
cooperatively designed agricultural technologies such as IPM may have greater potential
to reduce conflict.
This research concludes with the hope that it will encourage further studies into
the relationships between agricultural technologies and conflict.

105
REFERENCES
Addison, T. 2005. "Agricultural Development for Peace." United Nations University.
WIDER Research Paper. 2005/07. Helsinki, Finland
AgNews. 2006. “Perennial Wheat Research Looks at Options for Producers.” 27
November 2006. Available at
http://agnews.tamu.edu/dailynews/stories/SOIL/Nov2706a.htm (10 February
2007).
American Heritage College Dictionary, The. 1993. “Technology.” Third Edition.
Boston: Houghton Mifflin Company.
Ball, P. 1999. AAAS/CIIDH Database of Human Rights Violations in Guatemala
(ATV20.1). Available at http://hrdata.aaas.org/ciidh/data.html (30 January 2007).
Berry, W. 1981. The Gift of Good Land. San Francisco, CA: North Point Press.
Black, J. K., and M. C. Needler. 1983. "Historical Setting." In R. F. Nyrop, ed.
Guatemala: A Country Study. Washington, DC: Headquarters, Dept. of the
Army.
Borlaug, N. 1970. The Green Revolution, Peace, and Humanity. Nobel Lecture. Oslo,
Norway.
Brown, R. M. 1996. "Violence." In C. A. Milner II, C. A. O'Connor, and M. A.
Sandweiss, eds. The Oxford History of the American West. New York: Oxford
University Press, pp. 393-425.
Burkhardt, J. 1991. "Biotechnology, Ethics, and the Structure of Agriculture." In C. V.
Blatz, ed. Ethics and Agriculture: An Anthology on Current Issues in World

106
Context. Moscow, ID: University of Idaho Press, pp. 317-330.
Busch, L., W. B. Lacy, J. Burkhardt, and L. R. Lacy. 1991. Plants, Power, and Profit:
Social, Economic, and Ethical Consequences of the New Biotechnologies.
Cambridge, MA: Basil Blackwell, Inc.
Carmack, R. M. 1976. "Ethnohistory of the Central Quiché: The Community of Utatlan."
In D. T. Wallace, and R. M. Carmack, eds. Archaeology and Ethnohistory of the
Central Quiché. Albany, NY, Institute For MesoAmerican Studies, State
University of New York at Albany.
Castañeda, C. 1998. Lucha Por la Tierra, Retornados y Medio Ambiente en
Huehuetenango. Guatemala City: Flacso.
Cleboski, L. 2007. Personal communication. 11 February 2007.
Collier, G. A. 2005. Basta!: Land and the Zapatista Rebellion in Chiapas. Third
Edition. Oakland, CA: Food First Books.
Collier, P. C. and A. Hoeffler. 2004. “Greed and Grievance in Civil War.” Oxford
Economic Papers 56:563-595.
de Soysa, I., and N. P. Gleditsch. 1999. "To Cultivate Peace: Agriculture in a World of
Conflict." International Peace Research Institute, Oslo (PRIO). Oslo, Norway.
de Waal, A. 2005. “Sudan’s Historic Peace Deal is Only the Start.” Financial Times, 13
January 2005. London.
Deng, L. B. 2002. "Confronting Civil War: A Comparative Study of Household Assets
Management in Southern Sudan." Institute of Development Studies, IDS
Discussion Paper 381. September 2002.
107
Donald, P. F., R. E. Green, and M. F. Heath. 2001. “Agricultural Intensification and the
Collapse of Europe’s Farmland Bird Populations.” Proceedings of the Royal
Society B: Biological Sciences 268(1462): 25–29.
Dorner, P. 1983. "Technology and U.S. Agriculture." In G. F. Summers, ed. Technology
and Social Change in Rural Areas: A Festschrift for Eugene A. Wilkening.
Boulder, Westview Press, pp. 73-86.
Falla, R. 1972. "Hacia la Revolución Verde: Adopción y Dependencia del Fertilizante
Químico en un Municipio del Quiché, Guatemala." Estudios Sociales, no. 6:16-
51
---. 1994. Massacres in the Jungle: Ixcán, Guatemala, 1975 - 1982. Translated by B.
Manz. Boulder, CO: Westview Press.
FAOSTAT. 2006. "FAOSTAT Homepage." Available at http://faostat.fao.org/ (20
March 2006).
Fearon, J. D. 2005. “Primary Commodity Exports and Civil War.” The Journal of
Conflict Resolution 49(4):483-507.
Fox, J. W. 1976. "Quiché Expansion Processes: Differential Ecological Growth Bases
Within an Archaic State." In D. T. Wallace, and R. M. Carmack, eds.
Archaeology and Ethnohistory of the Central Quiché. Albany, NY: Institute for
MesoAmerican Studies, State University of New York at Albany.
Gebre, A. 2001. "Conflict Management, Resolution, and Institutions among the Karrayu
and their Neighbors." In M. A. Salih, Ton Dietz, and Abdel Ghaffar Mohamed
Ahmed, eds. African Pastoralism. London: Pluto Press.

108
Gebremedhin, T. G. 1996. Beyond Survival: The Economic Challenges of Agriculture &
Development in Post-Independence Eritrea. Lawrenceville, NJ: The Red Sea
Press, Inc.
Gleditsch, N. P., P. Wallensteen, M. Eriksson, M. Sollenberg, and H. Strand. 2002.
“Armed Conflict 1946–2001: A New Dataset,” Journal of Peace Research 39(5):
615–637. Data available at http://www.prio.no/jpr/datasets.asp.
Gleick, P. H. 1993. “Water and Conflict: Fresh Water Resources and International
Security.” International Security 18(1):79-112.
Griffith, J. A., E. A. Martinko, and K. P. Price. 2000. ”Landscape Structure Analysis of
Kansas at Three Scales.” Landscape and Urban Planning 52:45-61.
Guatemala, Dirección General de Cartografía. 1962. Diccionario Geográfico de
Guatemala. Guatemala City.
Guatemala, Instituto Nacional de Estadística. 1994. X Censo Nacional de Población y V
de Habitación. Available at http://ccp.ucr.ac.cr/bvp/censos/zip/guate/index.htm
(4 November 2006).
Guatemala, Instituto Nacional de Estadística. 2003a. Censos Nacionales XI de Población
y VI de Habitación 2002. Guatemala City, Guatemala.
Guatemala, Instituto Nacional de Estadística, 2003b. Tomo I Características Generales
de las Fincas Censales. IV Censo Nacional Agropecuario 2003. Available at
http://www.ine.gob.gt/censosA.html (4 November 2006).
Handy, J. 1984. Gift of the Devil. Boston, MA: South End Press.
Hanson, V. D. 1998. Warfare and Agriculture in Classical Greece, Revised Edition.

109
Berkeley, CA: University of California Press.
Herrera, F. 1966. Agrarismo Guatemalteco: Sinopsis Histórica. Guatemala City:
Editorial Landívar.
Hightower, J. 1973. Hard Tomatoes, Hard Times: A Report of the Agribusiness
Accountability Project on the Failure of America's Land Grant College Complex.
Cambridge, MA: Schenkman Publishing Company.
Homer-Dixon, T., and J. Blitt. 1998. Ecoviolence: Links Among Environment,
Population, and Security. Lanham, MD: Rowman & Littlefield Publishers, Inc.
Homer-Dixon, T. F. 1994. "Environmental Scarcities and Violent Conflict: Evidence
from Cases." International Security 19:5-40.
Hope, H. 2005. "Dip That Tick: Texas Tick Fever Eradication in Arkansas, 1907-1943."
The Arkansas Historic Preservation Program. Available at
http://www.arkansaspreservation.org/publications/ (11 January 2007).
Human Rights Watch. 2003. "The Iraqi Government Assault on the Marsh Arabs."
Human Rights Watch, January 2003.
Hussain, A., and M. Herens. 1997. "Child Nutrition and Food Security During Armed
Conflicts." Food, Nutrition and Agriculture 19:17-25.
Jackson, W. 1996. Becoming Native to This Place. New York: Counterpoint.
Kassa, G. 2001. "Resource Conflicts Among the Afar of North-East Ethiopia." In M. A.
Salih, T. Dietz, and A. G. M. Ahmed, ed. African Pastoralism. London, Pluto
Press.
Land Institute, The. 2004. “Introduction and Mission.” Available at

110
http://www.landinstitute.org/vnews/display.v/ART/2000/08/10/37a747b43 (12
January 2007).
Levy, E. 1982. “The Responsibility of the Scientific and Technological Enterprise in
Technology Transfers.” In R.S. Anderson, P.R. Brass, E. Levy and B.M.
Morrison, eds. Science, Politics, and the Agricultural Revolution in Asia.
Boulder, CO: Westview Press, Inc., pp. 277-297.
LIMDEP. 2007. “LIMDEP.” Available at http://www.limdep.com (10 February 2007).
Manz, B. 1994. "Epilogue: Exodus, Resistance, and Readjustments in the Aftermath of
Massacres." In R. Falla. Massacres in the Jungle: Ixcán, Guatemala, 1975 -
1982. Boulder, CO: Westview Press.
Meludu, N. 2006. “Conflict Management Strategies for Effective Performance of
Agricultural Extension: A Case of Ife – Modakeke Saga in Osun State, Nigeria.”
International Journal of Agricultural Rural Development 7(1):143-151.
Messer, E., M. J. Cohen, and J. D'Costa. 1998. "Food from Peace: Breaking the Links
between Conflict and Hunger." Food, Agriculture, and the Environment
Discussion Paper 24. Washington, DC: International Food Policy Research
Institute.
Moore, K. M., M. Bertelsen, S. Cissé, and A. Kodio. 2005. "Conflict and Agropastoral
Development in the Sahel." In K. M. Moore, ed. Conflict, Social Capital, and
Managing Natural Resources: A West African Case Study. Wallingford, UK:
CABI Publishing.
Netz, R. 2004. Barbed Wire: An Ecology of Modernity. Middletown, CT: Wesleyan

111
University Press.
ODHAG (Oficina de Derechos Humanos del Arzobispado de Guatemala). 1998.
Guatemala: Nunca Más: I: Impactos de la Violencia. Vol. 1. Four volumes.
Guatemala City: Oficina de Derechos Humanos del Arzobispado de Guatemala.
Perez-Brignoli, H. C. 1989. A Brief History of Central America. Translated by R. B.
Sawrey A., and S. S. de Sawrey. Berkeley, CA: University of California Press.
Pinstrup-Andersen, P. 2006. "The Impact of Technological Change in Agriculture on
Poverty and Armed Conflict." USDA, March 2, 2006.
Rahmato, D. 1991. Famine and Survival Strategies: A Case Study from Northeast
Ethiopia. Uppsala: The Scandinavian Institute of African Studies.
Rasmussen, W. D. 1977. "The Mechanization of American Agriculture." In A. Fusonie,
and L. Moran, eds. Agricultural Literature: Proud Heritage-Future Promise.
Washington, D.C., Association of the National Agricultural Library, Inc., and the
Graduate School Press, U.S. Department of Agriculture, pp. 295-315.
Rose Johnston, B. 2005. "Volume One: Chixoy Dam Legacy Issues Study: Executive
Summary: Consequential Damages and Reparation: Recommendations for
Remedy." Santa Cruz, CA. Center for Political Ecology, March 17, 2005.
Ross, M. L. 2004. "What Do We Know About Natural Resources and Civil War?"
Journal of Peace Research 41(3):337-356.
Schilling, T. Presentation of the SPREAD Project. 15 November 2006. Texas A&M
University, College Station, TX.
Schlesinger, S., and S. Kinzer. 2005. Bitter Fruit: The Story of the American Coup in

112
Guatemala. The David Rockefeller Center Series on Latin American Studies,
Harvard University. Cambridge, MA: Harvard University Press.
Simmons, C. S., J. M. Tarano T., and J. H. Pinto. 1959. Clasificación de
Reconocimiento de los Suelos de la República de Guatemala. Guatemala:
Editorial del Ministerio de Educación Pública, "José de Pineda Ibarra".
Smith, L. I. 2002. A Tutorial on Principal Components Analysis. Available at
http://kybele.psych.cornell.edu/%7Eedelman/Psych-465-Spring-2003/PCA-
tutorial.pdf (6 February 2007).
StatSoft, 2003. “Principal Components and Factor Analysis. “ Electronic Textbook:
StatSoft. Available at http://www.statsoft.com/textbook/stfacan.html (6 February
2007).
Stemerding, P., A. Musch, and Y. Diarra. 2002. Social Dimensions of Integrated
Production and Pest Management: A Case Study in Mali. Rome: Food and
Agriculture Organization of the United Nations.
Strand, H., J. Carlsen, N. P. Gleditsch, H. Hegre, C. Ormhaug, and L. Wilhelmsen. 2005.
Armed Conflict Dataset Codebook: Version 3-2005. International Peace
Research Institute, Oslo (PRIO). Available at
http://www.prio.no/cscw/armedconflict (1 May 2006).
Strom, C. 2000. "Texas Fever and the Dispossession of the Southern Yeoman Farmer."
The Journal of Southern History 66(1):49-74.

113
Tofte, A. H. 2004. "War and Cattle: Livelihood Strategies and Perceptions of Wealth
and Poverty in Southern Sudan." MS thesis, Agricultural University of Norway.
Aas, Norway.
Tomuschat, C., O. Lux de Cotí, and A. Balsells Tojo. 1999. "Guatemala Memory of
Silence." Guatemalan Commission for Historical Clarification (CEH). Available
at http://shr.aaas.org/guatemala/ceh/report/english/toc.html (1 December 2006).
United Nations. 2006. “UNDP Holds First Counter-Narcotics Workshop for Afghan
Legislators.” UN News Centre. 29 August, 2006.
United Nations Conference on Trade and Development. 2006. "Beyond 20/20 WDS
Report Folders: Trade and Commodity Price Indices" UNCTAD Handbook of
Statistics Online. Available at
http://stats.unctad.org/Handbook/TableViewer/tableView.aspx?ReportId=199 (4
March 2006).
United Nations Development Programme. 2005. "Human Development Report 2005:
International Cooperation at a Crossroads: Aid, Trade, and Security in an
Unequal World." Available at http://hdr.undp.org/reports/global/2005/ (1
December 2006).
United Nations, Food and Agriculture Organization (FAO). 2000. "The State of Food
and Agriculture 2000." FAO Economic and Social Department. Rome.
United Nations, FAO/AGL. 2005. “Afghanistan.” AQUASTAT. Available at
http://www.fao.org/ag/agl/aglw/aquastat/countries/afghanistan/index.stm (29
December 2006).

114
United Nations Office on Drugs and Crime. 2004. "Afghanistan Opium Survey 2004."
Available at www.unodc.org/unodc/en/crop_monitoring.html (1 December
2006).
United Nations University Institute of Advanced Studies. 2004. "Agriculture for Peace:
Promoting Agricultural Development in Support of Peace." UNU-IAS Report.
Tokyo, Japan.
Vollrath, D. 2007. “Land Distribution and International Agricultural Productivity.”
American Journal of Agricultural Economics 89(1):202-216.
Ward, D. R. 2002. Water Wars. New York: Riverhead Books.
Washington State University. 2004. “Full Circle.” Washington State University
Magazine Online. Available at http://www.washington-state-
magazine.wsu.edu/stories/04-summer/wheat/index.html (10 February 2007).
Wooldridge, J. M. 2006. Introductory Econometrics, Third Edition. Mason, OH:
Thomson South-Western.
World Trade Organization, (WTO). 2006. "Time Series." International Trade Statistics.
Available at
http://stat.wto.org/StatisticalProgram/WsdbExport.aspx?Language=E (20 March
2006).

115
APPENDIX A
ENGLISH VERSION QUESTIONNAIRE
Date__________________ Researcher_______________________ 1. Location
2. 3. How old are you? 18-25 26-35 36-45 46-55 56-65 66-75 76-85 86+ 4. Are you… 5. Have you gone to school? What grade have you finished? (Ask the same of the spouse.) None Elementary Middle Secondary University NA
Husband
Wife
6. How many children do you have? How old is the youngest? How old is the oldest? 7. What is your native language? K’iche’ Spanish 8. What language do you speak at home? K’iche’ Spanish 9. Do you read or write any languages? K’iche’ Spanish Read Write 10. What is your religion? Catholic Evangelical (protestant) Mayan Spirituality Charismatic None
Community Municipio Departamento Santa Cruz Quiché
Man Woman
Married Living Together Divorced Widowed Single Separated
Number Youngest Oldest
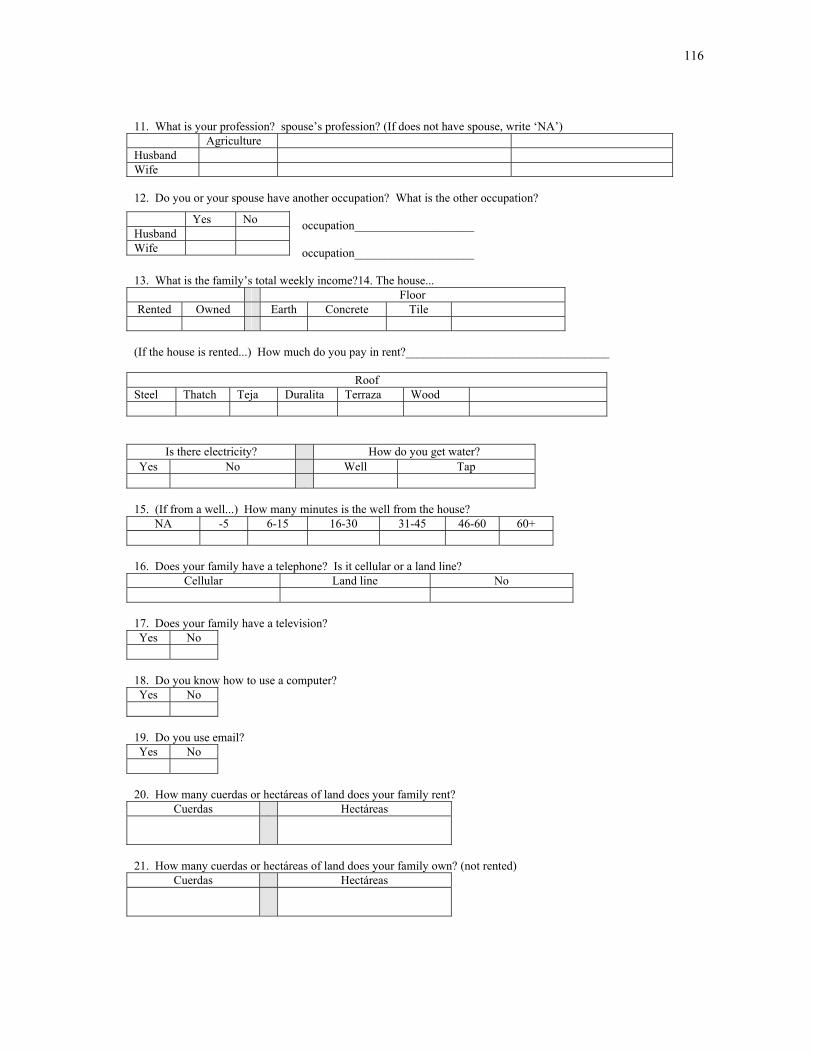
116
11. What is your profession? spouse’s profession? (If does not have spouse, write ‘NA’) Agriculture Husband Wife 12. Do you or your spouse have another occupation? What is the other occupation?
occupation____________________ occupation____________________
13. What is the family’s total weekly income?14. The house... Floor Rented Owned Earth Concrete Tile
(If the house is rented...) How much do you pay in rent?__________________________________
Roof Steel Thatch Teja Duralita Terraza Wood
Is there electricity? How do you get water? Yes No Well Tap
15. (If from a well...) How many minutes is the well from the house?
NA -5 6-15 16-30 31-45 46-60 60+ 16. Does your family have a telephone? Is it cellular or a land line?
Cellular Land line No 17. Does your family have a television? Yes No
18. Do you know how to use a computer? Yes No
19. Do you use email? Yes No
20. How many cuerdas or hectáreas of land does your family rent?
Cuerdas Hectáreas
21. How many cuerdas or hectáreas of land does your family own? (not rented)
Cuerdas Hectáreas
Yes No Husband Wife
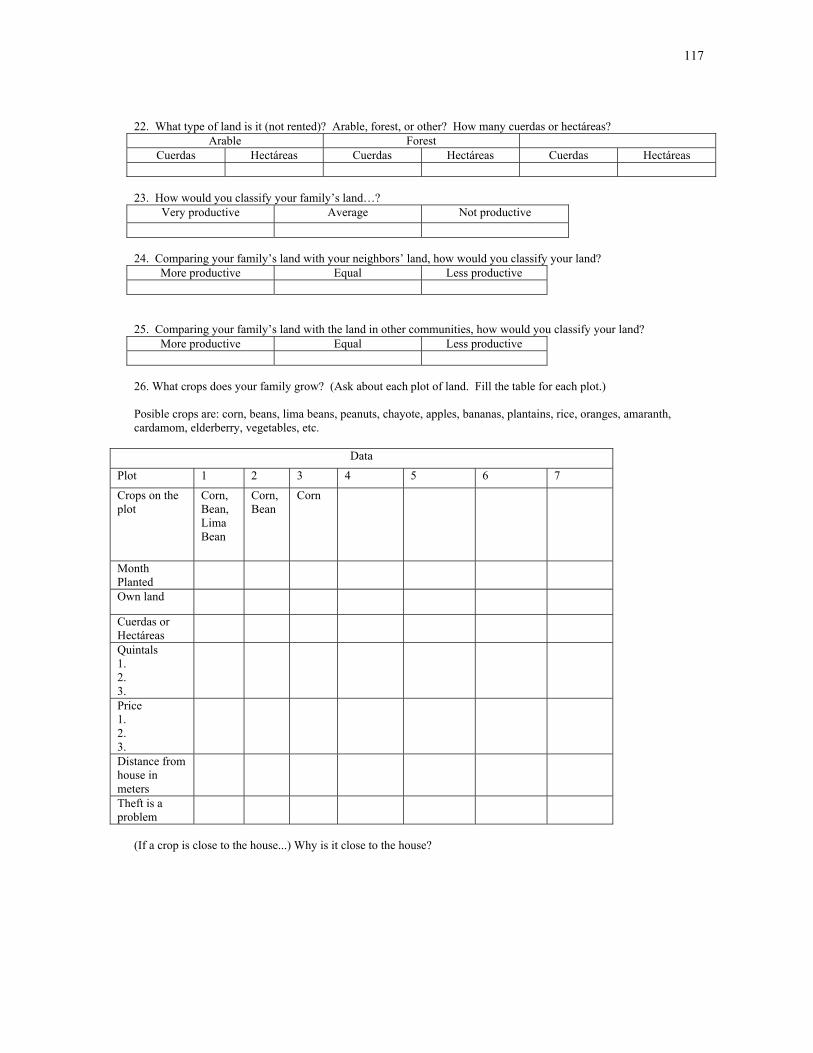
117
22. What type of land is it (not rented)? Arable, forest, or other? How many cuerdas or hectáreas? Arable Forest
Cuerdas Hectáreas Cuerdas Hectáreas Cuerdas Hectáreas 23. How would you classify your family’s land…?
Very productive Average Not productive 24. Comparing your family’s land with your neighbors’ land, how would you classify your land?
More productive Equal Less productive 25. Comparing your family’s land with the land in other communities, how would you classify your land?
More productive Equal Less productive 26. What crops does your family grow? (Ask about each plot of land. Fill the table for each plot.) Posible crops are: corn, beans, lima beans, peanuts, chayote, apples, bananas, plantains, rice, oranges, amaranth, cardamom, elderberry, vegetables, etc.
Data
Plot 1 2 3 4 5 6 7
Crops on the plot
Corn, Bean, Lima Bean
Corn, Bean
Corn
Month Planted
Own land
Cuerdas or Hectáreas
Quintals 1. 2. 3.
Price 1. 2. 3.
Distance from house in meters
Theft is a problem
(If a crop is close to the house...) Why is it close to the house?

118
Please explain the process your family uses to farm. (Indicate the techniqes and methods used for each plot. Below, write the phrases that do not fit in the table. )
Prepare the Soil Plot 1 2 3 4 5 6 7 Large hoe Pickaxe Burn Paid labor Chop with machete
Crop rotation Fallow
Animals
Machinery ( )
Green fertilizer (velvet bean)
Fertilizing trees
Shade trees Living fence

119
Planting Plot 1 2 3 4 5 6 7 Hybrid seeds (selected)
Hybrid seeds (purchased)
Traditional seeds (selected)
Traditional seeds (purchased)
Fertilizer N P K %
Organic fertilizer
Sharpened stick
Large hoe Paid labor

120
Cultivation, Weeding, Etc.
Plot 1 2 3 4 5 6 7 Insecticide Herbicide Sprayer Sharpened stick
Weed with hoe Weed by hand Weed with machete
Machinery ( )
Paid labor Hoe for furrows
Fertilizer N P K %
Animal fertilizer
Irrigation Integrated pest control
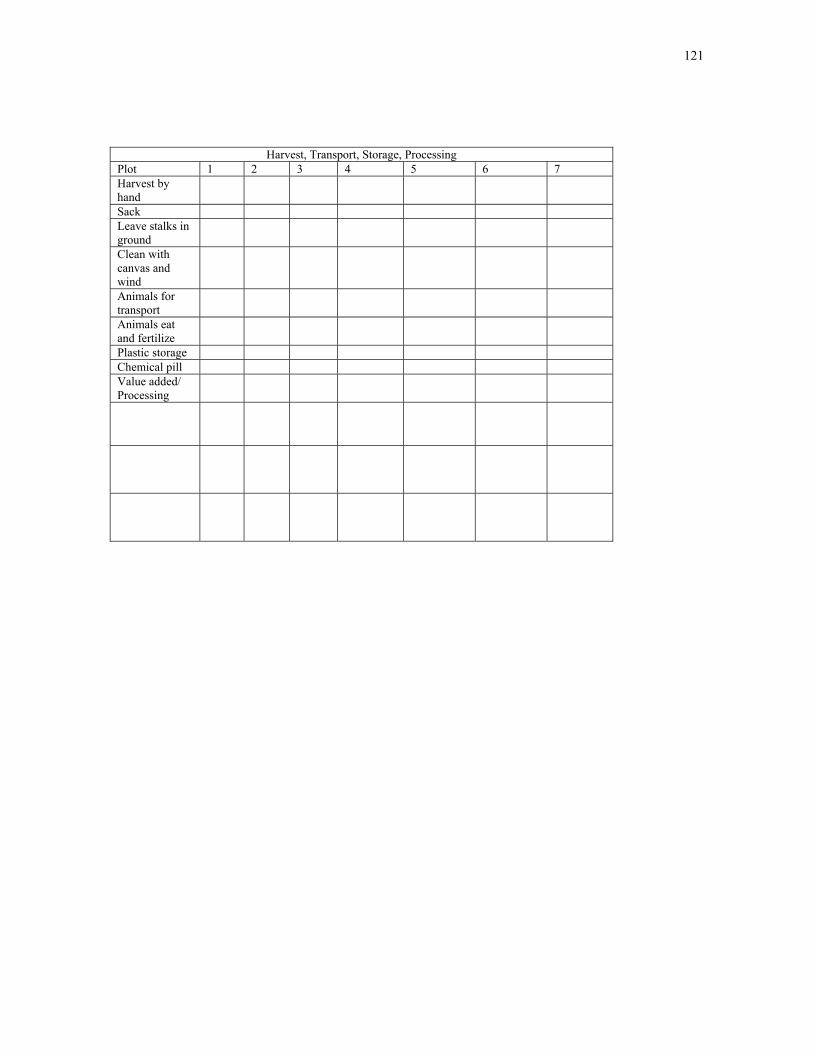
121
Harvest, Transport, Storage, Processing Plot 1 2 3 4 5 6 7 Harvest by hand
Sack Leave stalks in ground
Clean with canvas and wind
Animals for transport
Animals eat and fertilize
Plastic storage Chemical pill Value added/ Processing
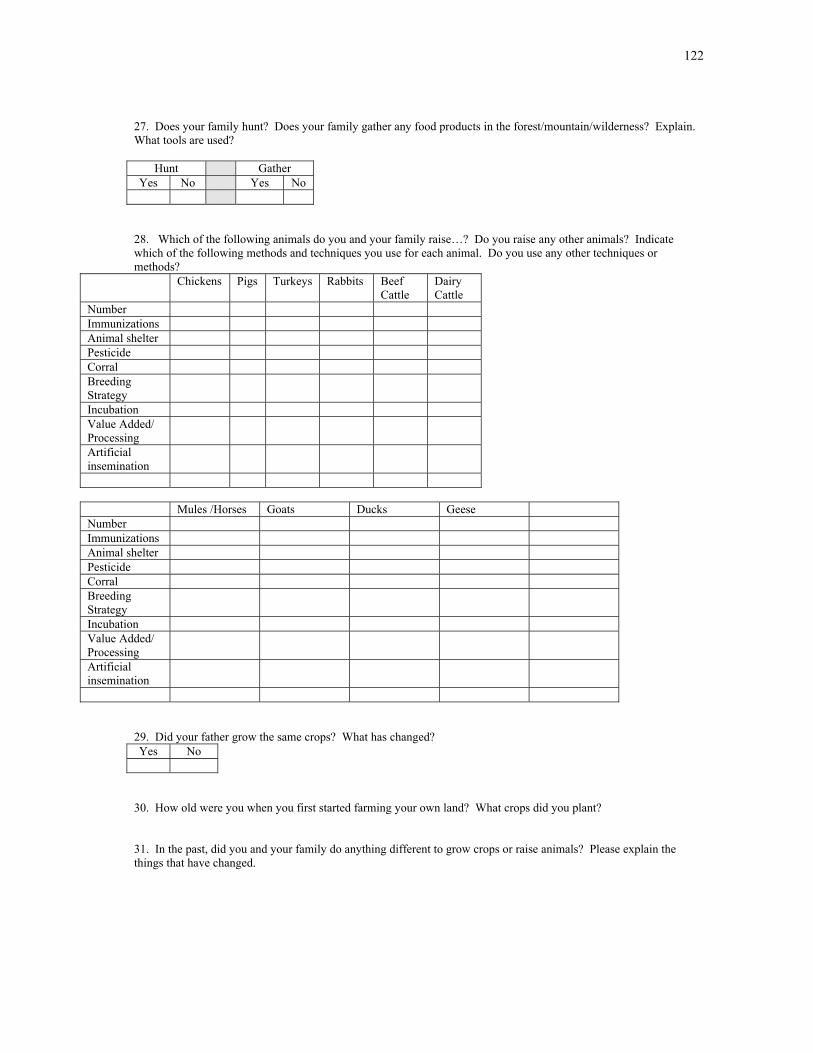
122
27. Does your family hunt? Does your family gather any food products in the forest/mountain/wilderness? Explain. What tools are used?
Hunt Gather Yes No Yes No
28. Which of the following animals do you and your family raise…? Do you raise any other animals? Indicate which of the following methods and techniques you use for each animal. Do you use any other techniques or methods?
Chickens Pigs Turkeys Rabbits Beef Cattle
Dairy Cattle
Number Immunizations Animal shelter Pesticide Corral Breeding Strategy
Incubation Value Added/ Processing
Artificial insemination
Mules /Horses Goats Ducks Geese Number Immunizations Animal shelter Pesticide Corral Breeding Strategy
Incubation Value Added/ Processing
Artificial insemination
29. Did your father grow the same crops? What has changed? Yes No
30. How old were you when you first started farming your own land? What crops did you plant? 31. In the past, did you and your family do anything different to grow crops or raise animals? Please explain the things that have changed.

123
32. Why did these things change? (From the previous three questions.) Where did the idea for the change come from? Family Radio Television Training News
paper Signs Neighbors Books Businesses
33. What were the results of the changes? Did it change the way people in the community interact? How? Yes No
34. Did anyone disagree with your changes in practice? Why? Yes No
35. Was there any conflict as a result of the changes? When I say conflict, I am not referring only to large conflicts, such as war. For example, a disagreement between husband and wife could be a conflict, or when a man gets angry at his neighbor. Another example is when someone is killed. All of these are examples of conflict. Yes No
36. Did the changes help to resolve any conflicts? What were they? Yes No
37. If the changes had not happened, would there have been more conflict? Why? Yes No
38. The conflicts and disagreements among people today are (more / equal / less) than in the past? More Equal Less Why? When did the change take place? 39. In the future there will be (more / equal / less) conflicts and disagreements than there are currently? More Equal Less Why?

124
40. For each crop, indicate whether the technique or method used by your family is better, worse, or the same as the techniques and methods used by other people in this community. Corn Bean Lima Bean Peanut Banana Amaranth Tomato Chayote Better Equal Worse 41. For each crop, indicate whether the technique or method used by your family is better, worse, or the same as the techniques and methods used by other people in surrounding communities. (Mention the names of specific communities.) Corn Bean Lima Bean Peanut Banana Amaranth Tomato Chayote Better Equal Worse 42. For each animal, indicate whether the technique or method used by your family is better, worse, or the same as the techniques and methods used by other people in this community. Chickens Pigs Turkeys Mules /
Horses Donkeys Goats
Better Worse Equal Ducks Dogs Cats Rabbits Sheep Beef
Cattle Dairy Cattle
Better Worse Equal 43. For each animal, indicate whether the technique or method used by your family is better, worse, or the same as the techniques and methods used by other people in surrounding communities. Chickens Pigs Turkeys Mules /
Horses Donkeys Goats Ducks
Better Worse Equal Dogs Cats Rabbits Sheep Beef
Cattle Dairy Cattle
Better Worse Equal 44. Do the people here use new agricultural methods or techniques other than what your family uses? Have they caused conflicts or disagreements? Techniques Conflict No Conflict Why? 45. In this area, what person or community has the best agricultural techniques and methods?

125
46. Is there conflict between these people (from the previous questions) and others? Why? What happens? Yes No
47. In this area, what person or community has the worst agricultural techniques and methods? 48. Is there conflict between them (from the previous question) and others? Why? What happens? Yes No
49. Is there conflict between people who participate in [ACG / other development organization indicated above] and those that do not participate? Why? What happens? Yes No
50. If the family wanted to borrow money for farming, would it be possible?
Sí No
51. Does your family borrow money to farm? What is the money used for?
Sí No
52. Is anyone in your family a member of a development organization?
ACG None
53. From whom does your family learn about agricultural methods?
ACG Neighbors Family None Indicated
54. (In the first row of the table, write the tools and equipment used.) The tools and equipment used by your family in the field...? How often? (Daily, Weekly, Monthly, Yearly) Tools Rented Shared Owned Cooperative 55. (If the family irrigates...) Does your family share a source of water for irrigation? Yes No
56. In this area, are there or have there been disagreements or conflict over the use of water? What happened? Yes No

126
57. In this area, is there or have there been disagreements or conflict over the use of land? What happened? How was it resolved? Yes No
58. During the civil war, did your family continue farming and caring for animals as before, or did you have to do something different? What changed? Continued the same Changed 59. During the civil war, what kind of difficulties did you have to plant, care for crops, harvest crops, and care for animals? 60. What did you do to overcome these difficulties? 61. Have people adopted new ways of farming since the end of the civil war? Do they use new tools or machines? Do they raise new animals? What are the new techniques, tools, machines, and animals?
Techniques Tools and machines Animals Yes No Yes No Yes No
62. Why did they make these changes? 63. Is there currently any conflict between people who speak different languages? Why? Yes No
64. Before or during the war, was there any conflict between people who spoke different languages? Why? Yes No
65. Would you like to continue using the same tools you now use? What would you change? Yes No
66. How do people react when a person begins to farm in a new way? (For example, if a person begins using fertilizer, herbicide, or a tractor.) 67. Is there conflict between people who farm differently? Please explain. Yes No
68. Is it dangerous for a woman to travel at night? Yes No

127
69. Is it dangerous for a man to travel at night? Yes No
70. Consider the crime here. There is…
Much Some Little None 71. That is all of the questions. Is there anything else you would like to say?

128
APPENDIX B
SPANISH VERSION QUESTIONNAIRE
Fecha_________________ Investigador______________________ 1. Ubicación
2. 3. ¿Cuántos años tiene usted? 18-25 26-35 36-45 46-55 56-65 66-75 76-85 86+ 4. ¿Está usted… 5. ¿Ha estudiado en algún centro educativo? ¿Qué grado ha cursado? (Pregunte lo mismo de su esposo(a).) Ninguno Primaria Básico Secundaria
(Bachillerato) Universidad NA
Señor Señora 6. ¿Cuántos hijos e hijas tiene usted? ¿Cuántos años tiene el hijo o la hija menor? ¿El o la mayor? 7. ¿Cuál es su idioma materno? K’iche’ Español 8. ¿Qué idioma habla en casa? K’iche’ Español 9. ¿Escribe y lee usted algun idoma? K’iche’ Español Leer Escribir 10. ¿Cuál es su religión? Católica Evangelio
(protestante) Espiritualidad maya
Carismática Ninguna
Comunidad Municipio Departamento Santa Cruz Quiché
Hombre Mujer
Casado Unido Divorciado Viudo Soltero Separado
Número Menor Mayor

129
11. ¿A qué se dedica usted? ¿su esposo(a)? (Si no tiene esposo(a), marque ‘NA’) Agricultura Señor Señora
12. ¿Tiene usted o su esposo(a) otra ocupación? ¿Cuál es la otra ocupación?
ocupación____________________ ocupación____________________
13. ¿Cuánto es el ingreso semanal de la familia? 14. La Casa... Piso Alquila Propia Tierra Cementada Piso
(Azulejo)
(Si alquila la casa...) ¿Cuánto paga de alquiler?_________________________
Techo Lámina Paja Teja Duralita Terraza Madera
¿Hay energía eléctrica? ¿El agua es de...? Sí No Pozo Potable (Cañarías)
15. (Si es de pozo) ¿A cuántos minutos queda de la casa?
NA -5 6-15 16-30 31-45 46-60 60+ 16. ¿Tiene su familia un teléfono? ¿Es célular o de línea?
Célular De línea No 17. ¿Tiene la familia una televisor?
Sí No
18. ¿Maneja usted una computadora?
Sí No
19. ¿Usa usted correo electrónico (email)?
Sí No
20. ¿Cuántas cuerdas o hectáreas de terreno alquila su familia?
Cuerdas Hectáreas
Sí No Señor Señora

130
21. ¿Cuántas cuerdas o hectáreas de terreno le pertenecen a su familia? (no alquiladas) Cuerdas Hectáreas
22. ¿Que tipo de terreno le pertenece? ¿Cultivable, boscoso, u otro? ¿Cuántas cuerdas o hectáreas?
Cultivado Boscoso
Cuerdas Hectáreas Cuerdas Hectáreas Cuerdas Hectáreas
23. ¿Cómo es el terreno de su familia…?
Muy productivo Mediano Poco productivo 24. Comparando el terreno de su familia con el terreno de sus vecinos, ¿el terreno de su familia es…?
Más productivo Igual Menos productivo 25. Comparando el terreno de su familia con el terreno de otras comunidades, ¿el terreno de su familia es…?
Más productivo Igual Menos productivo 26. ¿Qué cultivos cultiva su familia? (Llena la tabla para cada parcela. Si responden en cuerdas, tacha la palabra hectáreas.) Cultivos posibles son milpa, frijol, haba, manía, chayote, manzana, banano, platano, arroz, naranja, amaranto, cardamomo, sauco, hortalizas, etcetera.
Datos
Parcelas 1 2 3 4 5 6 7
Cultivos en la parcela
Milpa Frijol Haba
Milpa Frijol
Milpa
Mes sembrado
Terreno propio
Cuerdas o Hectáreas
Quintales 1. 2. 3.
Precio 1. 2. 3.
Distancia de la casa en metros
Robo es problema
(Si un cultivo está cerca de la casa...) ¿Porqué está cerca de la casa?
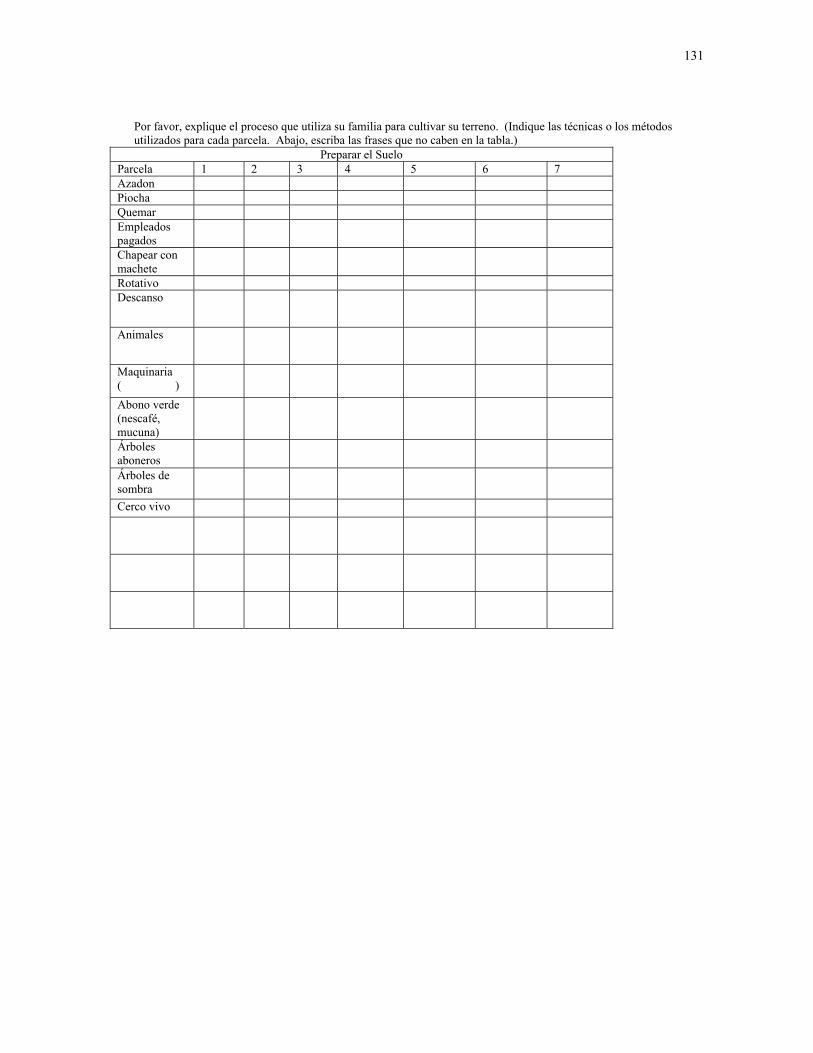
131
Por favor, explique el proceso que utiliza su familia para cultivar su terreno. (Indique las técnicas o los métodos utilizados para cada parcela. Abajo, escriba las frases que no caben en la tabla.)
Preparar el Suelo Parcela 1 2 3 4 5 6 7 Azadon Piocha Quemar Empleados pagados
Chapear con machete
Rotativo Descanso
Animales
Maquinaria ( )
Abono verde (nescafé, mucuna)
Árboles aboneros
Árboles de sombra
Cerco vivo

132
Sembrar Parcela 1 2 3 4 5 6 7 Semillas mejoradas (escojidas)
Semillas mejoradas (compradas)
Semillas criollas (escojidas)
Semillas criollas (compradas)
Abono N P K %
Abono orgánico
Palo afilado Azadon Empleados Pagados

133
Cultivar, Limpiar, Etc.
Parcela 1 2 3 4 5 6 7 Insecticida Herbicida Bomba Palo afilado Limpiar con azadon
Limpiar a mano
Limpiar con machete
Maquinaria ( )
Empleados pagados
Azadon para surcos
Abono N P K %
Abono animal Riego Control de bichos integrado

134
Cosechar, Transportar, Guardar, Procesar Parcela 1 2 3 4 5 6 7 Cosechar a Mano
Costal Dejar caña en terreno
Limpiar con lona y viento
Animales de carga
Animales comen y abonan
Tunel de plástico
Pastilla química
Valor Agregada/ Procesando
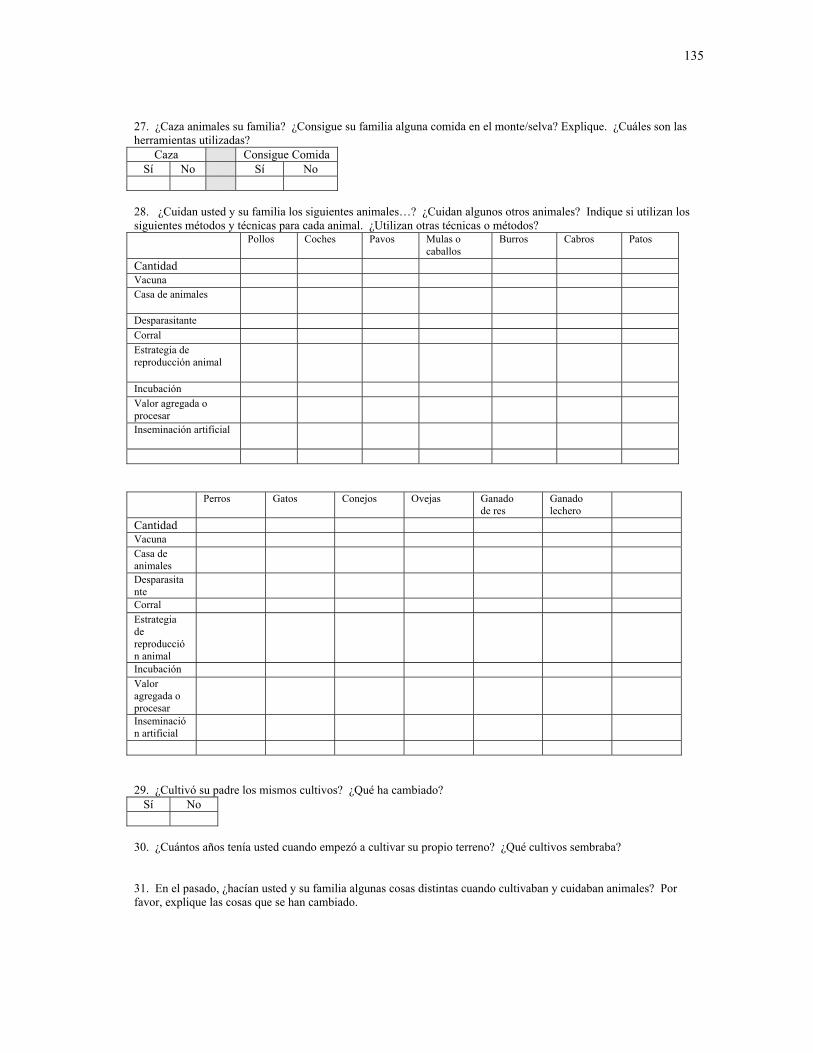
135
27. ¿Caza animales su familia? ¿Consigue su familia alguna comida en el monte/selva? Explique. ¿Cuáles son las herramientas utilizadas?
Caza Consigue Comida Sí No Sí No
28. ¿Cuidan usted y su familia los siguientes animales…? ¿Cuidan algunos otros animales? Indique si utilizan los siguientes métodos y técnicas para cada animal. ¿Utilizan otras técnicas o métodos? Pollos Coches Pavos Mulas o
caballos Burros Cabros Patos
Cantidad Vacuna Casa de animales
Desparasitante Corral Estrategia de reproducción animal
Incubación Valor agregada o procesar
Inseminación artificial
Perros Gatos Conejos Ovejas Ganado
de res Ganado lechero
Cantidad Vacuna Casa de animales
Desparasitante
Corral Estrategia de reproducción animal
Incubación Valor agregada o procesar
Inseminación artificial
29. ¿Cultivó su padre los mismos cultivos? ¿Qué ha cambiado?
Sí No
30. ¿Cuántos años tenía usted cuando empezó a cultivar su propio terreno? ¿Qué cultivos sembraba? 31. En el pasado, ¿hacían usted y su familia algunas cosas distintas cuando cultivaban y cuidaban animales? Por favor, explique las cosas que se han cambiado.

136
32. ¿Por qué se cambiaron esas cosas? (De las tres preguntas anteriores) ¿De dónde vino la idea de cambiar? Familia Radio Televisor Capacitación Prensa Letreros Vecinos Libros Empresas
33. ¿Cuáles han sido los resultados de estos cambios?
¿Cambió la gente su manera de comportarse? ¿De qué manera cambió?
Sí No
34. ¿Había alguien que no estaba de acuerdo con los cambios? ¿Porqué?
Sí No
35. ¿Resultó algún conflicto como consequencia de los cambios? Cuando digo conflicto, no quiero decir solamente conflictos grandes como una guerra, sino, por ejemplo, un desacuerdo entre un señor y su esposa puede ser un conflicto. También, si se enoja un señor con su vecino, o si se mata a alguien, estos también son conflictos.
Sí No
36. ¿Los cambios ayudaron a resolver algun conflicto? ¿Cuáles fueron?
Sí No
37. ¿Si los cambios no hubieron pasado, habria más conflicto? ¿Porqué?
Sí No
38. Actualmente ¿el conflicto y desacuerdos entre la gente es (más / igual / menos) que en el pasado? Más Igual Menos ¿Porqué? ¿Cuándo ocurió el cambio? 39. En el futuro ¿habrá (más / igual / menos) conflictos y desacuerdos que actualmente hay? Más Igual Menos ¿Porqué? 40. Para cada cultivo, indique si la técnica o método que utilizan usted y su familia es mejor, peor, o igual a las técnicas o métodos que utilizan las personas de su comunidad. Milpa Frijol Haba Manía Banano Amaranto Tomate Chayote Mejor Igual Peor
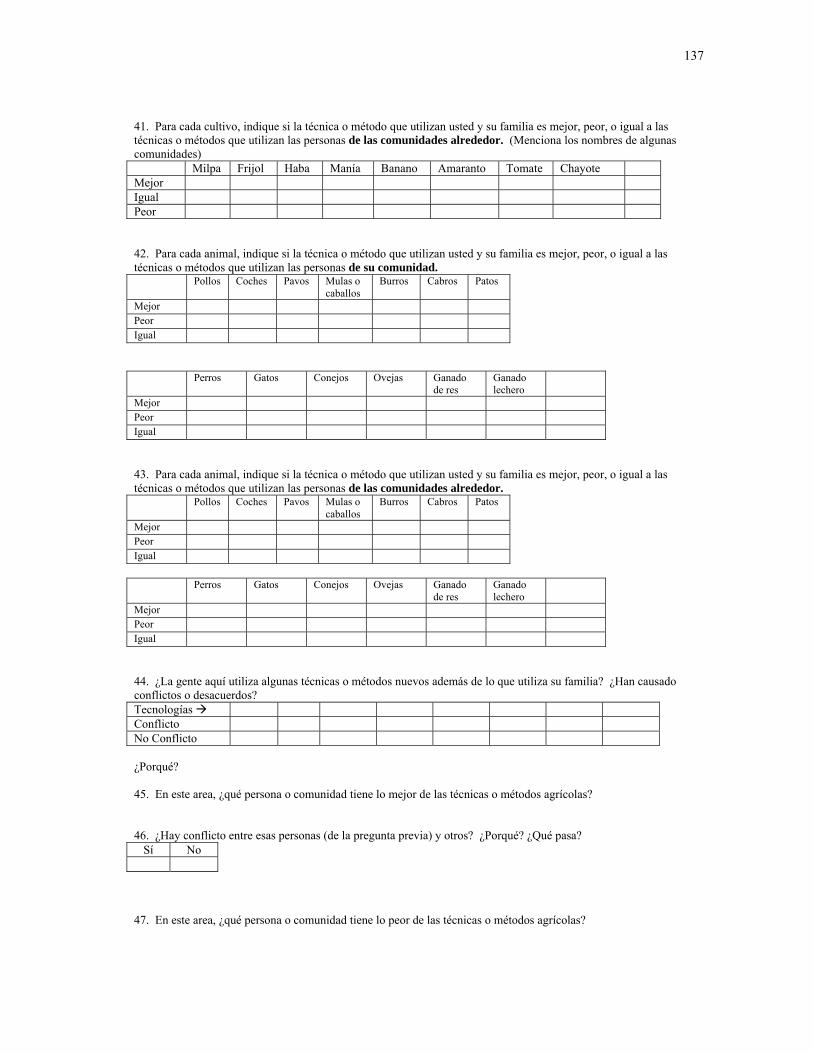
137
41. Para cada cultivo, indique si la técnica o método que utilizan usted y su familia es mejor, peor, o igual a las técnicas o métodos que utilizan las personas de las comunidades alrededor. (Menciona los nombres de algunas comunidades) Milpa Frijol Haba Manía Banano Amaranto Tomate Chayote Mejor Igual Peor 42. Para cada animal, indique si la técnica o método que utilizan usted y su familia es mejor, peor, o igual a las técnicas o métodos que utilizan las personas de su comunidad. Pollos Coches Pavos Mulas o
caballos Burros Cabros Patos
Mejor Peor Igual Perros Gatos Conejos Ovejas Ganado
de res Ganado lechero
Mejor Peor Igual 43. Para cada animal, indique si la técnica o método que utilizan usted y su familia es mejor, peor, o igual a las técnicas o métodos que utilizan las personas de las comunidades alrededor. Pollos Coches Pavos Mulas o
caballos Burros Cabros Patos
Mejor Peor Igual Perros Gatos Conejos Ovejas Ganado
de res Ganado lechero
Mejor Peor Igual 44. ¿La gente aquí utiliza algunas técnicas o métodos nuevos además de lo que utiliza su familia? ¿Han causado conflictos o desacuerdos? Tecnologías Conflicto No Conflicto ¿Porqué? 45. En este area, ¿qué persona o comunidad tiene lo mejor de las técnicas o métodos agrícolas? 46. ¿Hay conflicto entre esas personas (de la pregunta previa) y otros? ¿Porqué? ¿Qué pasa?
Sí No
47. En este area, ¿qué persona o comunidad tiene lo peor de las técnicas o métodos agrícolas?

138
48. ¿Hay conflicto entre ellos (de la pregunta previa) y otros? ¿Porqué? ¿Qué pasa? Sí No
49. ¿Hay conflicto entre gente que participa en [ACG/otra organización de desarollo indicado arriba] y los que no participan? ¿Porqué? ¿Qué pasa?
Sí No
50. Si la familia quisiera prestar dinero para cultivar, ¿sería posible?
Sí No
51. ¿Su familia presta dinero para cultivar? ¿Para qué se utiliza el dinero?
Sí No
52. ¿Es alguien de su familia integrante de una organización de desarollo?
ACG Ninguno 53. ¿De quien aprende su familia de métodos agrícolas?
ACG Vecinos Familia Ninguno
54. (Coloque las herramientas y equipo utilizadas en la primera fila de la tabla.) Las herramientas y equipo que usa su familia en el campo, ¿las…? ¿Con qué frequencia? (Diario, Semanalmente, Mensualmente, Añualmente) Herramientas
Propio Alquila Comparte Cooperativo 55. (Si la familia utiliza riego...) ¿Comparte su familia una fuente de agua para riego?
Sí No NA
56. En este area, ¿hay o había desacuerdos o conflictos sobre el uso de agua? ¿Qué pasó?
Sí No
57. ¿Hay o había conflictos o desacuerdos en esta región sobre el uso de terreno? ¿Qué pasó? ¿Cómo se resolvió?
Sí No
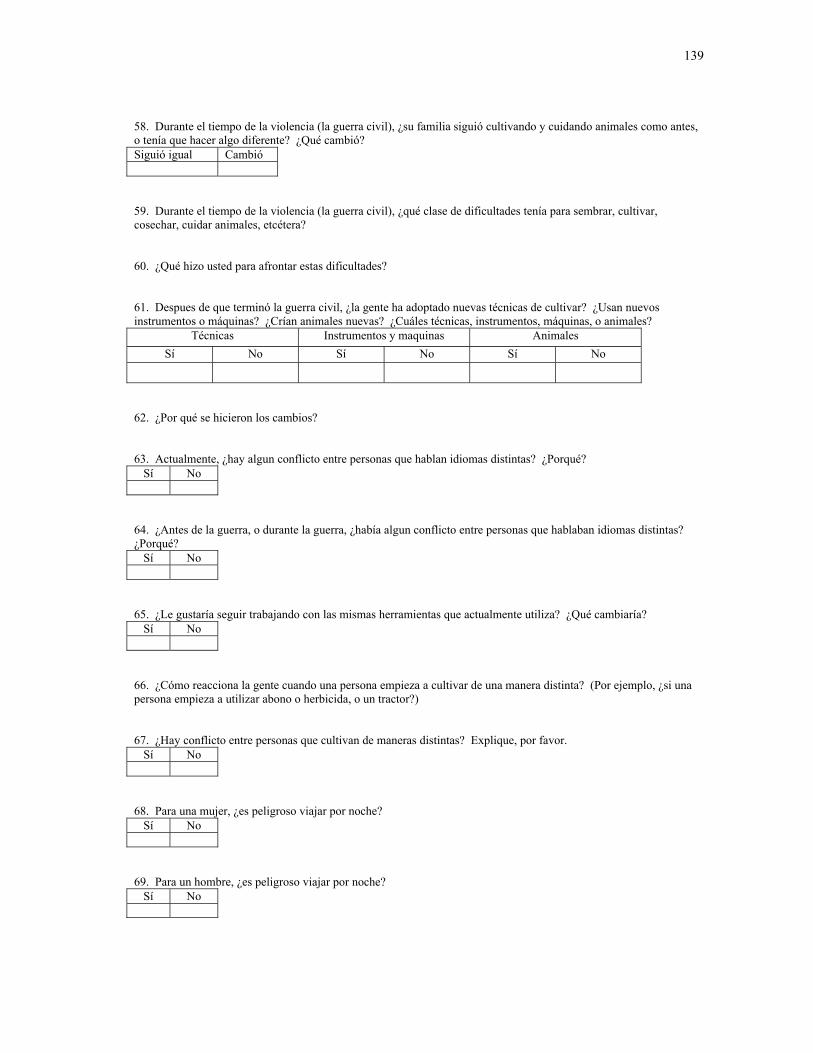
139
58. Durante el tiempo de la violencia (la guerra civil), ¿su familia siguió cultivando y cuidando animales como antes, o tenía que hacer algo diferente? ¿Qué cambió? Siguió igual Cambió 59. Durante el tiempo de la violencia (la guerra civil), ¿qué clase de dificultades tenía para sembrar, cultivar, cosechar, cuidar animales, etcétera? 60. ¿Qué hizo usted para afrontar estas dificultades? 61. Despues de que terminó la guerra civil, ¿la gente ha adoptado nuevas técnicas de cultivar? ¿Usan nuevos instrumentos o máquinas? ¿Crían animales nuevas? ¿Cuáles técnicas, instrumentos, máquinas, o animales?
Técnicas Instrumentos y maquinas Animales Sí No Sí No Sí No
62. ¿Por qué se hicieron los cambios? 63. Actualmente, ¿hay algun conflicto entre personas que hablan idiomas distintas? ¿Porqué?
Sí No
64. ¿Antes de la guerra, o durante la guerra, ¿había algun conflicto entre personas que hablaban idiomas distintas? ¿Porqué?
Sí No
65. ¿Le gustaría seguir trabajando con las mismas herramientas que actualmente utiliza? ¿Qué cambiaría?
Sí No
66. ¿Cómo reacciona la gente cuando una persona empieza a cultivar de una manera distinta? (Por ejemplo, ¿si una persona empieza a utilizar abono o herbicida, o un tractor?) 67. ¿Hay conflicto entre personas que cultivan de maneras distintas? Explique, por favor.
Sí No
68. Para una mujer, ¿es peligroso viajar por noche?
Sí No
69. Para un hombre, ¿es peligroso viajar por noche?
Sí No

140
70. Considere el crímen que hay aquí. Hay… Mucho Mediano Poco No hay
71. Ya no hay más preguntas. ¿Quiere usted decir algo más?

141
APPENDIX C
REGRESSION RESULTS
The following table displays the results of the multinomial logit model described
in Chapter IV, section F. The baseline scenario is “Organic Only” for the dependent
variable, and the results below should be interpreted accordingly. For instance, the
positive sign on the variable “Microcredit” in the “Synthetic and Active Organic”
catagory indicates that participation in a microcredit program increases the probability of
choosing “Synthetic and Active Organic” over the baseline “Organic Only.”
B S.E. t-stat P-
value Emigrated 30.121 2037300.000 0.000 1.000Microcredit*** 3.161 1.122 2.817 0.005Total_Owned -0.003 0.008 -0.419 0.675Ed_Elementary 0.466 0.896 0.520 0.603Ed_Middle_Plus -0.475 0.898 -0.530 0.596Lan_Spanish 26.950 1539990.000 0.000 1.000
Synthetic and
Active Organic
Lan_Kiche_and_Spanish -2.467 1.666 -1.480 0.139
Emigrated 28.843 2037300.000 0.000 1.000Microcredit 1.690 1.166 1.449 0.147Total_Owned -0.004 0.008 -0.529 0.597Ed_Elementary 0.736 0.901 0.817 0.414Ed_Middle_Plus -0.744 0.902 -0.824 0.410Lan_Spanish 27.719 1539990.000 0.000 1.000
Synthetic and
Passive Organic
Lan_Kiche_and_Spanish -1.072 1.553 -0.690 0.490
Emigrated -0.512 2947620.000 0.000 1.000Microcredit 1.746 1.163 1.502 0.133Total_Owned -0.004 0.008 -0.431 0.666Ed_Elementary -0.105 0.934 -0.113 0.910Ed_Middle_Plus 0.097 0.935 0.104 0.917Lan_Spanish 28.635 1539990.000 0.000 1.000
Synthetic Only
Lan_Kiche_and_Spanish 0.239 1.501 0.160 0.873

142
N = 60 ***significantly different from 0 at the p = 0.01 level
Chi squared 6.82Degrees of freedom 18
p value = 0.991
The following are the results from two logit models described in Chapter IV,
section F.
Dependent variable: Insecticide
B S.E. Wald df Sig.
Emmigrated 1.804 1.150 2.461 1 0.117
Microcredit -0.358 0.822 0.189 1 0.663
TotalOwned 0.008 0.039 0.037 1 0.848
Ed_Elementary -0.508 0.714 0.505 1 0.477
Ed_Middle_Plus -21.164 22,310.634 0.000 1 0.999
Lan_Spanish 1.508 0.922 2.672 1 0.102
Lan_Kiche_and_Spanish -0.317 1.233 0.066 1 0.797
Constant -1.216 0.905 1.806 1 0.179
N = 60
Predicted Insecticide Use
Observed 0 1 Percentage
Correct 0 47 1 97.9
Insecticide 1 10 2 16.7
Overall Percentage 81.7

143
Dependent variable: Vaccinate
B S.E. Wald df Sig. Emmigrated 0.428 1.230 0.121 1 0.728
Microcredit -0.115 0.734 0.024 1 0.876
TotalOwned 0.028 0.044 0.411 1 0.521
Ed_Elementary 0.412 0.639 0.415 1 0.519
Ed_Middle_Plus 19.940 21,366.382 0.000 1 0.999
Lan_Spanish 20.466 13,784.799 0.000 1 0.999
Lan_Kiche_and_Spanish -0.572 0.878 0.425 1 0.515
Constant 0.382 0.859 0.197 1 0.657
N = 60
Predicted Vaccinate
Observed 0 1 Percentage
Correct 0 1 16 5.9
Vaccinate 1 0 43 100.0
Overall Percentage 73.3
144
VITA
Name: Cody John Zilverberg Permanent Address: 18542 326 Ave. Holabird, SD 57540 Email Address: [email protected] Education: B.A., Computer Science, St. John’s University, Collegeville, MN, May 2000 M.S., Agricultural Economics, Texas A&M University, College Station, TX, May 2007