agroclimatic characterization of meghalaya - crida 3/s-vii/j goswami.pdf · meghalaya state 0 120...
TRANSCRIPT

Geom
atics
Geom
atics-- b
ased
based
agro
clim
atic
agro
clim
atic
chara
cte
rization o
f chara
cte
rization o
f
Meghala
ya
Meghala
ya
North Eastern Space Applications Centre
North Eastern Space Applications Centre
Dept. of Space, UMIAM
Dept. of Space, UMIAM--793103
793103
J.G
OSW
AM
I
(Em
ail: jo
nali.g
osw
am
ov.in)
INSAFS-20thFebruary2008

Literally
it is the Abode of the Clouds, the name Meghalaya
describes
the
clim
atic phenomenon that brings torrents of rain to its m
ountainous terrain. No
wonder the two m
ost w
ettest place
s on earth 'Mawsy
nram' and 'Cherrapunjee'
are found here.
Geographical Land to M
an R
atio (Hectares/Person) as on 1991 is 1.26 w
hereas
National average is 0.39 H
ectares/Person.
Total geographical area in H
ectares
is 2
2,42,900. Only 12%
of geographical
area ie. 265874 hectares is total cropped area as on 2003-2004. Net area sown
and area so
wn more than once
is 219224 hectares
and 46650 hectares
resp
ectively.
The region o
ffers sco
pe for cu
ltivation o
f a w
ide v
ariety o
f agricu
ltural crops
beca
use
of its diversities in topography, altitude and clim
atic co
nditions.
It is im
portant to evaluate and characterize
agroclim
ate
prevalent in this region
for agricu
ltural developmental planning b
y careful assessment ofagro-clim
atic
reso
urces
01
20
24
03
60
60
Me
ters
Meghalaya
Meghalaya

NARP* m
ap shows regional level
classification
There is no clear lin
e o
f demarcation
betw
een two zones.
Clim
atic parameter are often taken as
non spatial data in G
IS environment.
Inform
ation on sp
atial distribution of
temperature,
rainfall
etc at
varying
scale are not
availa
ble lik
e other
spatial layers su
ch as
land use
land
cover,
geology,
geomorphology,
drainage etc.
Detaile
d inform
ation on agroclim
atic
zone at
large scale (D
istrict/block
level)
is
a
limitation
for
proper
decision m
aking.
click h
ere
click h
ere
Sourc
e:*
National A
gricultura
l R
esearc
h P
roje
ct (N
AR
P), IC
AR
01
20
24
03
60
60
Me
ters
Agroclimatic
Agroclimaticzones of NE Hill Region
zones of NE Hill Region

Stu
dy a
rea
Spatial In
form
ation:
•Adm
inistrative B
oundary
•Dig
ital elevation m
ap.
•Land Use and Land Cover
(LULC)
map.
(Natural
Reso
urces
Database
, NRDB;
Biodiversity project).
•Soil m
ap a
t 1:2
,50,0
00 scale.
(National
Bureau
of
Soil
Survey
and
Land
Use
Planning,
NBSS&LUP).
Megha
laya
Sta
te
01
20
24
03
60
60
Me
ters
Study area and Data Used
Study area and Data Used
Non S
patial Info
rmation
•Weath
er data
: rain
fall, m
axim
um
and
min
imum
te
mpera
ture
fo
r aleast10 years
. •I
nfo
rmation o
n A
gro
clim
atic
zone
of Meghalaya.
01
20
24
03
60
60
Me
ters
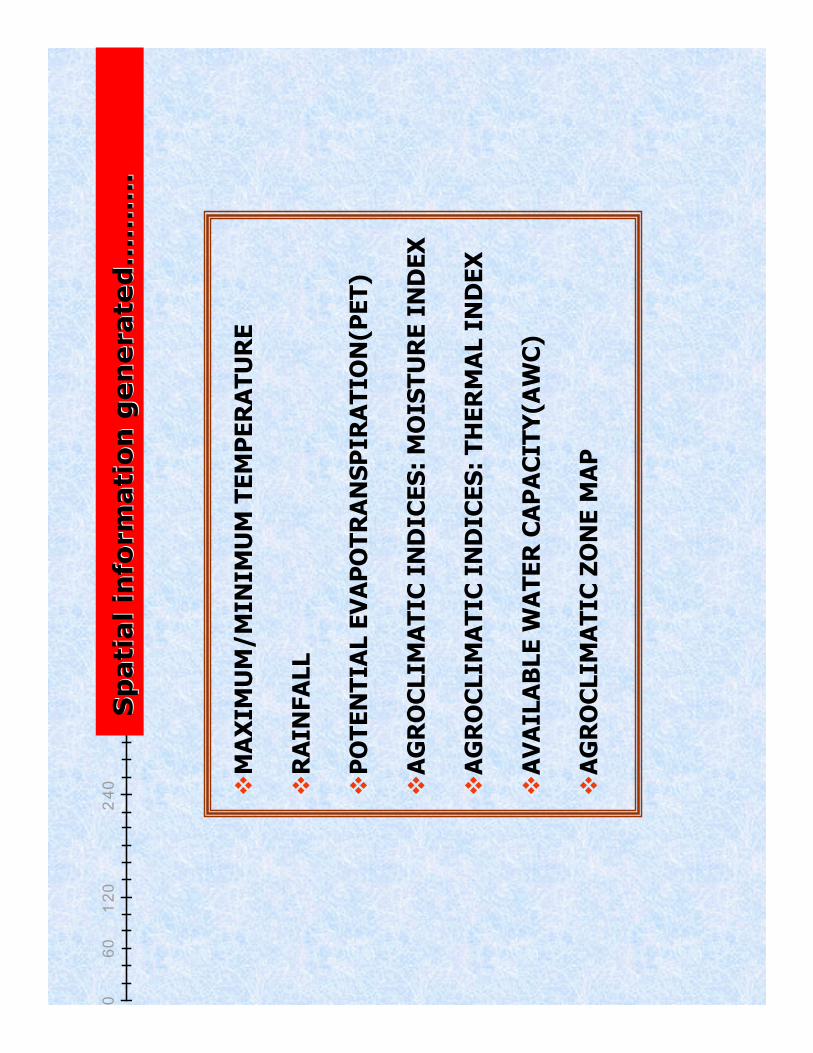
Spatial information generated……….
Spatial information generated……….
�MAXIMUM/MINIMUM TEMPERATURE
�RAINFALL
�POTENTIAL EVAPOTRANSPIRATION(P
ET)
�AGROCLIMATIC INDICES: MOISTURE INDEX
�AGROCLIMATIC INDICES: THERMAL INDEX
�AVAILABLE W
ATER C
APACITY(A
WC)
�AGROCLIMATIC Z
ONE M
AP

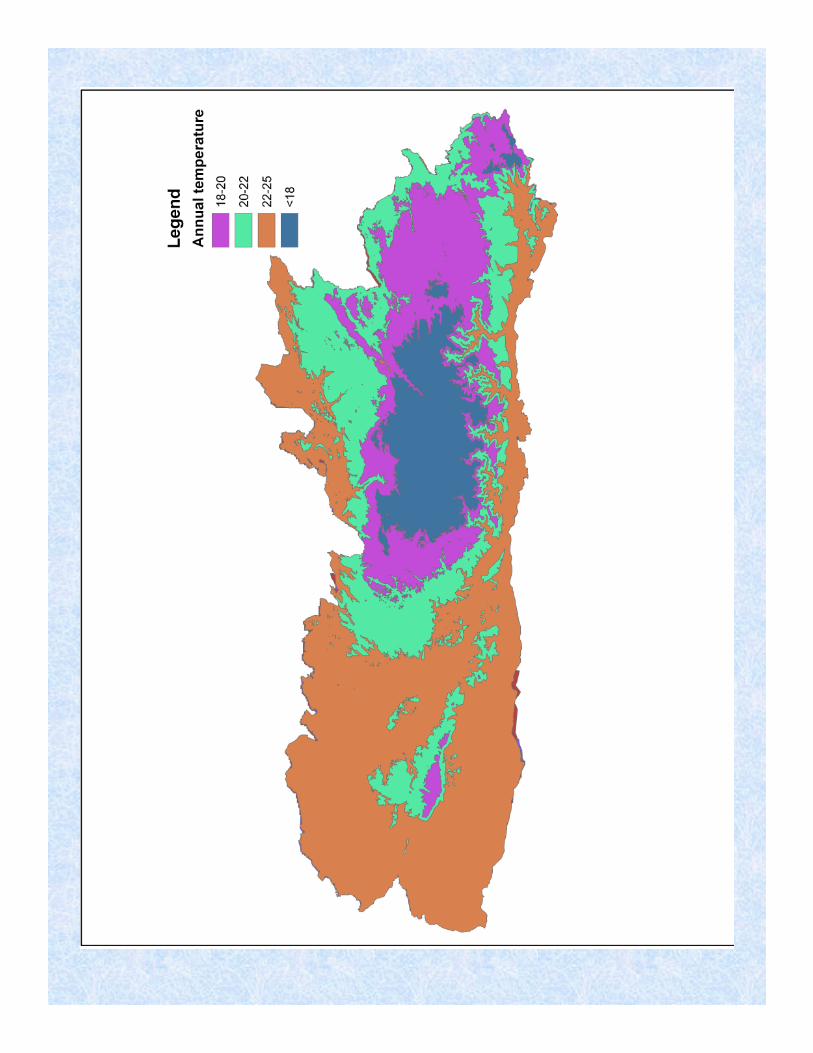
Long term
monthly and annual averages of mean temperature of
all the stations when regressed a
gainst corresp
onding e
levation
data, a good co
rrelation was
obse
rved betw
een annual mean
temperature and elevation.
Annual mean temperature=27.346-0.0066 ×
elevation, R2=0.93).
01
20
24
03
60
60
Me
ters
SPATIAL DISTRIBUTION OF TEMPERATURE
SPATIAL DISTRIBUTION OF TEMPERATURE

The sp
atial variation of annual rainfall
was
generated in GIS
environment
using kriging
interpolation tech
nique where su
rface
was
created base
d on
the form
ula given in Eq.1
Kriging
assumes
that
the distance
or
direction betw
een sa
mple points
reflects
a sp
atial co
rrelation that ca
n be use
d to explain variation in the
surface
.
Z(s
o)
= ∑
λiZ
(Si)…
……
……
….e
q.1
N
i=1
where:
Z(s
o) = the value at the prediction loca
tion s
o.
Z(s
i) = the m
easu
red value at the ithloca
tion.
λi= an unknown w
eight for the m
easu
red value at the ithloca
tion.
N =
the number of measu
red values.
01
20
24
03
60
60
Me
ters
SPATIAL DISTRIBUTION OF RAINFALL
SPATIAL DISTRIBUTION OF RAINFALL
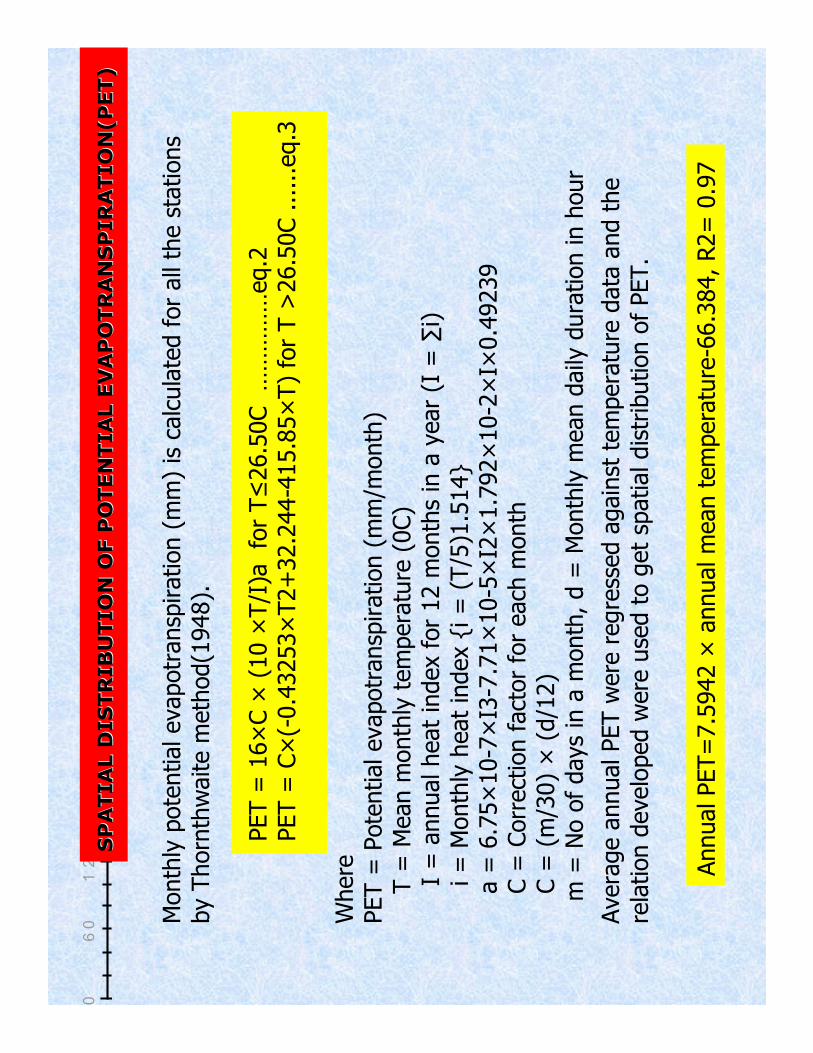
Monthly potential evapotransp
iration (mm) is calculated for all the stations
by Thornthwaite m
ethod(1
948).
PET =
16×C ×
(10 ×
T/I)a
for T≤26.50C ……………eq.2
PET =
C×(-0.43253×T2+32.244-415.85×T) for T >
26.50C ......eq.3
Where
PET =
Potential evapotransp
iration(m
m/m
onth)
T =
Mean m
onthly temperature (0C)
I = annual heat index for 12 m
onths in a year (I =
∑i)
i = M
onthly heat index {i = (T/5
)1.514}
a =
6.75×10⁻⁷×I3
-7.71×10⁻⁵×I2
×1.792×10-2×I×
0.49239
C =
Correction factor for each
month
C =
(m/3
0) × (d/1
2)
m =
No of days in a m
onth, d =
Monthly m
ean daily
duration inhour
Annual PET=7.5942 ×
annual mean temperature-66.384, R2= 0.97
Average annual PET w
ere regressed against temperature data and the
relation developed w
ere use
d to get sp
atial distribution of PET.
01
20
24
03
60
60
Me
ters
SPATIAL DISTRIBUTION OF POTENTIAL EVAPOTRANSPIRATION(PET)
SPATIAL DISTRIBUTION OF POTENTIAL EVAPOTRANSPIRATION(PET)
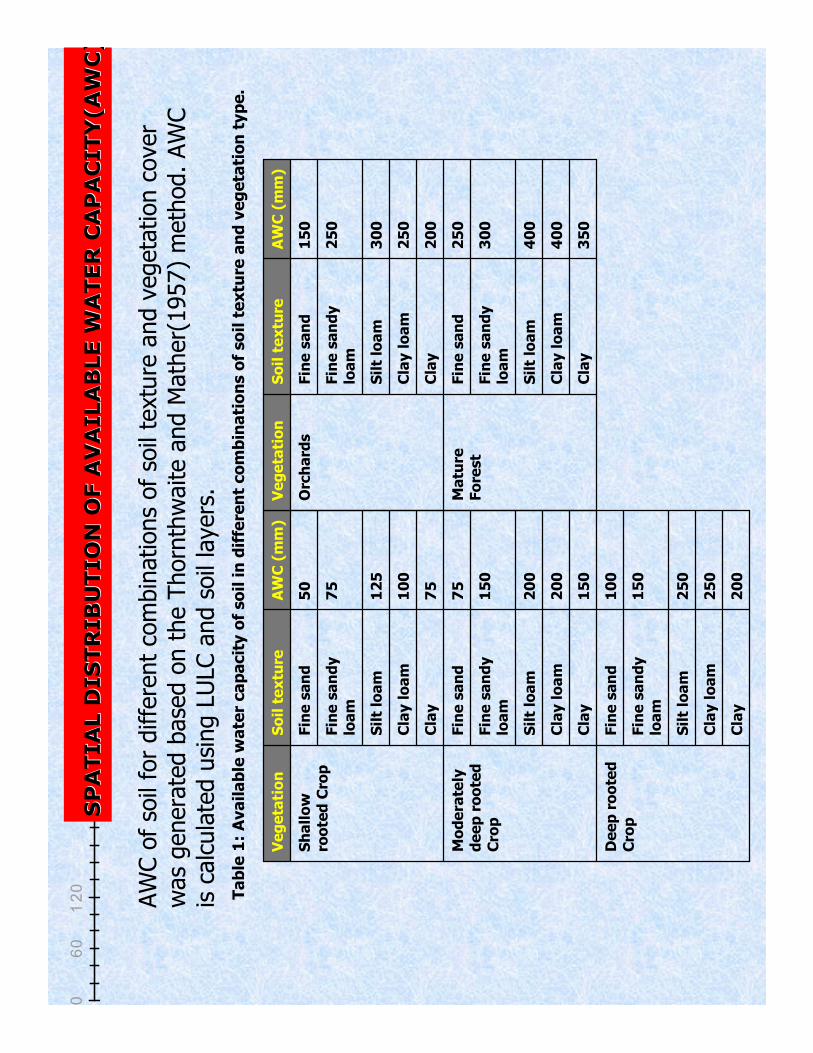
AWC of so
il for different co
mbinations of so
il texture and vegetation cover
was generated base
d on the Thornthwaiteand M
ather(1957) method. AWC
is calculated using LULC and soil layers.
Table 1
: Available w
ate
r capacity o
f soil in d
iffe
rent com
bin
ations o
f soil textu
re and vegeta
tion type.
200
Clay
250
Clay loam
250
Silt lo
am
150
Fin
e sandy
loam
100
Fin
e sand
Deep roote
d
Cro
p
150
Clay
200
Clay loam
200
Silt lo
am
150
Fin
e sandy
loam
75
Fin
e sand
Modera
tely
deep roote
d
Cro
p
75
Clay
100
Clay loam
125
Silt lo
am
75
Fin
e sandy
loam
50
Fin
e sand
Shallow
roote
d C
rop
AW
C (m
m)
Soil textu
reVegeta
tion
350
Clay
400
Clay loam
400
Silt lo
am
300
Fin
e sandy
loam
250
Fin
e sand
Matu
re
Fore
st
200
Clay
250
Clay loam
300
Silt lo
am
250
Fin
e sandy
loam
150
Fin
e sand
Orc
hard
s
AW
C (m
m)
Soil textu
reVegeta
tion
01
20
24
03
60
60
Me
ters
SPATIAL DISTRIBUTION OF AVAILABLE W
ATER CAPACITY(AWC)
SPATIAL DISTRIBUTION OF AVAILABLE W
ATER CAPACITY(AWC)

Two agroclim
aticindices, m
oisture index (MI)
and therm
al index(T
I)by Krish
nan
and M
ukhtarSingh(1
972) were w
orked out using follo
wing equation
MI=
P-P
ET
PET
*100
Where
, MI= M
oistu
re Index,
P =
Pre
cip
itation,
PET= P
ote
ntial Evapotranspiration
Extrem
ely W
et
>100
8
Wet
50 to 1
00
7
Moistu
re0 to 5
06
Slightly M
oistu
re-2
0 to 0
5
Slightly D
ry-4
0 to -20
4
Dry
-60 to -40
3
Sem
i Dry
-80 to -60
2
Extrem
ely D
ry<80
1
Clim
atic g
roup
Moistu
re
Index V
alu
eSl.
No.
TI=
Tm
ax+ T
min
2
Very
Cold
<10ºC
5
Cold
10ºC to 2
0ºC
4
Mild
20ºC to 2
5ºC
3
Hot
25ºC to 2
8ºC
2
Very
Hot
>28ºC
1
Clim
atic g
roup
Therm
al In
dex
Valu
eSl. N
o.
Where, TI= Therm
al Index
Tm
ax= M
axim
um
tem
pera
ture
Tm
in= M
inim
um
Tem
pera
ture
0120
240
360
60M
eters
AGROCLIMATIC CHARACTERIZATION OF THE STUDY AREA
USING ANNUAL W
EATHER VARIABLES:

Mois
ture
Index M
ap c
lick h
ere
click h
ere
01
20
24
03
60
60
Me
ters
AgroclimaticIndices: Moisture Index

Therm
al In
dex M
ap click h
ere
click h
ere
01
20
24
03
60
60
Me
ters
Agroclimatic
AgroclimaticIndices: Thermal Index
Indices: Thermal Index

Clim
atic classification of Meghalayabased on M
Iand TI
Click h
ere
Click h
ere
01
20
24
03
60
60
Me
ters
Agroclimatic
AgroclimaticZonation
Zonation
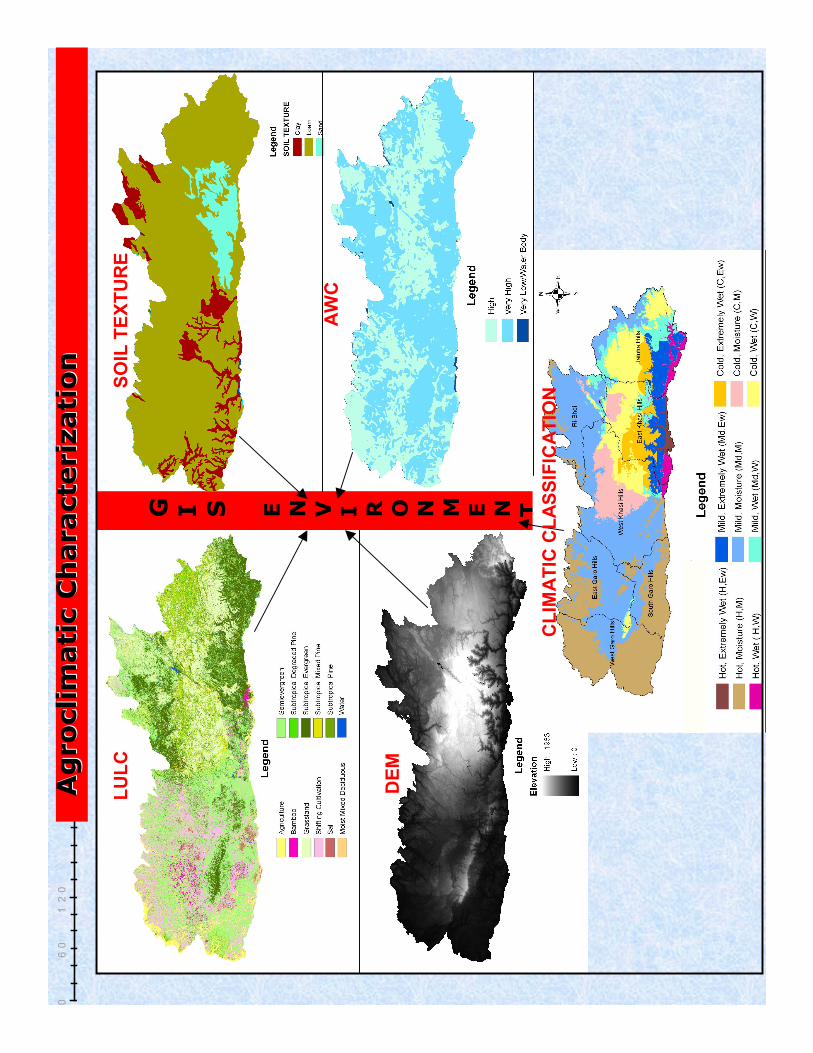
G I S E N V I R O N M E N T
LU
LC
SO
IL T
EXTU
RE
DEM
AW
C
CLIM
ATIC
CLA
SSIF
ICA
TIO
N
01
20
24
03
60
60
Me
ter
sAgroclimatic
AgroclimaticCharacterization
Characterization

01
20
24
03
60
60
Me
ters
25.1
75640
Agriculture
, Bam
boo,
current and abandoned
jhum
, fo
rest
Loam
, Clay
VH,H
<200
HM
2.2
2498
Agriculture
, Sub tro
pical
gra
ssland
Loam
, Sand
VH,H
<200
HW
0.7
7177
Agriculture
, Sub tro
pical
gra
ssland
Loam
, Sand
VH,H
<200
HEw
35.4
77959
Agriculture
, current and
abandoned jhum
, sem
ieverg
reen
and
everg
reen fore
st.
Loam
, Clay
VH,H
200-1
100
MdM
5.4
91233
Gra
ss land, pin
e,
subtropical fo
rest,
Loam
, Sand
VH,H
200-1
300
MdW
5.8
51314
Gra
ss land, pin
e,
subtropical fo
rest,
Loam
, Sand
VH,H
200-1
300
MdEW
6.6
31487
Agro
-horticulture
, degra
ded fore
st, g
rassland,
subtropical fo
rest
Loam
VH,H
1000-1
500
CM
12.8
2874
Agro
-Horticulre, pin
e, gra
ss
land subtropical fo
rest
Loam
VH,H
1000-1
800
CW
5.6
1250
Planta
tion cro
p, Gra
ss land,
pin
e, subtropical fo
rest,
Loam
, Sand
Very
Hig
h
(VH),
Hig
h(H
)
1000-1
900
CEw
%
Are
aAre
a(S
q.K
m)
Pre
sent LULC
Soil
textu
re
AW
CElevation
(mm
)Clim
atic
Gro
up *
Agro
Agro--climatic characterization
climatic characterization
* The abbre
viations u
sed in the table are
explain
ed in p
revio
us slide. Click h
ere
Click h
ere

Comparisonof the agro-climatic zone map
prepared by Indian Council of Agricultural
Research under National Agricultural Research
Project (NARP)with the m
ap prepared in the
present studyshows the following points:
�The N
ARP classification w
as for the entire H
ill R
egion of NER asa unit and has
only six distinct zones. W
hereas the prese
nt study w
as donefor Meghalaya
state alone and it has been classified into nine clim
atic groups.
�It is difficu
lt from N
ARP m
ap to draw a clear lin
e of demarcation betw
een two
zones.
�NARP m
ap do not provide spatial distribution of zo
nes in each
district /state. It
has mentioned only about few parts of the district or state covered by each
zo
nes. There w
as no clarity about other parts of the district/state.
�Each
district has more agro-clim
atic zo
nes than defined by N
ARP m
ethods.
Click h
ere
Click h
ere

West and S
outh
Garo
Hills w
as o
ne d
istrict at th
e tim
e
of stu
dy.
MdM(3
0),HM(7
0)
Sub tropical
Hill
and M
ild T
ropical
Plain
South
Garo
Hills
Mentioned only about Upper Shillo
ng, Mawphla
ng.
MdEw(1
8),MdM(1
),MdW
(8.4
), HEw(6
),HW
(6),CEw(2
7),CM(
7.9
)CW
(26)
Tem
pera
te
Sub
Alp
ine
East Khasi
Hills
Mawkhang
are
a falls u
nder Sub T
ropical Hill. U
mkhiang
are
a is S
ub T
ropical Plain
and south
ern
part u
nder Mild
Tro
pical Hill zone.
MdEw(1
7),MdM(1
4),MdW
(20
), C
Ew(7
), C
W(3
5)
Sub T
ropical Hill,
Sub
Tro
pical
Plain
and
Mild
Tro
pical Hill
Jain
tiaHills
Part o
f nongsto
insubdivisio
n com
es u
nder Sub T
ropical
Hill and p
art u
nder Mild T
ropical Hill zone.
MdM(4
8.8
),MdEw(2
.5),
MdW
(1.7
),HM(5
.5),HW
(1),
CEw(3
.8)C
M(2
3.5
),CW
(13.2
)
Sub Tro
pical Hill
and M
ild T
ropical
Hill
West Khasi
Hills
Nokre
kand K
ailash
are
a com
es u
nder Sub T
ropical and
lower part o
f th
e d
istrict in
Mild Tro
pical Plain
zone.
MdM(2
0),HM(7
8),CW
(2)
Sub tropical
Hill
and M
ild T
ropical
Plain
West Garo
Hills
Weste
rn part com
es under
Sub Tro
pical
Hill
and
easte
rn p
art u
nder Mild T
ropical Hill zone.
MdM(5
9),MdM(0
.5),HM(3
9),
CW
(1.5
)Sub tropical
Hill
and M
ild T
ropical
Hill
East Garo
Hills
Mentioned only about
south
ern
part of
Nongpoh. Ri-
Bhoiwas n
ot separa
ted fro
m E
ast KhasiHills D
istrict at
the tim
e of stu
dy.
MdM(7
9),MdW
(5),HM(1
2),
CM(2
),CW
(2)
Mild Tro
pical Hill
Ri-Bhoi
Rem
ark
s on existing zone
Pre
sent stu
dy
classification*
(%are
a covere
d)
Existing
Clim
atic
Zone
District
Nam
e
The n
um
ber in
the p
are
nth
esis indicate
per cent are
a u
nder each agro
clim
aticzone
* The abbre
viations u
sed in the table are
explain
ed in p
revio
us slide. click h
ere
click h
ere
01
20
24
03
60
60
Me
ters
District wise
District wise agroclimatic
agroclimaticregimes
regimes--a comparison with the existing
a comparison with the existing
climatic zone.
climatic zone.

�Specific clim
atic group define the favourable
clim
ate for growth of
specific crops
�Use
ful in Evaluation of the soil su
itability by comparing characteristics
or qualities with the requirements of the crops. click h
ere
click h
ere
�These
are use
ful for planning a uniform
agricu
ltural developmentof
the state and for designing the m
ost profitable cropping pattern.
�In
determ
ining proper agronomic and cultural practices one should
consider strategies appropriate for each
clim
atic zo
ne.
�The w
ork can be extended to other states of North Eastern region.
01
20
24
03
60
60
Me
ters
Conclusion
Conclusion

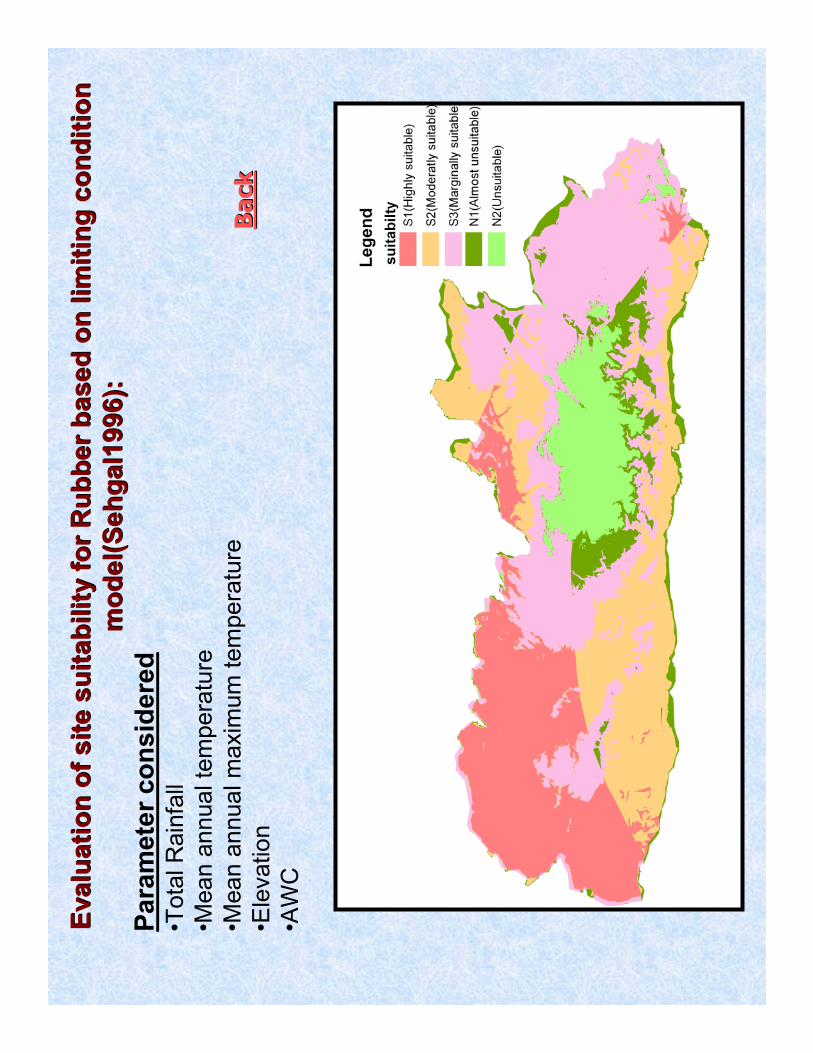
Evalu
ation o
f site s
uitability for R
ubber based o
n lim
itin
g c
ond
Evalu
ation o
f site s
uitability for R
ubber based o
n lim
itin
g c
onditio
n
itio
n
model(Sehgal1
996):
model(Sehgal1
996):
Para
mete
r consid
ere
d•T
ota
l R
ain
fall
•Mean a
nnua
l te
mpera
ture
•Mean a
nnua
l m
axim
um
tem
pera
ture
•Ele
vatio
n
•AW
C
Back
Back