agronomic and physiological responses of potato subjected
TRANSCRIPT

Agronomic and physiological responses of potato subjected to
soil compaction and/or drying
Katharina Huntenburg1, Ian C. Dodd1, Mark Stalham2
1 Lancaster Environment Centre, Lancaster University, LA1 4YQ, UK
2 NIAB CUF
Abstract Compact and dry soils impede root growth and restrict plant water availability, respectively, potentially causing leaf water deficit. Although both stresses likely co-occur in the field and limit yield, little is known about their combined impact on plant growth and physiology over a whole season, especially in a tuberous crop like potato. Field-grown potato (Solanum tuberosum L. var. ‘Maris Piper’) was exposed to factorial combination of deficit irrigation (watering when soil moisture deficit reached 60 mm vs. 25 mm) and soil compaction (compacted with heavy machinery vs. uncompacted), with plant growth and leaf physiology measured weekly. Shoot growth was restricted by adverse soil conditions, while leaf water status, photosynthesis rates and leaf ABA levels did not vary significantly between treatments. Across all treatments, final yield was linearly correlated (R² = 0.71) to mid-season shoot biomass. Compared to well-watered plants growing in loose soil, soil compaction, deficit irrigation and their combination decreased final tuber yield similarly, by 23 - 34%. Surprisingly, tuber size distribution was more dependent on irrigation management than on soil strength. Plants exposed to deficit irrigation produced more, smaller potatoes than their respective control. Thus, low soil water availability and/or compact soil caused these field-grown potatoes to restrict shoot growth rather than limit leaf gas exchange. Further research is needed to understand the role of hormonal signalling in regulating tuber growth when plants are exposed to compact and dry soils.
Keywords Drought, soil compaction, ABA, transpiration, tuber size, potato, photosynthesis
Abbreviated Abstract Compact and dry soils impede root growth and restrict plant water availability, respectively. Shoot growth of potato (Solanum tuberosum L. var. ‘Maris Piper’) was restricted by adverse soil conditions, while leaf water status, photosynthesis rates and leaf ABA levels did not vary significantly between treatments. Across all treatments, final yield was linearly correlated (R² = 0.71) to mid-season shoot biomass. Thus, low soil water availability and/or compact soil caused these field-grown potatoes to restrict shoot growth rather than limit leaf gas exchange.
1. Introduction Potato is the most produced non-cereal food crop worldwide (FAO, 2009), exceeding soybean production with 368 million tonnes of potatoes produced in 2018 (FAO, 2020). However, harvests can be threatened by abiotic stresses such as drought and soil compaction. In different climate change models, drought events are projected to decrease potato yields between 18 and 60 % globally, as well as on a regional scale (Obidiegwu et al., 2015; AHDB, 2017). Trafficking heavy machinery on wet soils in autumn and spring causes soil compaction, a widespread issue in the UK with over 60 % of 800 tested commercial fields showing soil resistances that limit root growth rate (mm per day) and yield (Stalham et al., 2007). Moreover, soil drying can increase soil strength to the same extent as heavy trafficking

(Whalley et al., 2006). During dry periods, roots growing in a compacted soil may be unable to overcome high soil resistance to grow into deeper soil layers to access water resources. Potatoes are sometimes regarded as being shallow-rooted (Obidiegwu et al., 2015; Stalham & Allen, 2004) which may constrain water uptake, even if there is considerable genetic variation in root growth between cultivars (Puertolas et al. 2014; Wishart et al. 2014). Hence, it is important to understand potato responses to low plant water availability (George et al., 2017), to develop strategies to minimise the impact of compaction and drought stresses on yield.
Plant water availability is commonly measured as leaf water potential. In controlled environments, leaf water potential during the day (Ψdaytime) was lower in deficit irrigated than well-watered potato plants (Puértolas et al., 2014) and pre-dawn leaf water potential (Ψpre-dawn) decreased as soil dried out (Whalley et al., 2006; Liu et al., 2005). Tissue water deficits stimulate production of the plant hormone abscisic acid (ABA), which closes the stomata thereby restricting plant water loss (and potentially plant carbon uptake). The sensitivity of transpiration and photosynthesis to stomatal closure varies between studies. Soil drying increased leaf xylem sap ABA concentration thereby decreasing stomatal conductance and photosynthesis rates in containerised potato (Puértolas et al., 2014) and tomato (Thompson et al., 2007) plants. In field-grown potatoes, low plant water availability increased leaf ABA accumulation and reduced stomatal conductance, but photosynthesis rates were only reduced on some occasions (Liu et al., 2006). Hence, potato plants growing in drying soil restrict transpirational water loss by decreasing stomatal conductance, which can also decrease photosynthesis rates and therefore carbon gain per unit leaf area. In addition, soil drying restricted leaf expansion and initiation in potato (Fasan & Haverkort, 1991; Kawakami et al., 2006) thereby limiting total plant carbon gain by decreasing whole plant photosynthesis. Hence, less carbon is available for tuber growth and therefore yield. However, reports from controlled environment and field experiments show variability in the relationship between photosynthesis rates and stomatal conductance, while it remains unclear which mechanisms or signals limit shoot growth in drying soil. Understanding these mechanisms is important to identify drought-sensitive growth stages, allowing more precise and plant adapted irrigation scheduling.
Soil compaction restricts horizontal and vertical root growth of potatoes in the field, ultimately reducing tuber number and yield (Van Oijen et al., 1995; Stalham et al., 2007). Smaller root systems access less soil volume thereby limiting water and nutrient uptake, which results in smaller plants with less leaf area (Nawaz et al., 2013; Stalham et al., 2007). However, the mechanisms by which soil compaction restricts plant water status and gas exchange remain unclear. Compaction decreased leaf water potential in maize (Tardieu et al., 1992) and wheat (Whalley et al., 2006), but not in sunflower (Andrade et al., 1993). Potatoes grown in compacted soil reached full ground cover later and had lower photosynthesis rates than those grown in loose soil (Van Oijen et al., 1995), and therefore produced lower yields. Soil compaction increased root xylem sap ABA levels in tomato, thereby reducing stomatal conductance (Hussain et al., 2000), and possibly photosynthesis, although ABA levels may have increased simply because sap was collected at low flow rates from plants growing in compacted soil, in the absence of any change in Ψdaytime. Shoot and leaf ABA concentrations of tomato did not change across a similar range of soil bulk densities (Tracy et al., 2015). Moreover, well watered maize plants grown in the field at different bulk densities showed no differences in stomatal conductance or leaf xylem ABA concentration (Tardieu et al., 1992). Hence drought and soil compaction can decrease plant water availability individually, thereby limiting total biomass and tuber dry weight of field-grown potatoes (Kawakami et al., 2006; Shock et al., 1998; Stalham et al., 2007). However, little is known about the impact of combined drought stress and soil compaction on potato growth and physiology. Since heavy machinery may compact soil in wet spring months and rainfed crops commonly experience drought stress later in summer in the UK, it is important to understand the effect of both stresses combined and individually to design appropriate management strategies.
Irrigation increased potato yield to a greater extent in loose than compact soils (Stalham et al., 2007), indicating that different mechanisms may co-ordinate plant responses to the two stresses. When a factorial combination of soil drying and soil compaction was applied to field-grown maize (Tardieu et

al., 1992) and wheat (Whalley et al., 2006) plants, soil drying, but not soil compaction, decreased stomatal conductance in both species without the two factors interacting. Soil compaction, but not deficit irrigation, decreased root and shoot biomass in wheat (Whalley et al., 2006). However, to our knowledge no study has investigated the physiological responses of a dicotyledon to a factorial combination of the two stresses. As dicotyledonous leaf growth may be more sensitive to leaf water deficit as the growing tissues are exposed to the atmosphere and not enclosed in older leaves as in monocotyledons (Radin, 1983), potatoes may be highly susceptible to these stresses. Thus, the current experiment comprehensively evaluated physiological (Ψpre-dawn, Ψdayitme, leaf ABA concentration, stomatal conductance, photosynthesis rate) and agronomic (ground cover, shoot biomass, total yield, tuber size distribution) responses to a factorial combination of drought and soil compaction in a field grown potato crop. We hypothesize that both stresses limit shoot growth, but only deficit irrigation induces foliar ABA accumulation to restrict plant gas exchange and photosynthesis rates.
2. Material and Methods
2.1. Field and Crop Management A 2x2 factorial combination of drought and compaction stress was set up at NIAB, Cambridge (0°05'58.8'' E and 42°14'06.1'' N) in a randomized block design with four replicates. Plots consisted of four harvest rows and two guard rows, with inter-row spacing of 0.75 m. Plant spacing was 0.3 m with 30 plants per row. On 14th March 2018, prior to planting, organic matter (municipal compost, Amey PLC, Cambridge, UK) was incorporated (25 cm depth) into the sandy loam. On 19th April 2018, the compaction treatment was imposed by driving a John Deere 6120R tractor with rear-mounted plot drill and fronted-mounted disc roller packer (total laden weight 7570 kg). The tractor ran on 340/85R/48 rear tyres at 25 PSI pressure and 340/85R/28 front tyres at 15 PSI over the entire area of the plot, so that by driving and reversing across the plot, each tyre compressed the soil twice. The soil was close to field capacity at plough depth at this stage (by irrigating to saturation prior to compaction treatment). With the soil water content and bulk density at the time of compaction, the Terranimo soil compaction model (www.terranimo.dk, Aarhus University, Denmark) indicated severe compaction to 55 cm depth, but with a lesser effect to 70 cm. Following compaction, the area was spring-tined to a depth of 10-12 cm and then roto-ridged into ridges with a Rumptstad rototiller on 20th April 2018.
Seed tubers of Solanum tuberosum variety ‘Maris Piper’ were planted on 25th April 2018 into the pre-formed ridges. All treatments reached 90 % plant emergence at 34 days after planting. An overhead irrigation boom, running with a speed of 30 m/h and nozzles hanging 1.5 m above ground, irrigated the crop. Irrigation was scheduled according to soil moisture deficit (SMD) as explained by Stalham et al. (2007) with a threshold to irrigate at 25 mm SMD for well watered treatments and at 60 mm SMD (allowing potato evapotranspiration of 1-2 mm per day on the same soil as the present study - Stalham & Allen, 2004) for droughted treatments. Well-watered plots were first irrigated on 12th June, while drought stressed plots were first irrigated on 2nd July. Irrigation intervals averaged 5–10 days thereafter, depending on weather conditions. Soil moisture was continuously monitored by Theta-probes (Delta-T, Cambridge, UK) installed 25 cm below the top of the ridge in two blocks with two probes per plot (Fig. 1). Daily weather data was obtained from a weather station on NIAB research grounds in close proximity to the experiment site. Soil strength was assessed at the beginning, middle and end of the season (26th April, 12th June and 9th October respectively) using a penetrometer with a 1 cm2 surface cone (Penetrograph, Eijkelkamp Soil & Water, Giesbeek, NL), to a depth of 1 m from the top of the ridge (Fig. 2). There was no irrigation in the weeks before the measurements in spring and autumn, while in summer the plots were irrigated 5 days before measuring soil strength. Protective spraying against blight was carried out when necessary.
2.2. Measurements Ground cover was assessed weekly in the two middle rows of each plot using a 75 x 60 cm grid. Leaf number and leaf width were assessed weekly on the same three plants per plot. The width of the tenth leaf (numbering from the base of the plant) was measured in weeks 24 – 29 and on a young leaf with approximately 10 cm length from week 30. Pre-dawn leaf water potential (Ψpd) was measured 1-2 days

after an irrigation event with a Scholander-type pressure chamber. Leaf gas exchange was measured (LI-6400 Portable Photosynthesis System, LI-COR, Lincoln, USA) on one plant per plot and leaf water potential (Ψleaf) of that same leaf determined with a Scholander-type pressure chamber on the same days that pre-dawn water potential was measured. Gas exchange and Ψleaf were measured between 4 hours after sunrise and ending no later than 3 hours before sunset, with time of day being implemented as a random effect in the linear models where necessary (see section 2.3.) From the same plant, tissue samples of young, developing leaves (entire leaf) were taken, directly put into liquid nitrogen (calendar weeks 26 to 32) or kept on dry ice (calendar weeks 34 and 35) until storage at -80 °C. Leaf ABA concentration was determined by radioimmunoassay (Quarrie et al., 1988). Freeze dried and ground leaves were extracted in de-ionised water at a ratio of 1 : 50 (leaf tissue (µg) : water (µl)) overnight and then kept frozen at – 20 °C until measured. At final harvest, 2.5 m² in the middle of each plot were harvested (10 plants). Tubers were graded into size classes in 10 mm increments (from 10 – 20 mm to 80 – 90 mm) and for each size class tuber number and total weight was taken. Total yield contained all size classes, while marketable yield only considers tubers larger than 40 mm.
2.3. Data analysis and statistics Statistics were carried out with the software R version 4.0.3 (R Core Team, 2020, Vienna, Austria). Three-way repeated measures ANOVAs were carried out to evaluate the effects of compaction, irrigation and calendar week on weekly measured variables and compaction, irrigation and soil depth on soil strength. Assumptions of independent and identically distributed (as Normal) data and sphericity were tested (Shapiro-Wilk Normality test, Mauchly’s test) and accounted for if required. Due to missing data some weeks had to be excluded from repeated measures analysis. As a result the repeated measures ANOVA was carried out using weeks 29-31 and 35 for stomatal conductance and photosynthesis rates and weeks 26 – 28, 32 and 35 for leaf ABA concentration. The analysis of the penetrometer resistance in September is truncated to depths of 0 – 30 cm for the same reason.
Two-way ANOVAs (for main effects of drought, compaction & their interaction) were carried out separately on each measurement occasion to highlight when the differences found in repeated measures ANOVA occurred, as well as for tuber yield and size. Least significant difference (LSD) values at the 5% level of significance are given in the figures where interactions are significant, otherwise error bars indicate standard errors. Regression lines were estimated using linear models.
3. Results 3.1. Environmental conditions and treatments The irrigation schedule was calculated according to soil moisture deficit (SMD), a method successfully applied to several potato experiments in the same soil type on NIAB trial grounds (Stalham & Allen, 2004). Soil moisture at 25 cm was generally higher in well-watered treatments than in drought-stressed treatments (Fig. 1). Before calendar week 28, compacted plots were wetter than uncompacted plots, probably due to lower water use of smaller canopies in the compacted treatments (cf. Fig. 1, Fig. 3). Soil moisture in all treatments increased notably after heavy rainfall in week 32 (> 20 mm in 2 days) in all treatments. Irrigation was stopped after week 34 to encourage crop senescence. . Altogether, the irrigation schedule created clear differences in soil moisture between the well-watered and drought-stressed treatments. Rainfall events in the second half of the season changed overall soil moisture levels, but did not change the difference between irrigation treatments (Fig. 1).
Penetrometer resistance below 20 cm depth was higher in compacted than uncompacted soils at the
beginning and the end of the season. In July, the differences between treatments were small and
overall soil resistance lower because the soil had recently (2 days previously) been irrigated and was
therefore softer (Fig. 2). In September, the drought stressed treatments had higher soil resistance than
their respective well-watered treatments, but statistical analysis was only possible at 0-30 cm depths
due to limited replication in strong soil below those depths. Overall, compacted treatments showed a

higher soil resistance than uncompacted treatments at depths between 20 cm and 35 cm, Soil
resistance below 15 cm depth increased between April and September in all treatments.
3.2. Plant growth Plants emerged 3 days earlier in uncompacted (49 days after planting) soil than compacted (52 days). Ground cover differed between compaction treatments at an early growth stage (from calendar week 24), with plants in uncompacted soil growing faster and more rapidly reaching full ground cover than plants in compacted soil. After full canopy cover was reached, plants in uncompacted soil senesced more quickly than in compacted soil (Fig. 3). Irrigation treatments commenced from calendar week 24 and plant growth in the well-watered plants remained rapid, while growth of the deficit-irrigated plots was greatly restricted in the first weeks after emergence and ground cover never reached the absolute values of well-watered plants (Fig. 3). This confirms that the timing of irrigation of the well-watered treatments was adequate to maintain optimal growth. Taken together, soil compaction and drought stress reduced the duration of full ground cover and therefore time of maximum light interception.
Leaf expansion only differed between treatments until calendar week 29, with the two individual stresses reducing leaf expansion compared to the control and the combined stresses reducing growth rate further (Fig. 4A and B). At the beginning of the season, soil compaction limited leaf initiation while after week 28 deficit irrigation had a greater effect. By week 33, few new leaves developed (Fig. 4C). Thus leaf expansion and leaf initiation showed similar treatments responses to overall canopy cover.
3.3. Plant physiological parameters To investigate whether differences in carbon gain (photosynthesis) affect shoot growth, leaf gas exchange was measured. Surprisingly, stomatal conductance and photosynthesis rates did not differ between treatments on most measurement dates (Fig. 5A and B). Stomatal conductance (to water vapour) is linearly correlated with transpiration per unit leaf area. Irrigation as a main effect only had a significant impact in week 29, with deficit-irrigated plants having lower stomatal conductance and photosynthesis rates than well-watered plants (p < 0.05 for both parameters, Fig. 5A and B). At this time, irrigation had been suspended for 17 days in the deficit irrigation treatments (Fig. 1). In the last measurement week, both stomatal conductance and photosynthesis rates approximately halved as the canopy senesced. Thus adverse soil conditions restricted shoot growth, but photosynthesis and transpiration per unit leaf area (stomatal conductance) were only affected after a prolonged period without irrigation.
As leaf gas exchange did not differ between treatments, plant water status was also measured. For pre-dawn and daytime leaf water potential, generally there were no treatment differences (Fig. 6). In weeks 26, 29 and 30, pre-dawn water potential of well-watered plants was higher than in drought-stressed plants (Fig. 6). In week 26, pre-dawn leaf water potential was measured the night before and the night after irrigating the well-watered plots. Before irrigation, pre-dawn water potentials were similar, but after irrigation the pre-dawn water potential of the well-watered plants was significantly higher (p < 0.0001, F(1,10) = 33.96), by 0.05 MPa than of the drought-stressed plants. In week 29, drought-stressed plants had not been irrigated for 17 days when measured pre-dawn and soil moisture had been low for this period in drought-stressed treatments (Fig. 1). Hence, the difference in pre-dawn water potential between irrigation treatments in this week is a result of low water availability in drought stressed plants. In week 30, all plots were irrigated the day before measurements. Thus, there was an immediate response in pre-dawn water potential to an irrigation event in well watered plants, but a decrease in drought stressed plants only became apparent after a prolonged period at low soil moisture. In week 32, compacted treatments had higher pre-dawn water potentials than uncompacted treatments. Daytime leaf water potential did not differ between treatments throughout the whole season, with values between -0.9 and -1.4 MPa (Fig. 6B). Thus pre-dawn leaf water potential better discriminated the treatments than daytime leaf water potential.
To understand hormonal responses, leaf tissue ABA levels were measured from samples taken directly after gas exchange measurements. In week 26, samples were taken the day after well-watered plants were irrigated for the first time and ABA levels in drought stressed plants were 60 % higher than in

well-watered plants with mean values of 758 ng ABA*g-1 DM and 473 ng ABA*g-1 DM for drought-stressed and well-watered treatments, respectively (Fig. 5C). On all following measurement dates, no treatment differences were detected (Fig. 5C). Drought-stressed treatments had the highest values in weeks 26 and 35. Comparing the treatments via repeated measures ANOVA (Supplementary Table 1) showed no significant impact of any factor, likely due to the high variability of the data. Thus any treatment differences in leaf ABA concentration were transient and not maintained through the growing season.
3.4. Tuber yield Reduced plant growth and therefore lower biomass at full ground cover was correlated with lower tuber yield per hectare (Fig. 7). Soil compaction and drought decreased the yield by 31 % and had synergistic effect of co-occurring stresses (Fig. 8A). These findings illustrate that drought stress and soil compaction substantially decrease yield and that a large proportion of this variation can be explained by canopy growth (R² = 0.71, Fig. 7).
Interestingly, significant differences in tuber size distribution were observed between irrigation treatments, but not between compaction treatments. Drought-stressed plots had more tubers between 30 mm and 50 mm and fewer tubers >60 mm (p < 0.05 for all comparisons) than well-watered plots (Fig. 8B). Total tuber number was also higher in drought-stressed treatments than in well-watered treatments (28 tubers per m² vs. 24 m² tubers respectively, p = 0.036, F(1,12) = 5.57). Hence, lower yield of the drought-stressed treatments resulted from smaller, rather than fewer, tubers.
4. Discussion This is the first study to measure canopy cover and leaf gas exchange of a field grown crop weekly under a factorial combination of drought and soil compaction. Ground cover quickly increased under optimal conditions, but was limited by deficit irrigation and especially soil compaction (Fig. 3), whereas leaf gas exchange was similar in all treatments throughout the growing season. Slower leaf growth rate and leaf initiation in the beginning of the season reduced leaf area and thus light interception, thereby diminishing whole plant carbon gain and therefore total yield. In potato, the duration for which full ground cover is maintained explains a high percentage of yield differences (74 – 87 %) among cultivars and treatments (Boyd et al., 2002). Since there were only small differences in late-season senescence between treatments (Fig. 3), the time to reach full ground cover seems more important. Indeed, early-season biomass explained 71 % of the variation in final yield, with soil compaction, deficit irrigation and their combination decreasing yields similarly by 31 % (Fig. 7). It has been established that the duration of light interception determines final yield (Haverkort & Struik, 2015) and full irrigation is necessary until after tuber initiation phase to ensure high yield (Jensen et al., 2010). While this indicates the importance of early season shoot development in yield formation, to our knowledge the correlation between biomass at full ground cover and yield has not been reported before in potato. This finding could have an important impact on irrigation scheduling and crop management throughout the season to save water resources and maintain or increase yield per hectare. Therefore it is important to understand the physiological mechanisms regulating canopy expansion and leaf gas exchange.
Decreased canopy growth can result from fewer leaves or reduced leaf expansion or both. Drought decreased leaf number in potato (Fasan & Haverkort, 1991; Fig. 4) while compaction inhibited tillering and thus leaf initiation in wheat (Jin et al., 2015). Moreover, leaf expansion was inhibited by drought in potato (Obidiegwu et al., 2015) and by soil compaction in sunflower (Andrade et al. 1993). Before full ground cover was reached, leaf expansion rate decreased in the order: control > the two single stress treatments > the combined soil compaction and drought stress treatment (Fig. 4A). This reflects ground cover measurements over the same period (calendar week 24 to 29). However, ground cover curves for the different treatments diverge further after irrigation treatments were imposed in week 24 (Fig. 3). This is probably because the deficit-irrigated treatments produced fewer new leaves

after week 26. Differences in ground cover development before week 31 (when maximum ground cover was reached) resulted from differences in leaf expansion and number of leaves; thereafter leaf expansion rates did not differ between treatments (Fig. 4B). Leaf number increased until week 33 and then remained constant (Fig. 4C). After reaching maximum ground cover, the canopy continues to develop, which may enhance light interception slightly, but not considerably.
Restricted shoot growth under drought stress and soil compaction has often been associated with increased ABA levels (Mulholland et al., 1996; Sharp, 2002), but ABA-deficient mutants show less growth especially under these conditions (Hussain et al., 2000; Aroca et al., 2008). In potato, deficit irrigation only increased leaf tissue ABA levels in one week (week 26, Figure 5C), thus an impact of ABA levels on plant growth in this experiment is unlikely. Furthermore, ABA limits synthesis of another growth inhibitor, ethylene (Sharp, 2002; Hussain et al., 2000). Subjecting part of the root system to either soil drying (Sobeih et al. 2004) or soil compaction (Hussain et al., 2000) increased ethylene biosynthesis and limited leaf growth rates in tomato, but not in a transgenic tomato (ACO1AS) with low stress-induced ethylene biosynthesis, but similar ABA levels as wildtype plants. While these observations indicate the importance of ethylene, reduced gibberellin (GA) biosynthesis limits shoot growth under soil compaction (Coelho Filho et al., 2013) and drought stress decreases expression of GA biosynthesis genes while increasing expression of GA deactivation genes (Colebrook et al., 2014). Hence, it is possible that ABA, ethylene and GA all interact to regulate shoot growth when plants grow in dry and/or compact soil.
Together with light interception, plant gas exchange is important for total plant carbon gain and therefore the plant’s capacity to grow tubers. Deficit irrigation, but not soil compaction, decreased stomatal conductance (gs) in factorial experiments with wheat (Whalley et al., 2006) and maize (Tardieu et al., 1992). Potato responded similarly, with deficit irrigation only significantly decreasing gs and assimilation rate (both p < 0.05, F-Test, calendar week 29) after 17 days without irrigation (Fig. 5B), confirming previous experiments (Liu et al., 2006; Ahmadi et al., 2010). Overall, leaf gas exchange was similar between treatments throughout most of the season and leaf-level carbon gain was thus similar in all treatments. Nevertheless, gs was relatively low (generally < 0.4 mol m-2 s-1 (Fig. 5B) compared to other studies that report values above 0.5 mol m-2 s-1 for well-watered plants (Liu et al., 2006; Ahmadi et al., 2010; Puértolas et al., 2014). When vapour pressure deficit (VPD) increased from 0.7 to 1.5 kPa around potato leaves (McAdam et al., 2016), gs rapidly declined to approximately the same values reported here. In the present study, although VPD was high (0.9 – 1.3 kPa) on most measurement days, it only explained 2 % of the variance in gs (R² = 0.02, p = 0.004). Since measurements within the same VPD range showed no effect on potato gas exchange (Ahmadi et al., 2010), other factors such as plant hormones may influence gs under low plant water availability.
Increased leaf xylem sap ABA levels correlated with decreased gs in potato (Liu et al., 2005), tomato (Thompson et al., 2007) and soybean (Castro et al., 2019) in controlled environments. However, no such correlation occurred in field-grown potatoes (Ahmadi et al., 2010). Similarly, leaf tissue ABA levels and gs were not correlated (R² = 0.06, p = 0.07), with similar ABA accumulation between treatments due to higher ABA accumulation in the well-watered plants or limited ABA accumulation in deficit-irrigated plants. Leaf xylem sap ABA concentration correlates with soil moisture in pot-grown tomato (Dodd, 2007) and sunflower (Dodd et al., 2008). However, preferential water uptake from moister parts of the soil profile attenuates any effect of localised root ABA accumulation in potato, thereby minimising or eliminating root-to-shoot ABA-signalling (Puértolas et al., 2015). Here, soil moisture was measured at 25 cm depth, but the roots of field-grown potatoes can grow as deep as 80 cm to access water (Stalham & Allen, 2004; Puertolas et al. 2014). Thus plants likely accessed water at deeper layers and therefore the measured soil moisture does not reflect total plant water availability. Alternatively, high VPD (1.5 kPa) can stimulate foliar ABA accumulation in well-watered plants (McAdam & Brodribb, 2015), but there was no correlation between VPD and leaf ABA levels in the present study (R² = 0.02, p = 0.26). Alternatively, stability of ABA levels in deficit irrigated plants suggests that (deeper) roots acquired sufficient water to prevent leaf water deficit (Fig. 6).

Leaf water potential is highest before dawn and with plants in the dark for several hours at considerably decreased transpiration rates (Ramírez et al., 2018) pre-dawn leaf water potential measurements indicate soil water availability. In contrast to the relative stability of daytime leaf water potential (Ψday), deficit irrigation decreased pre-dawn leaf water potential (Ψpre-dawn) only after prolonged times without irrigation (Fig. 6) as in maize (Tardieu et al., 1992). Decreasing Ψpre-dawn correlates with stomatal closure in different crops. However, potato showed small changes in stomatal conductance (0.12 mol m-² s-1 gs difference with Ψpre-dawn between -0.4 and -0.1 MPa) compared to crops such as soybean (0.44 mol m-² s-1 gs difference over a similar Ψpre-dawn range) and sunflower (0.54 mol m-² s-1 gs difference with Ψpre-dawn between -0.68 and -0.25 MPa) (Granier and Tardieu, 1999). Thus decreased Ψpre-dawn in potato does not necessarily result in measurable stomatal closure. Taken together, while treatment differences in leaf gas exchange were not detected, understanding the substantial growth differences requires further investigations of plant water relations and hormone signalling effects.
Under drought stress, more potatoes fell into small size grades than under well-watered conditions, as in a study of 103 potato cultivars (Aliche et al., 2019). Since drought, but not soil compaction, affected tuber size distribution (Fig. 8B), tuber development seemed to respond to systemic stress signals rather than local soil conditions. However, soil resistance did not differ between treatments in the top 20 cm, where most potatoes grow (Fig. 2), so the direct impact of high soil resistance on tuber growth could not be examined. When drought stress restricted canopy growth, the available assimilates were distributed between a larger number of tubers (Fig 8B), producing a skewed tuber size distribution. Some potato cultivars undergo a second phase of tuber initiation under well-watered conditions (Walworth & Carling, 2002), which might have occurred in the second half of the season, when soil moisture increased following rainfall (week 33 and thereafter). The time until harvest would have been shorter for these tubers, hence the final tuber size of potatoes initiated in the second wave was smaller, leading to many small tubers in deficit-irrigated plants. In addition, an interaction between ABA and GA has been suggested to regulate tuberization and therefore tuber size distribution under drought stress (Jensen et al., 2010). Further research is needed to understand how tuber size is regulated.
To conclude, soil compaction and drought stress applied individually decreased shoot growth and yield, but both stresses occurring simultaneously had synergistic effect on yield (Fig. 8A). Shoot biomass at full ground cover adequately predicted final yield (R² = 0.71, p < 0.001), indicating that vegetative growth in the first half of the growing season is critical in ensuring yield. This finding can be of great importance for crop management and irrigation scheduling. Since leaf gas exchange was not correlated with yield, leaf water status or ABA status, we conclude that plants under restricted water availability grow deeper roots to access water in deeper layers. Moreover, hormonal signals from the root system are postulated to restrict shoot growth sufficiently to ensure it can be sustained according to the available water supply. Further research is needed to test these hypotheses.
5. Acknowledgements Funding was provided by AHDB (Agricultural and Horticultural Development Board) (PhD Fellowship
Ref.: 11140035). We thank staff at NIAB CUF for their help in carrying out field work as part of the
AHDB Research Partnership: Management of Rotations, Soil structure and Water and Callum Barltrop
(Lancaster University) for his help in carrying out the statistical analysis.

6. References
AHDB (2017) GB Potatoes- Market Intelligence (2016-2017). , 1–30. Available at: https://potatoes.ahdb.org.uk/sites/default/files/GB Potatoes 2016-2017.pdf.
Ahmadi S.H., Andersen M.N., Plauborg F., Poulsen R.T., Jensen C.R., Sepaskhah A.R., Hansen S. (2010) Effects of irrigation strategies and soils on field-grown potatoes: Gas exchange and xylem [ABA]. Agricultural Water Management, 97, 1486–1494.
Aliche E.B., Oortwijn M., Theeuwen T.P.J.M., Bachem C.W.B., van Eck H.J., Visser R.G.F., van der Linden C.G. (2019) Genetic mapping of tuber size distribution and marketable tuber yield under drought stress in potatoes. Euphytica, 215, 1–19.
Andrade A., Wolfe D.W., Fereres E. (1993) Leaf expansion, photosynthesis, and water relations of sunflower plants grown on compacted soil. Plant and Soil, 149, 175–184.
Aroca R., Del Mar Alguacil M., Vernieri P., Ruiz-Lozano J.M. (2008) Plant responses to drought stress and exogenous ABA application are modulated differently by mycorrhization in tomato and an ABA-deficient mutant (Sitiens). Microbial Ecology, 56, 704–719.
Boyd N.S., Gordon R., Martin R.C. (2002) Relationship between leaf area index and ground cover in potato under different management conditions. Potato Research, 45, 117–129.
Castro P., Puertolas J., Dodd I.C. (2019) Stem girdling uncouples soybean stomatal conductance from leaf water potential by enhancing leaf xylem ABA concentration. Environmental and Experimental Botany, 159, 149–156.
Coelho Filho M.A., Colebrook E.H., Lloyd D.P.A., Webster C.P., Mooney S.J., Phillips A.L., Hedden P., Whalley W.R. (2013) The involvement of gibberellin signalling in the effect of soil resistance to root penetration on leaf elongation and tiller number in wheat. Plant and Soil, 371, 81–94.
Colebrook E.H., Thomas S.G., Phillips A.L., Hedden P. (2014) The role of gibberellin signalling in plant responses to abiotic stress. Journal of Experimental Biology, 217, 67–75.
Dodd I.C. (2007) Soil moisture heterogeneity during deficit irrigation alters root-to-shoot signalling of abscisic acid. Functional Plant Biology, 34, 439–448.
Dodd I.C., Egea G., Davies W.J. (2008) Abscisic acid signalling when soil moisture is heterogeneous: Decreased photoperiod sap flow from drying roots limits abscisic acid export to the shoots. Plant, Cell and Environment, 31, 1263–1274.
FAO (2009) New Light on a Hidden Treasure. Food and Agriculture Organization of the United Nations, 1–80.
FAO (2020) faostat. Available at: http://www.fao.org/faostat/en/#data/QC.
Fasan T., Haverkort A.J. (1991) The influence of cyst nematodes and drought on potato growth. 1. Effects on plant growth under semi-controlled conditions. Netherlands Journal of Plant Pathology, 97, 151–161.
George T.S., Taylor M.A., Dodd I.C., White P.J. (2017) Climate Change and Consequences for Potato Production: a Review of Tolerance to Emerging Abiotic Stress. Potato Research, 60, 239–268.
Granier C., Tardieu F. (1999) Water Deficit and Spatial Pattern of Leaf Development. Variability in Responses Can Be Simulated Using a Simple Model of Leaf Development. Plant Physiology, 119, 609-619.
Haverkort A.J., Struik P.C. (2015) Yield levels of potato crops: Recent achievements and future prospects. Field Crops Research, 182, 76–85.

Hussain A., Black C.R., Taylor I.B., Roberts J.A. (2000) Does an antagonistic relationship between ABA and ethylene mediate shoot growth when tomato (Lycopersicon esculentum Mill.) plants encounter compacted soil? Plant Cell and Environment, 23, 1217–1226.
Jensen C.R., Battilani A., Plauborg F., Psarras G., Chartzoulakis K., Janowiak F., Stikic R., Jovanovic Z., Li G., Qi X., Liu F., Jacobsen S.E., Andersen M.N. (2010) Deficit irrigation based on drought tolerance and root signalling in potatoes and tomatoes. Agricultural Water Management, 98, 403–413.
Jin K., Shen J., Ashton R.W., White R.P., Dodd I.C., Phillips A.L., Parry M.A.J., Whalley W.R. (2015) The effect of impedance to root growth on plant architecture in wheat. Plant and Soil, 392, 323–332.
Kawakami J., Iwama K., Jitsuyama Y. (2006) Soil water stress and the growth and yield of potato plants grown from microtubers and conventional seed tubers. Field Crops Research, 95, 89–96.
Liu F., Jensen C.R., Shahanzari A., Andersen M.N., Jacobsen S.E. (2005) ABA regulated stomatal control and photosynthetic water use efficiency of potato (Solanum tuberosum L.) during progressive soil drying. Plant Science, 168, 831–836.
Liu F., Shahnazari A., Andersen M.N., Jacobsen S.E., Jensen C.R. (2006) Physiological responses of potato (Solanum tuberosum L.) to partial root-zone drying: ABA signalling, leaf gas exchange, and water use efficiency. Journal of Experimental Botany, 57, 3727–3735.
McAdam S.A.M., Brodribb T.J. (2015) The evolution of mechanisms driving the stomatal response to vapor pressure deficit. Plant Physiology, 167, 833–843.
McAdam S.A.M., Sussmilch F.C., Brodribb T.J. (2016) Stomatal responses to vapour pressure deficit are regulated by high speed gene expression in angiosperms. Plant Cell and Environment, 39, 485–491.
Mulholland B.J., Black C.R., Taylor I.B., Roberts J. a, Lenton J.R. (1996) Effect of soil compaction on barley (Hordeum vulgare l.) growth .1. possible role for ABA as a root-sourced chemical signal. Journal of Experimental Botany, 47, 539–549.
Nawaz M.F., Bourrié G., Trolard F. (2013) Soil compaction impact and modelling. A review. Agronomy for Sustainable Development, 33, 291–309.
Obidiegwu J.E., Bryan G.J., Jones H.G., Prashar A. (2015) Coping with drought: stress and adaptive responses in potato and perspectives for improvement. Frontiers in Plant Science, 6, 1–23.
Van Oijen M., De Ruijter F.J., Van Haren R.J.F. (1995) Analyses of the effects of potato cyst nematodes (Globodera pallida) on growth, physiology and yield of potato cultivars in field plots at three levels of soil compaction. Annals of Applied Biology, 127, 499–520.
Puértolas J., Ballester C., Elphinstone E.D., Dodd I.C. (2014) Two potato (Solanum tuberosum) varieties differ in drought tolerance due to differences in root growth at depth. Functional Plant Biology, 41, 1107–1118.
Puértolas J., Conesa M.R., Ballester C., Dodd I.C. (2015) Local root abscisic acid (ABA) accumulation depends on the spatial distribution of soil moisture in potato: Implications for ABA signalling under heterogeneous soil drying. Journal of Experimental Botany, 66, 2325–2334.
Quarrie S.A., Whitford P.N., Appleford N.E.J., Wang T.L., Cook S.K., Henson I.E., Loveys B.R. (1988) A monoclonal antibody to (S)-abscisic acid: its characterisation and use in a radioimmunoassay for measuring abscisic acid in crude extracts of cereal and lupin leaves. Planta, 173, 330–339.
R Core Team (2019) R: A language and environment for statistical computing. R Foundation for Statistical Computing.
Radin J.W. (1983) Control of plant growth by nitrogen: differences between cereals and broadleaf species. Plant, Cell & Environment, 6, 65–68.

Ramírez D.A., Yactayo W., Rolando J.L., Quiroz R. (2018) Preliminary Evidence of Nocturnal Transpiration and Stomatal Conductance in Potato and their Interaction with Drought and Yield. American Journal of Potato Research, 95, 139–143.
Sharp R. (2002) Interaction with ethylene: changing views on the role of abscisic acid in root and shoot growth responses to water stress. Plant, Cell & Environment, 25, 211–222.
Shock C.C., Feibert E.B.G., Saunders L.D. (1998) Potato Yield and Quality Response to Deficit Irrigation. HortScience, 33, 655–659.
Stalham M.A., Allen E.J. (2004) Water uptake in the potato (Solanum tuberosum) crop. The Journal of Agricultural Science, 142, 373–393.
Stalham M.A., Allen E.J., Rosenfeld A.B., Herry F.X. (2007) Effects of soil compaction in potato (Solanum tuberosum) crops. The Journal of Agricultural Science, 145, 295.
Tardieu F., Zhang J., Katerij N., Bethenod O., Palmer S., Davies W.J. (1992) Xylem ABA controls the stomatal conductance of field‐grown maize subjected to soil compaction or soil drying. Plant, Cell & Environment, 15, 193–197.
Thompson A.J., Mulholland B.J., Jackson A.C., McKee J.M.T., Hilton H.W., Symonds R.C., Sonneveld T., Burbidge A., Stevenson P., Taylor I.B. (2007) Regulation and manipulation of ABA biosynthesis in roots. Plant, Cell and Environment, 30, 67–78.
Tracy S.R., Black C.R., Roberts J.A., Dodd I.C., Mooney S.J. (2015) Using X-ray Computed Tomography to explore the role of abscisic acid in moderating the impact of soil compaction on root system architecture. Environmental and Experimental Botany, 110, 11–18.
Walworth J.L., Carling D.E. (2002) Tuber initiation and development in irrigated and non-irrigated potatoes. American Journal of Potato Research, 79, 387–395.
Whalley W.R., Clark L.J., Gowing D.J.G., Cope R.E., Lodge R.J., Leeds-Harrison P.B. (2006) Does soil strength play a role in wheat yield losses caused by soil drying? Plant and Soil, 280, 279–290.

Figures
Figure 1: Soil moisture at 25 cm depth over the season 2018. Means ± SE of four Theta-probes per treatment) with residual degrees of freedom df = 4. Blue vertical bars indicate irrigation days, with light blue being well-watered plots only and dark blue being all plots irrigated. Green vertical bars are rainfall events with light green > 3mm rainfall per day and dark green > 10 mm per day. Statistical significance of irrigation, compaction and their interaction reported for mean values of each week with: ns = not significant P > 0.05; * P < 0.05, ** P < 0.01, *** P <0.001.

Figure 2: Soil resistance of all treatments in the beginning (April), middle (July) and end (September) of the season. Means of 4 plots per treatment and time point with 3 technical replicates per plot with SE for all depths where no significant interaction between treatments was found. LSD (5%) given for each depth (black horizontal lines) where interactions were significant with residual degrees of freedom df = 11 in April and July and df = 12 in September.). In September statistical analysis could not be carried out for soil layers from 35 – 55 cm depth due to missing values (too high resistivity to take measurements). Mean values are shown for Measurements in July were taken 2 days after irrigation, while measurements in April and September were taken before irrigation started and after irrigation stopped, respectively. Statistical significance of irrigation, compaction, depth and their interaction reported each measurement time point, with: ns = not significant P > 0.05; * P < 0.05; ** P < 0.01, *** P <0.001.

Figure 3: Weekly ground cover of field grown ‘Maris Piper’. Means ± SE of four plots per treatment with residual degrees of freedom df = 12. LSD (5%) for week 35 is given (black vertical line), because of significant interaction in this week. Statistical significance of irrigation, compaction and their interaction reported each week with: ns = not significant P > 0.05; * P < 0.05, ** P < 0.01, *** P <0.001.
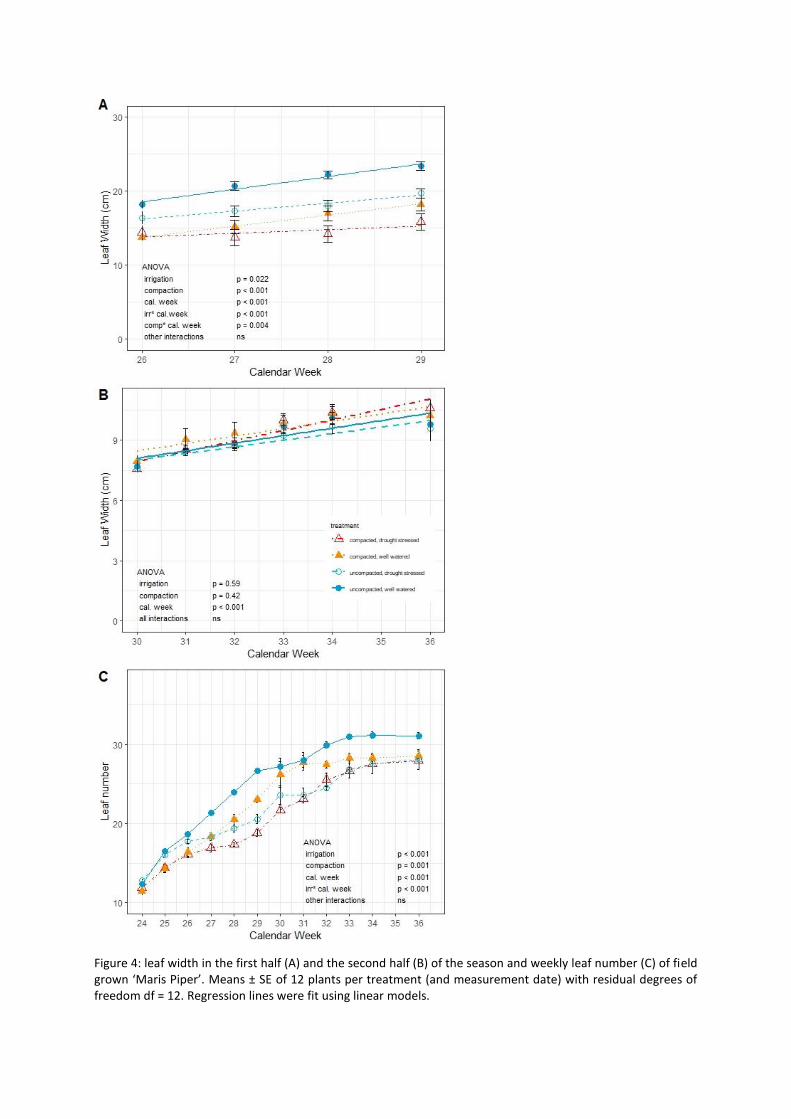
Figure 4: leaf width in the first half (A) and the second half (B) of the season and weekly leaf number (C) of field grown ‘Maris Piper’. Means ± SE of 12 plants per treatment (and measurement date) with residual degrees of freedom df = 12. Regression lines were fit using linear models.

Figure 5: Stomatal conductance (A), photosynthesis rates (B) and leaf tissue ABA levels (C) measured in field grown Maris Piper under different compaction and irrigation treatments. Means ± SE of 4 plants per treatment and measurement day with residual degrees of freedom df = 8 for stomatal conductance and photosynthesis rate and df = 6 for leaf tissue ABA levels. Asterisks indicate significant differences between treatments on a distinct day with: ns = not significant P > 0.05; * P < 0.05, ** P < 0.01, *** P <0.001.

Figure 6: Development of pre-dawn (A) and daytime (B) leaf water potential of potato ‘Maris Piper’. Means ± SE of 4 plants per treatment and measurement day with residual degrees of freedom df = 10. Asterisks indicate significant differences between treatments on a distinct day with: ns = not significant P > 0.05; * P < 0.05, ** P < 0.01, *** P <0.001.
Figure 7: Relation between biomass at full ground cover (measured in calendar week 31) and final yield for field-grown 'Maris Piper'. Each data point represents one plot with three plants harvested for above ground biomass and yield calculated as in from 10 plants harvested per plot (2.5m²). Regression line was calculated using a linear model (y = 0.05 (± 0.0008) x + 31.42 (± 3.24)). Error bars omitted for clarity, residual standard error = 5.7 on 14 degrees of freedom.

Figure 8: Total yield (A) and tuber size distribution (B) of field grown 'Maris Piper'. Means (± SE) of four plots per treatment, yield calculated and tubers counted of 10 plants per plot (2.5m²). Vertical line in (A) shows LSD (5%), residual degrees of freedom = 12.

Supplementary Table 1: Supplementary Table 1: outcome of repeated measures ANOVAs for the measured plant physiological parameters. F-values and p-values are reported and printed bold where p < 0.05. P-values have been adjusted by Greenhouse-Geisser correction for the main factor ‘week’ and all interactions with the factor ‘week’ involved in the parameters leaf width (both time intervals), leaf number, leaf water potential (pre-dawn and daytime) and stomatal conductance.
outcome of repeated measures ANOVA
compaction irrigation calendar week compaction:
irrigation compaction:
cal. week irrigation: cal.
week
compaction: irrigation: cal. week
weeks used in the
analysis
soil moisture F(1, 4) = 1.61, F(1, 4) = 8.11, F(16, 64) = 11.42, F(1, 4) = 0.23, F(16, 64) = 1.21 F(16, 64) = 1.32 F(16, 64) = 1.20
24 – 40 p = 0.27 p = 0.047 p < 0.001 p = 0.66 p = 0.29 p = 0.21 p = 0.29
ground cover F(1, 12) = 21.11, F(1, 12) = 11.47, F(17, 204) = 135.20, F(1, 12) = 0.04, F(17, 204) = 12.87, F(17, 204) = 2.07, F(17, 204) = 0.76,
22 – 39 p < 0.001 p = 0.005 p < 0.001 p = 0.84 p < 0.001 p = 0.009 p = 0.74
leaf width first half (Fig. 4A)
F(1, 12) = 37.46, F(1, 12) = 6.91, F(6, 72) = 124.03, F(1, 12) = 1.24, F(6, 72) = 6.22, F(6, 72) = 8.64, F(6, 72) = 1.11, 26 – 29
p < 0.001 p = 0.022 p < 0.001 p = 0.29 p = 0.004 p < 0.001 p = 0.35
leaf width second half (Fig 4B)
F(1, 12) = 0.70, F(1, 12) = 0.30, F(5, 60) = 62.03, F(1, 12) = 0.07, F(5, 60) = 0.61, F(5, 60) = 0.38, F(5, 60) = 0.67, 30 - 36
p = 0.42 p = 0.59 p < 0.001 p = 0.80 p = 0.59 p = 0.73 p = 0.55
leaf number F(1, 12) = 18.55, F(1, 12) = 46.84, F(11, 132) = 461.06, F(1, 12) = 3.27, F(11, 132) = 1.88, F(11, 132) = 11.56, F(11, 132) = 1.64,
26 - 36 p = 0.001 p < 0.001 p < 0.001 p = 0.96 p = 0.16 p < 0.001 p = 0.21
pre-dawn leaf water potential
F(1, 10) = 7.72 F(1, 10) = 12.96, F(9.90) = 5.85, F(1, 10) = 0.28, F(9.90) = 1.96, F(9.90) = 2.41, F(9.90) = 0.30, 26 – 32, 34, 35 p = 0.02 p = 0.005 p = 0.002 p = 0.61 p = 0.13 p = 0.08 p = 0.85
daytime leaf water potential
F(1, 10) = 2.58, F(1, 10) = 0.29, F(8, 80) = 10.08, F(1, 10) = 2.37, F(8, 80) = 0.33, F(8, 80) = 0.70, F(8, 80) = 0.61, 26 – 32, 34, 35 p = 0.14 p = 0.60 p < 0.001 p = 0.15 p = 0.78 p = 0.54 p = 0.60
stomatal conductance
F(1, 8) = 1.48, F(1, 8) = 0.51, F(3, 24) = 3.50, F(1, 8) = 0.01, F(3, 24) = 0.80, F(3, 24) = 0.18, F(3, 24) = 0.38, 29 – 31, 35
p = 0.26 p = 0.49 p = 0.07 p = 0.94 p = 0.44 p =0.77 p = 0.63
photosynthesis rate
F(1, 8) = 2.61, F(1, 8) = 0.54, F(3, 24) = 7.62, F(1, 8) = 0.28, F(3, 24) = 0.24, F(3, 24) = 0.38, F(3, 24) = 1.23, 29 – 31, 35
p = 0.15 p = 0.48 p = 0.001 p = 0.61 p = 0.87 p = 0.77 p = 0.32
Leaf ABA concentration
F(1, 6) = 0.05, F(1, 6) = 0.83, F(5, 30) = 3.67, F(1, 6) = 0.36, F(5, 30) = 1.04, F(5, 30) = 2.79, F(5, 30) = 1.17, 26 – 28, 32, 35 p = 0.84 p = 0.40 p = 0.01 p = 0.57 p = 0.41 p =0.03 p = 0.97

Supplementary Table 2: Supplementary Table 2: outcome of repeated measures ANOVAs for penetrometer resistance measurements. F-values and p-values are reported and printed bold where p < 0.05. P-values have been adjusted by Greenhouse-Geisser correction for the main factor ‘week’ and all interactions with the factor ‘week’ involved
outcome of repeated measures ANOVA
compaction irrigation depth measured compaction: irrigation
compaction: depth
irrigation: depth
compaction: irrigation: depth
penetrometer resistance in April
F(1, 11) = 20.32, F(1, 11) = 0.14, F(10, 110) = 176.64, F(1, 11) = 1.81, F(10, 110) = 3.11, F(10, 110) = 0.42, F(10, 110) = 0.45,
p = 0.0009 p = 0.72 p < 0.0001 p = 0.21 p = 0.046 p = 0.72 p = 0.70
penetrometer resistance in July
F(1, 11) = 0.82, F(1, 11) = 0.21, F(10, 110) = 0.006, F(1, 11) = 90.51, F(10, 110) = 2.02, F(10, 110) = 1.04, F(10, 110) = 1.18,
p = 0.38 p = 0.65 p < 0.001 p = 0.94 p = 0.11 p = 0.40 p = 0.33
penetrometer resistance in Sep (only 0-30 cm depth)
F(1, 12) = 5.40, F(1, 12) = 2.32, F(5, 60) = 163.07, F(1, 12) = 0.03, F(5, 60) = 17.96, F(5, 60) = 3.91, F(5, 60) = 0.59,
p = 0.04 p = 0.15 p < 0.001 p = 0.86 p < 0.001 p = 0.03 p = 0.58