ahrq quality indicators · ahrq quality indicators guide to prevention quality indicators: hospital...
TRANSCRIPT
AHRQ Quality Indicators Guide to Prevention Quality Indicators: Hospital Admission for Ambulatory Care Sensitive Conditions Department of Health and Human Services Agency for Healthcare Research and Quality http://www.qualityindicators.ahrq.gov October 2001 Version 3.1 (March 12, 2007)

AHRQ Quality Indicators Web Site: http://www.qualityindicators.ahrq.gov
Preface In health care as in other arenas, that which cannot be measured is difficult to improve. Providers, consumers, policy makers, and others seeking to improve the quality of health care need accessible, reliable indicators of quality that they can use to flag potential problems, follow trends over time, and identify disparities across regions, communities, and providers. As noted in a 2001 Institute of Medicine study, Envisioning the National Health Care Quality Report, it is important that such measures cover not just acute care but multiple dimensions of care: staying healthy, getting better, living with illness or disability, and coping with the end of life. The Agency for Healthcare Research and Quality (AHRQ) Quality Indicators (QIs) are one Agency response to this need for a multidimensional, accessible family of quality indicators. They include a family of measures that providers, policy makers, and researchers can use with inpatient data to identify apparent variations in the quality of either inpatient or outpatient care. AHRQ’s Evidence-Based Practice Center (EPC) at the University of California San Francisco (UCSF) and Stanford University adapted, expanded, and refined these indicators based on the original Healthcare Cost and Utilization Project (HCUP) Quality Indicators developed in the early 1990s. The new AHRQ QIs are organized into four modules: Prevention Quality Indicators (PQIs), Inpatient Quality Indicators (IQIs), Patient Safety Indicators (PSIs), and Pediatric Quality Indicators (PDIs). AHRQ has published the modules as a series. Full technical information on the first two modules can be found in Refinement of the HCUP Quality Indicators (Summary), May 2001 prepared by the UCSF-Stanford EPC. It can be accessed at http://www.qualityindicators.ahrq.gov/downloads.htm. This first module focuses on preventive care services—outpatient services geared to staying healthy and living with illness. Researchers and policy makers have agreed for some time that inpatient data offer a useful window on the quality of preventive care in the community. Inpatient data provide information on admissions for “ambulatory care sensitive conditions” that evidence suggests could have been avoided, at least in part, through better outpatient care. Hospitals, community leaders, and policy makers can then use such data to identify community need levels, target resources, and track the impact of programmatic and policy interventions. One of the most important ways we can improve the quality of health care in America is to reduce the need for some of that care by providing appropriate, high-quality preventive services. For this to happen, however, we need to be able to track not only the level of outpatient services but also the outcome of the services people do or do not receive. The PQIs are intended to facilitate such efforts. The PQIs are already being applied at the national level in the National Healthcare Quality Report (http://qualitytools.ahrq.gov/qualityreport) and National Healthcare Disparities Report (http://qualitytools.ahrq.gov/disparitiesreport.) As always, we would appreciate hearing from those who use our measures and tools so that we can identify how they are used, how they can be refined, and how we can measure and improve the quality of the tools themselves. Irene Fraser, Ph.D., Director Center for Organization and Delivery Studies
The programs for the Prevention Quality Indicators (PQIs) can be downloaded from http://www.qualityindicators.ahrq.gov/pqi_download.htm. . Instructions on how to use the programs to calculate the PQI rates are contained in the companion text, Prevention Quality Indicators: SAS Software Documentation or AHRQ QI Windows Application Documentation.
PQI Guide iii Version 3.1(March 12, 2007)

AHRQ Quality Indicators Web Site: http://www.qualityindicators.ahrq.gov
Acknowledgments Support efforts, including refinement and enhancement of the AHRQ Quality Indicators and related products, are provided by the Support for Quality Indicators contract team. The following individuals from Battelle Memorial Institute, Stanford University, and University of California (UC) constitute the Support for Quality Indicators-II core team: Sheryl M. Davies, M.A. Mark Gritz, Ph.D. Kathryn M. McDonald, M.M. Bruce Ellis, M.S. Theresa Schaaf, P.M.P. Patrick Romano, M.D., M.P.H Jeffrey Geppert, J.D. Elaine Keller, M.Ed. Jeff Schoenborn, B.S. The Agency for Healthcare Research and Quality Support for Quality Indicators-II team includes: Marybeth Farquhar, Project Officer Mary B. Haines, Contract Officer Mamatha Pancholi, Project Officer The following staff from the Evidence-based Practice Center (EPC) at UCSF-Stanford performed the evidence review, completed the empirical evaluation, and created the programming code and technical documentation for the new Quality Indicators: Core Project Team Mark McClellan, M.D., Ph.D., principal investigator Kathryn M. McDonald, M.M., EPC coordinator Sheryl M. Davies, M.A.
Jeffrey Geppert, J.D. Patrick Romano, M.D., M.P.H. Kaveh G. Shojania, M.D.
Other Contributors Amber Barnato, M.D. Paul Collins, B.A. Bradford Duncan M.D. Michael Gould, M.D., M.S. Paul Heidenreich, M.D. Corinna Haberland, M.D.
Paul Matz, M.D. Courtney Maclean, B.A. Susana Martins, M.D. Kristine McCoy, M.P.H. Suzanne Olson, M.A. L. LaShawndra Pace, B.A. Mark Schleinitz, M.D.
Herb Szeto, M.D. Carol Vorhaus, M.B.A Peter Weiss, M.D. Meghan Wheat, B.A. Consultants Douglas Staiger, Ph.D.
The following staff from Social & Scientific Systems, Inc. developed this software product, documentation, and guide: Programmers Leif Karell Kathy McMillan Fred Rohde
Technical Writer Patricia Burgess Graphics Designer Laura Spofford
Contributors from the Agency for Healthcare Research and Quality: Anne Elixhauser, Ph.D. Denise Remus, Ph.D., R.N.
H. Joanna Jiang, Ph.D. Margaret Coopey, R.N., M.G.A, M.P.S.
We also wish to acknowledge the contribution of the peer reviewers of the evidence report and the beta-testers of the software products, whose input was invaluable.
PQI Guide iv Version 3.1(March 12, 2007)
AHRQ Quality Indicators Web Site: http://www.qualityindicators.ahrq.gov
Table of Contents
Preface ........................................................................................................................................................ iii
Acknowledgments ..................................................................................................................................... iv
1.0 Introduction to the AHRQ Prevention Quality Indicators................................................................1 1.1 What Are the Prevention Quality Indicators?...............................................................................1 1.2 How Can the PQIs Be Used in Quality Assessment? .................................................................2 1.3 What does this Guide Contain?...................................................................................................3
2.0 Origins and Background of the Quality Indicators..........................................................................4 2.1 Development of the AHRQ Quality Indicators .............................................................................4 2.2 AHRQ Quality Indicator Modules.................................................................................................4
3.0 Methods of Identifying, Selecting, and Evaluating the Quality Indicators ....................................6 3.1 Step 1: Obtain Background Information on QI Use ....................................................................6 3.2 Step 2: Search the Literature to Identify Potential QIs ................................................................6 3.3 Step 3: Review the Literature to Evaluate the QIs According to Predetermined Criteria............7 3.4 Step 4: Perform a Comprehensive Evaluation of Risk Adjustment ............................................8 3.5 Step 5: Evaluate the Indicators Using Empirical Analyses.........................................................9
4.0 Summary Evidence on the Prevention Quality Indicators ............................................................11 4.1 Version 3.1 PQIs........................................................................................................................11 4.2 Strengths and Limitations in Using the PQIs .............................................................................14 4.3 Questions for Future Work.........................................................................................................15
5.0 Detailed Evidence for Prevention Quality Indicators ....................................................................17 5.1 Diabetes Short-term Complications Admission Rate (PQI 1)....................................................20 5.2 Perforated Appendix Admission Rate (PQI 2) ...........................................................................22 5.3 Diabetes Long-term Complications Admission Rate (PQI 3) ....................................................24 5.4 Chronic Obstructive Pulmonary Disease Admission Rate (PQI 5)............................................26 5.5 Hypertension Admission Rate (PQI 7).......................................................................................28 5.6 Congestive Heart Failure Admission Rate (PQI 8) ....................................................................30 5.7 Low Birth Weight Rate (PQI 9) ..................................................................................................32 5.8 Dehydration Admission Rate (PQI 10) ......................................................................................34 5.9 Bacterial Pneumonia Admission Rate (PQI 11).........................................................................36 5.10 Urinary Tract Infection Admission Rate (PQI 12) ......................................................................38 5.11 Angina without Procedure Admission Rate (PQI 13) ................................................................40 5.12 Uncontrolled Diabetes Admission Rate (PQI 14) ......................................................................42 5.13 Adult Asthma Admission Rate (PQI 15) ....................................................................................44 5.14 Rate of Lower-extremity Amputation among Patients with Diabetes (PQI 16)..........................46
6.0 Using Different Types of QI Rates ...................................................................................................48
7.0 References .........................................................................................................................................50
Appendix A: Links.................................................................................................................................. A-1 List of Tables Table 1. Prevention Quality Indicators ........................................................................................................12 Table 2. Diabetes-related Prevention Quality Indicators ............................................................................14
PQI Guide v Version 3.1(March 12, 2007)
AHRQ Quality Indicators Web Site: http://www.qualityindicators.ahrq.gov
1.0 Introduction to the AHRQ Prevention Quality Indicators Prevention is an important role for all health care providers. Providers can help individuals stay healthy by preventing disease, and they can prevent complications of existing disease by helping patients live with their illnesses. To fulfill this role, however, providers need data on the impact of their services and the opportunity to compare these data over time or across communities. Local, State, and Federal policymakers also need these tools and data to identify potential access or quality-of-care problems related to prevention, to plan specific interventions, and to evaluate how well these interventions meet the goals of preventing illness and disability. The Agency for Healthcare Research and Quality (AHRQ) Prevention Quality Indicators (PQIs) represent one such tool. Local, State, or national data collected using the PQIs can flag potential problems resulting from a breakdown of health care services by tracking hospitalizations for conditions that should be treatable on an outpatient basis, or that could be less severe if treated early and appropriately. The PQIs represent the current state of the art in measuring the outcomes of preventive and outpatient care through analysis of inpatient discharge data. This update of the AHRQ PQIs (Version 3.1) reflects changes in indicators associated with ICD-9-CM coding updates for FY 2007 (effective 10-1-2006). The Risk Adjustment and Hierarchical Modeling (RAHM) Workgroup recommended that the AHRQ adopt a hierarchical modeling approach with the AHRQ QI. As a result, in the FY2007 release the parameter file of risk adjustment covariates is computed using a hospital random-effect instead of the existing simple logistic model. Because the covariates are computed on such a large dataset with thousands of hospitals and millions of patients, the adoption of the hierarchical model will be relatively transparent to current users of the indicators. In other words, the hierarchical model does not change the values of the coefficients very much. The univariate shrinkage estimator is unchanged. For more information on the work of the RAHM workgroup, see the draft report at (http://www.qualityindicators.ahrq.gov/listserv_archive_2006.htm#Oct13). Population figures through 2007 for use with AHRQ Quality Indicator software were derived from U. S. Census Bureau data using estimates for 2000 through 2005 and modified projections for 2006 and 2007. The 2007 file uses the same inter-censal estimates for the years 1995 through 1999 as the 2006 file, so counts for these years did not change. 1.1 What Are the Prevention Quality Indicators? The PQIs are a set of measures that can be used with hospital inpatient discharge data to identify "ambulatory care sensitive conditions" (ACSCs). ACSCs are conditions for which good outpatient care can potentially prevent the need for hospitalization, or for which early intervention can prevent complications or more severe disease. Even though these indicators are based on hospital inpatient data, they provide insight into the quality of the health care system outside the hospital setting. Patients with diabetes may be hospitalized for diabetic complications if their conditions are not adequately monitored or if they do not receive the patient education needed for appropriate self-management. Patients may be hospitalized for asthma if primary care providers fail to adhere to practice guidelines or to prescribe appropriate treatments. Patients with appendicitis who do not have ready access to surgical evaluation may experience delays in receiving needed care, which can result in a life-threatening condition—perforated appendix. The PQIs consist of the following 14 ambulatory care sensitive conditions, which are measured as rates of admission to the hospital:
PQI Guide 1 Version 3.1 (March 12, 2007)

AHRQ Quality Indicators Web Site: http://www.qualityindicators.ahrq.gov
PQI
Number Prevention Quality Indicators
1 Diabetes short-term complication admission rate 2 Perforated appendix admission rate 3 Diabetes long-term complication admission rate 5 Chronic obstructive pulmonary disease admission rate 7 Hypertension admission rate 8 Congestive heart failure admission rate 9 Low Birth Weight 10 Dehydration admission rate 11 Bacterial pneumonia admission rate 12 Urinary tract infection admission rate 13 Angina admission without procedure 14 Uncontrolled diabetes admission rate 15 Adult asthma admission rate 16 Rate of lower-extremity amputation among patients with diabetes
PQIs #4 and #6 have been moved to the Pediatric Quality Indicators module. All PQIs now apply only to adult populations. Although other factors outside the direct control of the health care system, such as poor environmental conditions or lack of patient adherence to treatment recommendations, can result in hospitalization, the PQIs provide a good starting point for assessing quality of health services in the community. Because the PQIs are calculated using readily available hospital administrative data, they are an easy-to-use and inexpensive screening tool. They can be used to provide a window into the community—to identify unmet community heath care needs, to monitor how well complications from a number of common conditions are being avoided in the outpatient setting, and to compare performance of local health care systems across communities. 1.2 How Can the PQIs Be Used in Quality Assessment? While these indicators use hospital inpatient data, their focus is on outpatient health care. Except in the case of patients who are readmitted soon after discharge from a hospital, the quality of inpatient care is unlikely to be a significant determinant of admission rates for ambulatory care sensitive conditions. Rather, the PQIs assess the quality of the health care system as a whole, and especially the quality of ambulatory care, in preventing medical complications. As a result, these measures are likely to be of the greatest value when calculated at the population level and when used by public health groups, State data organizations, and other organizations concerned with the health of populations.1 These indicators serve as a screening tool rather than as definitive measures of quality problems. They can provide initial information about potential problems in the community that may require further, more in-depth analysis. Policy makers and health care providers can use the PQIs to answer questions such as:
• Does the admission rate for diabetes complications in my community suggest a problem in the provision of appropriate outpatient care to this population?
• How does the admission rate for congestive heart failure vary over time and from one region of the country to another?
1 Individual hospitals that are sole providers for communities and that are involved in outpatient care may be able to use the PQI programs. .Managed care organizations and health care providers with responsibility for a specified enrolled population can use the PQI programs but must provide their own population denominator data.
PQI Guide 2 Version 3.1 (March 12, 2007)

AHRQ Quality Indicators Web Site: http://www.qualityindicators.ahrq.gov
State policy makers and local community organizations can use the PQIs to assess and improve community health care. For example, an official at a State health department wants to gain a better understanding of the quality of care provided to people with diabetes in her State. She selects the four PQIs related to diabetes and applies the statistical programs downloaded from the AHRQ Web site to hospital discharge abstract data collected by her State. Based on output from the programs, she examines the age- and sex-adjusted admission rates for these diabetes PQIs for her State as a whole and for communities within her State. The programs provide output that she uses to compare different population subgroups, defined by age, ethnicity, or gender. She finds that admission rates for short-term diabetes complications and uncontrolled diabetes are especially high in a major city in her State and that there are differences by race/ethnicity. She also applies the PQI programs to multiple years of her State’s data to track trends in hospital admissions over time. She discovers that the trends for these two PQIs are increasing in this city but are stable in the rest of the State. She then compares the figures from her State to national and regional averages on these PQIs using HCUPnet—an online query system providing access to statistics based on HCUP data.2 The State average is slightly higher than the regional and national averages, but the averages for this city are substantially higher. After she has identified disparities in admission rates in this community and in specific patient groups, she further investigates the underlying reasons for those disparities. She attempts to obtain information on the prevalence of diabetes across the State to determine if prevalence is higher in this city than in other communities. Finding no differences, she consults with the State medical association to begin work with local providers to discern if quality-of-care problems underlie these disparities. She contacts hospitals and physicians in this community to determine if community outreach programs can be implemented to encourage patients with diabetes to seek care and to educate them on lifestyle modifications and diabetes self-management. She then helps to develop specific interventions to improve care for people with diabetes and reduce preventable complications and resulting hospitalizations. 1.3 What does this Guide Contain? This guide provides background information on the PQIs. First, it describes the origin of the entire family of AHRQ Quality Indicators. Second, it provides an overview of the methods used to identify, select, and evaluate the AHRQ Quality Indicators. Third, the guide summarizes the PQIs specifically, describes strengths and limitations of the indicators, documents the evidence that links the PQIs to the quality of outpatient health care services, and then provides in-depth two-page descriptions of each PQI. The section, "Using Different Types of QI Rates," explains the various types of rates calculated by the software and presents tips on selecting the appropriate type of rate to use for given situations. The document Prevention Quality Indicators Technical Specifications outlines the specific definitions of each PQI, with complete ICD-9-CM coding specifications. The document Prevention Quality Indicators Comparative Data, provides the current area rates, area standard deviation, population rates, and ratings for each indicator. See Appendix A for links to these and other documents as well as Web sites that may be of interest to PQI users.
2 HCUPnet can be found at http://hcup.ahrq.gov/HCUPnet.asp and provides instant access to national and regional data from the Healthcare Cost and Utilization Project, a Federal-State-industry partnership in health data maintained by the Agency for Healthcare Research and Quality.
PQI Guide 3 Version 3.1 (March 12, 2007)

AHRQ Quality Indicators Web Site: http://www.qualityindicators.ahrq.gov
2.0 Origins and Background of the Quality Indicators In the early 1990s, in response to requests for assistance from State-level data organizations and hospital associations with inpatient data collection systems, AHRQ developed a set of quality measures that required only the type of information found in routine hospital administrative data—diagnoses and procedures, along with information on patient’s age, gender, source of admission, and discharge status. These States were part of the Healthcare Cost and Utilization Project, an ongoing Federal-State-private sector collaboration to build uniform databases from administrative hospital-based data. AHRQ developed these measures, called the HCUP Quality Indicators, to take advantage of a readily available data source—administrative data based on hospital claims—and quality measures that had been reported elsewhere.3 The 33 HCUP QIs included measures for avoidable adverse outcomes, such as in-hospital mortality and complications of procedures; use of specific inpatient procedures thought to be overused, underused, or misused; and ambulatory care sensitive conditions. Although administrative data cannot provide definitive measures of health care quality, they can be used to provide indicators of health care quality that can serve as the starting point for further investigation. The HCUP QIs have been used to assess potential quality-of-care problems and to delineate approaches for dealing with those problems. Hospitals with high rates of poor outcomes on the HCUP QIs have reviewed medical records to verify the presence of those outcomes and to investigate potential quality-of-care problems.4 For example, one hospital that detected high rates of admissions for diabetes complications investigated the underlying reasons for the rates and established a center of excellence to strengthen outpatient services for patients with diabetes. 2.1 Development of the AHRQ Quality Indicators Since the original development of the HCUP QIs, the knowledge base on quality indicators has increased significantly. Risk-adjustment methods have become more readily available, new measures have been developed, and analytic capacity at the State level has expanded considerably. Based on input from current users and advances to the scientific base for specific indicators, AHRQ funded a project to refine and further develop the original QIs. The project was conducted by the UCSF-Stanford EPC. The major constraint placed on the UCSF-Stanford EPC was that the measures could require only the type of information found in hospital discharge abstract data. Further, the data elements required by the measures had to be available from most inpatient administrative data systems. Some State data systems contain innovative data elements, often based on additional information from the medical record. Despite the value of these record-based data elements, the intent of this project was to create measures that were based on a common denominator discharge data set, without the need for additional data collection. This was critical for two reasons. First, this constraint would result in a tool that could be used with any inpatient administrative data, thus making it useful to most data systems. Second, this would enable national and regional benchmark rates to be provided using HCUP data, since these benchmark rates would need to be calculated using the universe of data available from the States. 2.2 AHRQ Quality Indicator Modules The work of the UCSF-Stanford EPC resulted in the AHRQ Quality Indicators, which are available as four separate modules: 3 Ball JK, Elixhauser A, Johantgen M, et al. HCUP Quality Indicators, Methods, Version 1.1: Outcome, Utilization, and Access Measures for Quality Improvement. (AHCPR Publication No. 98-0035). Healthcare Cost and Utilization project (HCUP-3) Research notes: Rockville, MD: Agency for Health Care Policy and Research, 1998. 4 Impact: Case Studies Notebook – Documented Impact and Use of AHRQ's Research. Compiled by Division of Public Affairs, Office of Health Care Information, Agency for Healthcare Research and Quality.
PQI Guide 4 Version 3.1 (March 12, 2007)
AHRQ Quality Indicators Web Site: http://www.qualityindicators.ahrq.gov
• Prevention Quality Indicators. These indicators consist of “ambulatory care sensitive conditions,” hospital admissions that evidence suggests could have been avoided through high-quality outpatient care or that reflect conditions that could be less severe, if treated early and appropriately.
• Inpatient Quality Indicators. These indicators reflect quality of care inside hospitals and include inpatient mortality; utilization of procedures for which there are questions of overuse, underuse, or misuse; and volume of procedures for which there is evidence that a higher volume of procedures is associated with lower mortality.
• Patient Safety Indicators. These indicators also reflect quality of care inside hospitals, but focus on surgical complications and other iatrogenic events.
• Pediatric Quality Indicators. This module, made available in February, 2006, contains indicators that apply to the special characteristics of the pediatric population.
The core of the Pediatric Quality Indicators (PDIs) is formed by indicators drawn from the original three modules. Some of these indicators were already geared to the pediatric population (for example, PQI 4 – Pediatric Asthma Admission Rate). These indicators are being removed from the original modules. Others were adapted from indicators that apply to both adult and pediatric populations. These indicators remain in the original module, but will apply only to adult populations.
PQI Guide 5 Version 3.1 (March 12, 2007)
AHRQ Quality Indicators Web Site: http://www.qualityindicators.ahrq.gov
3.0 Methods of Identifying, Selecting, and Evaluating the Quality Indicators
In developing the new quality indicators, the UCSF-Stanford EPC applied the Institute of Medicine’s widely cited definition of quality care: “the degree to which health services for individuals and populations increase the likelihood of desired health outcomes and are consistent with current professional knowledge.”5 They formulated six specific key questions to guide the development process:
• Which indicators are currently in use or described in the literature that could be defined using hospital discharge data?
• What are the quality relationships reported in the literature that could be used to define new indicators using hospital discharge data?
• What evidence exists for indicators not well represented in the original indicators—pediatric conditions, chronic disease, new technologies, and ambulatory care sensitive conditions?
• Which indicators have literature-based evidence to support face validity, precision of measurement, minimum bias, and construct validity of the indicator?
• What risk-adjustment method should be suggested for use with the recommended indicators, given the limits of administrative data and other practical concerns?
• Which indicators perform well on empirical tests of precision of measurement, minimum bias, and construct validity?
As part of this project, the UCSF-Stanford EPC identified quality indicators reported in the literature and used by health care organizations, evaluated the original quality indicators and potential indicators using literature review and empirical methods, incorporated risk adjustment for comparative analysis, and developed new programs that could be employed by users with their own hospital administrative data. This section outlines the steps used to arrive at a final set of quality measures. 3.1 Step 1: Obtain Background Information on QI Use The project team at the UCSF-Stanford EPC interviewed 33 individuals affiliated with hospital associations, business coalitions, State data groups, Federal agencies, and academia about various topics related to quality measurement, including indicator use, suggested indicators, and other potential contacts. Interviews were tailored to the specific expertise of interviewees. The sample was not intended to be representative of any population; rather, individuals were selected to include QI users and potential users from a broad spectrum of organizations in both the public and private sectors. Three broad audiences were considered for the quality measures: health care providers and managers, who could use the quality measures to assist in initiatives to improve quality; public health policy makers, who could use the information from indicators to target public health interventions; and health care purchasers, who could use the measures to guide decisions about health policies. 3.2 Step 2: Search the Literature to Identify Potential QIs The project team performed a structured review of the literature to identify potential indicators. They used Medline to identify the search strategy that returned a test set of known applicable articles in the most concise manner. Using the Medical Subject Heading (MeSH) terms “hospital, statistic, and methods” and “quality indicators” resulted in approximately 2,600 articles published in 1994 or later. After screening
5 Institute of Medicine Division of Health Care Services. . . Medicare: a strategy for quality assurance. . . Washington, DC: National Academy Press; 1990.
PQI Guide 6 Version 3.1 (March 12, 2007)

AHRQ Quality Indicators Web Site: http://www.qualityindicators.ahrq.gov
titles and abstracts for relevancy, the search yielded 181 articles that provided information on potential quality indicators based on administrative data. Clinicians, health services researchers, and other team members abstracted information from these articles in two stages. In the first stage, preliminary abstraction, they evaluated each of the 181 identified articles for the presence of a defined quality indicator, clinical rationale, and strengths and weaknesses. To qualify for full abstraction, the articles must have explicitly defined a novel quality indicator. Only 27 articles met this criterion. The team collected information on the definition of the quality indicator, validation, and rationale during full abstraction. In addition, they identified additional potential indicators using the CONQUEST database; the National Library of Healthcare Indicators developed by the Joint Commission on Accreditation of Healthcare Organizations (JCAHO); a list of ORYX-approved indicators provided by JCAHO; and telephone interviews. 3.3 Step 3: Review the Literature to Evaluate the QIs According to
Predetermined Criteria The project team evaluated each potential quality indicator against the following six criteria, which were considered essential for determining the reliability and validity of a quality indicator:
• Face validity. An adequate quality indicator must have sound clinical or empirical rationale for its use. It should measure an important aspect of quality that is subject to provider or health care system control.
• Precision. An adequate quality indicator should have relatively large variation among providers or areas that is not due to random variation or patient characteristics. This criterion measures the impact of chance on apparent provider or community health system performance.
• Minimum bias. The indicator should not be affected by systematic differences in patient case-mix, including disease severity and comorbidity. In cases where such systematic differences exist, an adequate risk adjustment system should be possible using available data.
• Construct validity. The indicator should be related to other indicators or measures intended to measure the same or related aspects of quality. In general, better outpatient care (including, in some cases, adherence to specific evidence-based treatment guidelines) can reduce patient complication rates.
• Fosters real quality improvement. The indicator should be robust to possible provider manipulation of the system. In other words, the indicator should be insulated from perverse incentives for providers to improve their reported performance by avoiding difficult or complex cases, or by other responses that do not improve quality of care.
• Application. The indicator should have been used in the past or have high potential for working well with other indicators. Sometimes looking at groups of indicators together is likely to provide a more complete picture of quality.
Based on the initial review, the team identified and evaluated over 200 potential indicators using these criteria. Of this initial set, 45 indicators passed this initial screen and received comprehensive literature and empirical evaluation. In some cases, whether an indicator complemented other promising indicators was a consideration in retaining it, allowing the indicators to provide more depth in specific areas. For this final set of 45 indicators, the team reviewed an additional 2,000 articles to provide evidence on indicators during the evaluation phase. They searched Medline for articles relating to each of the six areas of evaluation described above. Clinicians and health services researchers reviewed the literature for evidence and prepared a referenced summary description on each indicator.
PQI Guide 7 Version 3.1 (March 12, 2007)
AHRQ Quality Indicators Web Site: http://www.qualityindicators.ahrq.gov
As part of the review process, the team assessed the link between each indicator and health care quality along the following dimensions:
• Proxy. Some indicators do not specifically measure a patient outcome or a process measure of quality. Rather, they measure an aspect of care that is correlated with process measures of quality or patient outcomes. These indicators are best used in conjunction with other indicators measuring similar aspects of clinical care, or when followed with more direct and in-depth investigations of quality.
• Selection bias. Selection bias results when a substantial percentage of care for a condition is provided in the outpatient setting, so the subset of inpatient cases may be unrepresentative. In these cases, examination of outpatient care or emergency room data may help reduce selection bias.
• Information bias. Quality indicators are based on information available in hospital discharge data sets, but some missing information may actually be important to evaluating the outcomes of hospital care. In these cases, examination of missing information may help to improve indicator performance.
• Confounding bias. Patient characteristics may substantially affect performance on a measure and may vary systematically across areas. In these cases, adequate risk adjustment may help to improve indicator performance.
• Unclear construct validity. Problems with construct validity include uncertain or poor correlations with widely accepted process measures or with risk-adjusted outcome measures. These indicators would benefit from further research to establish their relationship with quality care.
• Easily manipulated. Quality indicators may create perverse incentives to improve performance without actually improving quality. Although very few of these perverse responses have been proven, they are theoretically important and should be monitored to ensure true quality improvement.
• Unclear benchmark. For some indicators, the “right rate” has not been established, so comparison with national, regional, or peer group means may be the best benchmark available. Very low PQI rates may flag an underuse problem; that is, providers may fail to hospitalize patients who would benefit from inpatient care. On the other hand, overuse of acute care resources may potentially occur when patients who do not clinically require inpatient care are hospitalized.
3.4 Step 4: Perform a Comprehensive Evaluation of Risk Adjustment The project team identified potential risk-adjustment systems by reviewing the applicable literature and asking the interviewees in step 1 to identify their preferences. Generally, users preferred that the system be (1) open, with published logic; (2) cost-effective, with data collection costs minimized and additional data collection being well justified; (3) designed using a multiple-use coding system, such as those used for reimbursement; and (4) officially recognized by government, hospital groups, or other organizations. In general, diagnosis-related groups (DRGs) seemed to fit more of the user preference-based criteria than other alternatives. A majority of the users interviewed already used the 3M™ All-Patient Refined DRG6 (APR-DRG) system, which has been reported to perform well in predicting resource use and death when compared to other DRG-based systems. APR-DRGs were used to conduct indicator evaluations to determine the impact of measured differences in patient severity on the relative performance of providers and to provide the basis for implementing APR-DRGs as an optional risk-adjustment system for hospital-level QI measures. The implementation of 6 Information on the 3M™ APR-DRG system is available at http://www.3m.com/us/healthcare/his/products/coding/refined_drg.jhtml.
PQI Guide 8 Version 3.1 (March 12, 2007)
AHRQ Quality Indicators Web Site: http://www.qualityindicators.ahrq.gov
APR-DRGs is based on an ordinary least squares regression model. Area indicators (including all PQIs) were risk-adjusted only for age and sex differences. 3.5 Step 5: Evaluate the Indicators Using Empirical Analyses The project team conducted extensive empirical testing of all potential indicators using the 1995-97 HCUP State Inpatient Databases (SID) and Nationwide Inpatient Sample (NIS) to determine precision, bias, and construct validity. The 1997 SID contains uniform data on inpatient stays in community hospitals for 22 States covering approximately 60% of all U.S. hospital discharges. The NIS is designed to approximate a 20% of U.S. community hospitals and includes all stays in the sampled hospitals. Each year of the NIS contains between 6 million and 7 million records from about 1,000 hospitals. The NIS combines a subset of the SID data, hospital-level variables, and hospital and discharge weights for producing national estimates. The project team conducted tests to examine three things: precision, bias, and construct validity. Precision. The first step in the analysis involved precision tests to determine the reliability of the indicator for distinguishing real differences in provider performance. For indicators that may be used for quality improvement, it is important to know with what precision, or surety, a measure can be attributed to an actual construct rather than random variation. For each indicator, the variance can be broken down into three components: variation within a provider (actual differences in performance due to differing patient characteristics), variation among providers (actual differences in performance among providers), and random variation. An ideal indicator would have a substantial amount of the variance explained by between-provider variance, possibly resulting from differences in quality of care, and a minimum amount of random variation. The project team performed four tests of precision to estimate the magnitude of between-provider variance on each indicator:
• Signal standard deviation was used to measure the extent to which performance of the QI varies systematically across hospitals or areas.
• Provider/area variation share was used to calculate the percentage of signal (or true) variance relative to the total variance of the QI.
• Signal-to-noise ratio was used to measure the percentage of the apparent variation in QIs across providers that is truly related to systematic differences across providers and not random variations (noise) from year to year.
• In-sample R-squared was used to identify the incremental benefit of applying multivariate signal extraction methods for identifying additional signal on top of the signal-to-noise ratio.
In general, random variation is most problematic when there are relatively few observations per provider, when adverse outcome rates are relatively low, and when providers have little control over patient outcomes or variation in important processes of care is minimal. If a large number of patient factors that are difficult to observe influence whether or not a patient has an adverse outcome, it may be difficult to separate the “quality signal” from the surrounding noise. Two signal extraction techniques were applied to improve the precision of an indicator:
• Univariate methods were used to estimate the “true” quality signal of an indicator based on information from the specific indicator and 1 year of data.
• Multivariate signal extraction (MSX) methods were used to estimate the “true” quality signal based on information from a set of indicators and multiple years of data. In most cases, MSX methods extracted additional signal, which provided much more precise estimates of true hospital or area quality.
PQI Guide 9 Version 3.1 (March 12, 2007)

AHRQ Quality Indicators Web Site: http://www.qualityindicators.ahrq.gov
Bias. To determine the sensitivity of potential QIs to bias from differences in patient severity, unadjusted performance measures for specific hospitals were compared with performance measures that had been adjusted for age and gender. All of the PQIs and some of the Inpatient Quality Indicators (IQIs) could only be risk-adjusted for age and sex. The 3M™ APR-DRG System Version 12 with Severity of Illness and Risk of Mortality subclasses was used for risk adjustment of the utilization indicators and the in-hospital mortality indicators, respectively. Five empirical tests were performed to investigate the degree of bias in an indicator:
• Rank correlation coefficient of the area or hospital with (and without) risk adjustment—gives the overall impact of risk adjustment on relative provider or area performance.
• Average absolute value of change relative to mean—highlights the amount of absolute change in performance, without reference to other providers’ performance.
• Percentage of highly ranked hospitals that remain in high decile—reports the percentage of hospitals or areas that are in the highest deciles without risk adjustment that remain there after risk adjustment is performed.
• Percentage of lowly ranked hospitals that remain in low decile—reports the percentage of hospitals or areas that are in the lowest deciles without risk adjustment that remain there after risk adjustment is performed.
• Percentage that change more than two deciles—identifies the percentage of hospitals whose relative rank changes by a substantial percentage (more than 20%) with and without risk adjustment.
Construct validity. Construct validity analyses provided information regarding the relatedness or independence of the indicators. If quality indicators do indeed measure quality, then two measures of the same construct would be expected to yield similar results. The team used factor analysis to reveal underlying patterns among large numbers of variables—in this case, to measure the degree of relatedness between indicators. In addition, they analyzed correlation matrices for indicators.
PQI Guide 10 Version 3.1 (March 12, 2007)
AHRQ Quality Indicators Web Site: http://www.qualityindicators.ahrq.gov
4.0 Summary Evidence on the Prevention Quality Indicators The rigorous evaluations performed by the UCSF-Stanford EPC, based on literature review and empirical testing of indicators, resulted in 16 indicators that reflect ambulatory care sensitive conditions (ACSCs). These ACSCs have been reported and tested in a number of published studies involving consensus processes involving panels of expert physicians, using a range of methodologies and decision criteria. Two sets of ambulatory care sensitive conditions are widely used:
• The set developed by John Billings in conjunction with the United Hospital Fund of New York includes 28 ambulatory care sensitive conditions, identified by a panel of six physicians.7
• The set developed by Joel Weissman includes 12 avoidable admissions identified through review of the literature and evaluation by a panel of physicians.8
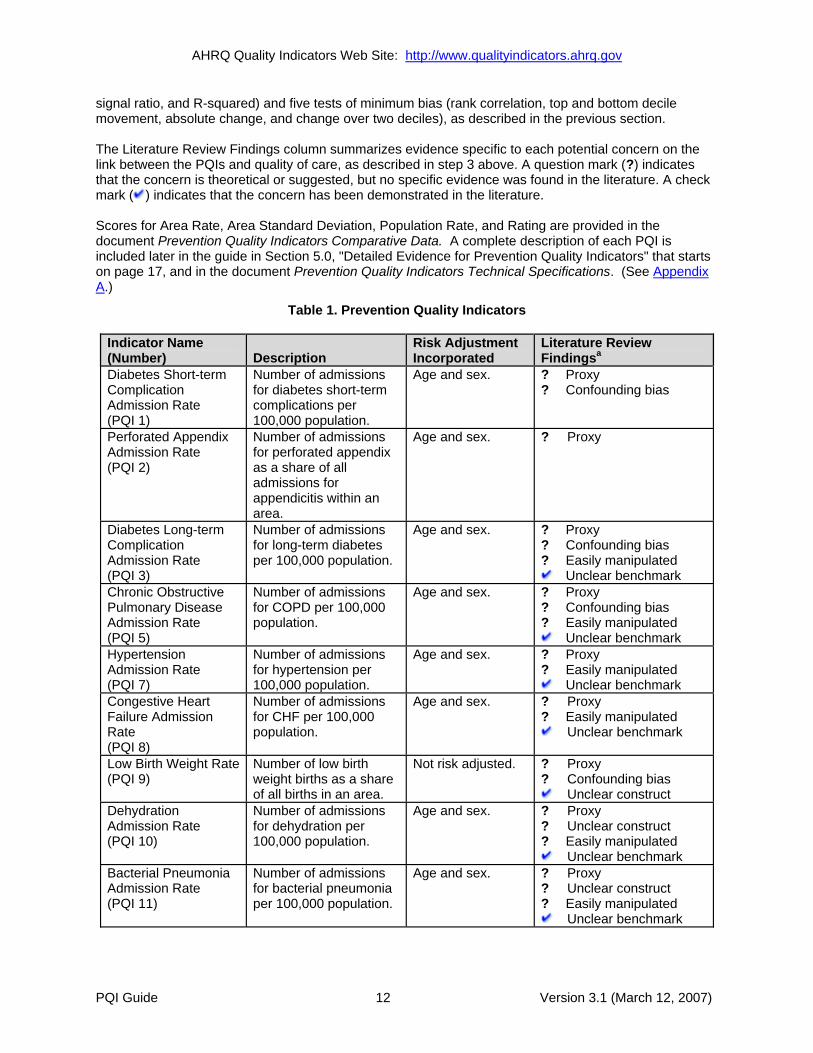
Many of the ACSCs have practice guidelines associated with them, including almost all of the chronic conditions and about half of the acute medical or pediatric conditions. Studies have shown that better outpatient care (including, in some cases, adherence to specific evidence-based treatment guidelines) can reduce patient complication rates of existing disease, including complications leading to hospital admissions. Empirically, most of the hospital admission rates for ACSCs are correlated with each other, suggesting that common underlying factors influence many of the rates. Five of these 16 PQIs were included in the original HCUP QIs—perforated appendix, low birth weight, pediatric asthma, diabetes short-term complications, and diabetes long-term complications—where they were measured at the hospital level. In contrast, the 16 new indicators were constructed at the community level, defined as a Metropolitan Statistical Area (MSA) or a rural county. For each indicator, lower rates indicate potentially better quality. 4.1 Version 3.1 PQIs A modified version of the process described in Section 3.0 is repeated on an annual basis when the PQIs are evaluated and new indicators are considered. With this release two of the original 16 indicators dealing with pediatric asthma and pediatric gastroenteritis have been moved to the Pediatric Quality Indicators (PDI) module. New micropolitan statistical areas and updated metropolitan statistical areas were established by the federal Office of Management and Budget (OMB) circular 03-04 (last revised December 4, 2005). To reflect these changes, all PQI documentation now refers to Metro Area instead of MSA. The SAS software allows users to specify stratification by county level with U.S. Census FIPS or modified FIPS, or by Metro Area with OMB 1999 or OMB 2003 definition. The AHRQ QI Windows Application allows users to generate reports stratified by all four of these, as well as by State. See Appendix A for links to additional information. Table 1 summarizes the results of the literature review and empirical evaluations on the PQIs. It lists each indicator, provides its definition, recommends a risk adjustment strategy, and summarizes important caveats identified from the literature review. Rating of performance on empirical evaluations, as described in step 5 above, ranged from 0 to 26. (The average score for the 16 original PQIs is 14.6.) The scores were intended as a guide for summarizing the performance of each indicator on four empirical tests of precision (signal variance, area-level share,
7Billings J, Zeitel L, Lukomnik J, et al. Impact of socioeconomic status on hospital use in New York City, Health Aff (Millwood) 1993;12(1):162-73. 8Weissman, JS, Gatsonis C, Epstein AM. Rates of avoidable hospitalization by insurance status in Massachusetts and Maryland. JAMA 1992;268(17):2388-94.
PQI Guide 11 Version 3.1 (March 12, 2007)
AHRQ Quality Indicators Web Site: http://www.qualityindicators.ahrq.gov
signal ratio, and R-squared) and five tests of minimum bias (rank correlation, top and bottom decile movement, absolute change, and change over two deciles), as described in the previous section. The Literature Review Findings column summarizes evidence specific to each potential concern on the link between the PQIs and quality of care, as described in step 3 above. A question mark (?) indicates that the concern is theoretical or suggested, but no specific evidence was found in the literature. A check mark ( ) indicates that the concern has been demonstrated in the literature. Scores for Area Rate, Area Standard Deviation, Population Rate, and Rating are provided in the document Prevention Quality Indicators Comparative Data. A complete description of each PQI is included later in the guide in Section 5.0, "Detailed Evidence for Prevention Quality Indicators" that starts on page 17, and in the document Prevention Quality Indicators Technical Specifications. (See Appendix A.)
Table 1. Prevention Quality Indicators
Indicator Name (Number) Description
Risk Adjustment Incorporated
Literature Review Findingsa
Diabetes Short-term Complication Admission Rate (PQI 1)
Number of admissions for diabetes short-term complications per 100,000 population.
Age and sex.
? Proxy ? Confounding bias
Perforated Appendix Admission Rate (PQI 2)
Number of admissions for perforated appendix as a share of all admissions for appendicitis within an area.
Age and sex. ? Proxy
Diabetes Long-term Complication Admission Rate (PQI 3)
Number of admissions for long-term diabetes per 100,000 population.
Age and sex.
? Proxy ? Confounding bias ? Easily manipulated
Unclear benchmark Chronic Obstructive Pulmonary Disease Admission Rate (PQI 5)
Number of admissions for COPD per 100,000 population.
Age and sex.
? Proxy ? Confounding bias ? Easily manipulated
Unclear benchmark Hypertension Admission Rate (PQI 7)
Number of admissions for hypertension per 100,000 population.
Age and sex. ? Proxy ? Easily manipulated
Unclear benchmark Congestive Heart Failure Admission Rate (PQI 8)
Number of admissions for CHF per 100,000 population.
Age and sex. ? Proxy ? Easily manipulated
Unclear benchmark
Low Birth Weight Rate (PQI 9)
Number of low birth weight births as a share of all births in an area.
Not risk adjusted.
? Proxy ? Confounding bias
Unclear construct Dehydration Admission Rate (PQI 10)
Number of admissions for dehydration per 100,000 population.
Age and sex. ? Proxy ? Unclear construct ? Easily manipulated
Unclear benchmark Bacterial Pneumonia Admission Rate (PQI 11)
Number of admissions for bacterial pneumonia per 100,000 population.
Age and sex. ? Proxy ? Unclear construct ? Easily manipulated
Unclear benchmark
PQI Guide 12 Version 3.1 (March 12, 2007)
AHRQ Quality Indicators Web Site: http://www.qualityindicators.ahrq.gov
Indicator Name (Number) Description
Risk Adjustment Literature Review Incorporated Findingsa
Urinary Tract Infection Admission Rate (PQI 12)
Number of admissions for urinary infection per 100,000 population.
Age and sex. ? Proxy ? Unclear construct ? Easily manipulated
Unclear benchmark Angina without Procedure Admission Rate (PQI 13)
Number of admissions for angina without procedure per 100,000 population.
Age and sex. ? Proxy ? Unclear construct ? Easily manipulated
Unclear benchmark Uncontrolled Diabetes Admission Rateb (PQI 14)
Number of admissions for uncontrolled diabetes per 100,000 population.
Age and sex.
? Proxy ? Confounding bias ? Easily manipulated
Adult Asthma Admission Rate (PQI 15)
Number of admissions for asthma in adults per 100,000 population.
Age and sex. ? Proxy ? Easily manipulated
Unclear benchmark Rate of Lower-extremity Amputation Among Patients with Diabetes (PQI 16)
Number of admissions for lower-extremity amputation among patients with diabetes per 100,000 population.
Age and sex.
? Proxy ? Unclear construct
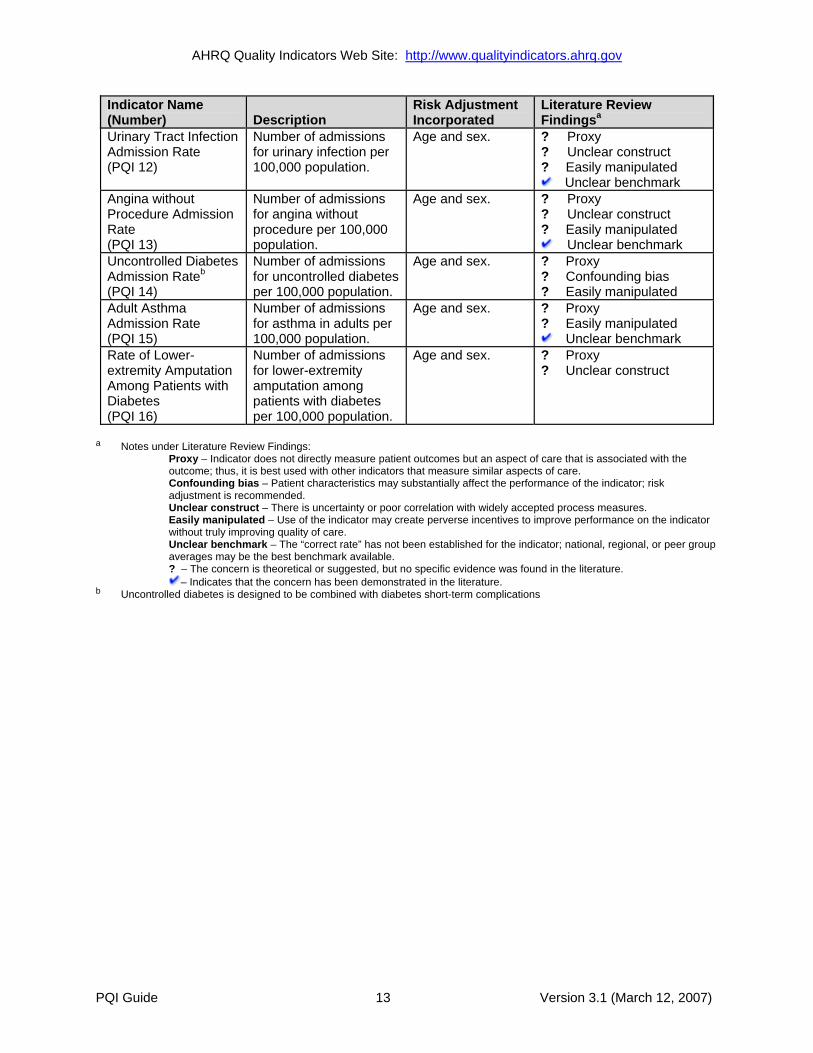
a Notes under Literature Review Findings:
Proxy – Indicator does not directly measure patient outcomes but an aspect of care that is associated with the outcome; thus, it is best used with other indicators that measure similar aspects of care.
Confounding bias – Patient characteristics may substantially affect the performance of the indicator; risk adjustment is recommended.
Unclear construct – There is uncertainty or poor correlation with widely accepted process measures. Easily manipulated – Use of the indicator may create perverse incentives to improve performance on the indicator
without truly improving quality of care. Unclear benchmark – The “correct rate” has not been established for the indicator; national, regional, or peer group
averages may be the best benchmark available. ? – The concern is theoretical or suggested, but no specific evidence was found in the literature. – Indicates that the concern has been demonstrated in the literature.
b Uncontrolled diabetes is designed to be combined with diabetes short-term complications
PQI Guide 13 Version 3.1 (March 12, 2007)
AHRQ Quality Indicators Web Site: http://www.qualityindicators.ahrq.gov
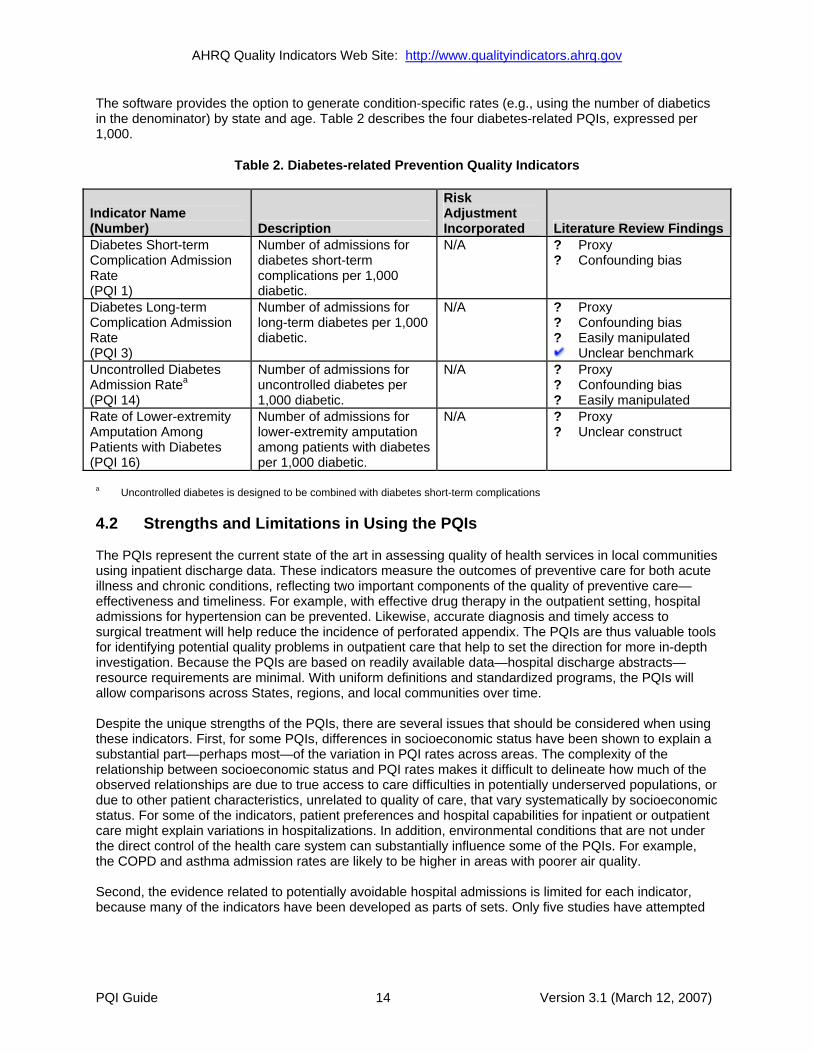
The software provides the option to generate condition-specific rates (e.g., using the number of diabetics in the denominator) by state and age. Table 2 describes the four diabetes-related PQIs, expressed per 1,000.
Table 2. Diabetes-related Prevention Quality Indicators
Indicator Name (Number) Description
Risk Adjustment Incorporated Literature Review Findings
Diabetes Short-term Complication Admission Rate (PQI 1)
Number of admissions for diabetes short-term complications per 1,000 diabetic.
N/A
? Proxy ? Confounding bias
Diabetes Long-term Complication Admission Rate (PQI 3)
Number of admissions for long-term diabetes per 1,000 diabetic.
N/A
? Proxy ? Confounding bias ? Easily manipulated
Unclear benchmark Uncontrolled Diabetes Admission Ratea (PQI 14)
Number of admissions for uncontrolled diabetes per 1,000 diabetic.
N/A
? Proxy ? Confounding bias ? Easily manipulated
Rate of Lower-extremity Amputation Among Patients with Diabetes (PQI 16)
Number of admissions for lower-extremity amputation among patients with diabetes per 1,000 diabetic.
N/A
? Proxy ? Unclear construct
a Uncontrolled diabetes is designed to be combined with diabetes short-term complications 4.2 Strengths and Limitations in Using the PQIs The PQIs represent the current state of the art in assessing quality of health services in local communities using inpatient discharge data. These indicators measure the outcomes of preventive care for both acute illness and chronic conditions, reflecting two important components of the quality of preventive care—effectiveness and timeliness. For example, with effective drug therapy in the outpatient setting, hospital admissions for hypertension can be prevented. Likewise, accurate diagnosis and timely access to surgical treatment will help reduce the incidence of perforated appendix. The PQIs are thus valuable tools for identifying potential quality problems in outpatient care that help to set the direction for more in-depth investigation. Because the PQIs are based on readily available data—hospital discharge abstracts—resource requirements are minimal. With uniform definitions and standardized programs, the PQIs will allow comparisons across States, regions, and local communities over time. Despite the unique strengths of the PQIs, there are several issues that should be considered when using these indicators. First, for some PQIs, differences in socioeconomic status have been shown to explain a substantial part—perhaps most—of the variation in PQI rates across areas. The complexity of the relationship between socioeconomic status and PQI rates makes it difficult to delineate how much of the observed relationships are due to true access to care difficulties in potentially underserved populations, or due to other patient characteristics, unrelated to quality of care, that vary systematically by socioeconomic status. For some of the indicators, patient preferences and hospital capabilities for inpatient or outpatient care might explain variations in hospitalizations. In addition, environmental conditions that are not under the direct control of the health care system can substantially influence some of the PQIs. For example, the COPD and asthma admission rates are likely to be higher in areas with poorer air quality. Second, the evidence related to potentially avoidable hospital admissions is limited for each indicator, because many of the indicators have been developed as parts of sets. Only five studies have attempted
PQI Guide 14 Version 3.1 (March 12, 2007)
AHRQ Quality Indicators Web Site: http://www.qualityindicators.ahrq.gov
to validate individual indicators rather than whole measure sets.9 10 11 12 13 A limitation of this literature is that relatively little is known about which components represent the strongest measures of access and quality. Most of the five papers that did report on individual indicators also used a single variable, such as median area-specific income or rural residence, for construct validation. All but one of these papers10 included adjustment only for demographic factors (e.g., age, sex, and race). Third, despite the relationships demonstrated at the patient level between higher quality ambulatory care and lower rates of hospital admission, few studies have directly addressed the question of whether effective treatments in outpatient settings would reduce the overall incidence of hospitalizations. The extent to which the reporting of admission rates for ambulatory care sensitive conditions may lead to changes in ambulatory practices and admission rates also is unknown. Providers may admit patients who do not clinically require inpatient care or they may do the opposite—fail to hospitalize patients who would benefit from inpatient care. 4.3 Questions for Future Work The limitations discussed above suggest some directions for future work on development and use of the PQIs. Additional data and linkages could provide insights into the underlying causes of hospitalization for these conditions and could facilitate the exploration of potential interventions to prevent such events.
• Studies examining health and risk behaviors in a population could illuminate patient factors associated with the incidence of ambulatory care sensitive conditions.
• Examining environmental data, such as air pollution levels, could provide insight into factors outside the direct control of the health care system that are associated with hospitalization for such conditions.
• Exploring differences in disease prevalence in specific areas could help to discern whether variations in hospitalization rates can be attributed to differences in disease burden across communities that would exist even with optimum preventive care.
• Studies could examine the relationship between rural-urban location and distance to health care resources and hospital admission for ambulatory care sensitive conditions. Such studies would require information on patients’ residence such as patient ZIP codes.
• Linkages with data on local medical resources could help to illuminate the relationship between hospitalization for ACSCs and the supply of medical services and resources, such as the number of primary care and specialty physicians in a community or the supply of hospital beds. For example, the Dartmouth Atlas provides analyses for the Medicare population that suggest that the supply of hospital beds in a community is linked to ambulatory care sensitive admissions, but reported no relationship with local physician supply.14
• Physician office data and outpatient clinic data may provide important information regarding care prior to hospital admission. Outpatient data would enable analyses that examine the processes of care that can prevent hospitalizations due to these conditions.
• Combining inpatient data with emergency department data would support the construction of a more complete picture of quality of care related to ambulatory care sensitive conditions. Some of these conditions are seen in emergency departments without being admitted for inpatient care.
9Weissman JS, Gatsonis C, Epstein AM. Rates of avoidable hospitalization by insurance status in Massachusetts and Maryland. JAMA 1992;268(17)2388-94. 10Bindman AB, Grumbach K, Osmond D, et al. Preventable hospitalizations and access to health care. JAMA 1995;274(4):305-11. 11Billings J, Zeital L, Lukomnik J, et al. Analysis of variation in hospital admission rates associated with area income in New York City. Unpublished report. 12Silver MP, Babitz ME, Magill MK. Ambulatory care sensitive hospitalization rates in the aged Medicare population in Utah, 1990 to 1994: a rural-urban comparison. J Rural Health 1997;13(4):285-94. 13Millman M, editor. Committee on Monitoring Access to Personal Health Care Services. Washington, DC: National Academy Press; 1993. 14 Dartmouth Atlas of Health Care, 1999. Center for the Evaluative Clinical Sciences at Dartmouth Medical School, 2000.
PQI Guide 15 Version 3.1 (March 12, 2007)

AHRQ Quality Indicators Web Site: http://www.qualityindicators.ahrq.gov
This is particularly relevant for the uninsured or underinsured who are more likely to use emergency departments as a routine source of care.
PQI Guide 16 Version 3.1 (March 12, 2007)
AHRQ Quality Indicators Web Site: http://www.qualityindicators.ahrq.gov
5.0 Detailed Evidence for Prevention Quality Indicators This section provides an abbreviated presentation of the details of the literature review and the empirical evaluation for each PQI, including:
• The relationship between the indicator and quality of health care services
• A suggested benchmark or comparison
• The definition of each indicator
• The outcome of interest (or numerator)
• The population at risk (or denominator)
• The results of the empirical testing Empirical testing rated the statistical performance of each indicator, as described in step 5 in the previous section. Scores ranged from 0 to 26 (mean for the 16 original PQIs = 14.6), except for low birth weight for which bias was not tested because adequate risk adjustment was not available. The scores are intended as a guide for summarizing the performance of each indicator on four empirical tests of precision (signal variance, area-level share, signal ratio, and R-squared) and five tests of minimum bias (rank correlation, top and bottom decile movement, absolute change, and change over two deciles), as described in the previous section. The magnitude of the scores, reported in the document Prevention Quality Indicators Comparative Data, provides an indication of the relative rankings of the indicators. These scores were based on indicator performance after risk-adjustment and smoothing, that is, they represent the “best estimate” of the indicator’s true value after accounting for case-mix and reliability. The score for each individual test is an ordinal ranking (e.g., very high, high, moderate, and low). The final summary score was derived by assigning a weight to each ranking (e.g., 3, 2, 1, 0) and summing across these nine individual tests. Higher scores indicate better performance on the empirical tests. The two-page descriptions for each indicator also include a discussion of the summary of evidence, the limitations on using each indicator, and details on:
• Face validity – Does the indicator capture an aspect of quality that is widely regarded as important and subject to provider or public health system control?
• Precision – Is there a substantial amount of provider or community level variation that is not attributable to random variation?
• Minimum bias – Is there either little effect on the indicator of variations in patient disease severity and comorbidities, or is it possible to apply risk adjustment and statistical methods to remove most or all bias?
• Construct validity – Does the indicator perform well in identifying true (or actual) quality-of-care problems?
• Fosters true quality improvement – Is the indicator insulated from perverse incentives for providers to improve their reported performance by avoiding difficult or complex cases, or by other responses that do not improve quality of care?
• Prior use – Has the measure been used effectively in practice? Does it have potential for working well with other indicators?
PQI Guide 17 Version 3.1 (March 12, 2007)
AHRQ Quality Indicators Web Site: http://www.qualityindicators.ahrq.gov
Summary of Evidence Reported for All or Multiple PQIs The literature review of the evidence related to potentially avoidable hospital admissions is limited for each indicator because many of the individual indicators have been developed as parts of sets. This section provides a summary of the general evidence reviewed applicable to all PQIs.
• Precision. The precision of avoidable hospitalization rates is likely to depend on the size of the denominator.
• Minimum bias. Previous studies have documented several characteristics that are associated
with either the risk of an avoidable hospitalization (at the individual level) or the avoidable hospitalization rate (at the area level), including prevalence of the condition, race, socioeconomic status (SES), chronic disease and health of the population.15,16,17 These characteristics may be confounding factors, but also might be measuring subtle aspects of access to care.
• Construct validity. Most previous studies have assessed the validity of an entire set of avoidable
hospital conditions, rather than each condition alone, and have used SES as a marker of access to care. These studies have repeatedly shown strong correlations between household income and avoidable hospitalizations, both at the individual level and the area level. At the zip code level, income alone explains 51-84% of the variability in ACS admission rates across 15 metropolitan areas in the US.18 This association is substantially weaker among persons 65 or more years of age,19,20 as one would expect if it is driven by access to care rather than underlying social factors. Avoidable hospitalization rates are higher among uninsured or Medicaid-enrolled persons than among privately insured persons, even after adjustment for race and income.21
Fewer studies have tested true measures of access to care. In the best of these studies, Bindman and colleagues16 showed that self-reported “difficulty in receiving medical care when needed” explained 50% of the variability in hospitalization rates for 5 chronic medical conditions (asthma, CHF, COPD, diabetes, and hypertension). Adjustment for condition prevalence, propensity to seek care, physician admitting style, and ecological measures of income, education, insurance, race, and gender, had little effect on the association. Having a regular source of care, and primary care physician/population ratios, were also independently associated with avoidable hospitalization rates, when substituted for self-reported access.22 These relationships did not hold in two separate studies of rural zip codes, suggesting that avoidable hospitalization rates are invalid indicators of access in rural areas.23,24 In other studies, the physician/population ratio for family and general physicians has been more strongly associated with avoidable hospitalization rates than measures that include internists, pediatricians, or all physicians.25,26 In studies of Medicaid populations, provider continuity in ambulatory care27 and usual care 15 Bindman AB, Grumbach K, Osmond D, et al. Preventable hospitalizations and access to health care. JAMA 1995;274(4):305-11. 16 Culler SD, Parchman ML, Przybylski M. Factors related to potentially preventable hospitalizations among the elderly. Med Care 1998;36(6):804-17. 17 Blustein J, Hanson K, Shea S. Preventable hospitalizations and socioeconomic status. Health Aff (Millwood) 1998;17(2):177-89. 18 Billings J, Anderson GM, Newman LS. Recent findings on preventable hospitalizations . Health Aff (Millwood) 1996;15(3):239-49. 19 Billings J, Zeitel L, Lukomnik J, et al. Impact of socioeconomic status on hospital use in New York City. Health Aff (Millwood) 1993;12(1):162-73. 20 Pappas G, Hadden WC, Kozak LJ, et al. Potentially avoidable hospitalizations: inequalities in rates between US socioeconomic groups. Am J Public Health 1997;87(5):811-6. 21 Weissman JS, Gatsonis C, Epstein AM. Rates of avoidable hospitalization by insurance status in Massachusetts and Maryland. Jama 1992;268(17):2388-94. 22 Komaromy M, Lurie N, Osmond D, et al. Physician practice style and rates of hospitalization for chronic medical conditions. Med Care 1996;34(6):594-609. 23 Schreiber S, Zielinski T. The meaning of ambulatory care sensitive admissions: urban and rural perspectives. J Rural Health 1997;13(4):276-84. 24 Bindman A, Grumbach K, Osmond D, et al. Accuracy of preventable hospitalization rates for measuring access to care in rural communities. JGIM 1996;11[Suppl 1]:64. 25 Parchman ML, Culler S. Primary care physicians and avoidable hospitalizations . J Fam Pract 1994;39(2):123-8. 26 Epstein A. The role of the medical market in preventable hospitalizations. Abstract Book/Association of Health Services Research 1998;15(316-7). 27 Gill JM, Mainous AG, 3rd. The role of provider continuity in preventing hospitalizations. Arch Fam Med 1998;7(4):352-7.
PQI Guide 18 Version 3.1 (March 12, 2007)
AHRQ Quality Indicators Web Site: http://www.qualityindicators.ahrq.gov
received from a community health center28 were associated with lower avoidable hospitalization rates, and not having a primary care physician was associated with higher rates of avoidable hospitalization.29 However, having a regular source of care (for more than 50% of physician office visits) was not associated with lower avoidable hospitalization rates.30 Several studies of Medicare beneficiaries have shown weak and inconsistent associations between access indicators and avoidable hospitalization rates. For example, persons in the Medicare Current Beneficiary Survey who reported problems obtaining health care, or lived in a health professional shortage area, were not at increased risk of preventable hospitalization.17 Instead, their risk was heavily influenced by clinical factors. However, beneficiaries in fair or poor health reportedly were at increased risk if they lived in a primary care shortage area.31 An area-level analysis based on Medicare claims suggests that the association between admission rates and physician/population ratios is limited to the 10% of health care service areas with the most severe shortage of physicians.32 A full report on the literature review and empirical evaluation can be found in Refinement of the HCUP Quality Indicators by the UCSF-Stanford EPC, Detailed coding information for each PQI is provided in the document Prevention Quality Indicators Technical Specifications. See Appendix A for links to these and other documents.
28 Falik M, Needleman J, McCall N, et al. Ambulatory care sensitive conditions: hospitalization rates by usual source of care. Abstract Book/Association for Health Services Research 1998;15:236-7. 29 Shi L, Samuels ME, Pease M, et al. Patient characteristics associated with hospitalizations for ambulatory care sensitive conditions in South Carolina. Southern Medical Journal 1999;92(10):989-98. 30 Gill JM. Can hospitalizations be avoided by having a regular source of care? Fam Med 1997;29(3):166-71. 31 Parchman ML, Culler SD. Preventable hospitalizations in primary care shortage areas. An analysis of vulnerable Medicare beneficiaries. Arch Fam Med 1999;8(6):487-91. 32 Krakauer H, Jacoby I, Millman M, et al. Physician impact on hospital admission and on mortality rates in the Medicare population. Health Serv Res 1996;31(2):191-211.
PQI Guide 19 Version 3.1 (March 12, 2007)
AHRQ Quality Indicators Web Site: http://www.qualityindicators.ahrq.gov
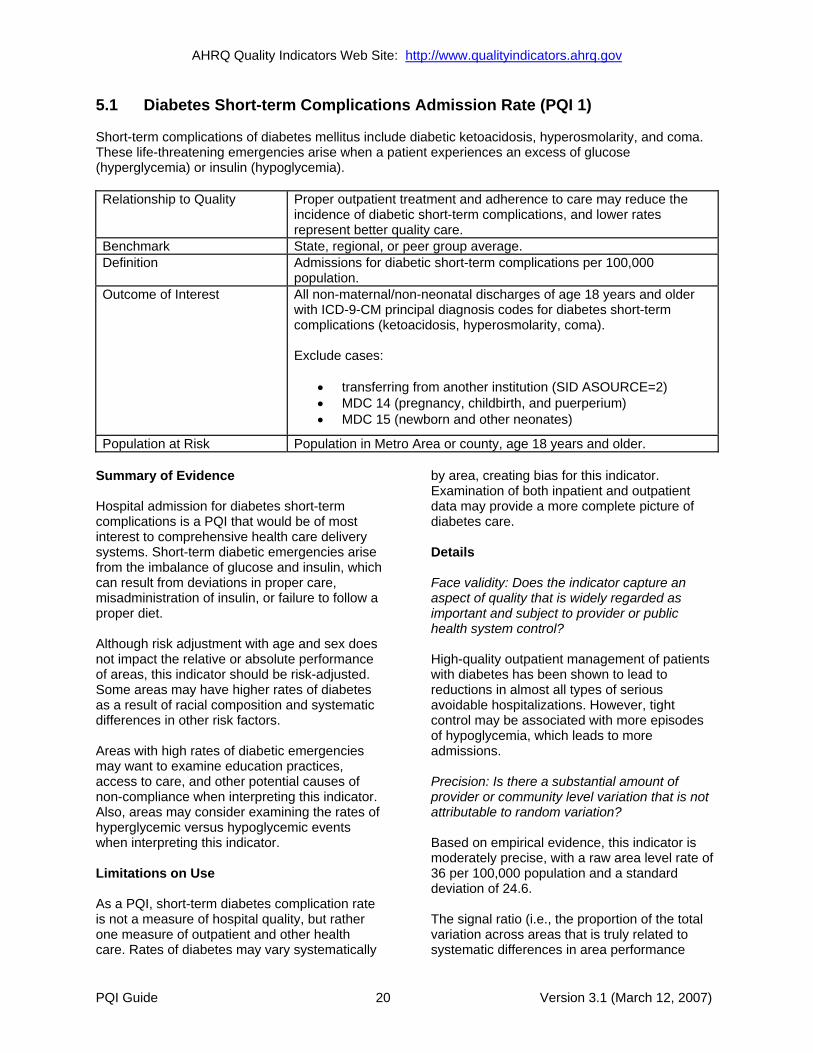
5.1 Diabetes Short-term Complications Admission Rate (PQI 1) Short-term complications of diabetes mellitus include diabetic ketoacidosis, hyperosmolarity, and coma. These life-threatening emergencies arise when a patient experiences an excess of glucose (hyperglycemia) or insulin (hypoglycemia). Relationship to Quality Proper outpatient treatment and adherence to care may reduce the
incidence of diabetic short-term complications, and lower rates represent better quality care.
Benchmark State, regional, or peer group average. Definition Admissions for diabetic short-term complications per 100,000
population. Outcome of Interest All non-maternal/non-neonatal discharges of age 18 years and older
with ICD-9-CM principal diagnosis codes for diabetes short-term complications (ketoacidosis, hyperosmolarity, coma). Exclude cases:
• transferring from another institution (SID ASOURCE=2) • MDC 14 (pregnancy, childbirth, and puerperium) • MDC 15 (newborn and other neonates)
Population at Risk Population in Metro Area or county, age 18 years and older. Summary of Evidence Hospital admission for diabetes short-term complications is a PQI that would be of most interest to comprehensive health care delivery systems. Short-term diabetic emergencies arise from the imbalance of glucose and insulin, which can result from deviations in proper care, misadministration of insulin, or failure to follow a proper diet. Although risk adjustment with age and sex does not impact the relative or absolute performance of areas, this indicator should be risk-adjusted. Some areas may have higher rates of diabetes as a result of racial composition and systematic differences in other risk factors. Areas with high rates of diabetic emergencies may want to examine education practices, access to care, and other potential causes of non-compliance when interpreting this indicator. Also, areas may consider examining the rates of hyperglycemic versus hypoglycemic events when interpreting this indicator. Limitations on Use As a PQI, short-term diabetes complication rate is not a measure of hospital quality, but rather one measure of outpatient and other health care. Rates of diabetes may vary systematically
by area, creating bias for this indicator. Examination of both inpatient and outpatient data may provide a more complete picture of diabetes care. Details Face validity: Does the indicator capture an aspect of quality that is widely regarded as important and subject to provider or public health system control? High-quality outpatient management of patients with diabetes has been shown to lead to reductions in almost all types of serious avoidable hospitalizations. However, tight control may be associated with more episodes of hypoglycemia, which leads to more admissions. Precision: Is there a substantial amount of provider or community level variation that is not attributable to random variation? Based on empirical evidence, this indicator is moderately precise, with a raw area level rate of 36 per 100,000 population and a standard deviation of 24.6. The signal ratio (i.e., the proportion of the total variation across areas that is truly related to systematic differences in area performance
PQI Guide 20 Version 3.1 (March 12, 2007)
AHRQ Quality Indicators Web Site: http://www.qualityindicators.ahrq.gov
rather than random variation) is moderate, at 51.7%, indicating that some of the observed differences in age-sex adjusted rates do not represent true differences in area performance. Using multivariate signal extraction techniques appears to have little additional impact on estimating true differences across areas.
admission for diabetic ketoacidosis and coma than privately insured patients.36
Fosters true quality improvement: Is the indicator insulated from perverse incentives for providers to improve their reported performance by avoiding difficult or complex cases, or by other responses that do not improve quality of care?
Minimum bias: Is there either little effect on the indicator of variations in patient disease severity and comorbidities, or is it possible to apply risk adjustment and statistical methods to remove most or all bias?
Because diabetic emergencies are potentially life-threatening, hospitals are unlikely to fail to admit patients requiring hospitalization.
Minorities have higher rates of diabetes, and higher hospitalization rates may result in areas with higher minority concentrations. Empirical results show that area rankings and absolute performance are not affected by age-sex risk adjustment.
Prior use: Has the measure been used effectively in practice? Does it have potential for working well with other indicators? Admission for diabetic emergencies was included in both Billings’37 and Weissman’s38 sets of avoidable hospitalization measures. This indicator, defined as a provider-level indicator, was an original HCUP QI.
Construct validity: Does the indicator perform well in identifying true (or actual) quality-of-care problems? Studies of precipitating events of admission for diabetic emergencies often rely on self-report, which may be a biased measurement in and of itself. The results of one study showed that over 60% of patients with known and treated diabetes had made an error in insulin administration or had omitted insulin.33 In a potentially under-served population of urban African-Americans, two-thirds of admissions were due to cessation of insulin therapy—over half of the time for financial or other difficulties obtaining insulin.34
Bindman reported that an area’s self-rated access to care report explained 46% of the variance in admissions for diabetes, although the analysis was not restricted to diabetic emergencies.35 Weissman found that uninsured patients had more than twice the risk of
33Bagg W, Sathu A, Streat S, et al. Diabetic ketoacidosis in adults at Auckland Hospital, 1988-1996. Aust N Z J Med 1998;28(5):604-8. 34Musey VC, Lee JK, Crawford R, et al. Diabetes in urban African-Americans. I. Cessation of insulin therapy is the major precipitating cause of diabetic ketoacidosis. Diabetes Care 1995;18(4):483-9.
36Weissman JS, Gatsonis C, Epstein AM. Rates of avoidable hospitalization by insurance status in Massachusetts and Maryland. JAMA 1992;268(17)2388-94. 37Billings J, Zeital L, Lukomnik J, et al. Analysis of variation in hospital admission rates associated with area income in New York City. Unpublished report.
35Bindman AB, Grumbach K, Osmond D, et al. Preventable hospitalizations and access to health care. JAMA 1995;274(4):305-11. 38Weissman, et al., 1992.
PQI Guide 21 Version 3.1 (March 12, 2007)

AHRQ Quality Indicators Web Site: http://www.qualityindicators.ahrq.gov
5.2 Perforated Appendix Admission Rate (PQI 2) Perforated appendix may occur when appropriate treatment for acute appendicitis is delayed for a number of reasons, including problems with access to care, failure by the patient to interpret symptoms as important, and misdiagnosis and other delays in obtaining surgery. Relationship to Quality Timely diagnosis and treatment may reduce the incidence of
perforated appendix, and lower rates represent better quality care. Benchmark State, regional, or peer group average. Definition Admissions for perforated appendix per 100 admissions for
appendicitis within Metro Area or county. Outcome of Interest Discharges with ICD-9-CM diagnosis code for perforation or abscess
of appendix in any field among cases meeting the inclusion criteria for the denominator (population at risk). Exclude cases:
• transferring from another institution (SID ASOURCE=2) • MDC 14 (pregnancy, childbirth, and puerperium) • MDC 15 (newborn and other neonates)
Population at Risk All non-maternal discharges of age 18 years and older within Metro Area or county with diagnosis code for appendicitis in any field.
Summary of Evidence Hospital admission for perforated appendix is a PQI that would be of most interest to comprehensive health care delivery systems. With prompt and appropriate care, acute appendicitis should not progress to perforation or rupture. Rates for perforated appendix are higher in the uninsured or underinsured in both adult and pediatric populations, which may be caused by patients failing to seek appropriate care, difficulty in accessing care, or misdiagnoses and poor quality care. Perforated appendix rates vary systematically by race, although the cause is unknown. Areas with high rates of perforated appendix may want to target points of intervention by using chart reviews and other supplemental data to investigate the reasons for delay in receiving surgery. Hospital contributions to the overall area rate may be particularly useful for this indicator, because misdiagnoses and other delays in receiving surgery in an emergency room may contribute substantially to the rate. Limitations on Use As a PQI, admission for perforated appendix is not a measure of hospital quality, but rather one measure of outpatient and other health care.
Details Face validity: Does the indicator capture an aspect of quality that is widely regarded as important and subject to provider or public health system control? Perforated appendix results from delay in surgery, potentially reflecting problems in access to ambulatory care, misdiagnosis, and other delays in obtaining surgery. Precision: Is there a substantial amount of provider or community level variation that is not attributable to random variation? Perforated appendix occurs in one-fourth to one-third of hospitalized acute appendicitis patients.39 Based on empirical evidence, this indicator is precise, with a raw area level rate of 33.3% and a substantial standard deviation of 14.4%. Relative to other indicators, a higher percentage of the variation occurs at the area level rather than the discharge level. However, the signal ratio (i.e., the proportion of the total variation across areas that is truly related to systematic
39Braveman P, Schaaf VM, Egerter S, et al. Insurance-related differences in the risk of ruptured appendix [see comments]. N Engl J Med 1994;331(7):444-9.
PQI Guide 22 Version 3.1 (March 12, 2007)
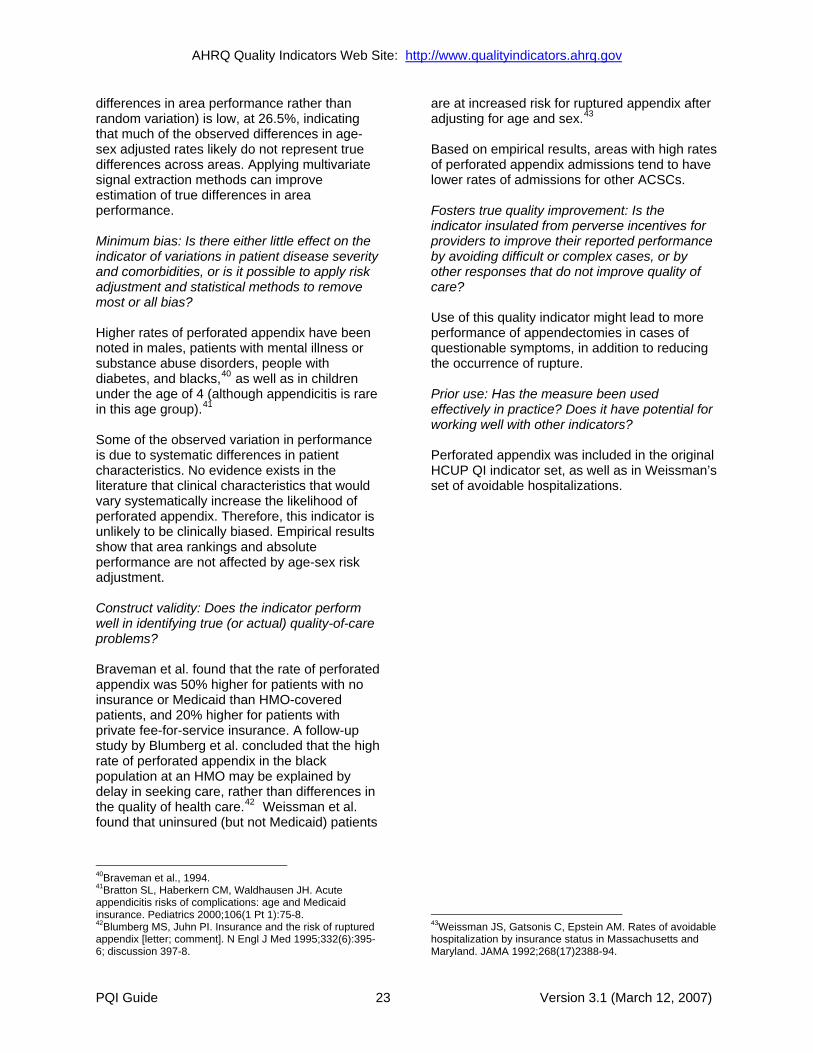
AHRQ Quality Indicators Web Site: http://www.qualityindicators.ahrq.gov
differences in area performance rather than random variation) is low, at 26.5%, indicating that much of the observed differences in age-sex adjusted rates likely do not represent true differences across areas. Applying multivariate signal extraction methods can improve estimation of true differences in area performance.
are at increased risk for ruptured appendix after adjusting for age and sex.43
Based on empirical results, areas with high rates of perforated appendix admissions tend to have lower rates of admissions for other ACSCs. Fosters true quality improvement: Is the indicator insulated from perverse incentives for providers to improve their reported performance by avoiding difficult or complex cases, or by other responses that do not improve quality of care?
Minimum bias: Is there either little effect on the indicator of variations in patient disease severity and comorbidities, or is it possible to apply risk adjustment and statistical methods to remove most or all bias? Use of this quality indicator might lead to more
performance of appendectomies in cases of questionable symptoms, in addition to reducing the occurrence of rupture.
Higher rates of perforated appendix have been noted in males, patients with mental illness or substance abuse disorders, people with diabetes, and blacks,40 as well as in children under the age of 4 (although appendicitis is rare in this age group).41
Prior use: Has the measure been used effectively in practice? Does it have potential for working well with other indicators? Some of the observed variation in performance
is due to systematic differences in patient characteristics. No evidence exists in the literature that clinical characteristics that would vary systematically increase the likelihood of perforated appendix. Therefore, this indicator is unlikely to be clinically biased. Empirical results show that area rankings and absolute performance are not affected by age-sex risk adjustment.
Perforated appendix was included in the original HCUP QI indicator set, as well as in Weissman’s set of avoidable hospitalizations.
Construct validity: Does the indicator perform well in identifying true (or actual) quality-of-care problems? Braveman et al. found that the rate of perforated appendix was 50% higher for patients with no insurance or Medicaid than HMO-covered patients, and 20% higher for patients with private fee-for-service insurance. A follow-up study by Blumberg et al. concluded that the high rate of perforated appendix in the black population at an HMO may be explained by delay in seeking care, rather than differences in the quality of health care.42 Weissman et al. found that uninsured (but not Medicaid) patients
40Braveman et al., 1994. 41Bratton SL, Haberkern CM, Waldhausen JH. Acute appendicitis risks of complications: age and Medicaid insurance. Pediatrics 2000;106(1 Pt 1):75-8. 42Blumberg MS, Juhn PI. Insurance and the risk of ruptured appendix [letter; comment]. N Engl J Med 1995;332(6):395-6; discussion 397-8.
43Weissman JS, Gatsonis C, Epstein AM. Rates of avoidable hospitalization by insurance status in Massachusetts and Maryland. JAMA 1992;268(17)2388-94.
PQI Guide 23 Version 3.1 (March 12, 2007)
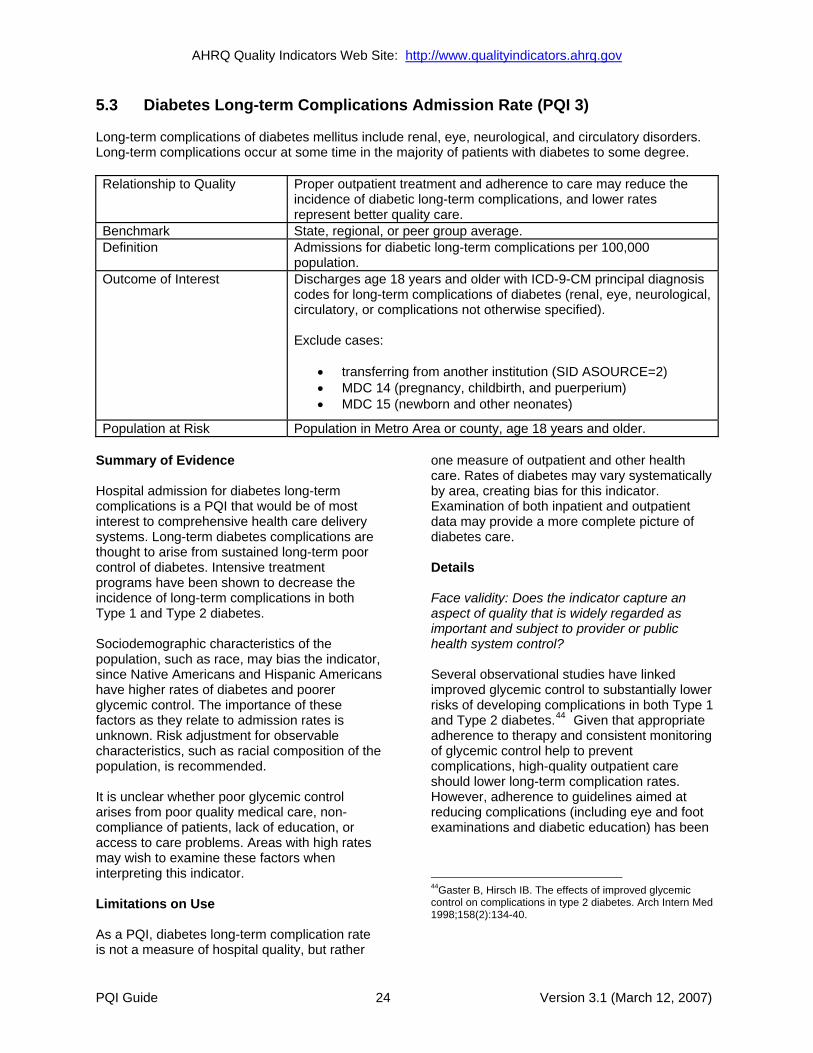
AHRQ Quality Indicators Web Site: http://www.qualityindicators.ahrq.gov
5.3 Diabetes Long-term Complications Admission Rate (PQI 3) Long-term complications of diabetes mellitus include renal, eye, neurological, and circulatory disorders. Long-term complications occur at some time in the majority of patients with diabetes to some degree. Relationship to Quality Proper outpatient treatment and adherence to care may reduce the
incidence of diabetic long-term complications, and lower rates represent better quality care.
Benchmark State, regional, or peer group average. Definition Admissions for diabetic long-term complications per 100,000
population. Outcome of Interest Discharges age 18 years and older with ICD-9-CM principal diagnosis
codes for long-term complications of diabetes (renal, eye, neurological, circulatory, or complications not otherwise specified). Exclude cases:
• transferring from another institution (SID ASOURCE=2) • MDC 14 (pregnancy, childbirth, and puerperium) • MDC 15 (newborn and other neonates)
Population at Risk Population in Metro Area or county, age 18 years and older. Summary of Evidence Hospital admission for diabetes long-term complications is a PQI that would be of most interest to comprehensive health care delivery systems. Long-term diabetes complications are thought to arise from sustained long-term poor control of diabetes. Intensive treatment programs have been shown to decrease the incidence of long-term complications in both Type 1 and Type 2 diabetes. Sociodemographic characteristics of the population, such as race, may bias the indicator, since Native Americans and Hispanic Americans have higher rates of diabetes and poorer glycemic control. The importance of these factors as they relate to admission rates is unknown. Risk adjustment for observable characteristics, such as racial composition of the population, is recommended. It is unclear whether poor glycemic control arises from poor quality medical care, non-compliance of patients, lack of education, or access to care problems. Areas with high rates may wish to examine these factors when interpreting this indicator. Limitations on Use As a PQI, diabetes long-term complication rate is not a measure of hospital quality, but rather
one measure of outpatient and other health care. Rates of diabetes may vary systematically by area, creating bias for this indicator. Examination of both inpatient and outpatient data may provide a more complete picture of diabetes care. Details Face validity: Does the indicator capture an aspect of quality that is widely regarded as important and subject to provider or public health system control? Several observational studies have linked improved glycemic control to substantially lower risks of developing complications in both Type 1 and Type 2 diabetes.44 Given that appropriate adherence to therapy and consistent monitoring of glycemic control help to prevent complications, high-quality outpatient care should lower long-term complication rates. However, adherence to guidelines aimed at reducing complications (including eye and foot examinations and diabetic education) has been
44Gaster B, Hirsch IB. The effects of improved glycemic control on complications in type 2 diabetes. Arch Intern Med 1998;158(2):134-40.
PQI Guide 24 Version 3.1 (March 12, 2007)
AHRQ Quality Indicators Web Site: http://www.qualityindicators.ahrq.gov
described as modest,45 with only one-third of patients receiving all essential services.46
Precision: Is there a substantial amount of provider or community level variation that is not attributable to random variation? Diabetes affects a large number of people, as do diabetic complications. However, few studies have documented hospitalization rates for diabetic complications and the extent to which they vary across areas. Based on empirical evidence, this indicator is moderately precise, with a raw area level rate of 80.8 per 100,000 population and a standard deviation of 58.1. The signal ratio (i.e., the proportion of the total variation across areas that is truly related to systematic differences in area performance rather than random variation) is high, at 75.6%, indicating that the observed differences in age-sex adjusted rates likely represent true differences across areas. Minimum bias: Is there either little effect on the indicator of variations in patient disease severity and comorbidities, or is it possible to apply risk adjustment and statistical methods to remove most or all bias? Rates of diabetes are higher in black, Hispanic, and especially Native American populations than in other ethnic groups. Hyperglycemia appears to be particularly frequent among Hispanic and Native American populations.47 The duration of diabetes is positively associated with the development of complications. Empirical results show that area rankings and absolute performance are moderately affected by age-sex risk adjustment. Construct validity: Does the indicator perform well in identifying true (or actual) quality-of-care problems? Compliance of physicians and patients is essential to achieve good outcomes, and it seems likely that problems with both access to and quality of care, as well as patient
45Zoorob RJ, Hagen MD. Guidelines on the care of diabetic nephropathy, retinopathy and foot disease. Am Fam Physician 1997;56(8):2021-8, 2033-4. 46Hiss RG. Barriers to care in non-insulin-dependent diabetes mellitus. The Michigan Experience. Ann Intern Med 1996;124(1 Pt 2):146-8. 47Harris MI. Diabetes in America: epidemiology and scope of the problem. Diabetes Care 1998;21 Suppl 3:C11-4.
compliance, may contribute to the occurrence of complications. Based on empirical results, areas with high rates of diabetes long-term complications also tend to have high rates of admission for other ACSCs. Fosters true quality improvement: Is the indicator insulated from perverse incentives for providers to improve their reported performance by avoiding difficult or complex cases, or by other responses that do not improve quality of care? Providers may decrease admission rates by failing to hospitalize patients who would truly benefit from inpatient care. No published evidence indicates that worse health outcomes are associated with reduced hospitalization rates for long-term complications of diabetes. Prior use: Has the measure been used effectively in practice? Does it have potential for working well with other indicators? This indicator, defined as a hospital-level indicator, is an original HCUP QI.
PQI Guide 25 Version 3.1 (March 12, 2007)
AHRQ Quality Indicators Web Site: http://www.qualityindicators.ahrq.gov
5.4 Chronic Obstructive Pulmonary Disease Admission Rate (PQI 5) Chronic obstructive pulmonary disease (COPD) comprises three primary diseases that cause respiratory dysfunction—asthma, emphysema, and chronic bronchitis—each with distinct etiologies, treatments, and outcomes. This indicator examines emphysema and bronchitis; asthma is discussed separately for children and adults. Relationship to Quality Proper outpatient treatment may reduce admissions for COPD, and
lower rates represent better quality care. Benchmark State, regional, or peer group average. Definition Admissions for COPD per 100,000 population. Outcome of Interest All non-maternal discharges of age 18 years and older with ICD-9-CM
principal diagnosis codes for COPD. Exclude cases:
• transferring from another institution (SID ASOURCE=2) • MDC 14 (pregnancy, childbirth, and puerperium) • MDC 15 (newborn and other neonates)
Population at Risk Population in Metro Area or county, age 18 years and older. Summary of Evidence Hospital admission for COPD is a PQI that would be of most interest to comprehensive health care delivery systems. COPD can often be controlled in an outpatient setting. Areas may wish to use chart reviews to understand more clearly whether admissions are a result of poor quality care or other problems. This indicator is measured with high precision, and the observed variance likely reflects true differences across areas. Risk adjustment for age and sex appears to most affect the areas with the highest rates. Several factors that are likely to vary by area may influence the progression of the disease, including smoking and socioeconomic status. Risk adjustment for observable characteristics is recommended. Areas may wish to identify hospitals that contribute the most to the overall area rate for this indicator. The patient populations served by these hospitals may be a starting point for interventions. Limitations on Use As a PQI, COPD is not a measure of hospital quality, but rather one measure of outpatient and other health care. This indicator has unclear construct validity, because it has not been validated except as part of a set of indicators. Providers may reduce admission rates without
actually improving quality by shifting care to an outpatient setting. Some COPD care takes place in emergency rooms, so combining inpatient and emergency room data may give a more accurate picture. Details Face validity: Does the indicator capture an aspect of quality that is widely regarded as important and subject to provider or public health system control? Admissions for COPD include exacerbations of COPD, respiratory failure, and (rarely) lung volume reduction surgery or lung transplantation. Practice guidelines for COPD have been developed and published over the last decade.48 With appropriate outpatient treatment and compliance, hospitalizations for the exacerbations of COPD and decline in lung function should be minimized. Precision: Is there a substantial amount of provider or community level variation that is not attributable to random variation? COPD accounts for a substantial number of hospital admissions, suggesting that the
48Hackner D, Tu G, Weingarten S, et al. Guidelines in pulmonary medicine: a 25-year profile. Chest 1999;116(4):1046-62.
PQI Guide 26 Version 3.1 (March 12, 2007)
AHRQ Quality Indicators Web Site: http://www.qualityindicators.ahrq.gov
indicator is reasonably precise.49 Based on empirical evidence, this indicator is very precise, with a raw area level rate of 324.0 per 100,000 population and a standard deviation of 203.8. The signal ratio (i.e., the proportion of the total variation across areas that is truly related to systematic differences in area performance rather than random variation) is very high, at 93.4%, indicating that the differences in age-sex adjusted rates likely represent true differences across areas. Minimal bias: Is there either little effect on the indicator of variations in patient disease severity and comorbidities, or is it possible to apply risk adjustment and statistical methods to remove most or all bias? Factors that have been associated with increased admissions for COPD include disease severity, smoking status, age, and socioeconomic status, which are candidates for risk adjustment. Empirical results show that area rankings and absolute performance are somewhat affected by age-sex risk adjustment. Construct validity: Does the indicator perform well in identifying true (or actual) quality-of-care problems? Bindman et al. reported that self-reported access to care explained 27% of the variation in COPD hospitalization rates at the ZIP code cluster level.50 Millman et al. found that low-income ZIP codes had 5.8 times more COPD hospitalizations per capita than high-income ZIP codes.51 Physician adherence to practice guidelines and patient compliance also influence the effectiveness of therapy. Based on empirical results, areas with high rates of COPD admissions also tend to have high rates of admissions for other ACSCs. Fosters true quality improvement: Is the indicator insulated from perverse incentives for providers to improve their reported performance
49Feinleib M, Rosenberg HM, Collins JG, et al. Trends in COPD morbidity and mortality in the United States. Am Rev Respir Dis 1989;140(3 pt 2):S9-18. 50Bindman AB, Grumbach K, Osmond D, et al. Preventable hospitalizations and access to health care. JAMA 1995;274(4)305-11. 51Millman M, editor. Committee on Monitoring Access to Personal Health Care Services. Washington, DC: National Academy Press; 1993.
by avoiding difficult or complex cases, or by other responses that do not improve quality of care? One study found that higher rates of COPD admission may in part reflect improvements in access to care, which results in more detection of significant respiratory impairment in the community.52 A decline in COPD admission rates may simply reflect a reverse change in coding practices. Prior use: Has the measure been used effectively in practice? Does it have potential for working well with other indicators? This indicator was originally developed by Billings et al. in conjunction with the United Hospital Fund of New York.53 It was subsequently adopted by the Institute of Medicine and has been widely used in studies of avoidable hospitalizations.
52Weinberger M, Oddone EZ, Henderson WG. Does increased access to primary care reduce hospital readmissions? VA Cooperative Study Group on Primary Care and Hospital readmission. N Engl J Med 1996;334(22):1441-7. 53Billings J, Zeital L, Lukomnik J, et al. Analysis of variation in hospital admission rates associated with area income in New York City. Unpublished report.
PQI Guide 27 Version 3.1 (March 12, 2007)
AHRQ Quality Indicators Web Site: http://www.qualityindicators.ahrq.gov
5.5 Hypertension Admission Rate (PQI 7) Hypertension is a chronic condition that is often controllable in an outpatient setting with appropriate use of drug therapy. Relationship to Quality Proper outpatient treatment may reduce admissions for hypertension,
and lower rates represent better quality care. Benchmark State, regional, or peer group average. Definition Admissions for hypertension per 100,000 population. Outcome of Interest All non-maternal discharges of age 18 years and older with ICD-9-CM
principal diagnosis codes for hypertension. Exclude cases:
• transferring from another institution (SID ASOURCE=2) • MDC 14 (pregnancy, childbirth, and puerperium) • MDC 15 (newborn and other neonates) • with cardiac procedure codes in any field
Population at Risk Population in Metro Area or county, age 18 years and older. Summary of Evidence Hospital admission for hypertension is a PQI that would be of most interest to comprehensive health care delivery systems. Little evidence exists regarding the validity of this indicator, although one study did relate admission rates to access to care problems. This indicator is measured with adequate precision, but some of the variance in age-sex adjusted rates does not reflect true differences in area performance. Adjustment for age-sex is recommended. Areas may wish to identify hospitals that contribute the most to the overall area rate for this indicator. The patient populations served by these hospitals may be a starting point for interventions. Limitations on Use As a PQI, hypertension is not a measure of hospital quality, but rather one measure of outpatient and other health care. Providers may reduce admission rates without actually improving quality by shifting care to an outpatient setting. Details Face validity: Does the indicator capture an aspect of quality that is widely regarded as important and subject to provider or public health system control?
Hypertension is often controllable in an outpatient setting with appropriate use of drug therapy. Precision: Is there a substantial amount of provider or community level variation that is not attributable to random variation? Although hypertension is a common condition, hospitalizations for complications of hypertension are relatively uncommon. One study noted that hypertension accounted for only 0.5% of total admissions for ACSCs.54
Based on empirical evidence, this indicator is moderately precise, with a raw area level rate of 37.1 per 100,000 population and a substantial standard deviation of 32.2. The signal ratio (i.e., the proportion of the total variation across areas that is truly related to systematic differences in area performance rather than random variation) is moderate, at 69.9%, indicating that some of the observed differences in age-sex adjusted rates likely do not represent true differences in area performance. Minimum bias: Is there either little effect on the indicator of variations in patient disease severity and comorbidities, or is it possible to apply risk adjustment and statistical methods to remove most or all bias?
54Blustein J. Hanson K, Shea S. Preventable hospitalizations and socioeconomic status. Health Aff (Millwood) 1998;17(2):177-89.
PQI Guide 28 Version 3.1 (March 12, 2007)
AHRQ Quality Indicators Web Site: http://www.qualityindicators.ahrq.gov
Little evidence exists on potential biases for this indicator. The age structure of the population may possibly affect admission rates for this condition. Weissman et al. reported a reduction of 100% in relative risk for Medicaid patients when adjusting for age and sex.55 No evidence was found on the effects of comorbidities such as obesity or other risk factors that may vary systematically by area on admission rates for hypertension complications in the area. Empirical results show that age-sex adjustment affects the ranking of those areas in the highest decile. Construct validity: Does the indicator perform well in identifying true (or actual) quality-of-care problems? Bindman et al. found that an area’s self-rated access to care explained 22% of admissions for hypertension.56 Weissman et al. found that uninsured patients had a relative risk of admission for hypertension of 2.38 in Massachusetts after adjustment for age and sex, while Maryland had a corresponding relative risk of 1.93.57 Millman et al. reported that low-income ZIP codes had 7.6 times more hypertension hospitalizations per capita than high-income ZIP codes.58
Fosters true quality improvement: Is the indicator insulated from perverse incentives for providers to improve their reported performance by avoiding difficult or complex cases, or by other responses that do not improve quality of care? Little evidence exists on the impact of this quality improvement measure on the delivery of outpatient care for hypertension. There is no published evidence of worse health outcomes in association with reduced hospitalization rates for hypertension. Such an effect seems implausible, given that only the most serious episodes of accelerated or malignant hypertension are treated on an inpatient basis.
55Weissman JS, Gatsonis C, Epstein AM. Rates of avoidable hospitalization by insurance status in Massachusetts and Maryland. JAMA 1992;268(1):2388-94. 56Bindman AB, Grumback K, Osmond D, et al. Preventable hospitalizations and access to health care. JAMA 1995;274(4):305-11. 57Weissman, et al. 1992. 58Millman M, editor. Committee on Monitoring Access to Personal Health Care Services. Washington, DC: National Academy Press; 1993.
Prior use: Has the indicator been used effectively in practice? Does it have potential for working well with other indicators? This indicator was included originally developed by Billings et al. in conjunction with the United Hospital Fund of New York.59 It was subsequently adopted by the Institute of Medicine and has been widely used in a variety of studies of avoidable or preventable hospitalizations.60 This indicator was also included in Weissman’s set of avoidable hospitalizations.
59Billings J, Zeitel L, Lukomnik J, et al. Impact of socioeconomic status on hospital use in New York City. Health Aff (Millwood) 1993;12(1):162-73. 60Access to Health Care in America. Washington, DC: National Academy Press; 1993.
PQI Guide 29 Version 3.1 (March 12, 2007)

AHRQ Quality Indicators Web Site: http://www.qualityindicators.ahrq.gov
5.6 Congestive Heart Failure Admission Rate (PQI 8) Congestive heart failure (CHF) can be controlled in an outpatient setting for the most part; however, the disease is a chronic progressive disorder for which some hospitalizations are appropriate. Relationship to Quality Proper outpatient treatment may reduce admissions for CHF, and
lower rates represent better quality care. Benchmark State, regional, or peer group average. Definition Admissions for CHF per 100,000 population. Outcome of Interest All non-maternal/non-neonatal discharges of age 18 years and older
with ICD-9-CM principal diagnosis codes for CHF. Exclude cases:
• transferring from another institution (SID ASOURCE=2) • MDC 14 (pregnancy, childbirth, and puerperium) • MDC 15 (newborn and other neonates) • with cardiac procedure codes in any field
Population at Risk Population in Metro Area or county, age 18 years and older. Summary of Evidence Congestive heart failure is a PQI that would be of most interest to comprehensive health care delivery systems. This indicator is measured with high precision, and most of the observed variance reflects true differences across areas. Risk adjustment for age and sex appears to affect the areas with the highest and lowest raw rates. Areas with high rates may wish to examine the clinical characteristics of their patients to check for a more complex case mix. Patient age, clinical measures such as heart function, and other management issues may affect admission rates. As the causes for admissions may include poor quality care, lack of patient compliance, or problems accessing care, areas may wish to review CHF patient records to identify precipitating causes and potential targets for intervention. Limitations on Use As a PQI, CHF is not a measure of hospital quality, but rather one measure of outpatient and other health care. Providers may reduce admission rates without actually improving quality by shifting care to an outpatient setting. Some CHF care takes place in emergency rooms. As such, combining inpatient and
emergency room data may give a more accurate picture of this indicator. Details Face validity: Does the indicator capture an aspect of quality that is widely regarded as important and subject to provider or public health system control? Physician management of patients with congestive heart failure differs significantly by physician specialty.61 62 Such differences in community practices may be reflected in differences in CHF admission rates. Precision: Is there a substantial amount of provider or community level variation that is not attributable to random variation? Relatively precise estimates of admission rates for CHF can be obtained, although random variation may be important for small hospitals and rural areas. Based on empirical evidence, this indicator is very precise, with a raw area level rate of 521.0 per 100,000 population and a standard deviation of 286.5.
61Edep ME, Shah NB, Tateo IM, et al. Differences between primary care physicians and cardiologists in management of congestive heart failure: relation to practice guidelines. J Am Coll Cardiol 1997;30(2):518-26. 62Reis, SE, Holubkov R, Edmundowicz D, et al. Treatment of patients admitted to the hospital with congestive heart failure: specialty-related disparities in practice patterns and outcomes. J Am Coll Cardiol 1997;30(3):733-8.
PQI Guide 30 Version 3.1 (March 12, 2007)

AHRQ Quality Indicators Web Site: http://www.qualityindicators.ahrq.gov
The signal ratio (i.e., the proportion of the total variation across areas that is truly related to systematic differences in area performance rather than random variation) is very high, at 93.0%, indicating that the observed differences in age-sex adjusted rates very likely represent true differences across areas. Minimum bias: Is there either little effect on the indicator of variations in patient disease severity and comorbidities, or is it possible to apply risk adjustment and statistical methods to remove most or all bias? Important determinants of outcomes with CHF include certain demographic variables, such as patient age; clinical measures; management issues; and treatment strategies.63 Limited evidence exists on the extent to which these factors can explain area differences in CHF admission rates. Empirical results show that area rankings and absolute performance are somewhat affected by age-sex risk adjustment. Construct validity: Does the indicator perform well in identifying true (or actual) quality-of-care problems? Billings et al. found that low-income ZIP codes in New York City had 4.6 times more CHF hospitalizations per capita than high-income ZIP codes.64 Millman et al. reported that low-income ZIP codes had 6.1 times more CHF hospitalizations per capita than high-income ZIP codes.65
Based on empirical results, areas with high rates of CHF also tend to have high rates of admission for other ACSCs. Fosters true quality improvement: Is the indicator insulated from perverse incentives for providers to improve their reported performance by avoiding difficult or complex cases, or by other responses that do not improve quality of care?
63Philbin EF, Andreaou C, Rocco TA, et al. Patterns of angiotensin-converting enzyme inhibitor use in congestive heart failure in two community hospitals. Am J Cardio. 1996;77(1):832-8. 64Billings J, Zeital L, Lukomnik J, et al. Analysis of variation in hospital admission rates associated with area income in New York City. Unpublished report. 65Millman M, editor. Committee on Monitoring Access to Personal Health Care Services. Washington DC: National Academy Press.
Outpatient interventions such as the use of protocols for ambulatory management of low-severity patients and improvement of access to outpatient care would most likely decrease inpatient admissions for CHF.66
Prior use: Has the measure been used effectively in practice? Does it have potential for working well with other indicators? This indicator was originally developed by Billings et al. in conjunction with the United Hospital Fund of New York. It was subsequently adopted by the Institute of Medicine and has been widely used in a variety of studies of avoidable hospitalizations.
66Rosenthal GE, Harper DL, Shah A, et al. A regional evaluation of variation in low-severity hospital admissions. J Gen Intern Med 1997;12(7):416-22.
PQI Guide 31 Version 3.1 (March 12, 2007)
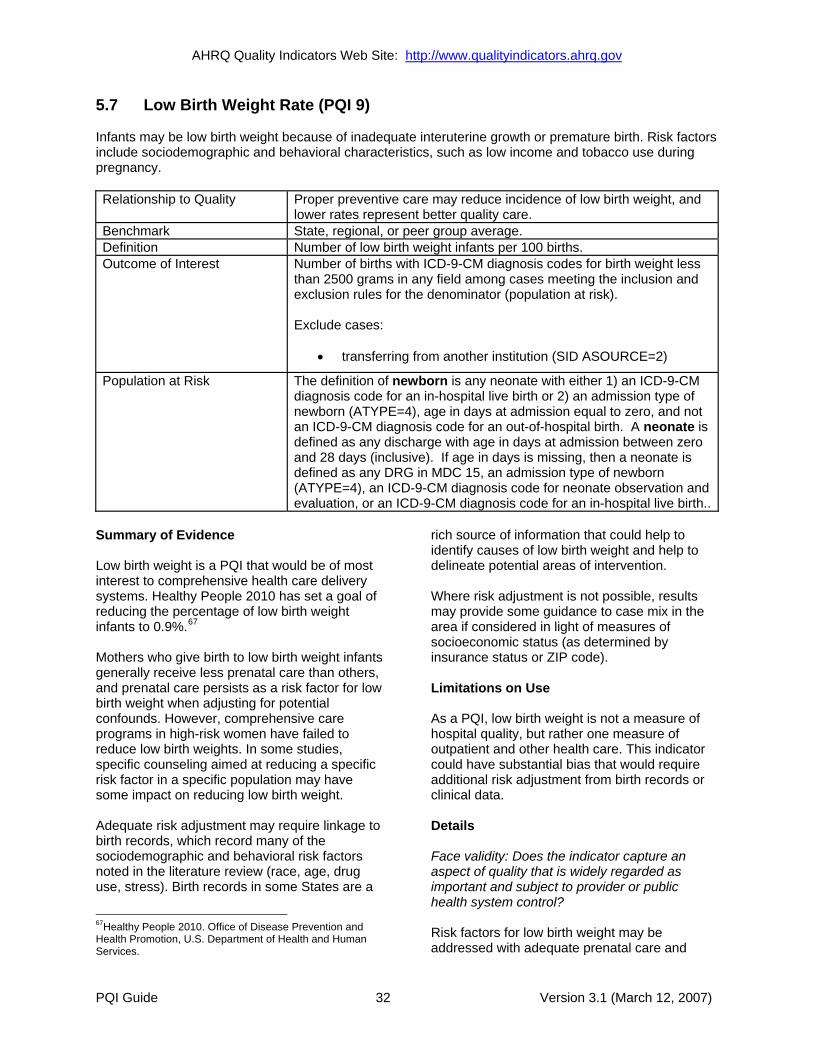
AHRQ Quality Indicators Web Site: http://www.qualityindicators.ahrq.gov
5.7 Low Birth Weight Rate (PQI 9) Infants may be low birth weight because of inadequate interuterine growth or premature birth. Risk factors include sociodemographic and behavioral characteristics, such as low income and tobacco use during pregnancy. Relationship to Quality Proper preventive care may reduce incidence of low birth weight, and
lower rates represent better quality care. Benchmark State, regional, or peer group average. Definition Number of low birth weight infants per 100 births. Outcome of Interest Number of births with ICD-9-CM diagnosis codes for birth weight less
than 2500 grams in any field among cases meeting the inclusion and exclusion rules for the denominator (population at risk). Exclude cases:
• transferring from another institution (SID ASOURCE=2)
Population at Risk The definition of newborn is any neonate with either 1) an ICD-9-CM diagnosis code for an in-hospital live birth or 2) an admission type of newborn (ATYPE=4), age in days at admission equal to zero, and not an ICD-9-CM diagnosis code for an out-of-hospital birth. A neonate is defined as any discharge with age in days at admission between zero and 28 days (inclusive). If age in days is missing, then a neonate is defined as any DRG in MDC 15, an admission type of newborn (ATYPE=4), an ICD-9-CM diagnosis code for neonate observation and evaluation, or an ICD-9-CM diagnosis code for an in-hospital live birth..
Summary of Evidence Low birth weight is a PQI that would be of most interest to comprehensive health care delivery systems. Healthy People 2010 has set a goal of reducing the percentage of low birth weight infants to 0.9%.67
Mothers who give birth to low birth weight infants generally receive less prenatal care than others, and prenatal care persists as a risk factor for low birth weight when adjusting for potential confounds. However, comprehensive care programs in high-risk women have failed to reduce low birth weights. In some studies, specific counseling aimed at reducing a specific risk factor in a specific population may have some impact on reducing low birth weight. Adequate risk adjustment may require linkage to birth records, which record many of the sociodemographic and behavioral risk factors noted in the literature review (race, age, drug use, stress). Birth records in some States are a
67Healthy People 2010. Office of Disease Prevention and Health Promotion, U.S. Department of Health and Human Services.
rich source of information that could help to identify causes of low birth weight and help to delineate potential areas of intervention. Where risk adjustment is not possible, results may provide some guidance to case mix in the area if considered in light of measures of socioeconomic status (as determined by insurance status or ZIP code). Limitations on Use As a PQI, low birth weight is not a measure of hospital quality, but rather one measure of outpatient and other health care. This indicator could have substantial bias that would require additional risk adjustment from birth records or clinical data. Details Face validity: Does the indicator capture an aspect of quality that is widely regarded as important and subject to provider or public health system control? Risk factors for low birth weight may be addressed with adequate prenatal care and
PQI Guide 32 Version 3.1 (March 12, 2007)
AHRQ Quality Indicators Web Site: http://www.qualityindicators.ahrq.gov
education. Prenatal education and care programs have been established to help reduce low birth weight and other complications in high-risk populations. Precision: Is there a substantial amount of provider or community level variation that is not attributable to random variation? Although low birth weight births account for only a small fraction of total births, the large number of births suggest that this indicator should be precisely measurable for most areas. Based on empirical evidence, this indicator is precise, with a raw area level rate of 3.9% and a standard deviation of 2.3%. The signal ratio (i.e., the proportion of the total variation across areas that is truly related to systematic differences in area performance rather than random variation) is moderate, at 67.1%, indicating that some of the observed differences in age-sex adjusted rates do not represent true differences in area performance. Minimum bias: Is there either little effect on the indicator of variations in patient disease severity and comorbidities, or is it possible to apply risk adjustment and statistical methods to remove most or all bias? Socioeconomic measures such as parental education and income have been shown to be negatively associated with rates of low birth weight infants.68 69 Demographic factors such as age and race also appear important, and may be correlated with socioeconomic factors. Mothers under 17 years and over 35 years are at a higher risk of having low birth weight infants.70 71 One study of all California singleton births in 1992 found that after risk adjustment, having a black mother remained a significant risk factor.72 Little evidence exists on the extent to which each of these factors contributes to differences in the rate of low birth weight births across geographic areas.
68Hessol NA, Fuentes-Afflick E, Bacchetti P. Risk of low birth weight infants among black and white parents. Obstet Gynecol 1998;92(5):814-22. 69O’Campo P, Xue X, Wang MC, et al. Neighborhood risk factors for low birthweight in Baltimore: a multilevel analysis. Am J Public Health 1997;87(7):1113-8. 70Hessol, et al. 1998. 71O’Campo, et al. 1997. 72Hessol, et al. 1998.
Construct validity: Does the indicator perform well in identifying true (or actual) quality-of-care problems? While specific studies have demonstrated an impact of particular interventions, especially in high-risk populations, evidence on the impact of better prenatal care on low birth weight rates for area populations is less well developed. In one study, the use of prenatal care accounted for less than 15% of the differences between low birth weight in black and white mothers enrolled in an HMO. However, increasing the level of prenatal care was associated with lower rates of low birth weight, particularly in the black patient population.73
Low birth weight is inversely related to the other ACSCs and is positively related to perforated appendix rate. Empirical evidence suggests that this indicator at an area level could be potentially biased. Fosters true quality improvement: Is the indicator insulated from perverse incentives for providers to improve their reported performance by avoiding difficult or complex cases, or by other responses that do not improve quality of care? Use of this indicator is unlikely to lead to apparent reductions in the rate of low birth weight births that did not represent true reductions. Prior use: Has the measure been used effectively in practice? Does it have potential for working well with other indicators? Low birth weight is an indicator in the Health Plan Employer Data and Information Set (HEDIS) measure set for insurance groups and is used by United Health Care and the University Hospital Consortium. This indicator, along with very low birth weight, was previously an HCUP QI.
73Murray JL, Bernfield M. The differential effect of prenatal care on the incidence of low birth weight among blacks and whites in a prepaid health care plan. N Engl J Med 1988;319(21):1385-91.
PQI Guide 33 Version 3.1 (March 12, 2007)
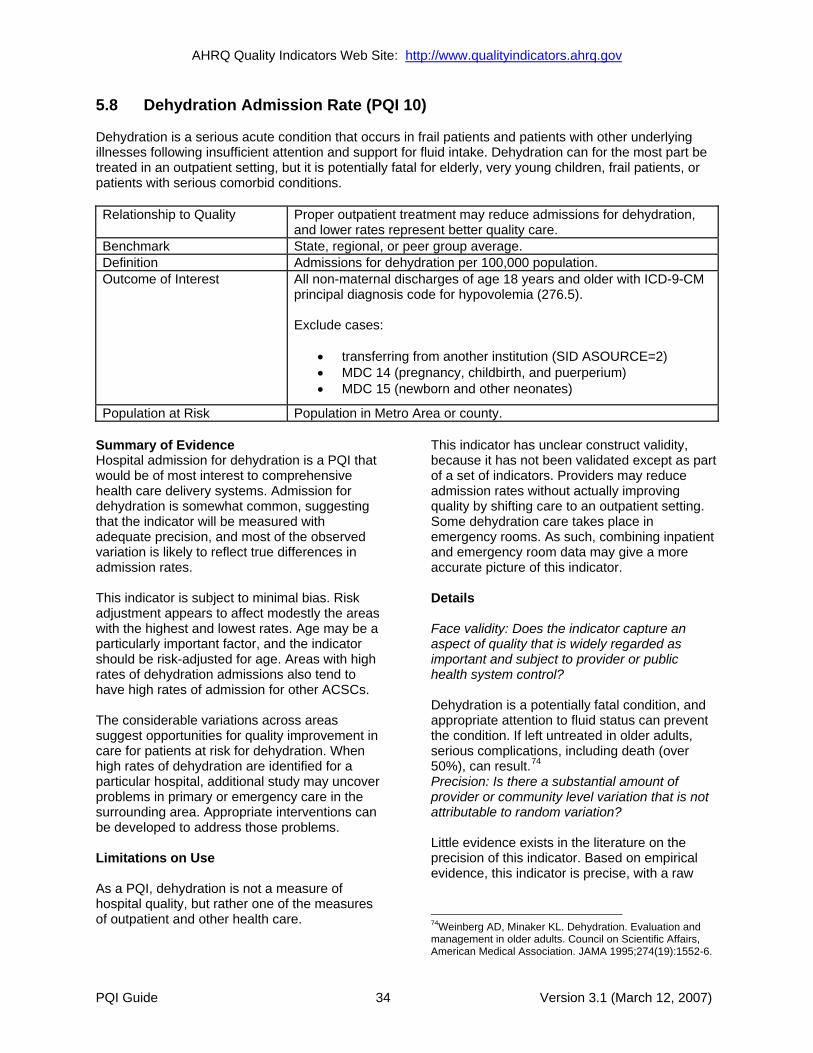
AHRQ Quality Indicators Web Site: http://www.qualityindicators.ahrq.gov
5.8 Dehydration Admission Rate (PQI 10) Dehydration is a serious acute condition that occurs in frail patients and patients with other underlying illnesses following insufficient attention and support for fluid intake. Dehydration can for the most part be treated in an outpatient setting, but it is potentially fatal for elderly, very young children, frail patients, or patients with serious comorbid conditions. Relationship to Quality Proper outpatient treatment may reduce admissions for dehydration,
and lower rates represent better quality care. Benchmark State, regional, or peer group average. Definition Admissions for dehydration per 100,000 population. Outcome of Interest All non-maternal discharges of age 18 years and older with ICD-9-CM
principal diagnosis code for hypovolemia (276.5). Exclude cases:
• transferring from another institution (SID ASOURCE=2) • MDC 14 (pregnancy, childbirth, and puerperium) • MDC 15 (newborn and other neonates)
Population at Risk Population in Metro Area or county. Summary of Evidence Hospital admission for dehydration is a PQI that would be of most interest to comprehensive health care delivery systems. Admission for dehydration is somewhat common, suggesting that the indicator will be measured with adequate precision, and most of the observed variation is likely to reflect true differences in admission rates. This indicator is subject to minimal bias. Risk adjustment appears to affect modestly the areas with the highest and lowest rates. Age may be a particularly important factor, and the indicator should be risk-adjusted for age. Areas with high rates of dehydration admissions also tend to have high rates of admission for other ACSCs. The considerable variations across areas suggest opportunities for quality improvement in care for patients at risk for dehydration. When high rates of dehydration are identified for a particular hospital, additional study may uncover problems in primary or emergency care in the surrounding area. Appropriate interventions can be developed to address those problems. Limitations on Use As a PQI, dehydration is not a measure of hospital quality, but rather one of the measures of outpatient and other health care.
This indicator has unclear construct validity, because it has not been validated except as part of a set of indicators. Providers may reduce admission rates without actually improving quality by shifting care to an outpatient setting. Some dehydration care takes place in emergency rooms. As such, combining inpatient and emergency room data may give a more accurate picture of this indicator. Details Face validity: Does the indicator capture an aspect of quality that is widely regarded as important and subject to provider or public health system control? Dehydration is a potentially fatal condition, and appropriate attention to fluid status can prevent the condition. If left untreated in older adults, serious complications, including death (over 50%), can result.74
Precision: Is there a substantial amount of provider or community level variation that is not attributable to random variation? Little evidence exists in the literature on the precision of this indicator. Based on empirical evidence, this indicator is precise, with a raw
74Weinberg AD, Minaker KL. Dehydration. Evaluation and management in older adults. Council on Scientific Affairs, American Medical Association. JAMA 1995;274(19):1552-6.
PQI Guide 34 Version 3.1 (March 12, 2007)

AHRQ Quality Indicators Web Site: http://www.qualityindicators.ahrq.gov
area level rate of 139.9 per 100,000 population and a standard deviation of 103.2. The signal ratio (i.e., the proportion of the total variation across areas that is truly related to systematic differences in area performance rather than random variation) is high, at 88.5%, indicating that the observed differences in age-sex adjusted rates likely represent true differences across areas. Minimum bias: Is there either little effect on the indicator of variations in patient disease severity and comorbidities, or is it possible to apply risk adjustment and statistical methods to remove most or all bias? The age structure of the population may affect admission rates for this condition, as the elderly and very young are more susceptible to dehydration. Socioeconomic factors may also affect admission rates. Differences in thresholds for admission of patients with dehydration may contribute to area rate differences. Empirical results show that area rankings are not affected by age-sex risk adjustment. Construct validity: Does the indicator perform well in identifying true (or actual) quality-of-care problems? Billings et al. found that low-income ZIP codes in New York City had 2 times more dehydration hospitalizations per capita than high-income ZIP codes.75 Household income explained 42% of this variation. In addition, Millman et al.76 reported that low-income ZIP codes had 2 times more dehydration hospitalizations per capita than high-income ZIP codes. Based on empirical results of this study, areas with high rates of dehydration admissions also tend to have high rates of admission for other ACSCs. Fosters true quality improvement: Is the indicator insulated from perverse incentives for providers to improve their reported performance by avoiding difficult or complex cases, or by
75Billings J, Zeital L, Lukomnik J, et al. Analysis of variation in hospital admission rates associated with area income in New York City. Unpublished report. 76Millman M, editor. Committee on Monitoring Access to Personal Health Care Services. Washington, DC: National Academy Press. 1993.
other responses that do not improve quality of care? Use of this indicator might lead to higher thresholds of admission for patients with dehydration, potentially denying needed care to some patients. Because some dehydration can be managed on an outpatient basis, a shift to outpatient care may occur. Prior use: Has the measure been used effectively in practice? Does it have potential for working well with other indicators? This indicator was originally developed by Billings et al. in conjunction with the United Hospital Fund of New York.
PQI Guide 35 Version 3.1 (March 12, 2007)

AHRQ Quality Indicators Web Site: http://www.qualityindicators.ahrq.gov
5.9 Bacterial Pneumonia Admission Rate (PQI 11) Bacterial pneumonia is a relatively common acute condition, treatable for the most part with antibiotics. If left untreated in susceptible individuals—such as the elderly—pneumonia can lead to death. Relationship to Quality Proper outpatient treatment may reduce admissions for bacterial
pneumonia in non-susceptible individuals, and lower rates represent better quality care.
Benchmark State, regional, or peer group average. Definition Admissions for bacterial pneumonia per 100,000 population. Outcome of Interest All non-maternal discharges of age 18 years and older with ICD-9-CM
principal diagnosis code for bacterial pneumonia. Exclude cases:
• transferring from another institution (SID ASOURCE=2) • MDC 14 (pregnancy, childbirth, and puerperium) • MDC 15 (newborn and other neonates) • With diagnosis code for sickle cell anemia or HB-S disease
Population at Risk Population in Metro Area or county. Summary of Evidence Hospital admission for bacterial pneumonia is a PQI that would be of most interest to comprehensive health care delivery systems. High admission rates may reflect a large number of inappropriate admissions or low-quality treatment with antibiotics. Admission for pneumonia is relatively common, suggesting that the indicator will be measured with good precision, and most of the observed variation reflects true differences in admission rates. This indicator is subject to some moderate bias, and risk adjustment appears to affect the areas with the highest rates the most. Age may be a particularly important factor, and the indicator should be risk-adjusted for this factor. Areas may wish to examine the outpatient care for pneumonia and pneumococcal vaccination rates to identify potential processes of care that may reduce admission rates. The patient populations served by hospitals that contribute the most to the overall area rate for pneumonia may be a starting point for interventions. Limitations on Use As a PQI, admission for bacterial pneumonia is not a measure of hospital quality, but rather one measure of outpatient and other health care. This indicator has unclear construct validity, because it has not been validated except as part
of a set of indicators. Providers may reduce admission rates without actually improving quality by shifting care to an outpatient setting. Because some pneumonia care takes place in an emergency room setting, combining inpatient and emergency room data may give a more accurate picture of this indicator. Details Face validity: Does the indicator capture an aspect of quality that is widely regarded as important and subject to provider or public health system control? Vaccination for pneumococcal pneumonia in the elderly and early management of bacterial respiratory infections on an ambulatory basis may reduce admissions with pneumonia. A vaccine developed for the elderly has been shown to be 45% effective in preventing hospitalizations during peak seasons.77 Precision: Is there a substantial amount of provider or community level variation that is not attributable to random variation? Little evidence exists in the literature on the precision or variation in pneumonia admission
77Foster DA, Talsma A, Furumoto-Dawson A, et al. Influenza vaccine effectiveness in preventing hospitalization for pneumonia in the elderly. Am J Epidemiol 1992;136(3):296-307.
PQI Guide 36 Version 3.1 (March 12, 2007)
AHRQ Quality Indicators Web Site: http://www.qualityindicators.ahrq.gov
rates. Based on empirical evidence, this indicator is precise, with a raw area level rate of 395.6 per 100,000 population and a standard deviation of 208.5. The signal ratio (i.e., the proportion of the total variation across areas that is truly related to systematic differences in area performance rather than random variation) is very high, at 92.9%, indicating that the observed differences in age-sex adjusted rates likely represent true differences across areas. Using multivariate signal extraction techniques appears to have little additional impact on estimating true differences across areas. Minimum bias: Is there either little effect on the indicator of variations in patient disease severity and comorbidities, or is it possible to apply risk adjustment and statistical methods to remove most or all bias? A review of the literature suggests that comorbidities or other risk factors that may vary systematically by area do not significantly affect the incidence of hospitalization for pneumonia. Differences in thresholds for admission of patients with bacterial pneumonia may contribute to area rate differences. Empirical results show that area rankings and absolute performance are somewhat affected by age-sex risk adjustment. Construct validity: Does the indicator perform well in identifying true (or actual) quality-of-care problems? Billings et al. found that low-income ZIP codes in New York City had 5.4 times more pneumonia admissions per capita than high-income ZIP codes.78 Household income explained 53% of this variation. In addition, Millman et al.79 reported that low-income ZIP codes had 5.4 times more pneumonia hospitalizations per capita than high-income ZIP codes. Based on empirical results, areas with high rates of bacterial pneumonia admissions also tend to have high rates of admissions for other ACSCs.
78Billings J, Zeital L, Lukomnik J, et al. Analysis of variation in hospital admission rates associated with area income in New York City. Unpublished report. 79Millman M, editor. Committee on Monitoring Access to Personal Health Care Services. Washington, DC: National Academy Press. 1993.
Fosters true quality improvement: Is the indicator insulated from perverse incentives for providers to improve their reported performance by avoiding difficult or complex cases, or by other responses that do not improve quality of care? Use of this indicator might lead to higher thresholds of admission for pneumonia patients. Because pneumonia can be managed on an outpatient basis, a shift to outpatient care may occur, which might be inappropriate for more severely ill patients. Prior use: Has the measure been used effectively in practice? Does it have potential for working well with other indicators? This indicator was included in Weissman’s set of avoidable hospitalizations.80
80Weissman JS, Gatsonis C, Epstein AM. Rates of avoidable hospitalization by insurance status in Massachusetts and Maryland JAMA 1992;268(17)2388-94.
PQI Guide 37 Version 3.1 (March 12, 2007)
AHRQ Quality Indicators Web Site: http://www.qualityindicators.ahrq.gov
5.10 Urinary Tract Infection Admission Rate (PQI 12) Urinary tract infection is a common acute condition that can, for the most part, be treated with antibiotics in an outpatient setting. However, this condition can progress to more clinically significant infections, such as pyelonephritis, in vulnerable individuals with inadequate treatment. Relationship to Quality Proper outpatient treatment may reduce admissions for urinary
infection, and lower rates represent better quality care. Benchmark State, regional, or peer group average. Definition Admissions for urinary tract infection per 100,000 population. Outcome of Interest All non-maternal discharges of age 18 years and older with ICD-9-CM
principal diagnosis code for urinary tract infection. Exclude cases:
• transferring from another institution (SID ASOURCE=2) • MDC 14 (pregnancy, childbirth, and puerperium) • MDC 15 (newborn and other neonates) • with diagnosis code of kidney/urinary tract disorder • with diagnosis code of immunocompromised state • with immunocompromised state procedure code
Population at Risk Population in Metro Area or county. Summary of Evidence Hospital admission for urinary tract infection is a PQI that would be of most interest to comprehensive health care delivery systems. Admission for urinary tract infection is uncommon, but the observed variation is likely to reflect true differences across areas. Risk adjustment appears to affect the areas with the highest rates the most, and using this indicator without risk adjustment may result in the misidentification of some areas as outliers. This indicator is subject to some moderate bias and should be adjusted for age and sex. The patient populations served by hospitals that contribute the most to the overall area rate for urinary tract infection may be a starting point for interventions. Limitations on Use As a PQI, admission for urinary tract infection is not a measure of hospital quality, but rather one measure of outpatient and other health care. This indicator has unclear construct validity, because it has not been validated except as part of a set of indicators. Providers may reduce admission rates without actually improving quality by shifting care to an outpatient setting. Some urinary tract infection care takes place in
emergency rooms. As such, combining inpatient and emergency room data may give a more accurate picture of this indicator. Details Face validity: Does the indicator capture an aspect of quality that is widely regarded as important and subject to provider or public health system control? Uncomplicated urinary tract infections can be treated with antibiotics in the ambulatory setting; however, inappropriate treatment can lead to more serious complications. Admission for urinary tract infection among children, which is rare, is associated with physiological abnormalities. Precision: Is there a substantial amount of provider or community level variation that is not attributable to random variation? Little evidence exists in the literature on the precision and variation associated with this indicator. Based on empirical evidence, this indicator is precise, with a raw area level rate of 145.1 per 100,000 population and a standard deviation of 89.5. The signal ratio (i.e., the proportion of the total variation across areas that is truly related to systematic differences in area
PQI Guide 38 Version 3.1 (March 12, 2007)
AHRQ Quality Indicators Web Site: http://www.qualityindicators.ahrq.gov
performance rather than random variation) is high, at 84.9%, indicating that the observed differences in age-sex adjusted rates likely represent true differences across areas. Using multivariate signal extraction techniques appears to have little additional impact on estimating true differences across areas. Minimum bias: Is there either little effect on the indicator of variations in patient disease severity and comorbidities, or is it possible to apply risk adjustment and statistical methods to remove most or all bias? Differences in thresholds for admission of patients with urinary tract infection may contribute to area rate differences. Empirical results show that area rankings and absolute performance are somewhat affected by age-sex risk adjustment. Construct validity: Does the indicator perform well in identifying true (or actual) quality-of-care problems? Billings et al. found that low-income ZIP codes in New York City had 2.2 times more urinary tract infection admissions than high-income ZIP codes.81 Household income explained 28% of this variation. In addition, Millman et al.82 reported that low-income ZIP codes had 2.8 times more urinary tract infection hospitalizations per capita than high-income ZIP codes. Based on empirical results, areas with high admission rates for urinary tract infections also tend to have high admission rates for other ACSCs. Fosters true quality improvement: Is the indicator insulated from perverse incentives for providers to improve their reported performance by avoiding difficult or complex cases, or by other responses that do not improve quality of care? Use of this indicator might lead to higher thresholds of admission for patients with urinary tract infections.
81Billings J, Zeital L, Lukomnik J, et al. Analysis of variation in hospital admission rates associated with area income in New York City. Unpublished report. 82Millman M, editor. Committee on Monitoring Access to Personal Health Care Services. Washington, DC: National Academy Press. 1993.
Prior use: Has the measure been used effectively in practice? Does it have potential for working well with other indicators? This indicator was originally developed by Billings et al. in conjunction with the United Hospital Fund of New York. It is included in Weissman’s set of avoidable hospitalizations.83
83Weissman JS, Gatsonis C, Epstein AM. Rates of avoidable hospitalization by insurance status in Massachusetts and Maryland. JAMA 1992;268(17)2388-94.
PQI Guide 39 Version 3.1 (March 12, 2007)

AHRQ Quality Indicators Web Site: http://www.qualityindicators.ahrq.gov
5.11 Angina without Procedure Admission Rate (PQI 13) Both stable and unstable angina are symptoms of potential coronary artery disease. Effective management of coronary disease reduces the occurrence of major cardiac events such as heart attacks, and may also reduce admission rates for angina. Relationship to Quality Proper outpatient treatment may reduce admissions for angina
(without procedures), and lower rates represent better quality care. Benchmark State, regional, or peer group average. Definition Admissions for angina (without procedures) per 100,000 population. Outcome of Interest All non-maternal discharges of age 18 years and older with ICD-9-CM
principal diagnosis codes for angina. Exclude cases:
• transferring from another institution (SID ASOURCE=2) • MDC 14 (pregnancy, childbirth, and puerperium) • MDC 15 (newborn and other neonates) • with a code for cardiac procedure in any field
Population at Risk Population in Metro Area or county, age 18 years and older. Summary of Evidence Hospital admission for angina is a PQI that would be of most interest to comprehensive health care delivery systems. Admission for angina is relatively common, suggesting that the indicator will be measured with good precision. The observed variation likely reflects true differences in area performance. Age-sex adjustment has a moderate impact. Other risk factors for consideration include smoking, hyperlipidemia, hypertension, diabetes, and socioeconomic status. The patient populations served by hospitals that contribute the most to the overall area rate for angina may be a starting point for interventions. Limitations on Use As a PQI, angina without procedure is not a measure of hospital quality, but rather one measure of outpatient and other health care. This indicator has unclear construct validity, because it has not been validated except as part of a set of indicators. Providers may reduce admission rates without actually improving quality of care by shifting care to an outpatient setting. Some angina care takes place in emergency rooms. Combining inpatient and emergency room data may give a more accurate picture.
Details Face validity: Does the indicator capture an aspect of quality that is widely regarded as important and subject to provider or public health system control? Stable angina can be managed in an outpatient setting using drugs such as aspirin and beta blockers, as well as advice to change diet and exercise habits.84 Effective treatments for coronary artery disease reduce admissions for serious complications of ischemic heart disease, including unstable angina. Precision: Is there a substantial amount of provider or community level variation that is not attributable to random variation? Reasonably precise estimates of area angina rates should be feasible, as one study shows that unstable angina accounts for 16.3% of total admissions for ACSCs.85 Based on empirical evidence, this indicator is adequately precise, 84Gibbons RJ, Chatterjee K, Daley J, et al. ACC/AHA/ACP-ASIM guidelines for the management of patients with chronic stable angina: a report of the American College of Cardiology/American Heart Association Task force on Practice Guidelines (Committee on Management of Patients with Chronic Stable Angina) [published erratum appears in J Am Coll Cardiol 1999 Jul;34(1):314]. J Am Coll Cardiol 1999;33(7):2092-197. 85Blustein J, Hanson K, Shea S. Preventable hospitalizations and socioeconomic status. Health Aff (Millwood) 1998;17(2):177-89.
PQI Guide 40 Version 3.1 (March 12, 2007)

AHRQ Quality Indicators Web Site: http://www.qualityindicators.ahrq.gov
with a raw area level rate of 166.0 per 100,000 population and a standard deviation of 135.7. The signal ratio (i.e., the proportion of the total variation across areas that is truly related to systematic differences in area performance rather than random variation) is very high, at 91.6%, indicating that the observed differences in age-sex adjusted rates likely represent true differences across areas. Using multivariate signal extraction techniques appears to have little additional impact on estimating true differences across areas. Minimum bias: Is there either little effect on the indicator of variations in patient disease severity and comorbidities, or is it possible to apply risk adjustment and statistical methods to remove most or all bias? No evidence exists in the literature on the potential bias of this indicator. The incidence of angina is related to age structure and risk factors (smoking, hyperlipidemia, hypertension, diabetes) in a population. Elderly age (over 70), diabetes, and hypertension have also been associated with being at higher risk for angina.86
Construct validity: Does the indicator perform well in identifying true (or actual) quality-of-care problems? Billings et al. found that low-income ZIP codes in New York City had 2.3 times more angina hospitalizations than high-income ZIP codes.87 Household income explained 13% of this variation. In addition, Millman et al.88 reported that low-income ZIP codes had 2.7 times more angina hospitalizations per capita than high-income ZIP codes. Based on empirical study, areas with high rates of angina admissions tend to have higher rates of other ACSC admissions.
86Brunwald E, Antman EM, Beasley JW et al. ACC/AHA guidelines for the management of patients with unstable angina and non-ST-segment elevation myocardial infarction. A report of the American College of Cardiology/American Heart Association Task Force on Practice Guidelines (Committee on the Management of Patients with Unstable Angina). J Am Coll Cardiol 2000;36(3):970-1062. 87Billings J, Zeital L, Lukomnik J, et al. Analysis of variation in hospital admission rates associated with area income in New York City. Unpublished report. 88Millman M, editor. Committee on Monitoring Access to Personal Health Care Services. Washington, DC: National Academy Press. 1993.
Fosters true quality improvement: Is the indicator insulated from perverse incentives for providers to improve their reported performance by avoiding difficult or complex cases, or by other responses that do not improve quality of care? Use of this quality indicator might raise the threshold for admission of angina patients. Because some angina can be managed on an outpatient basis, a shift to outpatient care may occur but is unlikely for severe angina. Prior use: Has the measure been used effectively in practice? Does it have potential for working well with other indicators? This indicator was originally developed by Billings et al. in conjunction with the United Hospital Fund of New York.
PQI Guide 41 Version 3.1 (March 12, 2007)
AHRQ Quality Indicators Web Site: http://www.qualityindicators.ahrq.gov
5.12 Uncontrolled Diabetes Admission Rate (PQI 14) Uncontrolled diabetes should be used in conjunction with short-term complications of diabetes, which include diabetic ketoacidosis, hyperosmolarity, and coma.* Relationship to Quality Proper outpatient treatment and adherence to care may reduce the
incidence of uncontrolled diabetes, and lower rates represent better quality care.
Benchmark State, regional, or peer group average. Definition Admissions for uncontrolled diabetes per 100,000 population. Outcome of Interest All non-maternal discharges of age 18 years and older with ICD-9-CM
principal diagnosis codes for uncontrolled diabetes, without mention of a short-term or long-term complication. Exclude cases:
• transferring from another institution (SID ASOURCE=2) • MDC 14 (pregnancy, childbirth, and puerperium) • MDC 15 (newborn and other neonates)
Population at Risk Population in Metro Area or county, age 18 years and older. * This indicator is designed to be combined with “Short Term Diabetes Complication Admission Rate” to create the Healthy People 2010 indicator. To do so, users may simply add the rates of the two indicators together. Summary of Evidence Hospital admission for uncontrolled diabetes is a PQI that would be of most interest to comprehensive health care delivery systems. Healthy People 2010 has established a goal to reduce the hospitalization rate for uncontrolled diabetes in persons 18-64 years of age from 7.2 per 10,000 population to 5.4 per 10,000 population.89 Combining this indicator with the short-term diabetes indicator will result in the Healthy People 2010 measure, except that this QI excludes transfers from another institution to reduce double counting of cases. As a result the rate for the AHRQ QI may be minimally lower than the Healthy People 2010 indicator. This indicator is moderately precise. The observed differences across areas likely reflect true differences in area performance. Age-sex adjustment slightly changes area rankings. Limitations on Use As a PQI, uncontrolled diabetes is not a measure of hospital quality, but rather one measure of outpatient and other health care.
89Healthy People 2010, Office of Disease Prevention and Health Promotion. U.S. Department of Health and Human Services.
Rates of diabetes may vary systematically by area, creating bias for this indicator. Details Face validity: Does the indicator capture an aspect of quality that is widely regarded as important and subject to provider or public health system control? High-quality outpatient management of diabetic patients has been shown to lead to reductions in almost all types of serious avoidable hospitalizations. However, tight control may be associated with more episodes of hypoglycemia that lead to more admissions. Precision: Is there a substantial amount of provider or community level variation that is not attributable to random variation? Based on empirical evidence, this indicator is moderately precise, with a raw area level rate of 34.7 per 100,000 population and a standard deviation of 28.1. The signal ratio (i.e., the proportion of the total variation across areas that is truly related to systematic differences in area performance rather than random variation) is high, at 72.6%, indicating that the observed differences in age-
PQI Guide 42 Version 3.1 (March 12, 2007)
AHRQ Quality Indicators Web Site: http://www.qualityindicators.ahrq.gov
sex adjusted rates likely represent true differences in area performance. Using multivariate signal extraction techniques appears to have little additional impact on estimating true differences across areas. Minimum bias: Is there either little effect on the indicator of variations in patient disease severity and comorbidities, or is it possible to apply risk adjustment and statistical methods to remove most or all bias? Minorities have higher rates of diabetes, and higher hospitalization rates may result in areas with higher minority concentrations. Empirical results show that area rankings in the highest and lowest deciles are slightly affected by age-sex adjustment. Construct validity: Does the indicator perform well in identifying true (or actual) quality-of-care problems? Based on empirical results, areas with high rates of uncontrolled diabetes also tend to have high rates of admission for other ACSCs. Fosters true quality improvement: Is the indicator insulated from perverse incentives for providers to improve their reported performance by avoiding difficult or complex cases, or by other responses that do not improve quality of care? Because diabetic emergencies are potentially life-threatening, hospitals are unlikely to fail to admit patients requiring hospitalization. Prior use: Has the measure been used effectively in practice? Does it have potential for working well with other indicators? This measure corresponds closely with the measure of short-term diabetes that was developed by Billings et al. and described in this document.90 The key exception is the ICD-9-CM codes 25002 and 25003, which are the only codes included for uncontrolled diabetes.
90Billings J, Zeital L, Lukomnik J, et al. Analysis of variation in hospital admission rates associated with area income in New York City. Unpublished report.
PQI Guide 43 Version 3.1 (March 12, 2007)
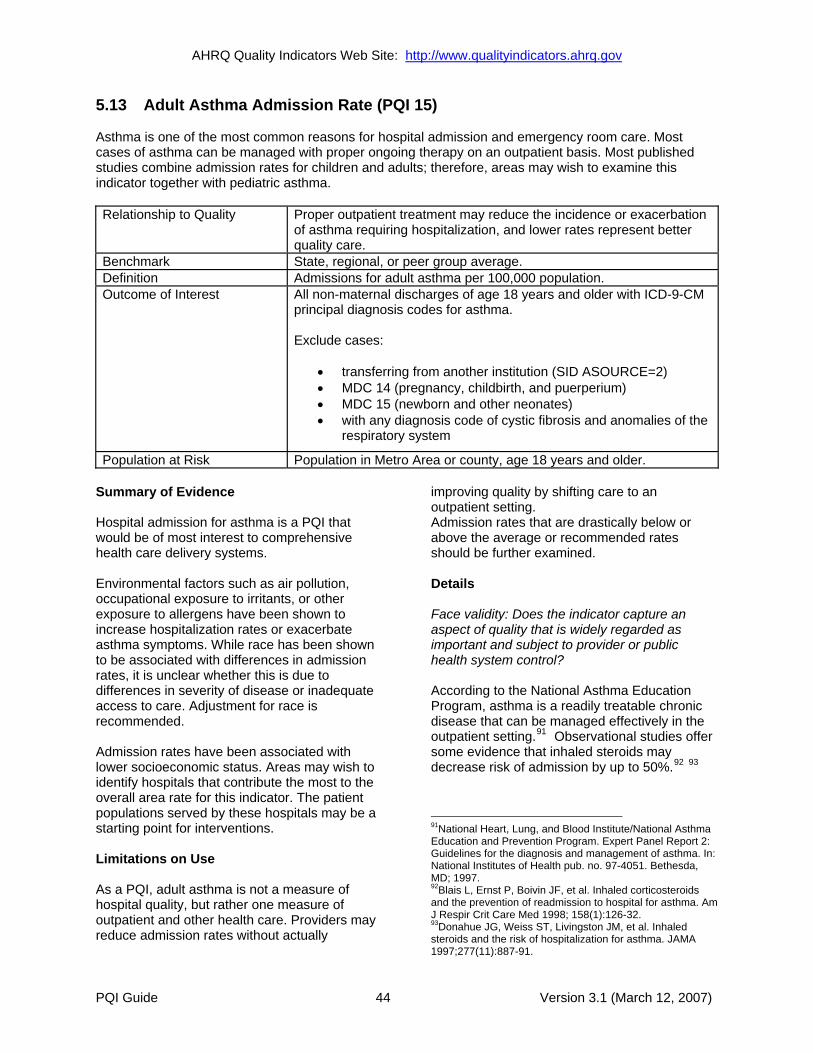
AHRQ Quality Indicators Web Site: http://www.qualityindicators.ahrq.gov
5.13 Adult Asthma Admission Rate (PQI 15) Asthma is one of the most common reasons for hospital admission and emergency room care. Most cases of asthma can be managed with proper ongoing therapy on an outpatient basis. Most published studies combine admission rates for children and adults; therefore, areas may wish to examine this indicator together with pediatric asthma. Relationship to Quality Proper outpatient treatment may reduce the incidence or exacerbation
of asthma requiring hospitalization, and lower rates represent better quality care.
Benchmark State, regional, or peer group average. Definition Admissions for adult asthma per 100,000 population. Outcome of Interest All non-maternal discharges of age 18 years and older with ICD-9-CM
principal diagnosis codes for asthma. Exclude cases:
• transferring from another institution (SID ASOURCE=2) • MDC 14 (pregnancy, childbirth, and puerperium) • MDC 15 (newborn and other neonates) • with any diagnosis code of cystic fibrosis and anomalies of the
respiratory system
Population at Risk Population in Metro Area or county, age 18 years and older. Summary of Evidence Hospital admission for asthma is a PQI that would be of most interest to comprehensive health care delivery systems. Environmental factors such as air pollution, occupational exposure to irritants, or other exposure to allergens have been shown to increase hospitalization rates or exacerbate asthma symptoms. While race has been shown to be associated with differences in admission rates, it is unclear whether this is due to differences in severity of disease or inadequate access to care. Adjustment for race is recommended. Admission rates have been associated with lower socioeconomic status. Areas may wish to identify hospitals that contribute the most to the overall area rate for this indicator. The patient populations served by these hospitals may be a starting point for interventions. Limitations on Use As a PQI, adult asthma is not a measure of hospital quality, but rather one measure of outpatient and other health care. Providers may reduce admission rates without actually
improving quality by shifting care to an outpatient setting. Admission rates that are drastically below or above the average or recommended rates should be further examined. Details Face validity: Does the indicator capture an aspect of quality that is widely regarded as important and subject to provider or public health system control? According to the National Asthma Education Program, asthma is a readily treatable chronic disease that can be managed effectively in the outpatient setting.91 Observational studies offer some evidence that inhaled steroids may decrease risk of admission by up to 50%.92 93
91National Heart, Lung, and Blood Institute/National Asthma Education and Prevention Program. Expert Panel Report 2: Guidelines for the diagnosis and management of asthma. In: National Institutes of Health pub. no. 97-4051. Bethesda, MD; 1997. 92Blais L, Ernst P, Boivin JF, et al. Inhaled corticosteroids and the prevention of readmission to hospital for asthma. Am J Respir Crit Care Med 1998; 158(1):126-32. 93Donahue JG, Weiss ST, Livingston JM, et al. Inhaled steroids and the risk of hospitalization for asthma. JAMA 1997;277(11):887-91.
PQI Guide 44 Version 3.1 (March 12, 2007)
AHRQ Quality Indicators Web Site: http://www.qualityindicators.ahrq.gov
Precision: Is there a substantial amount of provider or community level variation that is not attributable to random variation? Asthma is a common cause of admission for adults, and as such this measure is likely to have adequate precision. Based on empirical evidence, this indicator is adequately precise, with a raw area level rate of 107.9 per 100,000 population and a standard deviation of 81.7. The signal ratio (i.e., the proportion of the total variation across areas that is truly related to systematic differences in area performance rather than random variation) is high, at 83.6%, indicating that the observed differences in age-sex adjusted rates likely represent true differences across areas. Minimum bias: Is there either little effect on the indicator of variations in patient disease severity and comorbidities, or is it possible to apply risk adjustment and statistical methods to remove most or all bias? Numerous environmental risk factors for asthma have been identified, including allergens, tobacco smoke, and outdoor air pollution. Race represents one of the most complex potentially biasing factors for this indicator. Black patients have consistently been shown to have higher asthma admission rates, even when stratifying for income and age.94 Adjustment for race is recommended. Empirical results show that area rankings are not affected by age-sex risk adjustment. Construct validity: Does the indicator perform well in identifying true (or actual) quality-of-care problems? Billings et al. found that low-income ZIP codes in New York City had 6.4 times more asthma hospitalizations than high-income ZIP codes.95 Household income explained 70% of this variation. In addition, Millman et al.96 reported that low-income ZIP codes had 5.8 times more asthma hospitalizations per capita than high-income ZIP codes.
94Ray NF, Thamer M, Fadillioglu B, et al. Race, income, urbanicity, and asthma hospitalization in California: a small area analysis. Chest 1998;113(5):1277-84. 95Billings J, Zeital L, Lukomnik J, et al. Analysis of variation in hospital admission rates associated with area income in New York City. Unpublished report. 96Millman M, editor. Committee on Monitoring Access to Personal Health Care Services. Washington, DC: National Academy Press. 1993.
Fosters true quality improvement: Is the indicator insulated from perverse incentives for providers to improve their reported performance by avoiding difficult or complex cases, or by other responses that do not improve quality of care? There is little evidence to suggest that asthmatics are being inappropriately denied admission to the hospital. However, because some asthma can be managed on an outpatient basis, a shift to outpatient care may occur. Prior use: Has the measure been used effectively in practice? Does it have potential for working well with other indicators? This indicator was originally developed by Billings et al. in conjunction with the United Hospital Fund of New York, and is included in Weissman’s set of avoidable hospitalizations.97
97Weissman JS, Gatsonis C, Epstein AM. Rates of avoidable hospitalization by insurance status in Massachusetts and Maryland. JAMA 1992;268(17)2388-94.
PQI Guide 45 Version 3.1 (March 12, 2007)
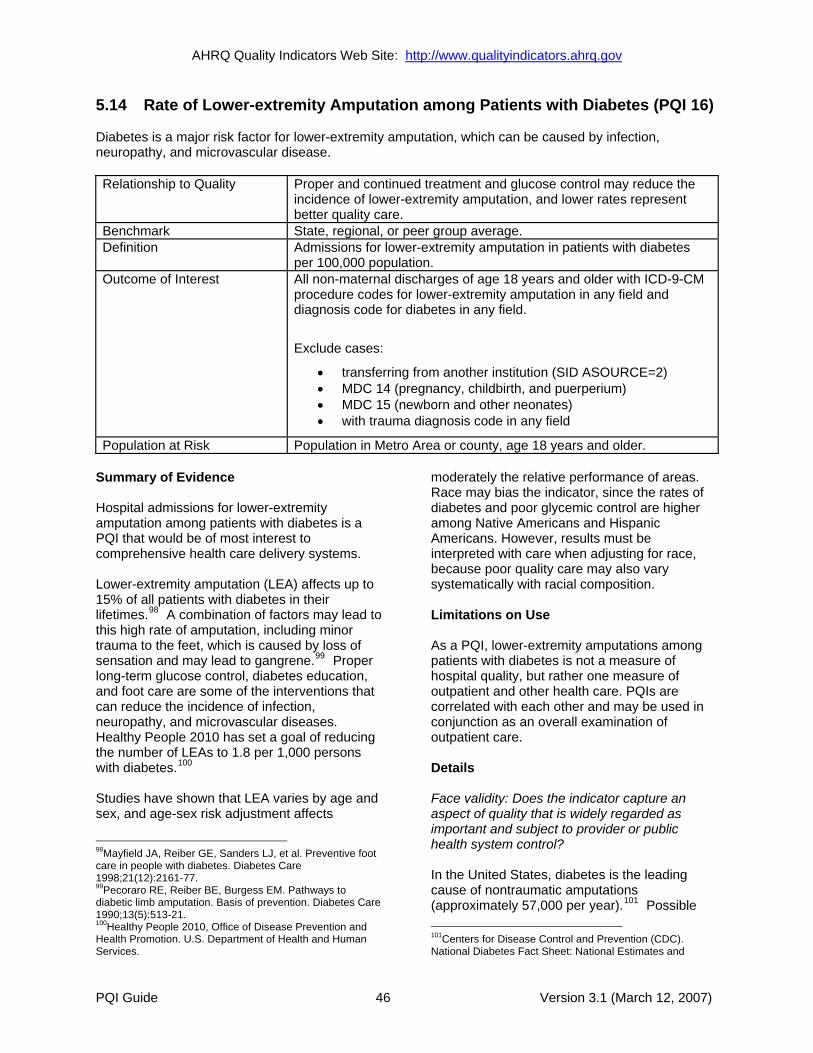
AHRQ Quality Indicators Web Site: http://www.qualityindicators.ahrq.gov
5.14 Rate of Lower-extremity Amputation among Patients with Diabetes (PQI 16) Diabetes is a major risk factor for lower-extremity amputation, which can be caused by infection, neuropathy, and microvascular disease. Relationship to Quality Proper and continued treatment and glucose control may reduce the
incidence of lower-extremity amputation, and lower rates represent better quality care.
Benchmark State, regional, or peer group average. Definition Admissions for lower-extremity amputation in patients with diabetes
per 100,000 population. Outcome of Interest All non-maternal discharges of age 18 years and older with ICD-9-CM
procedure codes for lower-extremity amputation in any field and diagnosis code for diabetes in any field.
Exclude cases:
• transferring from another institution (SID ASOURCE=2) • MDC 14 (pregnancy, childbirth, and puerperium) • MDC 15 (newborn and other neonates) • with trauma diagnosis code in any field
Population at Risk Population in Metro Area or county, age 18 years and older. Summary of Evidence Hospital admissions for lower-extremity amputation among patients with diabetes is a PQI that would be of most interest to comprehensive health care delivery systems. Lower-extremity amputation (LEA) affects up to 15% of all patients with diabetes in their lifetimes.98 A combination of factors may lead to this high rate of amputation, including minor trauma to the feet, which is caused by loss of sensation and may lead to gangrene.99 Proper long-term glucose control, diabetes education, and foot care are some of the interventions that can reduce the incidence of infection, neuropathy, and microvascular diseases. Healthy People 2010 has set a goal of reducing the number of LEAs to 1.8 per 1,000 persons with diabetes.100
Studies have shown that LEA varies by age and sex, and age-sex risk adjustment affects
98Mayfield JA, Reiber GE, Sanders LJ, et al. Preventive foot care in people with diabetes. Diabetes Care 1998;21(12):2161-77. 99Pecoraro RE, Reiber BE, Burgess EM. Pathways to diabetic limb amputation. Basis of prevention. Diabetes Care 1990;13(5):513-21. 100Healthy People 2010, Office of Disease Prevention and Health Promotion. U.S. Department of Health and Human Services.
moderately the relative performance of areas. Race may bias the indicator, since the rates of diabetes and poor glycemic control are higher among Native Americans and Hispanic Americans. However, results must be interpreted with care when adjusting for race, because poor quality care may also vary systematically with racial composition. Limitations on Use As a PQI, lower-extremity amputations among patients with diabetes is not a measure of hospital quality, but rather one measure of outpatient and other health care. PQIs are correlated with each other and may be used in conjunction as an overall examination of outpatient care. Details Face validity: Does the indicator capture an aspect of quality that is widely regarded as important and subject to provider or public health system control? In the United States, diabetes is the leading cause of nontraumatic amputations (approximately 57,000 per year).101 Possible
101Centers for Disease Control and Prevention (CDC). National Diabetes Fact Sheet: National Estimates and
PQI Guide 46 Version 3.1 (March 12, 2007)
AHRQ Quality Indicators Web Site: http://www.qualityindicators.ahrq.gov
interventions include foot clinics, wearing proper footwear, and proper care of feet and foot ulcers.102 Precision: Is there a substantial amount of provider or community level variation that is not attributable to random variation? Based on empirical evidence, this indicator is moderately precise, with a raw area level rate of 30.5 per 100,000 population and a substantial standard deviation of 42.7. The signal ratio (i.e., the proportion of the total variation across areas that is truly related to systematic differences in area performance rather than random variation) is moderate, at 68.5%, indicating that some of the observed differences in age-sex adjusted rates likely do not represent true differences in area performance. Using multivariate signal extraction techniques appears to have little additional impact on estimating true differences across areas. Minimum bias: Is there either little effect on the indicator of variations in patient disease severity and comorbidities, or is it possible to apply risk adjustment and statistical methods to remove most or all bias? Several sociodemographic variables are associated with the risk of lower-extremity amputation, including age, duration of diabetes, and sex.103 104 Empirical results show that age-sex adjustment affects the relative performance of areas. Construct validity: Does the indicator perform well in identifying true (or actual) quality-of-care problems? Several studies of intervention programs have noted a decrease in amputation risk. One recent study noted a 1-year post-intervention decrease of 79% in amputations in a low-income African American population. Interventions included foot care education, assistance in finding properly
General Information on Diabetes in the United States.
Atlanta, GA: U.S. Department of Health and Human Services, 1999. 102Pecoraro et al. 1990. 103Mayfield et al. 1998. 104Selby JV, Zhang D. Risk factors for lower extremity amputation in persons with diabetes. Diabetes Care 1995;18(4):509-16.
fitting footwear, and prescription footwear.105 One observational study found that patients who receive no outpatient diabetes education have a three-fold higher risk of amputation than those receiving care.106
Fosters true quality improvement: Is the indicator insulated from perverse incentives for providers to improve their reported performance by avoiding difficult or complex cases, or by other responses that do not improve quality of care? Given the severity of conditions requiring lower-extremity amputation, hospitals are unlikely to fail to admit patients requiring hospitalization. Prior use: Has the measure been used effectively in practice? Does it have potential for working well with other indicators? This indicator is not widely used; however, it is included in the DEMPAQ measure set for outpatient care.
105Patout CA, Jr., Birke JA, Horswell R, et al. Effectiveness of a comprehensive diabetes lower-extremity amputation prevention program in a predominantly low-income African-American population. Diabetes Care 2000;23(9):1339-42. 106Reiber GE, Pecoraro RE, Koepsell TD. Risk factors for amputation in patients with diabetes mellitus. A case-control study. Ann Intern Med 1992;117(2):97-105.
PQI Guide 47 Version 3.1 (March 12, 2007)
AHRQ Quality Indicators Web Site: http://www.qualityindicators.ahrq.gov
6.0 Using Different Types of QI Rates When should you use the observed, expected, risk adjusted, and/or smoothed rates generated by the AHRQ QI software? Here are some guidelines. If the user’s primary interest is to identify cases for further follow-up and quality improvement, then the observed rate would help to identify them. The observed rate is the raw rate generated by the QI software from the data the user provided. Areas for improvement can be identified by the magnitude of the observed rate compared to available benchmarks and/or by the number of patients impacted. Additional breakdowns by the default patient characteristics used in stratified rates (e.g., age, gender, or payer) can further identify the target population. Target populations can also be identified by user-defined patient characteristics supplemented to the case/discharge level flags. Trend data can be used to measure change in the rate over time. Another approach to identify areas to focus on is to compare the observed and expected rates. The expected rate is the rate the provider would have if it performed the same as the reference population given the provider’s actual case-mix (e.g., age, gender, DRG, and comorbidity categories). If the observed rate is higher than the expected rate (i.e., the ratio of observed/expected is greater than 1.0, or observed minus expected is positive), then the implication is that the provider performed worse than the reference population for that particular indicator. Users may want to focus on these indicators for quality improvement. If the observed rate is lower than the expected rate (i.e., the ratio of observed/expected is less than 1.0, or observed minus expected is negative), then the implication is that the provider performed better than the reference population. Users may want to focus on these indicators for identifying best practices. Users can also compare the expected rate to the population rate reported in the Comparative Data document to determine how their case-mix compares to the reference population. The population rate refers to the overall rate for the reference population. The reference population is defined in the Comparative Data document. If the population rate is higher than the expected rate, then the provider’s case-mix is less severe than the reference population. If the population rate is lower than the expected rate, then the provider’s case-mix is more severe than the reference population. We use this difference between the population rate and the expected rate to “adjust” the observed rate to account for the difference between the case-mix of the reference population and the provider’s case-mix. This is the provider’s risk-adjusted rate. If the provider has a less severe case-mix, then the adjustment is positive (population rate > expected rate) and the risk-adjusted rate is higher than the observed rate. If the provider has a more severe case-mix, then the adjustment is negative (population rate < expected rate) and the risk-adjusted rate is lower than the observed rate. The risk-adjusted rate is the rate the provider would have if it had the same case-mix as the reference population given the provider’s actual performance. Finally, users can compare the risk-adjusted rate to the smoothed or “reliability-adjusted” rate to determine whether this difference between the risk-adjusted rate and reference population rate is likely to remain in the next measurement period. Smoothed rates are weighted averages of the population rate and the risk-adjusted rate, where the weight reflects the reliability of the provider’s risk-adjusted rate. A ratio of (smoothed rate - population rate) / (risk-adjusted rate - population rate) greater than 0.80 suggests that the difference is likely to persist (whether the difference is positive or negative). A ratio less
PQI Guide 48 Version 3.1 (March 12, 2007)

AHRQ Quality Indicators Web Site: http://www.qualityindicators.ahrq.gov
than 0.80 suggests that the difference may be due in part to random differences in patient characteristics (patient characteristics that are not observed and controlled for in the risk-adjustment model). In general, users may want to focus on areas where the differences are more likely to persist.
PQI Guide 49 Version 3.1 (March 12, 2007)
AHRQ Quality Indicators Web Site: http://www.qualityindicators.ahrq.gov
7.0 References Access to Health Care in America. Washington, DC: National Academy Press; 1993. Bagg W, Sathu A, Streat S, et al. Diabetic ketoacidosis in adults at Auckland Hospital, 1988-1996. Aust NZ J Med 1998;28(5):604-8. Billings J, Zeital L, Lukomnik J, et al. Analysis of variation in hospital admission rates associated with area income in New York City. Unpublished report. Billings J, Zeitel L, Lukomnik J, et al. Impact of socioeconomic status on hospital use in New York City, Health Aff (Millwood) 1993;12(1):162-73. Bindman AB, Grumbach K, Osmond D, et al. Preventable hospitalizations and access to health care. JAMA 1995;274(4):305-11. Blais L, Ernst P, Boivin JF, et al. Inhaled corticosteroids and the prevention of readmission to hospital for asthma. Am J Respir Crit Care Med 1998; 158(1):126-32. Blumberg MS, Juhn PI. Insurance and the risk of ruptured appendix [letter; comment]. N Engl J Med 1995;332(6):395-6; discussion 397-8. Blustein J, Hanson K, Shea S. Preventable hospitalizations and socioeconomic status. Health Aff (Millwood) 1998;17(2):177-89. Bratton SL, Haberkern CM, Waldhausen JH. Acute appendicitis risks of complications: age and Medicaid insurance. Pediatrics 2000;106(1 Pt 1):75-8. Braveman P, Schaaf VM, Egerter S, et al. Insurance-related differences in the risk of ruptured appendix [see comments]. N Engl J Med 1994;331(7):444-9. Brunwald E, Antman EM, Beasley JW et al. ACC/AHA guidelines for the management of patients with unstable angina and non-ST-segment elevation myocardial infarction. A report of the American College of Cardiology/American Heart Association Task Force on Practice Guidelines (Committee on the Management of Patients with Unstable Angina). J Am Coll Cardiol 2000;36(3):970-1062. Burkhart DM. Management of acute gastroenteritis in children. American Family Physician 1999;60(9):2555-63, 2565-6. Centers for Disease Control and Prevention (CDC). National Diabetes Fact Sheet: National Estimates and General Information on Diabetes in the United States. Atlanta, GA: U.S. Department of Health and Human Services, 1999. Centers for Disease Control and Prevention (CDC). Asthma mortality and hospitalization among children and young adults—United States, 1980-1993. MMWR Morb Mortal Wkly Rep 1996;45(17):350-3. Chassin MR, Galvin RW, The urgent need to improve health care quality. Institute of Medicine National Roundtable on Health Care Quality. JAMA 1998;280(11):1000-5. Donahue JG, Weiss ST, Livingston JM, et al. Inhaled steroids and the risk of hospitalization for asthma. JAMA 1997;277(11):887-91.
PQI Guide 50 Version 3.1 (March 12, 2007)
AHRQ Quality Indicators Web Site: http://www.qualityindicators.ahrq.gov
Edep ME, Shah NB, Tateo IM, et al. Differences between primary care physicians and cardiologists in management of congestive heart failure: relation to practice guidelines. J Am Coll Cardiol 1997;30(2):518-26. Feinleib M, Rosenberg HM, Collins JG, et al. Trends in COPD morbidity and mortality in the United States. Am Rev Respir Dis 1989;140(3 pt 2):S9-18. Foster DA, Talsma A, Furumoto-Dawson A, et al. Influenza vaccine effectiveness in preventing hospitalization for pneumonia in the elderly. Am J Epidemiol 1992;136(3):296-307. Gaster B, Hirsch IB. The effects of improved glycemic control on complications in type 2 diabetes. Arch Intern Med 1998;158(2):134-40. Gibbons RJ, Chatterjee K, Daley J, et al. ACC/AHA/ACP-ASIM guidelines for the management of patients with chronic stable angina: a report of the American College of Cardiology/American Heart Association Task force on Practice Guidelines (Committee on Management of Patients with Chronic Stable Angina) [published erratum appears in J Am Coll Cardiol 1999 Jul;34(1):314]. J Am Coll Cardiol 1999;33(7):2092-197. Hackner D, Tu G, Weingarten S, et al. Guidelines in pulmonary medicine: a 25-year profile. Chest 1999;116(4):1046-62. Harris MI. Diabetes in America: epidemiology and scope of the problem. Diabetes Care 1998;21 Suppl 3:C11-4. Healthy People 2010. Office of Disease Prevention and Health Promotion, U.S. Department of Health and Human Services. Hessol NA, Fuentes-Afflick E, Bacchetti P. Risk of low birth weight infants among black and white parents. Obstet Gynecol 1998;92(5):814-22. Hiss RG. Barriers to care in non-insulin-dependent diabetes mellitus. The Michigan Experience. Ann Intern Med 1996;124(1 Pt 2):146-8. Humphrey LL, Palumbo PJ, Butters MA, et al. The contribution of non-insulin-dependent diabetes to lower-extremity amputation in the community. Arch Intern Med 1994;154(8):885-92. Institute of Medicine Division of Health Care Services. Medicare: a strategy for quality assurance. Washington, DC: National Academy Press; 1990. Lin, S, Fitzgerald E, Hwang SA, et al. Asthma hospitalization rates and socioeconomic status in New York State (1987-1993) J Asthma 1999;36(3):239-51. Mayfield JA, Reiber GE, Sanders LJ, et al. Preventive foot care in people with diabetes. Diabetes Care 1998;21(12):2161-77. McConnochie KM, Russo MJ, McBride JT, et al. Socioeconomic variation in asthma hospitalization: excess utilization or greater need? Pediatrics 1999;103(6):375. Millman M, editor. Committee on Monitoring Access to Personal Health Care Services. Washington, DC: National Academy Press; 1993. Murray JL, Bernfield M. The differential effect of prenatal care on the incidence of low birth weight among blacks and whites in a prepaid health care plan. N Engl J Med 1988;319(21):1385-91.
PQI Guide 51 Version 3.1 (March 12, 2007)

AHRQ Quality Indicators Web Site: http://www.qualityindicators.ahrq.gov
Musey VC, Lee JK, Crawford R, et al. Diabetes in urban African-Americans. I. Cessation of insulin therapy is the major precipitating cause of diabetic ketoacidosis. Diabetes Care 1995;18(4):483-9. National Heart, Lung, and Blood Institute/National Asthma Education and Prevention Program. Expert Panel Report 2: Guidelines for the diagnosis and management of asthma. In: National Institutes of Health pub. no. 97-4051. Bethesda, MD; 1997. O’Campo P, Xue X, Wang MC, et al. Neighborhood risk factors for low birthweight in Baltimore: a multilevel analysis. Am J Public Health 1997;87(7):1113-8. Patout CA, Jr., Birke JA, Horswell R, et al. Effectiveness of a comprehensive diabetes lower-extremity amputation prevention program in a predominantly low-income African-American population. Diabetes Care 2000;23(9):1339-42. Pecoraro RE, Reiber BE, Burgess EM. Pathways to diabetic limb amputation. Basis of prevention. Diabetes Care 1990;13(5):513-21. Philbin EF, Andreaou C, Rocco TA, et al. Patterns of angiotensin-converting enzyme inhibitor use in congestive heart failure in two community hospitals. Am J Cardio. 1996;77(1):832-8. Ray NF, Thamer M, Fadillioglu B, et al. Race, income, urbanicity, and asthma hospitalization in California: a small area analysis. Chest 1998;113(5):1277-84. Reiber GE, Pecoraro RE, Koepsell TD. Risk factors for amputation in patients with diabetes mellitus. A case-control study. Ann Intern Med 1992;117(2):97-105. Reis, SE, Holubkov R, Edmundowicz D, et al. Treatment of patients admitted to the hospital with congestive heart failure: specialty-related disparities in practice patterns and outcomes. J Am Coll Cardiol 1997;30(3):733-8. Rosenthal GE, Harper DL, Shah A, et al. A regional evaluation of variation in low-severity hospital admissions. J Gen Intern Med 1997;12(7):416-22. Selby JV, Zhang D. Risk factors for lower extremity amputation in persons with diabetes. Diabetes Care 1995;18(4):509-16. Silver MP, Babitz ME, Magill MK. Ambulatory care sensitive hospitalization rates in the aged Medicare population in Utah, 1990 to 1994: a rural-urban comparison. J Rural Health 1997;13(4):285-94. Trudeau ME, Solano-McGuire SM. Evaluating the quality of COPD care. Am J. Nurs 1999;99(3):47-50. Weinberg AD, Minaker KL. Dehydration. Evaluation and management in older adults. Council on Scientific Affairs, American Medical Association. JAMA 1995;274(19):1552-6. Weinberger M, Oddone EZ, Henderson WG. Does increased access to primary care reduce hospital readmissions? VA Cooperative Study Group on Primary Care and Hospital readmission. N Engl J Med 1996;334(22):1441-7. Weissman JS, Gatsonis C, Epstein AM. Rates of avoidable hospitalization by insurance status in Massachusetts and Maryland. JAMA 1992;268(17)2388-94. Zoorob RJ, Hagen MD. Guidelines on the care of diabetic nephropathy, retinopathy and foot disease. Am Fam Physician 1997;56(8):2021-8, 2033-4.
PQI Guide 52 Version 3.1 (March 12, 2007)
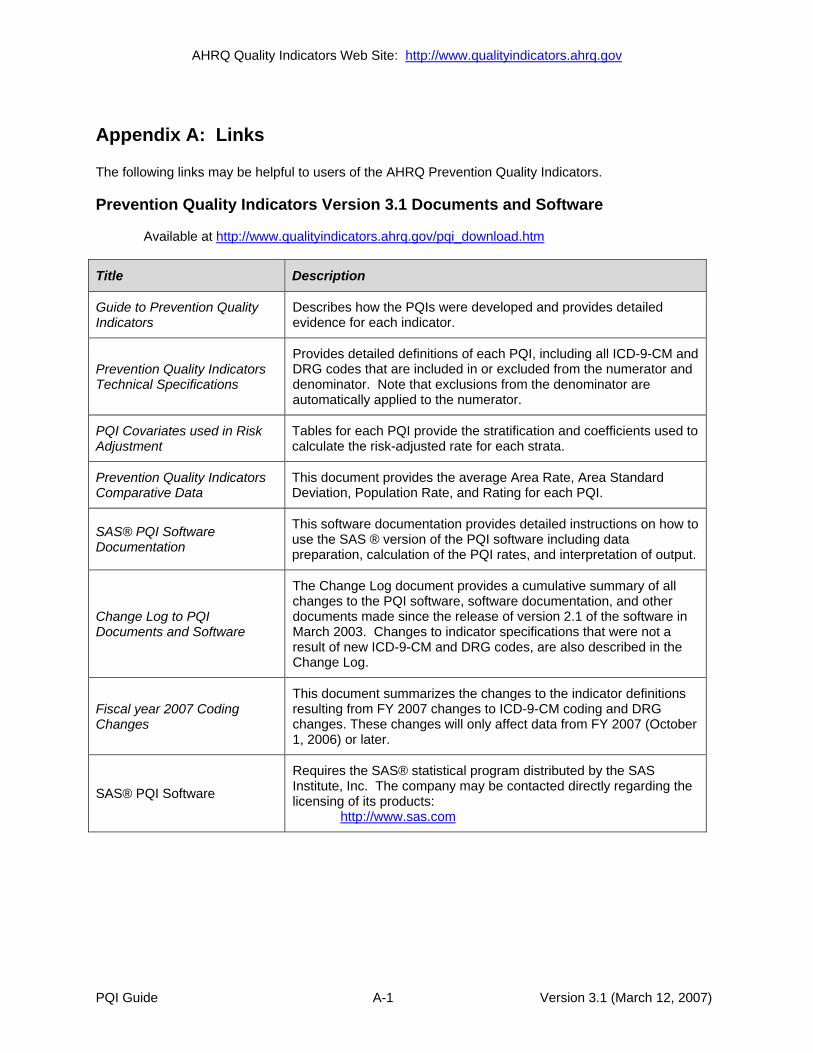
AHRQ Quality Indicators Web Site: http://www.qualityindicators.ahrq.gov
A.
Appendix A: Links The following links may be helpful to users of the AHRQ Prevention Quality Indicators. Prevention Quality Indicators Version 3.1 Documents and Software
Available at http://www.qualityindicators.ahrq.gov/pqi_download.htm
Title Description
Guide to Prevention Quality Indicators
Describes how the PQIs were developed and provides detailed evidence for each indicator.
Prevention Quality Indicators Technical Specifications
Provides detailed definitions of each PQI, including all ICD-9-CM and DRG codes that are included in or excluded from the numerator and denominator. Note that exclusions from the denominator are automatically applied to the numerator.
PQI Covariates used in Risk Adjustment
Tables for each PQI provide the stratification and coefficients used to calculate the risk-adjusted rate for each strata.
Prevention Quality Indicators Comparative Data
This document provides the average Area Rate, Area Standard Deviation, Population Rate, and Rating for each PQI.
SAS® PQI Software Documentation
This software documentation provides detailed instructions on how to use the SAS ® version of the PQI software including data preparation, calculation of the PQI rates, and interpretation of output.
Change Log to PQI Documents and Software
The Change Log document provides a cumulative summary of all changes to the PQI software, software documentation, and other documents made since the release of version 2.1 of the software in March 2003. Changes to indicator specifications that were not a result of new ICD-9-CM and DRG codes, are also described in the Change Log.
Fiscal year 2007 Coding Changes
This document summarizes the changes to the indicator definitions resulting from FY 2007 changes to ICD-9-CM coding and DRG changes. These changes will only affect data from FY 2007 (October 1, 2006) or later.
SAS® PQI Software
Requires the SAS® statistical program distributed by the SAS Institute, Inc. The company may be contacted directly regarding the licensing of its products:
http://www.sas.com
PQI Guide A-1 Version 3.1 (March 12, 2007)

AHRQ Quality Indicators Web Site: http://www.qualityindicators.ahrq.gov
AHRQ QI Windows Application The AHRQ QI Windows Application calculates rates for all of the AHRQ Quality Indicators modules and does not require SAS®. It is available at:
http://www.qualityindicators.ahrq.gov/winqi_download.htm Additional Documents The following documents are available within the "Documentation" section of the AHRQ QI Downloads Web page:
http://www.qualityindicators.ahrq.gov/downloads.htm
Refinement of the HCUP Quality Indicators (Technical Review), May 2001 Refinement of the HCUP Quality Indicators (Summary), May 2001 Measures of Patient Safety Based on Hospital Administrative Data - The Patient Safety
Indicators, August 2002 Measures of Patient Safety Based on Hospital Administrative Data - The Patient Safety Indicators
(Summary), August 2002 In addition, these documents may be accessed at the AHRQ QI Documentation Web page:
http://www.qualityindicators.ahrq.gov/documentation.htm • Guidance for Using the AHRQ Quality Indicators for Hospital-level Public Reporting or
Payment, August 2004 • AHRQ Summary Statement on Comparative Hospital Public Reporting, December 2005 • Appendix A: Current Uses of AHRQ Quality Indicators and Considerations for Hospital-level • Comparison of Recommended Evaluation Criteria in Five Existing National Frameworks
The following documents can be viewed or downloaded from the page:
http://www.qualityindicators.ahrq.gov/newsletter.htm • 2006 Area Level Indicator Changes • Considerations in Public Reporting for the AHRQ QIs • June 2005 Newsletter - Contains the article, "Using Different Types of QI Rates"
Other Tools and Information PQI rates can be calculated using the modified Federal Information Processing Standards (FIPS) State/county code. A list of codes is available at:
http://www.census.gov/popest/geographic/codes02.pdf
AHRQ provides a free, on-line query system based on HCUP data that provides access to health statistics and information on hospital stays at the national, regional, and State level. It is available at:
http://hcup.ahrq.gov/HCUPnet.asp The CDC National Diabetes Surveillance System provides state level estimates of diabetes prevalence by age.
http://www.cdc.gov/diabetes/statistics/index.htm
PQI Guide A-2 Version 3.1 (March 12, 2007)