ahrq quality indicators€¦ · documentation and in reviewing the inpatient quality indicator...
TRANSCRIPT


AHRQ Quality Indicators
Inpatient Quality Indicators: Software Documentation, Version 2.1, Revision 4, SAS
Department of Health and Human Services Agency for Healthcare Research and Quality http://www.qualityindicators.ahrq.gov June 2002 AHRQ Pub. No. 02-R0205 Revision 4 (December 22, 2004)

IQI SAS Software Documentation i Version 2.1, Revision 4 (December 22, 2004)
Citation AHRQ Quality Indicators -- Inpatient Quality Indicators: Software Documentation, Version 2.1 - SAS. Rockville, MD: Agency for Healthcare Research and Quality, 2002. Revision 4 (December 22, 2004). AHRQ Pub. No. 02-R0205.
Abstract The value of information on health care quality has never been so widely recognized; yet many organizations lack the resources and/or expertise to build a quality information program from the ground up. Recognizing this, the AHRQ Quality Indicators were developed specifically to meet the short-term needs for information on health care quality using standardized, user-friendly methods and existing sources of data. This module of the AHRQ Quality Indicators was designed to capitalize on the availability of administrative data on inpatient stays to produce information for Inpatient Quality Indicators (IQIs). These measures include:
• volume of certain intensive, high-technology, or highly complex procedures for which evidence suggests that institutions performing more of these procedures may have better outcomes;
• mortality for inpatient procedures and for inpatient conditions; and
• utilization indicators which examine procedures whose use varies significantly across hospitals and for which questions have been raised about overuse, underuse, or misuse.
This document is the software documentation for the Inpatient Quality Indicators software Version 2.1, Revision 4, which is provided on the AHRQ Web site. The software was developed in SAS, for use on a personal computer. AHRQ's goal, by making this tool publicly available, is to assist users in producing information on health care quality more cost effectively. Details on the development of the Inpatient Quality Indicators can be found in "Guide to Inpatient Quality Indicators: Quality of Care in Hospitals - Volume, Mortality, and Utilization."

IQI SAS Software Documentation ii Version 2.1, Revision 4 (December 22, 2004)
Acknowledgments
Support efforts, including refinement and enhancement of the AHRQ Quality Indicators and related products, are provided by the Support for Quality Indicators (SQI-II) contract team. The following individuals from Battelle Memorial Institute, Stanford University, and University of California (UC) constitute the Support for Quality Indicators core team: Sheryl M. Davies, M.A. Mark Gritz, Ph.D. Kathryn M. McDonald, M.M. Bruce Ellis, M.S. Greg Hubert, B.S. Patrick Romano, M.D., M.P.H Jeffrey Geppert, J.D. Elaine Keller, M.Ed. Jeff Schoenborn, BS The Agency for Healthcare Research and Quality Support for Quality Indicators team includes: Denise Remus, Ph.D., R.N., Project Officer Mary B. Haines, Contract Officer This product is based on the work of many individuals who contributed to its development and testing. The following staff from the Evidence-based Practice Center (EPC) at UCSF-Stanford performed the evidence review, completed the empirical evaluation, and created the programming code and technical documentation for the AHRQ Quality Indicators: Core Project Team Mark McClellan, M.D., Ph.D., principal investigator Kathryn M. McDonald, M.M., EPC coordinator Sheryl M. Davies, M.A.
Jeffrey Geppert, J.D. Patrick Romano, M.D., M.P.H. Kaveh G. Shojania, M.D.
Other Contributors
Amber Barnato, M.D. Paul Collins, B.A. Bradford Duncan M.D. Michael Gould, M.D., M.S. Paul Heidenreich, M.D. Corinna Haberland, M.D.
Paul Matz, M.D. Courtney Maclean, B.A. Susana Martins, M.D. Kristine McCoy, M.P.H. Suzanne Olson, M.A. L. LaShawndra Pace, B.A.
Mark Schleinitz, M.D. Herb Szeto, M.D. Carol Vorhaus, M.B.A Peter Weiss, M.D. Meghan Wheat, B.A.
Consultants
Douglas Staiger, Ph.D. The following staff from Social & Scientific Systems, Inc., developed this software product, documentation, and guide: Programmers Leif Karell Kathy McMillan
Technical Writer Patricia Burgess
Graphics Designer Laura Spofford
Contributors from the Agency for Healthcare Research and Quality:
Anne Elixhauser, Ph.D. Denise Remus, Ph.D., R.N.
H. Joanna Jiang, Ph.D. Margaret Coopey, R.N., M.G.A, M.P.S.
The contribution of the peer reviewers of the evidence report and the beta-testers of the software products is also acknowledged; their input was invaluable.

IQI SAS Software Documentation iii Version 2.1, Revision 4 (December 22, 2004)
Table of Contents
Abstract ......................................................................................................................................................... i
Acknowledgments ...................................................................................................................................... ii
Introduction ................................................................................................................................................. 1
Components of the Inpatient Quality Indicators Module ........................................................................ 2
Quick Reference .......................................................................................................................................... 2 Processing Steps .................................................................................................................................. 2 Inpatient Quality Indicator Module Details ............................................................................................. 5
Background ................................................................................................................................................. 7
Data Elements and Coding Conventions .................................................................................................. 8 Input for the AHRQ Quality Indicators ................................................................................................... 8 Coding of Diagnoses, Procedures, and DRGs...................................................................................... 9 APR-DRG Variables ............................................................................................................................ 10 Addition of Patient Year and Quarter of Discharge Variables to Input File Specifications ................. 10 Missing Values .................................................................................................................................... 13 Treatment of Missing Data .................................................................................................................. 14
User Options .............................................................................................................................................. 15
Producing Inpatient Quality Indicator Rates: Processing Steps ........................................................ 16 1. Identify outcomes in inpatient records ........................................................................................... 16 2. Identify populations at risk ............................................................................................................. 16 3. Calculate observed (raw) Inpatient Quality Indicator rates ............................................................ 16 4. Risk adjust the Inpatient Quality Indicator rates ............................................................................ 17 5. Create MSX smoothed rates .......................................................................................................... 17
Program Descriptions ............................................................................................................................... 18 Program 1: Modify Statements in the CONTROL_IQI.SAS Code ..................................................... 18 Program 2: Run IQFMTS ................................................................................................................... 19 Program 3: Run IQSAS1 .................................................................................................................... 19 Program 4: run IQSASP2 ................................................................................................................... 21 Program 5: Run IQSASP3.................................................................................................................. 24 Program 6: Run IQSASA2.................................................................................................................. 26 Program 7: Run IQSASA3.................................................................................................................. 28
Reviewing the Printed Output .................................................................................................................. 30 IQSAS1................................................................................................................................................ 30 IQSASP2 ............................................................................................................................................. 31 IQSASP3 ............................................................................................................................................. 32 IQSASA2 ............................................................................................................................................. 33 IQSASA3 ............................................................................................................................................. 33
Interpreting the Results ............................................................................................................................ 35 Using Indicators in Combination ......................................................................................................... 35 Volume Indicators ................................................................................................................................ 35 Utilization Indicators ............................................................................................................................ 36 Mortality Indicators .............................................................................................................................. 37 Observed Rates .................................................................................................................................. 37 Risk-Adjusted Rates ............................................................................................................................ 38 MSX Smoothed Rates (Optional) ........................................................................................................ 39 Comparing Observed, Risk-Adjusted, and Smoothed Rates .............................................................. 40
IQI SAS Software Documentation iv Version 2.1, Revision 4 (December 22, 2004)
Benchmark Timings .................................................................................................................................. 44
User Support ............................................................................................................................................. 44
Appendix A: Log of Revisions to IQI Documentation and Software Version 2.1, Revision 4 ........ A-1
Appendix B: ICD-9-CM and DRG Coding Updates in IQI Release Version 2.1, Revision 4 ........... B-1
List of Figures Figure 1. Processing Steps for the Inpatient Quality Provider Indicators .................................................... 3
Figure 2. Processing Steps for the Inpatient Quality Area Indicators .......................................................... 4
List of Tables Table 1. Inpatient Quality Indicator (IQI) Variables ...................................................................................... 5
Table 2. Prefixes for the Inpatient Quality Indicator (IQI) Variables ............................................................ 6
Table 3. Inpatient Quality Module Contents ................................................................................................. 6
Table 4. Data Elements and Coding Conventions ..................................................................................... 11
Table 5. Treatment of Missing Data Elements ........................................................................................... 14
Table 6. How to Set Up IQI Parameters and Your Data for Using APR-DRG Variables ........................... 21
Table 7. IQSASP2 Aggregation Possibilities ............................................................................................. 23
Table 8. IQSASA2 Aggregation Possibilities ............................................................................................. 27
Table 9. Thresholds for Volume Indicators ................................................................................................ 36

IQI SAS Software Documentation 1 Version 2.1, Revision 4 (December 22, 2004)
AHRQ Quality Indicators, Software Documentation, Version 2.1, Revision 4: Inpatient Quality Indicators
Introduction This documentation describes the software for implementing the Inpatient Quality Indicator (IQI) module of the AHRQ Quality Indicators Version 2.1, Revision 4, and highlights features of the analytic approach of particular interest to new users. Detailed information about the Inpatient Quality Indicators (IQI) is contained in the companion document “Guide to Inpatient Quality Indicators1,” which includes information about the development of the indicators and their definitions. The software consists of a series of computer programs that:
• Assign and calculate IQIs from hospital discharge abstracts or UB (uniform billing) claims data.
• Print IQI results in SAS format or as an ASCII text file (comma delimited) that can be imported into word processing documents, spreadsheets, or graphics software, at the user's option.
• Create risk-adjusted rates that adjust for casemix differences and expected rates that adjust for performance differences.
• Create smoothed rates that reduce fluctuations over time due to random variation. This documentation includes:
• A discussion of the data elements necessary to produce the AHRQ IQIs and the uniform coding conventions recommended for those elements.
• Descriptions of the IQI processing steps in nontechnical language.
• Detailed descriptions of the functions of each IQI SAS program.
Critical user information is highlighted with this symbol:
1 Available at http://www.qualityindicators.ahrq.gov/iqi_download.htm.
IQI SAS Software Documentation 2 Version 2.1, Revision 4 (December 22, 2004)
Components of the Inpatient Quality Indicators Module As shown in Table 3 on page 6, the Inpatient Quality Indicators module consists of seven SAS programs and 18 ASCII text files that contain auxiliary data. These programs and text files are described in the subsequent sections of this document. The programs were developed for use in Statistical Analysis System (SAS)2, version 6.12 or higher, on a Windows personal computer. A note on the naming conventions for the Inpatient Quality Indicators (IQI) module programs. Most programs have names of the form IQSASi, IQSASAi, or IQSASPi. The first two characters “IQ” of the program name indicate an Inpatient Quality Indicators program, to distinguish it from other modules that have been or will be released from AHRQ. The next three characters of the program name are “SAS” and are present to distinguish the program from SPSS versions of the software. In the programs that are specific to either Area or Provider indicators, the sixth character of the program name is either “A” or “P”. The sixth character is an “A” if it is for the production of Area indicator rates that use county or Metropolitan Statistical Area (MSA) area populations as denominators. The sixth character is a “P” if it is a program for the production of Provider indicator rates that use subsets of the hospital discharge population. The last character (i) of the variable name designates the number of the specific program.
Quick Reference The subsequent four pages are intended to serve as a quick reference to assist in reading this documentation and in reviewing the Inpatient Quality Indicator (IQI) module outputs. Processing steps are shown first (Figures 1 and 2) followed by a listing of the module variables (Table 1), variable prefixes (Table 2), and module contents (Table 3). One suggestion is to print these pages in duplex mode on two sheets of paper so that they can then be easily referred to as the need arises.
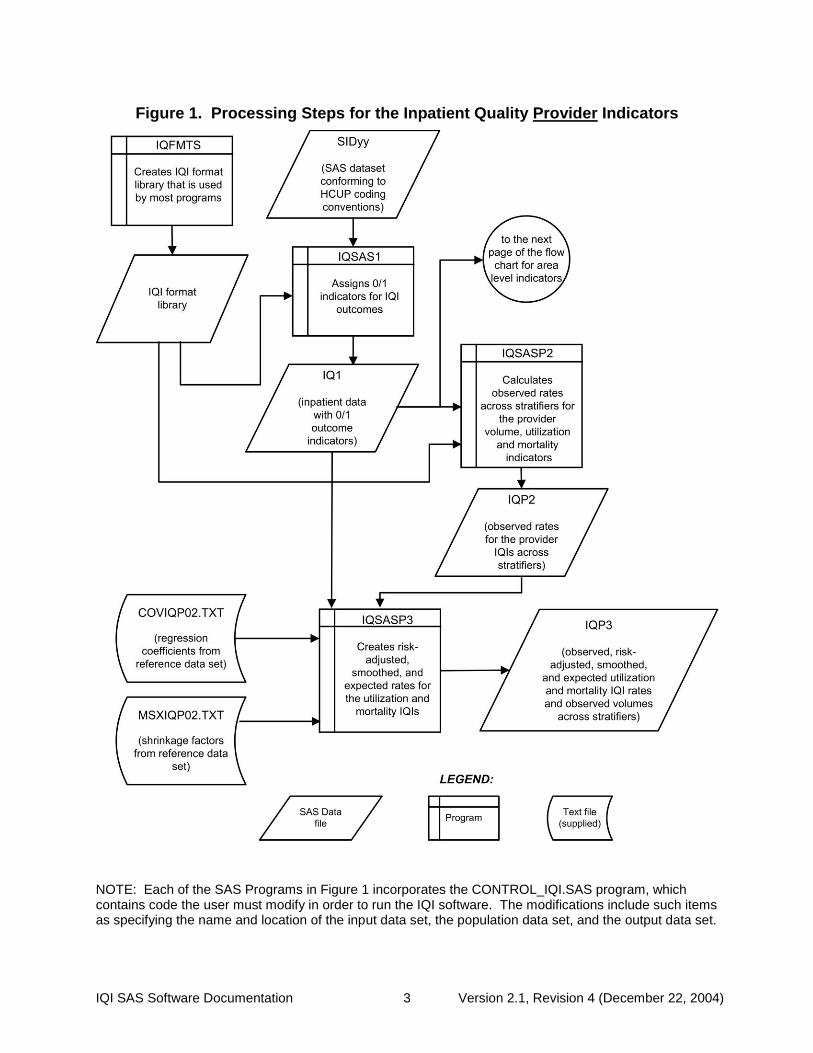
Processing Steps Figure 1 shows processing steps for the Inpatient Quality Provider Indicators, while Figure 2 shows steps for the Inpatient Quality Area Indicators.
2 SAS is a statistical program distributed by the SAS Institute, Inc. (http://www.sas.com).The company may be contacted directly regarding the licensing of their products. The SAS Institute, Inc. does not have any affiliation with AHRQ nor involvement in the development of the AHRQ QIs.
IQI SAS Software Documentation 3 Version 2.1, Revision 4 (December 22, 2004)
Figure 1. Processing Steps for the Inpatient Quality Provider Indicators
NOTE: Each of the SAS Programs in Figure 1 incorporates the CONTROL_IQI.SAS program, which contains code the user must modify in order to run the IQI software. The modifications include such items as specifying the name and location of the input data set, the population data set, and the output data set.

IQI SAS Software Documentation 4 Version 2.1, Revision 4 (December 22, 2004)
Figure 2. Processing Steps for the Inpatient Quality Area Indicators

IQI SAS Software Documentation 5 Version 2.1, Revision 4 (December 22, 2004)
Inpatient Quality Indicator Module Details
Table 1. Inpatient Quality Indicator (IQI) Variables
Type IQI
number Indicator
Age categories
0 to 17
18 to 39
40 to 64
65 +
Provider
Volumes
1 Esophageal resection
2 Pancreatic resection
3 Pediatric heart surgery No No No
4 AAA repair
5 CABG No No
6 PTCAa No No
7 Carotid endarterectomy
Post-procedural mortality Rates
8 Esophageal resection
9 Pancreatic resection
10 Pediatric heart surgery No No No
11 AAA repair
12 CABG No No
30 PTCAb No No
31 Carotid endarterectomyb
13 Craniotomy No
14 Hip replacement
In- Hospital Mortality rates
15 AMI No
32 AMI, Without Transfer Cases No
16 CHF No
17 Stroke No
18 GI hemorrhage No
19 Hip fracture No
20 Pneumonia No
Utilization rates
21 Cesarean delivery
33 Primary Cesarean delivery
22 VBAC (Vaginal Birth After Cesarean), Uncomplicated
34 VBAC, All
23 Laparoscopic Cholecystectomy
24 Incidental appendectomy among elderly No No No
25 Bi-lateral cardiac catheterization
Area Utilization rates
26 CABG No No
27 PTCA No No
28 Hysterectomy No
29 Laminectomy No a PTCA = percutaneous transluminal coronary angioplasty b PTCA and carotid endarterectomy mortality are not recommended as stand-alone indicators, but are suggested as companion measures to the corresponding volume measures.

IQI SAS Software Documentation 6 Version 2.1, Revision 4 (December 22, 2004)
Table 2. Prefixes for the Inpatient Quality Indicator (IQI) Variables
Prefix Contents
EXAMPLES
Provider indicator # 8,
Esophageal resection
Area indicator # 26,
CABG utilization
E Expected rate EPIQ08 --
T Inpatient numerator (top) TPIQ08 TAIQ26
P Population denominator (pop) PPIQ08 PAIQ26
O Observed Rate (not applicable to IQI01-IQI07)
OPIQ08 OAIQ26
R Risk-adjusted Rate (not applicable to IQI01-IQI07)
RPIQ08 RAIQ26
S Smoothed Rate (not applicable to IQI01-IQI07)
SPIQ08 SAIQ26
Table 3. Inpatient Quality Module Contents
SAS programs ASCII text files † CONTROL_IQI.SAS QICTY97.TXT IQFMTS.SAS QICTY98.TXT IQSAS1.SAS QICTY99.TXT IQSASP2.SAS QICTY00.TXT IQSASP3.SAS QICTY01.TXT IQSASA2.SAS QICTY02.TXT IQSASA3.SAS QICTY03.TXT QICTYA97.TXT QICTYA98.TXT QICTYA99.TXT QICTYA00.TXT QICTYA01.TXT QICTYA02.TXT QICTYA03.TXT COVIQP02.TXT MNSIQA02.TXT COVIQA02.TXT MSXIQP02.TXT MSXIQA02.TXT
† The ASCII text files are data files provided with the Inpatient Quality module and are necessary for the programs to run. There is no need to convert these files to SAS format for use with the software. The parameter reference files of MSXIQP02.TXT and MSXIQA02.TXT are not interchangeable between SAS and SPSS software. Users should verify they are running the software with the ASCII text files as listed in Table 3 of the applicable, e.g., SAS or SPSS, software manuals.

IQI SAS Software Documentation 7 Version 2.1, Revision 4 (December 22, 2004)
Background The Inpatient Quality Indicator module contains 32 indicators that reflect the quality of care inside hospitals. Two of the mortality indicators—indicators 30 and 31—are computed by the software but are recommended for use only with the corresponding volume measures (these two IQIs increase the total number of indicators generated by the software to 34). These indicators serve as flags for potential quality problems rather than definitive measures of quality of care. The indicators include three groups of measures based on hospital stays. 1. There are seven Volume indicators for inpatient procedures for which there is evidence that a higher
volume of procedures is associated with lower mortality. A nontrivial number of these procedures are performed by institutions that do not meet recommended volume thresholds. Information about these thresholds and their sources in the literature are given in the interpretation section on page 35. The volume indicators are measured as counts of admissions in which particular procedures were performed.
2. There are 14 Inpatient Mortality indicators for medical conditions and surgical procedures that have
been shown to have mortality rates that vary substantially across institutions and for which evidence suggests that high mortality may be associated with deficiencies in the quality of care. These indicators are measured as rates, the number of deaths divided by the number of admissions for the procedure or condition. Two additional mortality indicators—30 PTCA and 31 carotid endarterectomy—are computed but are recommended to be used only with the corresponding volume measures (for an overall total of 16 mortality indicators).
Nine of these mortality indicators are for procedures, seven of which are also measured by a volume indicator.
The other seven mortality indicators are associated with medical conditions, most of which (except for GI bleeding and pneumonia) are highly concentrated on older patients 50 years of age or older. Hip fracture is more common among elderly women.
3. There are eleven Utilization indicators for procedures for which there are questions of overuse,
underuse, or misuse. The procedures being examined are ones whose use varies significantly across hospitals and areas, and for which high or low rates of use are likely to represent inappropriate or inefficient delivery of care, leading to worse outcomes, higher costs, or both. These indicators are measured as rates, such as # of C-sections per births in a hospital, # of laparoscopic cholecystectomy per admissions with cholecystectomy.
Seven of the utilization indicators are rates based on the hospitalized population. Four other utilization indicators are rates based on an area’s residential population. Two of these area utilization indicators (for CABG and PTCA) have counterparts in the set of volume indicators. For the four area-based utilization indicators, geographic areas are defined at the county level or at the MSA (Metropolitan Statistical Area) level for urban areas and at the county level for rural areas (user’s option).
The indicators in the IQI module are listed in Table 1 on page 5. See also Appendix A of the “Guide to Inpatient Quality Indicators” (http://www.qualityindicators.ahrq.gov/iqi_download.htm) for the definition of each indicator. The data required for measuring these indicators come from hospital discharge abstracts or billing claims (administrative data) which are readily available within hospitals or from many state data organizations. The residential population data for the four area-based utilization indicators are from the U.S. Census Bureau. The software generates observed, risk-adjusted, smoothed, and expected rates for all but the volume indicators. Observed rates are the raw rates. Risk-adjusted and expected rates are derived from applying
IQI SAS Software Documentation 8 Version 2.1, Revision 4 (December 22, 2004)
the average casemix of a baseline file that reflects a large proportion of the U.S. hospitalized or residential population. Smoothed rates are estimates with removal of fluctuations over time due to random variation. For information about how these indicators were identified, see the “Guide to the Inpatient Quality Indicators” (http://www.qualityindicators.ahrq.gov/iqi_download.htm).
Data Elements and Coding Conventions
Input for the AHRQ Quality Indicators The IQI software was written to process data from discharge data abstracts that contain information about hospital stays. The specific data elements that are needed for the IQI software are listed in Table 4. The IQI module was tested on data from the AHRQ Healthcare Cost and Utilization Project (HCUP). HCUP is an ongoing Federal-State-private collaboration to build uniform databases from administrative hospital-based data collected by State data organizations and hospital associations. Additional information on HCUP is available at the website http://www.ahrq.gov/data/hcup/.
The input data files for the Inpatient Quality Indicators software must be in SAS.
It is strongly recommended that users recode data elements in their input files to be consistent with the coding expected by the software. This will minimize the number of internal changes that will be necessary in the IQI software. For example, recoding the SEX data element in the input file to be consistent with the coding described in Table 4 (i.e., 1 for male and 2 for female) is easier than modifying all uses of the Sex data element in the IQI programs.
Not every value for every data element is referenced by the IQI software. For example, only two of the discharge disposition (DISP) data element values are used in the software (DISP value “2” for short-term hospital and value “20” for died in the hospital). However, the complete set of standardized values is included, based on HCUP specifications, to assist users of the uniform HCUP data files.
To minimize internal changes to the software, all required elements should be present in the input data file. If a required element is not available, a dummy element should be provided. Failure to provide a dummy element will result in errors during the execution of the IQI programs.
The data elements listed in Table 4 are those required for the input files of both SAS and SPSS. When a variable is not required for the program the notation “Not used by the QI program” will be present in the Comments column. The SAS program will still run if these variables are not present, however, the SPSS program will not run correctly. Standardizing the variables and data values in the input data file will be helpful for users who have access to both statistical software packages as well as users working to standardize their input file specifications for use with any of the AHRQ QI software modules. The data element HOSPSTCO provides flexibility for users to calculate the area IQIs by hospital location or by patient residence. If the user wants to calculate the IQIs using the population associated with the hospital location as the denominator, the values for this variable should be the individual hospital FIPS3 state/county codes. If the user wants to calculate the area IQIs based on the population of the MSA region or county associated with the patient residence, the values for this variable should be the FIPS state/county code associated with each individual patient’s place of residence.
If the hospital FIPS code is used in HOSPSTCO, users should be aware that rates may be biased for hospitals which serve as regional referral centers. These hospitals are likely to treat patients from outside the MSA, county or even the state in which the facility is located.
3 Federal Information Processing Standard, as defined by the U.S. Department of Commerce, National Institute of
Standards and Technology (formerly National Bureau of Standards).
IQI SAS Software Documentation 9 Version 2.1, Revision 4 (December 22, 2004)
Certain independent cities (Baltimore City, Carson City and St. Louis City), and areas within Hawaii and Virginia, are assigned to different area groupings in the Modified FIPS categories as compared to the US Census Dept. groupings. The AHRQ QI software uses the Modified FIPS code assignment of these areas. Failure to use the Modified FIPS codes assignment will result in the use of incorrect denominator estimates for area indicators.
Using the patient FIPS state/county code for analysis may more accurately reflect the true population at risk.
It is possible that some records in the input data file may be missing the patient FIPS code. Users should be aware that any records with missing values (in the HOSPSTCO data field) are excluded from the calculations of observed, risk-adjusted and smoothed IQI area rates. They will be included in the output from the first program (IQSAS1.SAS.)
The software will generate area IQI rates for each county included in the HOSPSTCO data field. Users are encouraged to limit cases in their input file to those patients discharged from the geographic area of interest. For example, if you are using data from the state of Wisconsin and are interested in generating a rate for Wisconsin, you should remove the cases where the patient’s county of residence (FIPS code) is from another state. Otherwise the total or overall rate will include the population at risk from the counties outside Wisconsin.
The software provides the user with the option of producing output by MSA or by county. When MSA is selected, urban areas are always defined by MSAs. When county is selected urban areas will be defined by county. Rural areas are always defined by county.
In the software programs, the MSALEVL parameter indicates whether MSA codes should be created from the FIPS state/county codes in the input dataset. If the user wishes to analyze data at the MSA level, this parameter should be set to 1. If the user wishes to analyze data at the county level, this parameter should be set to 0.
Coding of Diagnoses, Procedures, and DRGs
Diagnoses and procedures must be coded using the International Classification of Diseases, 9th Revision, Clinical Modification (ICD-9-CM).
Significant modifications to ICD-9-CM codes occurred in the early 1990s. IQI definitions only reflect codes valid after October 1, 1994, and therefore may not accurately analyze data collected before October 1994.
• Diagnoses and procedure codes should be in character strings.
• Diagnosis and procedure codes should not contain any decimal points.
• Diagnosis and procedure codes should be left justified. Diagnosis codes with fewer than five digits should be padded with spaces (not zeros) on the right. Procedure codes with fewer than four digits should be padded with spaces (not zeros) on the right.
The IQI programs assume accurate and specific coding of ICD codes. If an ICD code is specified using 5 digits, the software recognizes only 5-digit versions of that code and not versions truncated at 3 or 4 digits. Similarly, if an ICD code is specified using 4 digits, the software recognizes only 4-digit versions of that code and not versions truncated at 3 digits. For example, 4281 is the ICD-9-CM diagnosis code for left heart failure. If your data are coded less specifically (i.e., 428 is used to designate "heart failure"), these less specific codes are not recognized by the software and will result in undercounting cases.

IQI SAS Software Documentation 10 Version 2.1, Revision 4 (December 22, 2004)
• Diagnosis-related groups (DRGs) are those derived from the Centers for Medicare & Medicaid Services (previously Health Care Financing Administration) Medicare grouper. The software expects that you will be using the DRG effective on the discharge date. The software now refers to data elements DRG and MDC. Your data should be coded accordingly. The software may be modified at the user's option to use other types of DRGs. However, the impact of using other types of DRGs should be evaluated carefully before making such a change.
Version 2.1, Revision 4 of the software accounts for ICD-9-CM and DRG coding effective through FY2005 (or through September 30, 2005).
APR-DRG Variables It is recommended that users run version 15 of 3M’s APR-DRG4 software on their patient data before running the IQI programs in order to create APR-DRG categories, and associated severity and mortality data elements. These APR-DRG variables are used to enhance the risk-adjustment of selected IQI provider indicators. The discussion of the interpretation of risk-adjusted IQI results on page 35 addresses the advantages to be gained by using the APR-DRG information in the risk-adjustment process.
APR-DRG software is not provided as part of the IQI module. It must be obtained separately.
Users who wish to use APR-DRG results to risk-adjust the provider IQI rates should run their APR-DRG software on their patient data before running the IQI programs.
Addition of Patient Year and Quarter of Discharge Variables to Input File Specifications This IQI release, revision 4, includes two new data elements, the patient’s year of discharge (YEAR) and quarter of discharge (DQTR). These data elements may be used at the user’s option to modify the denominator definition of the stroke mortality indicator (IQI #17) for discharges occurring in FY2005 or later (after September 30, 2004) by excluding the ICD-9-CM diagnosis code 436 “ACUTE BUT ILL-DEFINED CEREBROVASCULAR DISEASE” due to a change in the coding guidelines for that code. If data elements YEAR and DQTR are not present in the user’s input data or if the user chooses not to use this option, ICD-9-CM diagnosis code 436 is retained in the denominator population, resulting in the potential inclusion of cases that ought to be excluded in the denominator of IQI #17, Stroke Mortality.
4 The APR-DRG software can be licensed from 3M Health Information Systems (3M HIS). 3M HIS makes APR-DRG software available for use with the AHRQ Quality Indicators at a discounted price. 3M HIS can be contacted by calling 1-800-367-2447. When calling, indicate that you are interested in the AHRQ APR-DRG Version 15 product. The APR-DRG Definitions Manual can also be licensed without licensing the APR-DRG software.

IQI SAS Software Documentation 11 Version 2.1, Revision 4 (December 22, 2004)
Table 4. Data Elements and Coding Conventions
Variable name
Description Format Value description Comments
KEY Sequence number. Unique case identifier.
Numeric User defined unique numeric identifier for each discharge record
Not used by the QI programs, but should be present to facilitate possible exploration; allows user to link the records from the IQSAS1.SAS program output file back to the original input data file.
AGE Age in years at admission Numeric Age in years If this data element is missing the discharge record will be excluded from analysis.
AGEDAY Age in days (coded only when the age in years is less than 1)
Numeric Age in days If this data element is missing, the value is treated as if it was less than 30 days.
RACE Race of patient.
Numeric 1 2 3 4 5 6
White Black Hispanic Asian or Pacific Island Native American Other
The values of 1, 2, and 3 are used directly in the QI software. All other ethnicity codes are mapped to an ‘other’ category.
SEX Sex of patient Numeric
1 2
Male Female
If this data element is missing the discharge record will be excluded from the analysis.
PAY1 Expected primary payer
Numeric 1 2 3 4 5 6
Medicare Medicaid Private, incl. HMO Self-pay No charge Other
The values of 1, 2, 3, and 4 are used directly in the QI software. All other payer codes are mapped to an ‘other’ category This data element is used to stratify only the Provider-level IQIs (IQI01-IQI25, IQI30-IQI34).
HOSPSTCO
Location of patient residence or hospital
location (FIPS† State/county code)
Numeric ssccc
Modified Federal Information Processing Standards State/county code
Available at: http://www.census.gov/popest/geographic/codes02.pdf If this data element is missing the discharge record will be excluded from rate calculations.
HOSPID Data Source hospital number
Numeric Hospital identification number
Used to facilitate data exploration and possible trouble shooting.
DISP Disposition of patient
Numeric 1 2 3 4 5 6 7
20
Routine Short-term hospital Skilled nursing facility Intermediate care Another type of facility Home health care Against medical advice Died in the hospital
The values 2 and 20 are referenced by the QI code (to identify transfers to another short-term hospital, and patients who died in the hospital).

IQI SAS Software Documentation 12 Version 2.1, Revision 4 (December 22, 2004)
Variable name
Description Format Value description Comments
ATYPE Admission Type
Numeric 1 2 3 4 5 6
Emergency Urgent Elective Newborn Trauma Center5 Other
Not used by the IQI program. If not present in the input data file it is not necessary to create a dummy variable.
ASOURCE Admission Source
Numeric 1 2 3 4 5
ER Another hospital Another facility incl LTC Court/law enforcement Routine/birth/other
The value 2 is referenced by the QI code (to identify transfers from another short-term hospital).
LOS Length of Stay Numeric Number of days from admission to discharge
Not used by the IQI program. If not present in the input data file it is not necessary to create a dummy variable.
APR_DRG APR-DRG category Numeric APR-DRG from 3M software.
Although the IQI module will operate without these variables, users should run version 15 APR-DRG software (must be obtained separately) on their raw data to assign this variable to each case.
SEVERTY APR-DRG Severity Score Numeric APR-DRG Severity Score from 3M software.
Although the IQI module will operate without these variables, users should run version 15 APR-DRG software (must be obtained separately) on their raw data to assign this variable to each case.
RISKMORT APR-DRG Mortality Score Numeric APR-DRG Risk of Mortality Score from 3M Software.
Although the IQI module will operate without these variables, users should run version 15 APR-DRG software (must be obtained separately) on their raw data to assign this variable to each case.
DRG Diagnosis Related Group Numeric DRG from federal (CMS) DRG Grouper
MDC Major Diagnostic Category Numeric MDC from federal (CMS) DRG grouper
DX1 – DX30
ICD-9-CM diagnosis codes. DX1 is the principal diagnosis, DX2-DX30 are secondary diagnoses.
String, 5 character
Diagnosis codes
Users must specify the number of diagnoses in the parameter &NDX in CONTROL_IQI.SAS program.
5 The ATYPE value “5” was used to indicate delivery only in the 1988 to 1997 HCUP data files. The UB standards currently use “5” to indicate Trauma Center.

IQI SAS Software Documentation 13 Version 2.1, Revision 4 (December 22, 2004)
Variable name
Description Format Value description Comments
NDX Count of the number of diagnoses (DX) on the discharge record
Numeric Count of diagnoses (principal and all secondary diagnoses)
Not used by the IQI SAS program (used by the SPSS program). If not present in the input data file it is not necessary to create a dummy variable. Definition is: If the 1st discharge record has 1 Pr and the 2nd has 2, NPR would be 1 for the 1st record and 2 for the 2nd. .
PR1 – PR30
ICD-9-CM procedure codes. PR1 is the principal diagnosis, PR2-PR30 are secondary procedures.
String, 4 character
Procedure code
Users with more or fewer secondary procedures should modify the parameter &NPR in CONTROL_IQI.SAS to reflect the number of diagnoses.
NPR Count of the number of procedures (PR) on the discharge record
Numeric Count of procedures (principal and all secondary procedures)
Not used by the IQI SAS program (used by the SPSS program). If not present in the input data file it is not necessary to create a dummy variable. Definition is: If the 1st discharge record has 1 Pr and the 2nd has 2, NPR would be 1 for the 1st record and 2 for the 2nd.
PRDAY1 – PRDAY30
Days from admission to procedure. PR1 is the principal procedure, PR2-PR30 are secondary procedures.
Numeric Days from Admission to Procedure
Not used by the IQI program. If not present in the input data file it is not necessary to create a dummy variable.
YEAR
Year of discharge. The patient’s year of discharge. For example, a patient discharged on July 7, 2004 would have a discharge year of ‘2004.’
Numeric
YYYY Discharge year should be within the range of 1997 to 2005.
Optional data element. If present and the user wishes to exclude cases with ICD-9 code 436 who were discharged after Sept. 30, 2004 from the denominator population of IQI 17 (stroke mortality), the YEARQTR flag should be set to “yes” (YEARQTR=’yes’).
DQTR
Quarter of discharge. The calendar quarter of the patient’s discharge. For example, a patient discharged on July 7, 2004 would have a discharge quarter of ‘3.’
Numeric
1 January-March 2 April-June 3 July-September 4 October-December
Optional – see note under Year above
†Federal Information Processing Standard, as defined by the U.S. Department of Commerce, National Institute of Standards and Technology (formerly National Bureau of Standards).
Note: Certain independent cities (Baltimore City, Carson City and St. Louis City), and areas within Hawaii and Virginia, are assigned to different area groupings in the Modified FIPS categories as compared to the US Census Dept. groupings. The AHRQ QI software uses the Modified FIPS code assignment of these areas. Failure to use the Modified FIPS codes assignment will result in the use of incorrect denominator estimates for area indicators.
Missing Values The IQI programs do not distinguish among different types of missing values.
IQI SAS Software Documentation 14 Version 2.1, Revision 4 (December 22, 2004)
Cases that are missing data in fields used for indicator definitions or for risk adjustment (such as age and sex) will be excluded from analysis.
Data files of hospital discharge abstract data may have numeric data elements coded using special SAS missing "dot" values. For example, besides the standard SAS value of “.” for missing data, there might also be present values of “.A” for invalid data, “.B” for data unavailable from a particular source, “.C” for inconsistent data. However, the IQI programs do not distinguish among the different types of missing codes. Therefore, all types of missing values in the input data to the IQI module can be represented by a single value - missing data (.) for numeric variables and blank (' ') for alphanumeric (or character) variables.
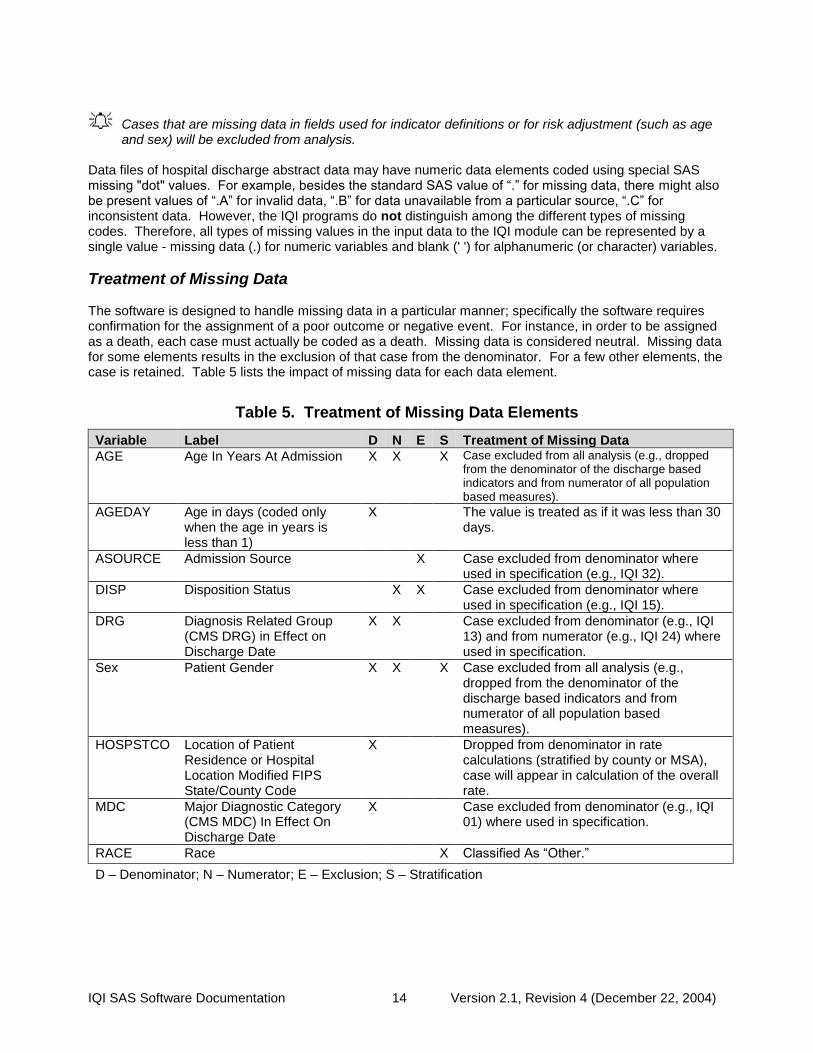
Treatment of Missing Data The software is designed to handle missing data in a particular manner; specifically the software requires confirmation for the assignment of a poor outcome or negative event. For instance, in order to be assigned as a death, each case must actually be coded as a death. Missing data is considered neutral. Missing data for some elements results in the exclusion of that case from the denominator. For a few other elements, the case is retained. Table 5 lists the impact of missing data for each data element.
Table 5. Treatment of Missing Data Elements
Variable Label D N E S Treatment of Missing Data
AGE Age In Years At Admission X X X Case excluded from all analysis (e.g., dropped from the denominator of the discharge based indicators and from numerator of all population based measures).
AGEDAY Age in days (coded only when the age in years is less than 1)
X The value is treated as if it was less than 30 days.
ASOURCE Admission Source X Case excluded from denominator where used in specification (e.g., IQI 32).
DISP Disposition Status X X Case excluded from denominator where used in specification (e.g., IQI 15).
DRG Diagnosis Related Group (CMS DRG) in Effect on Discharge Date
X X Case excluded from denominator (e.g., IQI 13) and from numerator (e.g., IQI 24) where used in specification.
Sex Patient Gender X X X Case excluded from all analysis (e.g., dropped from the denominator of the discharge based indicators and from numerator of all population based measures).
HOSPSTCO Location of Patient Residence or Hospital Location Modified FIPS State/County Code
X Dropped from denominator in rate calculations (stratified by county or MSA), case will appear in calculation of the overall rate.
MDC Major Diagnostic Category (CMS MDC) In Effect On Discharge Date
X Case excluded from denominator (e.g., IQI 01) where used in specification.
RACE Race X Classified As “Other.”
D – Denominator; N – Numerator; E – Exclusion; S – Stratification

IQI SAS Software Documentation 15 Version 2.1, Revision 4 (December 22, 2004)
User Options The IQI software reflects the development and implementation of the software with discharge data available to AHRQ through the HCUP program. The goal was to develop the tools, illustrate their use, and then encourage others to adopt and use the tools for their own applications. As a result, users are encouraged to consider how AHRQ may modify or enhance the IQI software to better serve their measurement needs and interests.
Modifications to the definitions of outcomes of interest (numerators) or populations at risk (denominators) are possible but not desirable. Maintaining consistent definitions is important. Once definitions are altered, the ability to make comparisons of IQIs based on original definitions is lost. Users are encouraged to identify ways to improve the IQI methodology and to share their suggestions with AHRQ for future updates.
In the near future, AHRQ will be providing national estimates using the IQIs through its web-based query system, HCUPnet (http://hcup.ahrq.gov/HCUPnet.asp). If users change definitions of the IQIs, it will not be possible to compare users’ results to the national estimates in HCUPnet.

IQI SAS Software Documentation 16 Version 2.1, Revision 4 (December 22, 2004)
Producing Inpatient Quality Indicator Rates: Processing Steps Each Inpatient Quality Indicator (IQI) expressed as a rate, is simply defined as:
Outcome of interest / Population at risk
[or]
Numerator / Denominator Conceptually, five steps are necessary to produce the IQI rates. The following describes the steps and how the software performs them.
1. Identify outcomes in inpatient records
Inpatient records are marked to indicate whether they contain the outcome of interest (numerator or “top”) for each of the AHRQ IQI measures.
This is done by setting a series of flag variables, each of which corresponds to the numerator for a particular IQI. For example, if the inpatient record meets the conditions for inclusion in the outcome for IQI #1, then the outcome indicator for IQI #1 is set to one.
This step requires one pass through the discharge-level data and outputs a discharge-level data file containing the flag indicator variables for the outcomes for each IQI. This output file also contains the original input variables, with the exception of the diagnosis and procedure variables which have been removed to reduce the size of the output file. The first seven Inpatient Quality Indicators are volume measures, and for these QIs this first step is all that is necessary. The remaining steps two though five are relevant for the remaining indicators which are rates as opposed to total volume measures.
2. Identify populations at risk
For the Provider IQIs, the populations at risk (the denominators for calculating the IQI rates, or "pop") are derived from the hospital discharge records.
For the four Area IQIs, the populations at risk (the denominators for calculating the IQI rates) are derived from Census population figures.
3. Calculate observed (raw) Inpatient Quality Indicator rates
Using the output data from step 1 and either hospital discharge or U.S. Census population data from step 2, the IQI rates are calculated for user-specified combinations of stratifiers. These stratifiers include hospitals, age groups, race/ethnicity categories, sex, and payer categories for the Provider IQIs, and areas (MSAs/counties), age groups, race/ethnicity categories, and sex for the Area IQIs.
The programs calculate observed IQI rates regardless of the number of cases available. However, IQI rates based on only a few cases should be interpreted with caution.
In performance measurement work, it is recommended that rates be suppressed when there are fewer than 30 cases in the denominator. This exclusion rule serves two purposes:
• It eliminates unstable estimates based on too few cases.
• It helps protect the identities of hospitals and patients.

IQI SAS Software Documentation 17 Version 2.1, Revision 4 (December 22, 2004)
This step outputs the observed rates for user-specified categories, alone or in combination. For example, Provider IQI observed rates could be output at the hospital level, at the payer level, or at the hospital level by payer.
4. Risk adjust the Inpatient Quality Indicator rates
Overall file means and regression coefficients from a baseline database (reflecting a large proportion of the U.S. population) are applied to the observed rates in the risk-adjustment process. These baseline file means and regression coefficients are provided as part of the IQI module. The risk-adjusted rates will then reflect the age and sex distribution (and the APR-DRG distribution for the provider indicators) of data in the baseline file rather than the distribution for the hospitals or areas present in the users’ data. This will allow risk-adjusted rates produced by various users to be compared directly to one another. The overall means and regression coefficients were derived from HCUP’s Year 2002 State Inpatient Data (SID) for 35 states. The code to generate these baseline means and coefficients are not part of the IQI module.
For the provider indicators, if there are fewer than three discharges for the particular IQI for a particular combination of stratifiers, then the risk-adjusted rate for that combination of stratifiers is set to missing.
5. Create MSX smoothed rates
Shrinkage factors are applied to the risk-adjusted rates for each IQI in a process called multivariate signal extraction (MSX). These shrinkage factors were calculated from the HCUP Year 2002 SID of 35 states. For each IQI, the shrinkage estimate reflects a ‘reliability adjustment’ unique to each indicator. The less reliable the IQI over time and across hospitals or areas, the more the estimate ‘shrinks’ the IQI toward the overall area mean. The resulting rate will appear “smoother” than the raw rate, meaning the year-to-year fluctuations in performance are likely to be reduced. More information on interpreting smoothed rates is contained in the interpretation section of this document. The shrinkage factors are provided as part of the IQI software and do not need to be calculated by users.
These five steps reflect the IQI module production in a nutshell. The next section of this document describes the specifics of each software component of the IQI module software.

IQI SAS Software Documentation 18 Version 2.1, Revision 4 (December 22, 2004)
Program Descriptions This section describes the seven SAS programs that assign, calculate, and print the Inpatient Quality Indicators. For each program there is a description, a list of input and output files, and an explanation of changes to the program that may be required. The flow of data through the IQI module programs is shown in the flowcharts in Figure 1 and Figure 2 that begin on page 3. If you desire to create and examine observed IQI rates, then the IQFMTS, CONTROL_IQI, and the IQSAS1 programs will need to be used, followed by IQSASP2 (for Provider observed rates and volume indicators) and/or IQSASA2 (for Area observed rates). If you also wish to create risk-adjusted and smoothed IQI rates, then you will also need to run the IQSASP3 and/or the IQSASA3 program.
Program 1: Modify Statements in the CONTROL_IQI.SAS Code The CONTROL_IQI.SAS code contains all of the SAS statements that you need to modify in order to run the remaining IQI module programs (with one exception noted below). This is where you specify, for example, the path names or locations of all your input and output data sets. There is also a TITLE line that the user can fill in. The items that need to be changed in order to run the IQSAS1, IQSASP2, IQSASP3, IQSASA2, and IQSASA3 programs are described below under each program.
The CONTROL_IQI.SAS code is automatically inserted into the remaining programs when they are executed. You do not need to run CONTROL_IQI.SAS as a separate program.
All of the changes needed for the CONTROL_IQI.SAS code are listed in the following descriptions for programs 2 – 7. Each program description contains a section labeled “Changes:” that enumerates the modifications for CONTROL_IQI.SAS that are associated with that particular program.
Lines of code to be modified are identified by the phrase “<===USER MUST modify” which means the user must make the change or by “<===USER MAY modify” which means the modification is optional.
In all of the remaining programs included with the IQI module, there is one line of code near the beginning of each program that needs to be modified. This line of code starts with the phrase "FILENAME CONTROL". You must modify this line to point to the path name where you stored your modified copy of the CONTROL_IQI.SAS file. CONTROL_IQI.SAS has a collection of parameters that allow you to read in data from and write out data to different locations or pathnames. For example, “LIBNAME1 IN1” points to the location of your input data set for program IQSAS1 and “LIBNAME OUT1” points to the location of the output data set created by the IQSAS1 program. The parameters allow these locations to be different from one another. However, if you wish to read in and write out all of the data to the same location, it is easiest to just make a global change in CONTROL_IQI.SAS changing “C:\pathname” to the single directory location that you wish to use. There is a global PRINT parameter in CONTROL_IQI.SAS that as a default prints all of the output summary records at the end of the IQSASP2, IQSASP3, IQSASA2, and IQSASA3 programs. These printouts may be quite large if you have a large database with a large number of hospitals and if you choose the results to be finely stratified. If you wish to turn these prints off, set PRINT to have a value of zero in CONTROL_IQI.SAS.
The global MSALEVL parameter in CONTROL_IQI.SAS by default instructs all programs to define geographic areas by county for all areas in the input datasets. To define urban areas by Metropolitan Statistical Area (MSA) rather than by county, change the MSALEVL parameter from 0 to 1.

IQI SAS Software Documentation 19 Version 2.1, Revision 4 (December 22, 2004)
Program 2: Run IQFMTS The IQFMTS program defines a format library, which contains the diagnosis and procedure screens necessary for assigning the outcomes of interest. This format library is used by most of the succeeding programs. The first few formats in this program are for the stratifiers (age, sex, race/ethnicity, payer). These are followed by formats that are used for the identification of outcomes of interest in the IQSAS1 program, and by formats that map FIPS county codes to metropolitan statistical areas (MSAs) in the IQSAS1 and IQSASA2 programs. At the end of the program are formats used to assign age categories for the risk adjustment process implemented in IQSASP3 and IQSASA3, and formats used with APR-DRG categories in IQSASP3. The MSA definitions are from July 28, 2003 according to the federal Office of Management and Budget (OMB) circular 99-04, (Last Revised May 6, 2002). The mapping is from county to MSA, except in New England where counties are assigned to NECMAs (New England County Metropolitan Area). OMB defines NECMAs as a county-based alternative to the city- and town-based New England MSAs and CMSAs (Consolidated MSAs). For example, Hampden and Hampshire counties in Western Massachusetts are assigned to the Springfield MA NECMA, even though Holland town in Hampden County is part of the Boston MSA. The IQI module Version 2.1, Revision 4, contains formats that incorporate ICD-9-CM and DRG coding through September 30, 2005. Input: None. Output: Permanent SAS format library (FMTLIB). Changes:
1. You must modify the “FILENAME CONTROL” statement at the beginning of the program to change the path so that it points to your location of the CONTROL_IQI.SAS code.
2. In CONTROL_IQI.SAS, specify the location (path) of the format library in the “LIBNAME
LIBRARY” statement.
Program 3: Run IQSAS1 The IQSAS1 program processes hospital discharge abstract data and flags inpatient records if they contain outcomes of interest. Outcome indicator names, or numerators, have prefix of “T” (Top). Stratifier variables are constructed at the beginning of the program. This program assumes that the input data file (consisting of inpatient discharge abstract data) conforms to specific variable names, attributes, and coding conventions. See Table 4 on page 11 for variable names and attributes for the input data file. Partial definitions of the Inpatient Quality Indicators are given in Table 1 on page 5. This table is presented to assist those individuals who desire to examine the software source code statements. Complete definitions of the indicators are given in Appendix A of the “Guide to Inpatient Quality Indicators” (http://www.qualityindicators.ahrq.gov/iqi_download.htm). Input:
1. User supplied SAS inpatient data set consisting of administrative hospital discharge abstract data. This data set is a discharge level file with an array of diagnosis and procedure codes, among other data elements.
2. SAS format library (FMTLIB) created from the IQFMT program.

IQI SAS Software Documentation 20 Version 2.1, Revision 4 (December 22, 2004)
Output:
1. SAS dataset containing inpatient records with input variables, stratifiers, and flag indicators (TPIQxx and TAIQxx) for the outcomes of interest that will later form the numerators for the IQI rates.
2. PROC MEANS (with N, NMISS, MIN, MAX, MEAN, and SUM) of all of the numeric variables in
the output data file and a PROC CONTENTS of the output data file are output to hardcopy.
3. A PROC PRINT of the first 24 observations in the output data file is output to hardcopy. Changes:
1. The “FILENAME CONTROL” statement at the beginning of the program must be changed to reflect the location of the CONTROL_IQI.SAS code.
2. In CONTROL_IQI.SAS, specify the locations (paths) of the input and output files in the
“LIBNAME IN1” and “LIBNAME OUT1” statements.
3. In CONTROL_IQI.SAS, specify the names of the input and output files in the “INFILE1” and “OUTFILE1” statements.
4. To define urban areas by MSA rather than by county, change the MSALEVL parameter in
CONTROL_IQI.SAS from 0 to 1. Rural areas will be defined by county no matter how MSALEVL is specified.
5. The IQI module assumes that your starting SAS data set contains 30 diagnoses, and 30 procedures. If these numbers are different in your input inpatient data, then modify the NDX and NPR parameters in CONTROL_IQI.SAS.
6. If your variables are named differently from those used in the IQI software (see Table 4 on page 11), you MUST either rename those variables prior to running this program or modify IQSAS1 to include the renaming of your variables to match those expected by the software. Similarly, if your variables are not the same type, i.e., character or numeric, as those expected by the software (see Table 4), you MUST modify your variables prior to running this program.
7. If you wish to utilize APR-DRG variables in the later IQSASP3 program to risk-adjust the
provider indicators, then in CONTROL_IQI.SAS, set the APRDRGFG flag parameter to one. If you do not intend to run IQSASP3 to risk-adjust the provider indicators or if you do not have the APR-DRG variables available to you, then set APRDRGFG to zero. See Table 6 below.
8. If you wish to risk-adjust the provider indicators by later running the IQSASP3 program, then in
CONTROL_IQI.SAS, set the three APRDRG, SEVERE, and MORTAL parameters to be the names of the DRG category variable, the severity measure, and the mortality indicator created by APR-DRG software. If you do not intend to utilize APR-DRG software, then set the three APRDRG, SEVERE, and MORTAL parameters to equal zero. See Table 6 below.
9. The YEARQTR parameter specifies whether the input data file contains the variables Year and
DQTR (patient year and quarter of discharge). If the input data includes these data elements and the user wishes to exclude cases with ICD-9 code 436 from the denominator population of IQI 17 (stroke mortality), the YEARQTR flag should be set to “yes” (YEARQTR=’yes’). If the data elements are not present or if the user wants to include patients with the ICD-9 code 436 (valid through October 1, 2004) in the denominator population, the YEARQTR flag should be set to “no” (YEARQTR=’no’).
IQI SAS Software Documentation 21 Version 2.1, Revision 4 (December 22, 2004)
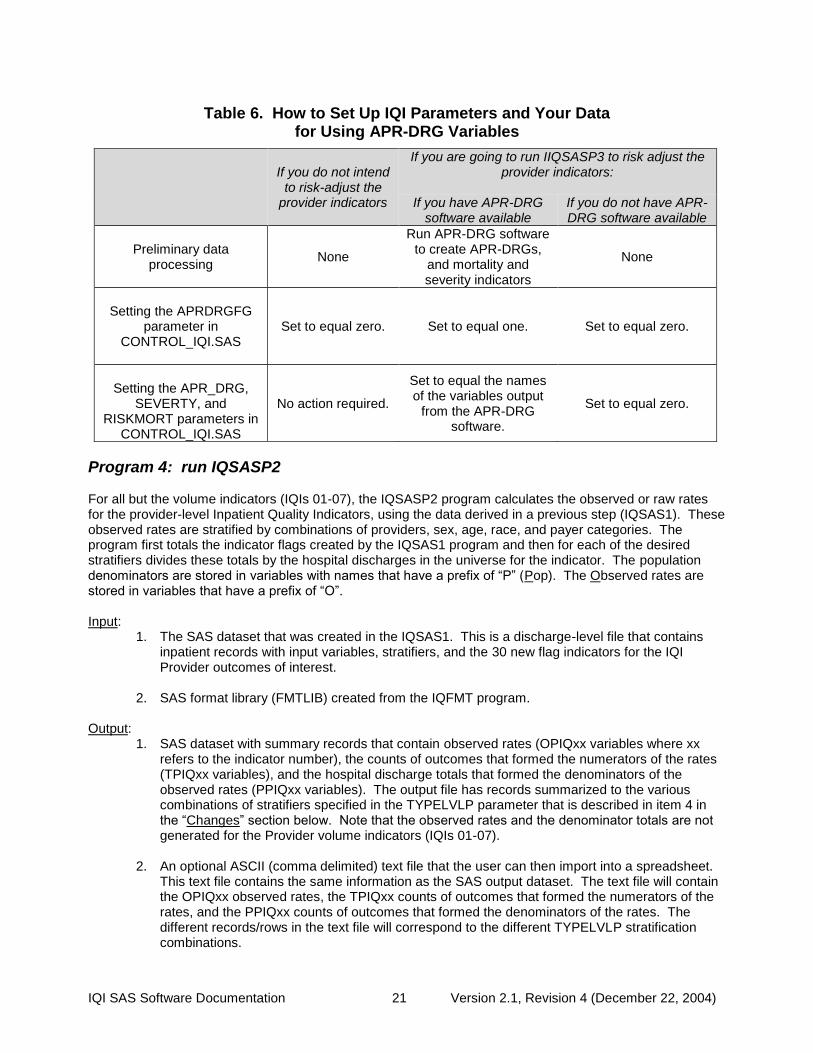
Table 6. How to Set Up IQI Parameters and Your Data for Using APR-DRG Variables
If you do not intend
to risk-adjust the provider indicators
If you are going to run IIQSASP3 to risk adjust the provider indicators:
If you have APR-DRG
software available If you do not have APR-DRG software available
Preliminary data processing
None
Run APR-DRG software to create APR-DRGs,
and mortality and severity indicators
None
Setting the APRDRGFG
parameter in CONTROL_IQI.SAS
Set to equal zero. Set to equal one. Set to equal zero.
Setting the APR_DRG,
SEVERTY, and RISKMORT parameters in
CONTROL_IQI.SAS
No action required.
Set to equal the names of the variables output
from the APR-DRG software.
Set to equal zero.
Program 4: run IQSASP2 For all but the volume indicators (IQIs 01-07), the IQSASP2 program calculates the observed or raw rates for the provider-level Inpatient Quality Indicators, using the data derived in a previous step (IQSAS1). These observed rates are stratified by combinations of providers, sex, age, race, and payer categories. The program first totals the indicator flags created by the IQSAS1 program and then for each of the desired stratifiers divides these totals by the hospital discharges in the universe for the indicator. The population denominators are stored in variables with names that have a prefix of “P” (Pop). The Observed rates are stored in variables that have a prefix of “O”. Input:
1. The SAS dataset that was created in the IQSAS1. This is a discharge-level file that contains inpatient records with input variables, stratifiers, and the 30 new flag indicators for the IQI Provider outcomes of interest.
2. SAS format library (FMTLIB) created from the IQFMT program.
Output:
1. SAS dataset with summary records that contain observed rates (OPIQxx variables where xx refers to the indicator number), the counts of outcomes that formed the numerators of the rates (TPIQxx variables), and the hospital discharge totals that formed the denominators of the observed rates (PPIQxx variables). The output file has records summarized to the various combinations of stratifiers specified in the TYPELVLP parameter that is described in item 4 in the “Changes” section below. Note that the observed rates and the denominator totals are not generated for the Provider volume indicators (IQIs 01-07).
2. An optional ASCII (comma delimited) text file that the user can then import into a spreadsheet.
This text file contains the same information as the SAS output dataset. The text file will contain the OPIQxx observed rates, the TPIQxx counts of outcomes that formed the numerators of the rates, and the PPIQxx counts of outcomes that formed the denominators of the rates. The different records/rows in the text file will correspond to the different TYPELVLP stratification combinations.
IQI SAS Software Documentation 22 Version 2.1, Revision 4 (December 22, 2004)
3. A PROC MEANS (with N, NMISS, MIN, MAX, MEAN, and SUM) of the provider-level summary records that shows statistics for the OPIQxx observed rates, the TPIQxx counts of outcomes that formed the numerators of the rates, and the PPIQxx counts of outcomes that formed the denominators of the rates. These means will only be generated if the user included a value of 16 for the TYPELVLP parameter discussed in item 4 in the “Changes” section below.
4. A PROC CONTENTS of the output SAS summary dataset is output to hardcopy.
5. A PROC PRINT of the output summary dataset is provided at the end of the hardcopy printout.
This printout may be quite large depending on the number and the types of stratifications that the user requests with the TYPELVLP parameter discussed in item 4 in the “Changes” section below. If the user does not wish to generate this printout, then the global “PRINT” parameter in CONTROL_IQI.SAS code should be set to zero.
Changes:
1. The “FILENAME CONTROL” statement at the beginning of the program must be changed to reflect the location of the CONTROL_IQI.SAS code.
2. In CONTROL_IQI.SAS, specify the locations (paths) of the input and output SAS files in the
“LIBNAME INP2” and “LIBNAME OUTP2” statements.
3. In CONTROL_IQI.SAS, specify the names of the input and output files in the “INFILEP2” and “OUTFILP2” statements. The name that you specify with INFILEP2 should be for the file that you created using the IQSAS1 program.
4. In CONTROL_IQI.SAS, specify the levels of aggregation for the observed rates. This is done
by specifying numbers between 0 and 31 in the “%LET TYPELVLP =” statement. Each number from 0 to 31 corresponds to a different level or combination of levels as show in Table 7. The default values of 0, 16, will provide an overall total and provider-level totals.
If TYPELVLP includes the value 0, then the first observation in the output summary datafile will contain the overall totals and observed rates for the entire database created with the IQSAS1 program.

IQI SAS Software Documentation 23 Version 2.1, Revision 4 (December 22, 2004)
Table 7. IQSASP2 Aggregation Possibilities
TYPELVLP Stratification
0 Overall
1 Race
2 Payer
3 Payer * Race
4 Sex
5 Sex * Race
6 Sex * Payer
7 Sex * Payer * Race
8 Age
9 Age * Race
10 Age * Payer
11 Age * Payer * Race
12 Age * Sex
13 Age * Sex * Race
14 Age * Sex * Payer
15 Age * Sex * Payer * Race
16 Provider
17 Provider * Race
18 Provider * Payer
19 Provider * Payer * Race
20 Provider * Sex
21 Provider * Sex * Race
22 Provider * Sex * Payer
23 Provider * Sex * Payer * Race
24 Provider * Age
25 Provider * Age * Race
26 Provider * Age * Payer
27 Provider * Age * Payer * Race
28 Provider * Age * Sex
29 Provider * Age * Sex * Race
30 Provider * Age * Sex * Payer
31 Provider * Age * Sex * Payer * Race
0 and 16 TYPELVLP (overall and provider) are default values for the level of computation in the software.
For example, if you are using a state inpatient hospital database, you might specify the following TYPELVLP values: 0 – provides overall rates for your entire state 8 – provides overall rates for your state, broken down by age groups 16 – provides rates for providers within your state 24 – provides rates for age groups within these providers
IQI SAS Software Documentation 24 Version 2.1, Revision 4 (December 22, 2004)
5. In CONTROL_IQI.SAS, if you wish to create an ASCII (comma delimited) text file that you can import into a spreadsheet, then set the TEXTP2 parameter to 1. Otherwise, the default value of zero for TEXTP2 will skip around the code that would generate this file.
6. In CONTROL_IQI.SAS, if you wish to create an ASCII (comma delimited) text file that you can import
into a spreadsheet, then specify the path (including the file name) for this ASCII text file in the "FILENAME IQTEXTP2” statement.
Program 5: Run IQSASP3 The IQSASP3 program calculates risk-adjusted rates by patient age, sex and APR-DRG, if available, for each IQI and then calculates smoothed rates. The risk-adjusted and smoothed rates are not calculated for the Provider volume indicators, IQIs 01-07, just as observed rates were not calculated for these indicators.
When there are fewer than three discharges within a stratification cell, the risk-adjusted and expected rates are set to missing. The smoothed rates that are based on these risk-adjusted rates are also set to missing.
The output file has records summarized to the various combinations of stratifiers that were specified in the TYPELVLP parameter of the preceding IQSASP2 program. See Table 7 on page 23. Input:
1. SAS format library (FMTLIB) created from the IQFMT program. 2. The discharge-level file that was created with the IQSAS1 program.
3. The SAS dataset with summary records that was created with the IQSASP2 program. 4. A text file (COVIQP02.TXT) containing regression coefficients from a regression that was run on
a reference SID dataset. These coefficients will be used in the risk adjustment process. This file is provided to you as part of the IQI module. The text file does not need to be converted to a SAS file for use with the software.
5. A text file (MSXIQP02.TXT) containing three arrays for use in the smoothing process. The
arrays contain noise estimates, signal estimates, and mean area rates for each IQI. This file is provided to you as part of the IQI module. The text file does not need to be converted to a SAS file for use with the software.
Output:
1. A SAS dataset with an overall summary record and with provider-level summary records that contain the three types of indicator rates, along with the components of the initial raw rates. Specifically, the file contains the observed rates (OPIQxx variables), the risk-adjusted rates (RPIQxx variables), the smoothed rates (SPIQxx variables), the expected rates (EPIQxx variables), the counts of outcomes that formed the numerators of the observed rates (TPIQxx variables), and the hospital discharge totals that formed the denominators of the observed rates (PPIQxx variables).
2. An optional ASCII (comma delimited) text file that the user can then import into a spreadsheet.
This text file contains the same information as the SAS output dataset. The text file will contain the OPIQxx observed rates and their TPIQxx and PPIQxx numerator and denominator components, the RPIQxx risk-adjusted rates, the SPIQxx smoothed rates, and the EPIQxx expected rates. Each record or row in the text file will correspond to a specification group.
3. A PROC MEANS (with N, NMISS, MIN, MAX, MEAN, and SUM) of the provider-level summary
records that shows statistics for the observed, risk-adjusted and smoothed rates, and statistics for the counts of outcomes that formed the numerators and denominators of the observed rates.
IQI SAS Software Documentation 25 Version 2.1, Revision 4 (December 22, 2004)
These means will only be generated if the user included a value of 16 for the TYPELVLP parameter of the preceding IQSASP2 program. See Table 7 on page 23.
4. A PROC CONTENTS of the output SAS summary dataset is output to hardcopy.
5. A PROC PRINT of the output summary dataset is provided at the end of the hardcopy printout.
This printout may be quite large depending on the number and the types of stratifications that the user requested with the TYPELVLP parameter of the preceding IQSASP2 program. See Table 7 on page 23. If the user does not wish to generate this printout, then the global “PRINT” parameter in CONTROL_IQI.SAS code should be set to zero.
Changes:
1. The “FILENAME CONTROL” statement at the beginning of the program must be changed to reflect the location of the CONTROL_IQI.SAS code.
2. In CONTROL_IQI.SAS, specify the locations (paths) of the input and output SAS files in the
“LIBNAME INP3” and “LIBNAME OUTP3” statements.
3. In CONTROL_IQI.SAS, specify in the “INFILP3X” statement the name of the discharge-level file that you created with the IQSAS1 program.
4. In CONTROL_IQI.SAS, specify in the "FILENAME COVARP" statement the path (including the
file name) for the ASCII text file that contains regression coefficients from a regression that was run on the reference SID dataset. This file is provided as part of the IQI module. The name of the file is COVIQP02.TXT.
5. In CONTROL_IQI.SAS, specify in the "FILENAME MSXP" statement the path (including the file
name) for the ASCII text file that contains the estimates to smooth the indicator rates. This file is provided as part of the IQI module. The name of the file is MSXIQP02.TXT.
6. In CONTROL_IQI.SAS, specify in the “INFILP3Y” statement the name of the summary file that
you created with the IQSASA2 program.
7. In CONTROL_IQI.SAS, specify in the “OUTFILP3” statement the name that you wish the output file to have.
8. In CONTROL_IQI.SAS, if you wish to create an ASCII (comma delimited) text file that you can
import into a spreadsheet, then set the TEXTP3 parameter to 1. Otherwise, the default value of zero for TEXTA3 will skip around the code that would generate this file.
9. In CONTROL_IQI.SAS, if you wish to create an ASCII (comma delimited) text file that you can
import into a spreadsheet, then specify the path (including the file name) for this ASCII text file in the "FILENAME IQTEXTP3” statement.
IQI SAS Software Documentation 26 Version 2.1, Revision 4 (December 22, 2004)
Program 6: Run IQSASA2 The IQSASA2 program calculates the observed or raw rates for the area-level Inpatient Quality Indicators, using the data derived in a previous step (IQSAS1). These observed rates can be stratified by combinations of area, sex, age, and race categories. The program first totals the four area indicator flags created by the IQSAS1 program, and then for each of the desired stratifiers divides these totals by the pertinent residential population. The population denominators are stored in variables with names that have a prefix of “P” (Pop). The Observed rates are stored in variables that have a prefix of “O”. Input:
1. The SAS dataset that was created in the IQSAS1. This is a discharge-level file that contains inpatient records with input variables, stratifiers, and the four new flag indicators for the IQI Area outcomes of interest.
2. A text file with Census area residential populations, stratified by area, age, sex, and ethnicity
categories. Seven such files are currently provided along with the IQI module software. The files are QICTY97, QICTY98, QICTY99, QICTY00, QICTY01, QICTY02, and QICTY03. The user should select the file for the year that best matches the user’s discharge datafile.
Users do not need to convert the ASCII text file to a SAS dataset for use with the software.
3. SAS format library (FMTLIB) created from the IQFMT program.
Output:
1. SAS dataset with summary records that contain observed rates (OAIQxx variables where xx refers to the indicator number), the counts of outcomes that formed the numerators of the rates (TAIQxx variables), and the residential population totals that formed the denominators of the observed rates (PAIQxx variables). The output file has records summarized to the various combinations of stratifiers specified in the TYPELVLA parameter that is described in item 5 in the “Changes” section below.
2. An optional ASCII (comma delimited) text file that the user can then import into a spreadsheet.
This text file contains the same information as the SAS output dataset. The text file will contain the OAIQxx observed rates, the TAIQxx counts of outcomes that formed the numerators of the rates, and the PAIQxx residential population totals. The different records/rows in the text file will correspond to the different TYPELVLA stratification combinations.
3. A PROC MEANS (with N, NMISS, MIN, MAX, MEAN, and SUM) of the area-level summary
records that shows statistics for the OAIQxx observed rates, the TAIQxx counts of outcomes that formed the numerators of the rates, and the PAIQxx residential populations totals. These means will only be generated if the user included a value of 8 for the TYPELVLA parameter discussed in item 5 in the “Changes” section below.
4. A PROC CONTENTS of the output SAS summary dataset is output to hardcopy.
5. A PROC PRINT of the output summary dataset is provided at the end of the hardcopy printout.
This printout may be quite large depending on the number and the types of stratifications that the user requests with the TYPELVLA parameter discussed in item 5 in the “Changes” section below. If the user does not wish to generate this printout, then the global “PRINT” parameter in CONTROL_IQI.SAS code should be set to zero.

IQI SAS Software Documentation 27 Version 2.1, Revision 4 (December 22, 2004)
Changes: 1. The “FILENAME CONTROL” statement at the beginning of the program must be changed to
reflect the location of the CONTROL_IQI.SAS code. 2. In CONTROL_IQI.SAS, specify the locations (paths) of the input and output SAS files in the
“LIBNAME INA2” and “LIBNAME OUTA2” statements.
3. In CONTROL_IQI.SAS, specify the names of the input and output files in the “INFILEA2” and “OUTFILA2” statements. The name that you specify with INFILEA2 should be for the file that you created using the IQSAS1 program.
4. In CONTROL_IQI.SAS, specify the path (including the file name) for the ASCII population text
file in the "FILENAME POPFILA2" statement. The file name will be QICTY97.TXT, QICTY98.TXT, QICTY99.TXT, QICTY00.TXT, QICTY01.TXT, QICTY02.TXT, or QICTY03.TXT. These files are provided to you as part of the IQI module. The file used should be the one that is closest to the year associated with your particular data.
5. In CONTROL_IQI.SAS, specify the levels of aggregation for the observed rates. This is done
by specifying numbers between 0 and 15 in the “%LET TYPELVLA =” statement. Each number from 0 to 15 corresponds to a different level or combination of levels as show in Table 8. The default values of 0, 8 will provide an overall total and area-level totals.
WARNING: TYPELVLA must include the values 0 (overall) and 8 (area) if you wish to subsequently run program IQSASA3 for risk-adjusted and smoothed rates.
If TYPELVLA includes the value 0, then the first observation in the output summary datafile will contain the overall totals and observed rates for the entire database created with the IQSAS1 program.
Table 8. IQSASA2 Aggregation Possibilities
TYPELVLA Stratification 0 Overall
1 Race
2 Sex
3 Sex * Race
4 Age
5 Age * Race
6 Age * Sex
7 Age * Sex * Race
8 Area
9 Area * Race
10 Area * Sex
11 Area * Sex * Race
12 Area * Age
13 Area * Age * Race
14 Area * Age * Sex
15 Area * Age * Sex * Race
0 and 8 TYPELVLA (overall and area) are default values for the level of computation in the software.
For example, if you are using a state inpatient hospital database, you might specify the following TYPELVLA values: 0 – provides overall rates for your entire state

IQI SAS Software Documentation 28 Version 2.1, Revision 4 (December 22, 2004)
4 – provides overall rates for your state, broken down by age groups 8 – provides rates for areas within your state 12 – provides rates for age groups within these areas
6. In CONTROL_IQI.SAS, if you wish to create an ASCII (comma delimited) text file that you can
import into a spreadsheet, then set the TEXTA2 parameter to 1. Otherwise, the default value of zero for TEXTA2 will skip around the code that would generate this file.
7. In CONTROL_IQI.SAS, if you wish to create an ASCII (comma delimited) text file that you can
import into a spreadsheet, then specify the path (including the file name) for this ASCII text file in the "FILENAME IQTEXTA2” statement.
Program 7: Run IQSASA3 The IQSASA3 program calculates age and sex risk-adjusted rates for each area-based IQI (overall rates and rates by area), and then calculates smoothed rates. Input:
1. SAS format library (FMTLIB) created from the IQFMT program. 2. The discharge-level file that was created with the IQSAS1 program.
3. The SAS dataset with summary records that was created with the IQSASA2 program.
4. A text file with Census area residential populations, stratified by area, sex, and discrete age
categories. Seven files are currently provided along with the IQI module software. The files are QICTYA97, QICTYA98, QICTYA99, QICTYA00, QICTYA01, QICTYA02, and QICTYA03. The user should select the file for the year that best matches the user’s discharge data file. The text file does not need to be converted to a SAS file for use with the software.
5. A text file (MNSIQA02.TXT) containing overall means from the reference SID dataset for use in
the risk adjustment process. This file is provided to you as part of the IQI module. The text file does not need to be converted to a SAS file for use with the software.
6. A text file (COVIQA02.TXT) containing regression coefficients from a regression that was run on
the reference SID dataset. These coefficients will be used in the risk adjustment process. This file is provided to you as part of the IQI module. The text file does not need to be converted to a SAS file for use with the software.
7. A text file (MSXIQA02.TXT) containing three arrays for use in the smoothing process. The
arrays contain noise estimates, signal estimates, and mean area rates for each IQI. This file is provided to you as part of the IQI module. The text file does not need to be converted to a SAS file for use with the software.
Output:
1. A SAS dataset with an overall summary record and with area-level summary records that contain the three types of indicator rates, along with the components of the initial raw rates. Specifically, the file contains the observed rates (OAIQxx variables), the risk-adjusted rates (RAIQxx variables), the smoothed rates (SAIQxx variables), the counts of outcomes that formed the numerators of the observed rates (TAIQxx variables), and the residential population totals that formed the denominators of the observed rates (PAIQxx variables).
2. An optional ASCII (comma delimited) text file that the user can then import into a spreadsheet.
This text file contains the same information as the SAS output dataset. The text file will contain the OAIQxx observed rates and their TAIQxx and PAIQxx components, the RAIQxx risk-adjusted rates, and the SAIQxx smoothed rates. Each record or row in the text file will correspond to a different area.

IQI SAS Software Documentation 29 Version 2.1, Revision 4 (December 22, 2004)
3. Output to hardcopy are PROC MEANS (with N, NMISS, MIN, MAX, MEAN, and SUM) of risk-
adjusted and smoothed rates in two intermediate work files and of all of the numeric variables in the final output data file. The printout also contains a PROC CONTENTS of the output SAS dataset. A PROC PRINT of the output dataset is provided only if the “PRINT” parameter in CONTROL_IQI.SAS code is set to one.
6. A PROC MEANS (with N, NMISS, MIN, MAX, MEAN, and SUM) of the area-level summary
records that shows statistics for the OAIQxx observed rates and their TAIQxx and PAIQxx components, the RAIQxx risk-adjusted rates, and the SAIQxx smoothed rates.
7. A PROC CONTENTS of the output SAS summary dataset is output to hardcopy.
8. A PROC PRINT of the output summary dataset is provided at the end of the hardcopy printout.
If the user does not wish to generate this printout, then the global “PRINT” parameter in CONTROL_IQI.SAS code should be set to zero.
Changes:
1. The “FILENAME CONTROL” statement at the beginning of the program must be changed to reflect the location of the CONTROL_IQI.SAS code.
2. In CONTROL_IQI.SAS, specify the locations (paths) of the input and output SAS files in the
“LIBNAME INA3” and “LIBNAME OUTA3” statements.
3. In CONTROL_IQI.SAS, specify in the “INFILA3X” statement the name of the discharge-level file that you created with the IQSAS1 program.
4. In CONTROL_IQI.SAS, specify the path (including the file name) for the ASCII population text
file in the "FILENAME POPFILE3" statement. The file name will be QICTYA97.TXT, QICTYA98.TXT, QICTYA99.TXT, QICTYA00.TXT, QICTYA01.TXT, QICTYA02.TXT, or QICTYA03.TXT. These files are provided along with the software. The file used should be the one that is closest to the year associated with your particular data. These files contain Census residential estimates by area, gender, and discrete age categories.
5. In CONTROL_IQI.SAS, specify in the "FILENAME MEANSA" statement the path (including the
file name) for the ASCII text file that contains overall means from the reference SID dataset. The name of the file is MNSIQA02.TXT.
6. In CONTROL_IQI.SAS, specify in the "FILENAME COVARA" statement the path (including the
file name) for the ASCII text file that contains regression coefficients from a regression that was run on reference SID dataset. The name of the file is COVIQA02.TXT.
7. In CONTROL_IQI.SAS, specify in the "FILENAME MSXA" statement the path (including the file
name) for the ASCII text file that contains the estimates to smooth the indicator rates. The name of the file is MSXIQA02.TXT.
8. In CONTROL_IQI.SAS, specify in the “INFILA3Y” statement the name of the summary file that
you created with the IQSASA2 program.
9. In CONTROL_IQI.SAS, specify in the “OUTFILA3” statement the name that you wish the output file to have.
10. In CONTROL_IQI.SAS, if you wish to create an ASCII (comma delimited) text file that you can
import into a spreadsheet, then set the TEXTA3 parameter to 1. Otherwise, the default value of zero for TEXTA3 will skip around the code that would generate this file.

IQI SAS Software Documentation 30 Version 2.1, Revision 4 (December 22, 2004)
11. In CONTROL_IQI.SAS, if you wish to create an ASCII (comma delimited) text file that you can import into a spreadsheet, then specify the path (including the file name) for this ASCII text file in the "FILENAME IQTEXTA3” statement.
Reviewing the Printed Output This section contains tips for reviewing some of the printed output from the IQI module. These tips are oriented toward explaining the interrelationships between printout items from different programs and hopefully will help to reveal the nature and structure of the module outputs. For guidance in interpreting the results, see the next section which begins on page 35.
The final output of the IQI module is a PROC PRINT from IQSASP3 (for provider-level indicators) and IQSASA3 (for area-level indicators). All interim printouts are for checking and trouble-shooting. However, if you have elected to refrain from risk-adjusting and smoothing the data, then the final outputs will be the PROC PRINT at the end of the IQSASP2 and/or IQSASA2 programs.
IQSAS1 The initial printout from the IQSAS1 program contains PROC MEANS for all of the numeric variables in the output discharge-level dataset. It will contain information for the newly constructed TAIQxx and TPIQxx flag variables that will later form the numerators for the indicator rates. For each TAIQxx and TPIQxx flag variable:
• The SUM will contain the total number of observations in the dataset that were found to have the particular outcome of interest.
• For the seven Provider volume indicators (TPIQ01-TPIQ07) and the four Area indicators (TAIQ26-TAIQ29), the MEAN, MINIMUM, and MAXIMUM will usually be the value one since the flag variables have either been set to missing (‘.’) or to a value of one. The remainder of the Provider indicators (TPIQ08-TPIQ25, and TPIQ30-TPIQ34) have a value of one, zero, or missing (‘.’). For these indicators, a value of zero was assigned to the TPIQxx flag if a particular observation was part of the population at risk for a particular indicator but did not have the particular outcome of interest. So for example, TPIQ21 = 1 indicates a patient who had a Cesarean section, while TPIQ21 = 0 identifies a patient who had a delivery but not a C-section.
• For the Provider indicators TPIQ08-TPIQ25 and TPIQ30-TPIQ34, the MEANs will contain a close approximation of the eventual overall observed indicator rates. The values will change slightly after IQSASP2 has applied additional parts of the indicator definitions.
• N lists the number of observations in the dataset with non-missing values. For the seven provider-based volume indicators and the four area-based indicators, N for TPIQxx or TAIQxx will be the same as the SUM. For the other provider-based indicators, N will contain the denominator for the observed indicator rate. Note: the N’s or denominators for seven of the mortality indicators (# 8-12, 30, and 31) will be similar to the Ns and SUMs for the seven volume indicators (TPIQ01-TPIQ07), but often they will not be exactly identical since the mortality indicators exclude discharges that were transferred to other hospitals.
The IQSAS1 printout also contains a PROC CONTENTS that lists all of the variables in the output dataset, including the character variables that are present, and a PROC PRINT of the first 24 observations in the output dataset.

IQI SAS Software Documentation 31 Version 2.1, Revision 4 (December 22, 2004)
IQSASP2 The purpose of this printout is to provide the observed rates for all provider-level indicators. The default printout shows results by provider, but other levels of output (as shown in Table 7) can be specified as well. Note that risk-adjusted and smoothed rates are shown in the output from the next program. The printout from the IQSASP2 program contains PROC MEANS on the provider-level summary records for all of the numeric variables in the output summary dataset. It will contain information for the newly constructed OPIQxx rates, the PPIQxx denominators, and the TPIQxx numerators.
• The _TYPE_ variable described in the MEANS table identifies the stratification level for the records in the output data set. The _TYPE_ variable corresponds to the TYPELVLP parameter values that were specified (see item 4 in the “Changes” section for the IQSASP2 program on page 27). In this case, _TYPE_ always assumes the value of 16, since only the provider-level records are selected.
• The N statistic for _TYPE_ contains the number of providers in the output summary data set. A TPIQxx numerator variable with a value for N that is lower than the N value for _TYPE_ indicates that there were no outcomes of interest for some of the providers. Similarly, a PPIQxx denominator variable with a lower value for N than _TYPE_ indicates that for some providers, there were no hospital discharges with the outcome of interest.
• The MINIMUM value for the TPIQ08-TPIQ25, TPIQ30, and TPIQ31 numerators will usually be zero since values of zero were assigned for observations that were part of the population for the rate denominator but did not have the particular outcome of interest to be included in the rate numerator. For the volume indicators, (TPIQ01-TPIQ07), the MINIMUM value will be one or higher.
For the observed rates, the User should NOT report the MEANS displayed here, but instead should refer to the overall means in the output dataset that are also present in the subsequent PROC PRINT. The MEANS given here are means of hospital means; i.e., all hospitals are given equal weight, regardless of the number of discharges in the different hospitals.
• The SUMs for the counter variables TPIQxx and PPIQxx will contain overall file totals for these data elements. The SUMs for the observed rates have no intuitive meaning.
If the “PRINT” parameter in the CONTROL_IQI.SAS program is set to one, the subsequent PROC PRINT output contains a complete dump of the output summary file. Listed for each record are the stratification values, the PPIQxx population denominators for the 30 provider indicators, the TPIQxx outcome numerators for the 30 provider indicators, and the 30 OPIQxx observed rates.
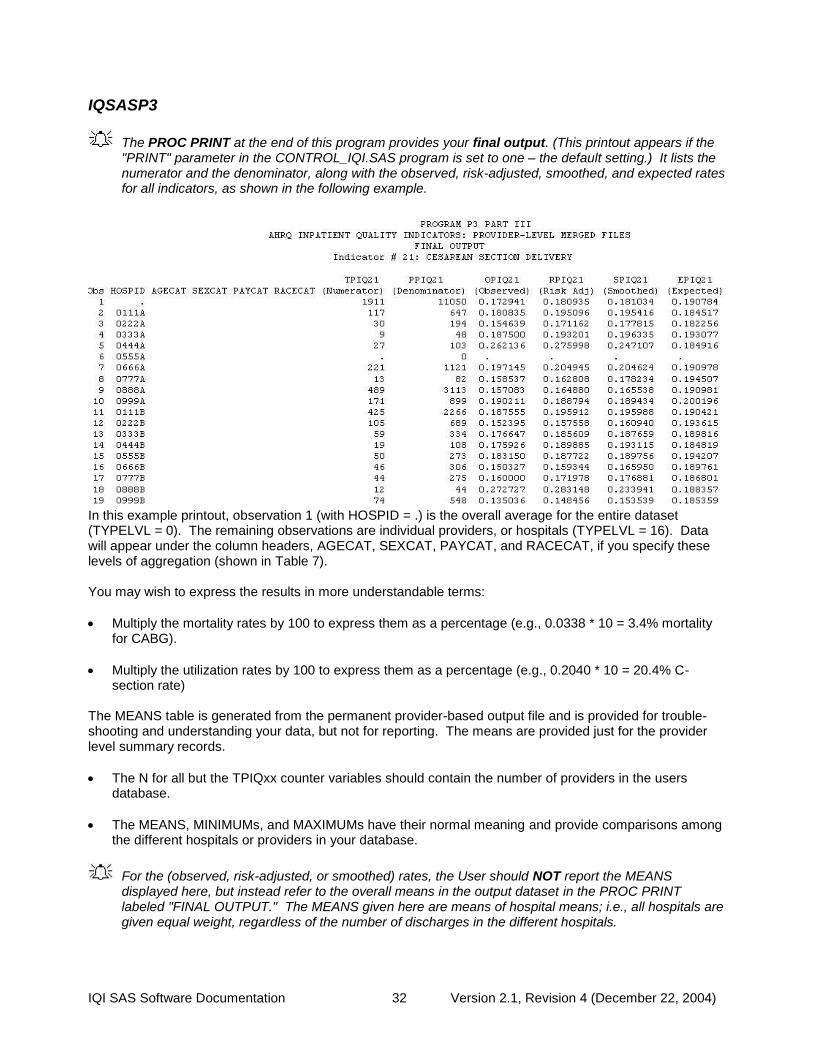
IQI SAS Software Documentation 32 Version 2.1, Revision 4 (December 22, 2004)
IQSASP3
The PROC PRINT at the end of this program provides your final output. (This printout appears if the "PRINT" parameter in the CONTROL_IQI.SAS program is set to one – the default setting.) It lists the numerator and the denominator, along with the observed, risk-adjusted, smoothed, and expected rates for all indicators, as shown in the following example.
In this example printout, observation 1 (with HOSPID = .) is the overall average for the entire dataset (TYPELVL = 0). The remaining observations are individual providers, or hospitals (TYPELVL = 16). Data will appear under the column headers, AGECAT, SEXCAT, PAYCAT, and RACECAT, if you specify these levels of aggregation (shown in Table 7). You may wish to express the results in more understandable terms:
• Multiply the mortality rates by 100 to express them as a percentage (e.g., 0.0338 * 10 = 3.4% mortality for CABG).
• Multiply the utilization rates by 100 to express them as a percentage (e.g., 0.2040 * 10 = 20.4% C-section rate)
The MEANS table is generated from the permanent provider-based output file and is provided for trouble-shooting and understanding your data, but not for reporting. The means are provided just for the provider level summary records.
• The N for all but the TPIQxx counter variables should contain the number of providers in the users database.
• The MEANS, MINIMUMs, and MAXIMUMs have their normal meaning and provide comparisons among the different hospitals or providers in your database.
For the (observed, risk-adjusted, or smoothed) rates, the User should NOT report the MEANS displayed here, but instead refer to the overall means in the output dataset in the PROC PRINT labeled "FINAL OUTPUT." The MEANS given here are means of hospital means; i.e., all hospitals are given equal weight, regardless of the number of discharges in the different hospitals.

IQI SAS Software Documentation 33 Version 2.1, Revision 4 (December 22, 2004)
• Note: The denominators for seven of the mortality indicators (# 8 - 12, 30, and 31) will be similar to the totals for the seven volume indicators (TPIQ01-TPIQ07), but often they will not be exactly identical since the mortality indicators exclude discharges that were transferred to other hospitals.
• Note: Smoothed rates are not computed for two indicators: #8 esophageal resection mortality and #31 carotid endarterectomy mortality. These events are so infrequent that our analyses could not detect enough systematic provider level variation to compute the smoothed rates.
• If the “PRINT” parameter in the CONTROL_IQI.SAS program is set to one, at the end of the printout is a PROC PRINT on the final provider-based output file. Listed for each level of stratification are the stratifiers, the numerator and denominator totals for the observed rates, and the observed, risk-adjusted, and smoothed rates.
IQSASA2 The purpose of this printout is to provide the observed rates for all area-level indicators. The default printout shows overall results and results by area, but other levels of output (as shown in Table 7) can be specified as well. Note that risk-adjusted and smoothed rates are shown in the output from the next program. The printout from the IQSASA2 program contains PROC MEANS for all of the numeric variables in the output summary dataset. It will contain information for the newly constructed OAIQxx rates, the PAIQxx denominators, and the TAIQxx numerators.
• The _TYPE_ variable described in the first row of the MEANS table identifies the stratification level for the records in the output data set. The _TYPE_ variable corresponds to the TYPELVLA parameter values that were specified (see item 5 in the “Changes” section for the IQSASA2 program on page 27). In this case, _TYPE_ always assumes the value of 8, since only the area-level records are selected.
• The N statistic for _TYPE_ contains the number of areas in the output summary data set. A TAIQxx numerator variable with a lower value for N than _TYPE_ indicates that there were no outcomes of interest for some of the areas.
• The MINIMUM value for the TAIQxx numerators will be one or higher.
For the observed rates, the User should NOT report the MEANS displayed here, but instead should refer to the overall means in the output dataset that are also present in the subsequent PROC PRINT. The MEANS given here are means of the area means; i.e., all areas are given equal weight, regardless of the population in the different areas.
• The SUMs for the counter variables TAQIxx and PAIQXX will contain overall file totals for these data elements. The SUMs for the observed rates have no intuitive meaning.
If the “PRINT” parameter in the CONTROL_IQI.SAS program is set to one, the subsequent PROC PRINT output contains a complete dump of the output summary file. Listed for each record are the stratification values, the PAIQxx population denominators for the four indicators, the TAIQxx outcome numerators for the four indicators, and the four OAIQxx observed rates.
IQSASA3
The PROC PRINT at the end of this program provides your final output. (This printout appears if the "PRINT" parameter in the CONTROL_IQI.SAS program is set to one – the default setting.) It lists the numerator and the denominator, along with the observed, risk-adjusted, and smoothed rates for all indicators, as shown in the example output below.
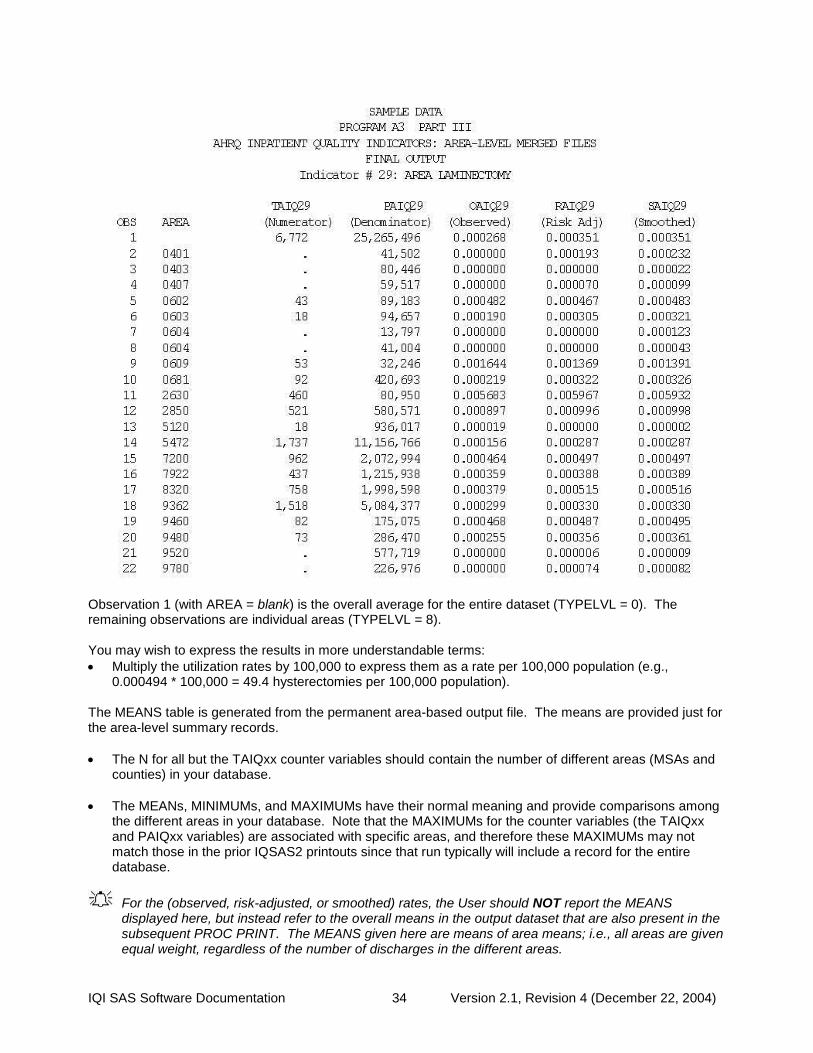
IQI SAS Software Documentation 34 Version 2.1, Revision 4 (December 22, 2004)
Observation 1 (with AREA = blank) is the overall average for the entire dataset (TYPELVL = 0). The remaining observations are individual areas (TYPELVL = 8). You may wish to express the results in more understandable terms:
• Multiply the utilization rates by 100,000 to express them as a rate per 100,000 population (e.g., 0.000494 * 100,000 = 49.4 hysterectomies per 100,000 population).
The MEANS table is generated from the permanent area-based output file. The means are provided just for the area-level summary records.
• The N for all but the TAIQxx counter variables should contain the number of different areas (MSAs and counties) in your database.
• The MEANs, MINIMUMs, and MAXIMUMs have their normal meaning and provide comparisons among the different areas in your database. Note that the MAXIMUMs for the counter variables (the TAIQxx and PAIQxx variables) are associated with specific areas, and therefore these MAXIMUMs may not match those in the prior IQSAS2 printouts since that run typically will include a record for the entire database.
For the (observed, risk-adjusted, or smoothed) rates, the User should NOT report the MEANS displayed here, but instead refer to the overall means in the output dataset that are also present in the subsequent PROC PRINT. The MEANS given here are means of area means; i.e., all areas are given equal weight, regardless of the number of discharges in the different areas.

IQI SAS Software Documentation 35 Version 2.1, Revision 4 (December 22, 2004)
• The SUMs of the counter variables (the TAIQxx and PAIQxx variables) yield the overall database totals.
Interpreting the Results The Inpatient Quality Indicators are not intended to be definitive quality measures. Many factors can and do influence performance on quality indicators and some of these factors are independent of quality of care. The empirical analyses conducted by the research team during the development of the IQIs produced an estimation that generally less than 20% of total patient level variation for each QI is attributable to actual provider-level differences6. Though this number appears low, the research team also estimated that most of this remaining provider-level variation reflects true signal; that is, the observed performance is not likely the result of random variation. The researchers also noted that these true differences in provider performance are potentially clinically important, in that they involve large numbers of patients, severe outcomes, and/or significant cost to the health care system.
Although these indicators are not intended and should not be used as definitive measures of quality, they are useful low-cost screens that can potentially illuminate differences between providers and areas that may be addressable using quality improvement techniques.
Since both very low rates and very high rates for some indicators, such as procedure utilization indicators, may indicate quality problems, and since there are no “right rates” established for most indicators, it is often best to compare provider or area-level rates with other similar providers or areas. These “peer groups” would ideally be as similar as possible in potentially important factors, such as case-mix, socioeconomic status and other demographics. Similar hospitals should perform similarly on QIs. Potential characteristics that have been used to define peer groups have been teaching status, bed capacity, socioeconomic status of the population, and urban or rural location.
Using Indicators in Combination Performance on a single IQI often cannot reliably indicate actual quality differences. For this reason, some indicators have been developed as measure sets. For instance, stroke care could be measured by the carotid endarterectomy and stroke mortality measures. Examining these indicators together is likely to produce a more complete picture of overall quality of care for this condition. Indicators are also organized by type – utilization, mortality, volume. Providers that perform better (or worse) than average on one measure within each type tend to perform better (or worse) on others. In other words, performance on indicators is often related, and performance on multiple similar indicators could also be examined as summary indicators for an overall picture of quality. Similarly, indicators may be related across indicator types. Lower utilization rates may be related to higher, but avoidable, admission rates for some conditions. Groups of indicators have not been validated as sets, but using them as such may be useful for exploration purposes.
After performing all of the steps as previously outlined, users will have three estimates of performance for each mortality and utilization IQI – observed, risk-adjusted, and smoothed estimates. For the volume indicators, observed volumes are reported but these are not risk-adjusted or smoothed. This section will outline how the different types of estimates can be interpreted and used.
Volume Indicators The IQSASP2 program generates output with the observed counts of procedures performed at a given hospital during the year in question. None of the other programs report on the volume indicators, since risk adjustment is not an issue for volume indicators. Each of these indicators has substantial published
6 A full report on the empirical evaluation can be found in Refinement of the HCUP Quality Indicators by the UCSF-Stanford EPC, available at AHRQ’s Quality Indicator Web site http://www.qualityindicators.ahrq.gov/.

IQI SAS Software Documentation 36 Version 2.1, Revision 4 (December 22, 2004)
evidence suggesting that providers that perform more than a certain number of procedures have better patient outcomes. These thresholds are listed below in Table 9. Threshold 1 is the lowest reported threshold in the literature, while threshold 2 is the highest. Providers exceeding these thresholds are considered high volume providers. Volume indicators are considered indirect or ‘proxy’ measures of quality, in that the volume of procedures is often related to outcome measures such as post-operative mortality and complications. However, volume may be increased by performing a larger number of inappropriate procedures. Thus, it is often useful to examine volume measures in conjunction with mortality and complication rates as well as area-level rates of the procedure to account for regional variations in standard practice. For each volume measure in the IQIs, there is a corresponding mortality measure. For two procedures (PTCA and carotid endarterectomy) the mortality measure is intended to be used only with its corresponding volume measure.
Table 9. Thresholds for Volume Indicators
Threshold
1 Threshold
2 Reference for Threshold 1 Reference for Threshold 2
Esophageal resection
6 7 Patti MG, Corvera CU, Glasgow RE, et al. A hospital’s annual rate of esophagectomy influences the operative mortality rate. J Gastrointest Surg 1998;2(2):186-92.
Dudley RA, Johansen KL, Rand R, et al. Selective referral to high-volume hospitals: estimating potentially avoidable deaths. JAMA 2000;283(9):1159-66.
Pancreatic resection
10 11 Glasgow RD, Mulvihill SJ. Hospital volume influences outcome in patients undergoing pancreatic resection for cancer. West J Med 1996;165(5):294-300
Glasgow, Mulvihill, 1996.
Pediatric heart surgery
100 - Hannan EL, Racz M, Kavey RE, et al. Pediatric cardiac surgery: the effect of hospital and surgeon volume on in-hospital mortality. Pediatrics 1998;101(6):963-9.
-
AAA repair 10 32 Hannan EL, Kilburn H, Jr., O Donnell JF, et al. A
longitudinal analysis of the relationship between in-hospital mortality in New York state and the volume of abdominal aortic aneurysm surgeries performed. Health Serv Res 1992;27(4):517-42.
Kazmers A, Jacobs L, Perkins A, et al. Abdominal aortic aneurysm repair in Veterans Affairs medical centers. J Vasc Surg 1996;23(2):191-200.
CABG 100 200 Eagle KA, Guyton RA, Davidoff R, et al. ACC/AHA Guidelines for Coronary Artery Bypass Graft Surgery: A Report of the American College of Cardiology/American Heart Association Task Force on Practice Guidelines (Committee to Revise the 1991 Guidelines for Coronary Artery Bypass Graft Surgery). American College of Cardiology/American Heart Association. J Am Coll Cardiol 1999;34(4):1262-347
Hannan EL, Kilburn H, Jr., Bernard H, et al. Coronary artery bypass surgery: the relationship between inhospital mortality rate and surgical volume after controlling for clinical risk factors. Med Care 1991;29(11):1094-107
PTCA 200 400 Ryan TJ, Bauman WB, Kennedy JW, et al. Guidelines for percutaneous transluminal coronary angioplasty. A report of the American Heart Association/American College of Cardiology Task Force on Assessment of Diagnostic and Therapeutic Cardiovascular Procedures (Committee on Percutaneous Transluminal Coronary Angioplasty). Circulation 1993;88(6):2987-3007
Hannan EL, Racz M, Ryan TJ, et al. Coronary angioplasty volume-outcome relationships for hospitals and cardiologists. JAMA 1997;277(11):892-8.
Carotid endarter-ectomy
50 101 Manheim LM, Sohn MW, Feinglass J, et al. Hospital vascular surgery volume and procedure mortality rates in California, 1982-1994. J Vasc Surg 1998;28(1):45-46.
Hannan EL, Popp AJ, Tranmer B, et al. Relationship between provider volume and mortality for carotid endarterectomies in New York state. Stroke 1998;29(11):2292-7.
Dudley RA, Johansen KL, Brand R, et al. Selective referral to high-volume hospitals: estimating potentially avoidable deaths. JAMA 2000;283(9):1159-66.
Utilization Indicators Programs IQSASA2 andIQSASP2 give the observed rates for each of the utilization indicators. Programs IQSASA3 and IQSASP3 give the risk-adjusted and the MSX smoothed rates.
IQI SAS Software Documentation 37 Version 2.1, Revision 4 (December 22, 2004)
Most of the utilization indicators are potentially overused procedures. The exceptions are VBAC and laparoscopic cholecystectomy, which are potentially underused. The rates of procedure use are intended to reflect inappropriate use of the procedure. However, it has been noted in the literature that areas with higher rates of procedures do not necessarily have higher rates of inappropriate procedures. Nevertheless, since these areas have higher rates of procedures they may have a higher number of inappropriate procedures. Other factors, including patient preference, influence indicator performance. For most of these procedures there are no “right rates,” meaning there are no gold standards by which to measure performance. Very low rates could signal inappropriate underutilization of procedures. Thus peer group averages may be the best comparison available. Notable exceptions are Bi-lateral cardiac catheterization and incidental appendectomy where the appropriate rate is likely to be very small, and Cesarean delivery and Vaginal Birth After Cesarean (VBAC) rates, which have established Healthy People 2010 goals (15 cesarean deliveries per 100 births for first-time cesareans, and 37 VBACs per 100 births in women with previous cesarean section)7.
Mortality Indicators Program IQSASP2 gives the observed rates for each of the mortality indicators, Program IQSASP3 gives the risk-adjusted and the MSX smoothed rates. Mortality is one of the most important outcomes of healthcare; therefore mortality rates have been examined extensively. Mortality rates, however, tend to have substantial amounts of noise, partly because of their small numbers of observations. For this reason it is recommended that MSX smoothed estimates be used. Case-mix may also substantially affect mortality rates, and use of risk-adjustment, at a minimum with age/sex and APR-DRGs, is recommended. Both volume and mortality are measured for seven surgical procedures – esophageal resection, pancreatic resection, pediatric heart surgery, abdominal aortic aneurysm (AAA) repair, coronary artery bypass graft (CABG), percutaneous transluminal coronary angioplasty (PTCA), and carotid endarterectomy. The volume indicators simply count the number of admissions in which these procedures were performed. The mortality indicators reflect the number of in-hospital deaths among patients receiving these procedures with the exclusion of those transferring to another institution. Patients transferring to other acute-care hospitals are not eligible to die in the original hospital and therefore should be excluded from the denominator for mortality indicators. If there is a discrepancy between the volume of procedures (from IIQSASP2) and the denominator of the mortality indicator, the difference is simply due to exclusion of transferring patients. For two mortality indicators (PTCA and carotid endarterectomy), it is recommended that the mortality measures be used only with its corresponding volume measure.
Observed Rates
Examine observed rates as baseline measures of performance on the indicators and to see the impact of risk adjustment. (Note: Volume measures are only presented as observed values, or "numerators" in the printouts.)
With the exception of the volume indicators, the interpretation of the observed (raw) IQI rates may be complicated by concerns over noise and bias. However, the observed rates do not require complex statistical methods as do the risk-adjusted and MSX smoothed rates. For this reason, they are the most intuitive estimates of IQI performance. Observed rates can be used as a baseline measure when comparing to risk-adjusted and MSX smoothed rates, to determine the impact of risk adjustment/smoothing. Observed rates may fluctuate for some providers from year to year. While some of these fluctuations may indicate true differences in performance, others are due only to random chance (i.e., non-systematic differences among providers or areas in patient characteristics that are not observed, and therefore cannot be adjusted for). For this reason, it is often beneficial to examine observed rates for a given provider over
7 Additional information on the Healthy People 2010 Maternal, Infant and Child Health Goals is available at http://www.healthypeople.gov/document/html/volume2/16mich.htm#_Toc494699664.

IQI SAS Software Documentation 38 Version 2.1, Revision 4 (December 22, 2004)
several consecutive time periods. This will help to diminish the chance of inaccurately judging poorer than average or better than average performance during one year as true performance.
Risk-Adjusted Rates
For most purposes, you will use the risk-adjusted rates for the mortality and utilization indicators. Simply put, risk-adjusted rates are the estimated performance of providers or areas on the IQIs if those providers or areas had an ‘average’ casemix. This average casemix is estimated and included in the software using estimates from 35 states in the HCUP Year 2002 SID databases. Estimates of the average casemix do not reflect only the areas or providers in the dataset being analyzed, but rather the distribution in age, sex and APR-DRG categories among the providers and areas in the SID data. Most provider indicators are risk adjusted using age, sex, and APR-DRGs—mortality measures using the risk of mortality score and utilization measures using the severity score (unless the user chooses otherwise, in which case risk adjustment only uses age and sex). A few provider indicators cannot be adjusted using APR-DRGs since the population at risk is characterized by a single APR-DRG without severity classification. These are cesarean delivery (IQI 21) and primary cesarean delivery (IQI 33) rates, VBAC rates (Uncomplicated and All, IQIs 22 and 34 respectively), and laparoscopic cholecystectomy rate (IQI 23), and are risk-adjusted by age and in the case of laparoscopic cholecystectomy, sex. APR-DRGs were selected as the risk adjustment tool because it performed at least as well as other systems in comparative studies, and it fulfilled a variety of other requirements desired by potential users (e.g. open-system, widely available). However, APR-DRGs may not be the best or most comprehensive risk adjustment system for every indicator. All area indicators are risk-adjusted using age and sex, except for low-birth weight, which is not risk-adjusted. Ideally, one might like to adjust for the underlying health status of each area, but population-based measures of health status by demographic groups are not readily available. Users should compare risk-adjusted rates with the observed rates. This will indicate the impact of risk adjustment and presumably casemix on indicator performance. Providers with large changes in performance between observed and risk-adjusted rates presumably have a more or less complex case mix. The construction of risk-adjusted rates in the IQI module follows the method described in Greene, Econometric Analysis (2nd Ed), 1993, Section 16.4.2 on calculating fixed effects in a linear model. Two important features of this approach should be noted. First, the risk-adjusted rates are coefficients on provider or area level covariates (‘fixed effects’) in a linear model for each IQI that also accounts for patient demographics (age, sex, and APR-DRG category). Generally, these coefficients reflect the relative performance on the IQI relative to a reference or ‘omitted’ group (e.g., males age 65-69). As a result, the risk-adjusted rates for each provider or area would reflect performance on the IQI for the reference group only, making interpretation and comparison with the observed raw rates problematic. Rather, the approach incorporated into running the model is to first subtract the overall IQI mean for each covariate (e.g., age category 1, age category 2, etc.) prior to running the model. The benefit of this approach is that the risk-adjusted rates (the ‘fixed effects’ in the model) now reflect the estimated performance on the IQI for each provider or area if that provider or area had the ‘average’ casemix among all providers or areas in the estimation sample. Second, because the model is linear, rather than logistic, the estimated risk-adjusted rates may be negative (that is, the model does not require the rates to be between zero and one). This might happen, for example, if the observed rate is close to zero, and the provider or area has a more severe than average casemix. The model would predict that the provider’s performance with an ‘average’ casemix would be less and subtract some adjusted amount from the observed rate. If that observed rate is already nearly zero, the adjusted rate may be negative. A negative rate means that the observed rate is close to zero, and that the provider or area has a less-severe-than-average casemix. In

IQI SAS Software Documentation 39 Version 2.1, Revision 4 (December 22, 2004)
order to facilitate the interpretation of the estimates, the IQI module imposes a lower bound of zero; i.e., negative values are set to zero. Similarly, the model does not assume a risk-adjusted rate of zero when the observed rate is zero. The estimated risk-adjusted rate may be greater than zero when the observed rate is zero if the provider or area has a less severe than average casemix. In that case, the model would predict that the provider’s performance with an ‘average’ casemix would be greater and add some adjusted amount to the observed rate. If the observed rate is zero, the adjusted rate will be positive.
MSX Smoothed Rates (Optional) The IQSASP3 and IQSASA3 programs also yield the estimated MSX smoothed rates for each IQI. These smoothed rates are estimated using multivariate signal extraction (MSX). MSX is a smoothing technique similar to Bayesian methods. Generally, indicators defined on relatively small populations per provider or for relatively rare events are very noisy measures. In other words, many factors other than quality can influence the observed rate. For factors that can be observed, such as the patient’s age or gender or APR-DRG, risk adjustment can account for their influence. There are many other clinical and non-clinical factors that cannot be observed. The MSX method estimates how much of an impact random differences in these factors across providers or areas have on the observed rate. The two SAS programs accomplish this by adjusting toward the overall mean according to the degree of reliability of the specific provider or area indicator. Just as risk-adjustment levels the playing field across providers and areas by "equalizing" patient and population characteristics, smoothing levels the playing field by removing random variation in the measures across providers and areas. In essence, smoothing describes how persistent a provider's rate would be from year to year. For example, smaller hospitals with fewer cases will tend to be the best and worst performers on an indicator in a given year, because a few cases can have a tremendous impact on the rates. Compare the rates for these two hospitals:
Hospital A 2001 2002
Numerator 0 1
Denominator 11 12
Observed rate 0% 8.3%
Risk-adjusted rate 0% 8.1%
Smoothed rate 3.3% 3.5%
Hospital B
Numerator 10 12
Denominator 363 454
Observed rate 2.8% 2.6%
Risk-adjusted rate 2.3% 2.1%
Smoothed rate 2.9% 2.8%
Looking at the observed and even the risk adjusted rates can be misleading. Quality of care in Hospital A did not necessarily decline in 2002 compared to 2001. Similarly, quality of care in Hospital A is not necessarily better than Hospital B in 2001, not is it worse than Hospital B in 2002. Notice that smoothing affects the rates for Hospital A much more than for Hospital B. In 2001, the smoothed rate is quite a bit higher than the risk adjusted rate. And in 2002, Hospital A's smoothed rate is quite a bit lower. Both smoothed rates have migrated toward the mean. On the other hand, the smoothed rate for Hospital B is much more stable across the years and it is more similar to the risk-adjusted rate. Smoothing attempts to correct for random variations by adjusting for differences in the reliability of a hospital's estimate—generally, reliability improves with a hospital's size.
The smoothed rates are intended to help you look for how best to present the data. For example, if smoothed rates vary considerably from risk-adjusted rates, you might wish to examine risk-adjusted performance by combining data for several years rather than examining a single year's performance,

IQI SAS Software Documentation 40 Version 2.1, Revision 4 (December 22, 2004)
or just compare hospitals within peer groups. In the example, above, you might choose to present mortality rates separately by bed size and over a longer period, e.g., 3-5 years, so that cases are aggregated for smaller hospitals.
The MSX method estimates reliability in two ways: (1) a univariate "shrinkage" estimator based on the unexplained patient level variation for a single measure in a single year, and (2) a multivariate approach that looks at provider or area performance among multiple indicators and across multiple years for a single indicator. If providers or areas that perform high in one year also tend to perform high in the next, and providers/areas that are low in one indicator tend to perform low in other related indicators, then the methods incorporate this information to improve the estimate of how much of a provider’s performance on a single indicator in a single year is “signal” and how much is “noise”. IQSASP3 and IQSASA3 report the univariate “signal” estimate, after removing the “noise”. These estimates are referred to as “smoothed” estimates because when the raw data is reported annually on a graph, for example, the line connecting the points may show massive fluctuations, seemingly with no apparent pattern. Some of these fluctuations are due to random differences in factors that influence performance, so once the impact of these factors is removed, fluctuations are reduced, or smoothed out. Improvements in performance will still be observed; however, they will only be observed when it is likely that these improvements are actually true differences, and not simply random variation. The estimates of how related the Inpatient Quality Indicators are among measures and over time for a typical provider or area are based on estimates using the 35 states in the HCUP Year 2002 SID databases. Therefore, IQSASP3 and IQSASA3 do not require multiple providers, measures, and years of data to operate. Instead shrinkage estimates were calculated from the combination of 35 statewide HCUP Year 2002 SID datasets to which the MSX had been applied. These shrinkage estimates are the best estimates of the impact that MSX smoothing would have on a particular IQI if MSX could be applied to the dataset being analyzed. These shrinkage estimates are then applied to the adjusted rates for each IQI, giving ‘smoothed’ estimates of the rates. The smoothed estimates represent the best guess of what the provider performance would be for any given IQI if the data contained only a minimal amount of noise. This has several implications. First, users can be more certain that changes observed over time represent true differences in performance, rather than random variation. Second, in any given year, users can be more certain that the rate does not reflect only random noise. This can best be seen by comparing the smoothed estimates with the observed raw rates, which will indicate the impact of MSX on that indicator. A large impact means that the observed rate of the indicator is less precise, meaning it contains more noise relative to other indicators sustaining less impact. Low precision can result from small numbers of observations, or for relatively rare events. Therefore, the impact of the MSX estimate will in general be greater for small providers and for infrequent events. For providers with small numbers of cases, the MSX estimates may be the same over time as the estimates are being “shrunk” to an overall mean. Plotting the MSX estimates over time will reflect more persistent performance from year-to-year, and the correlations among indicators will generally be stronger.
Comparing Observed, Risk-Adjusted, and Smoothed Rates The purpose of the analysis determines which rates the user should look at in evaluating the performance of a provider or an area. If the user’s primary interest is to focus on a particular provider or area without any comparisons to other providers or areas, simply examine the overall observed rate for the entire provider or area, as well as further breakdowns by age, sex, payer, and race/ethnicity which are the output created by the IQSASP2 and IQSASA2 programs. Trend data are recommended for identifying changes over years. If the purpose of the analysis is to compare the performance of a particular provider or area with national, state, or regional averages or performances of other selected providers or areas, then both observed and risk-adjusted rates should be examined. Variation in observed rates across providers or areas is attributable to a variety of factors including differences in patient casemix or population demographics, disparity in access to and quality of care, and other provider or area characteristics (‘systematic factors’), and random factors (non-systematic factors or ‘noise’). Comparing observed and risk-adjusted rates can reveal if there is any difference between the provider/area’s population and the population of other providers/areas. If the

IQI SAS Software Documentation 41 Version 2.1, Revision 4 (December 22, 2004)
difference is minimal, one can compare the observed rate with the overall average across all providers or areas. However, to account for differences in patient casemix or population demographics among different providers or areas, risk-adjusted rates should be used for provider or area-by-area comparisons. After removing the impact of patient casemix or population demographics, if users want to examine potential existence of random factors, comparisons can be made between the risk-adjusted rates and the smoothed rates to determine if the differences in risk-adjusted rates across providers or areas are due to systematic, as opposed to random, factors. The following two tables provide guidance on how to interpret differences in observed, risk-adjusted, and smoothed rates.

IQI SAS Software Documentation 42 Version 2.1, Revision 4 (December 22, 2004)
Comparing Observed Rates with Risk-adjusted Rates Purpose: To identify if there is any difference in the patient casemix of the provider or the
demographic composition of the area relative to that of all providers or areas combined
Observed rate > Risk-adjusted rate Mortality indicators: The provider’s patient population for the condition or procedure has a higher risk of mortality due to its casemix (for example, older or a greater proportion of a higher-risk APR-DRG). Utilization indicators: The provider/area’s population has a higher risk of receiving the procedure due to its demographic composition (for example, older or a greater proportion of a higher-risk gender).
Observed rate < Risk-adjusted rate Mortality indicators: The provider’s patient population for the condition or procedure has a lower risk of mortality due to its casemix (for example, younger or a greater proportion of a lower-risk APR-DRG). Utilization indicators: The provider/area’s population has a lower risk of receiving the procedure due to its demographic composition (for example, younger or a greater proportion of a lower-risk gender).
Observed rate = Risk-adjusted rate Mortality indicators: The provider’s patient casemix for the condition or procedure is similar to other providers’, suggesting that patient composition is not a contributing factor to the provider’s performance for the mortality indicator. Utilization indicators: The provider/area’s population is similar to other providers/areas’ in demographic composition.
Comparing Risk-Adjusted Rates with Smoothed Rates (Optional) Purpose: To determine if differences in risk-adjusted rates across providers or areas are due to
systematic or random factors after patient casemix or demographic composition is taken into account.
Risk-adjusted rate close to Smoothed rate
The provider/area’s risk-adjusted rate is more precise, an accurate reflection of the provider/area’s systematic (‘true’) rate. If there is any difference between the risk-adjusted rate and the overall area average1, such difference is likely to be due to systematic factors.
Risk-adjusted rate different from Smoothed rate
The provider/area’s risk-adjusted rate is less precise2; that is, some of the difference between the risk-adjusted rate and the overall area average is due to random (‘noise’) factors. The smoothed rate is thus a more accurate estimate of the systematic rate than the risk-adjusted rate. Comparing the smoothed rate to the overall provider/area average reveals more accurately the ‘true’ performance of the provider or area.
Notes: 1. The overall provider or area average refers to the weighted average risk-adjusted rates across all providers or areas.
2. The risk-adjusted rates for providers or areas with small population are generally less precise.
Generally, subtracting the observed, risk-adjusted and smoothed rates can help to reveal differences among these rates. To get a sense of the magnitude, the most straightforward approach is to estimate the difference in terms of the number of cases in the numerator. For example, for a hospital with 1000 CABG cases, a difference of -0.005 between the observed rate and risk-adjusted rate would mean five deaths. Whether the difference between rates is statistically meaningful will depend on the number of discharges in
IQI SAS Software Documentation 43 Version 2.1, Revision 4 (December 22, 2004)
the population at risk, and the sampling variability for each indicator. Users can apply a rough rule of thumb to estimate the required difference: 1.4* SQRT(p*(1-p)/N), where p is the rate and N is the denominator of the indicator. For example, if the observed rate for an indicator is p=0.045 and the population at risk is N=200, applying the formula to these numbers will produce: 1.4* SQRT(0.045*(1-.045)/200) = 0.0205. That is, for the risk-adjusted rate to be significantly different from the observed rate, the absolute difference between the two rates has to be equal to or greater than 0.0205.
Computing Expected Rates (Optional) While the risk-adjusted rate assumes an “average” case-mix (but the provider’s actual performance for each patient group), an expected rate assumes an “average” performance for each patient group (but the provider’s actual case-mix). The relationship between the two rates is given by the formula: Risk-adjusted rate = (Observed Rate – Expected Rate) + Population Rate. IQI Version 2.1, Revision 4 calculates the risk-adjusted rate by subtracting the expected rate from the observed rate and adding the population rate. For example, if the observed rate is 4.5%, the expected rate is 5.4% and the population rate is 6.0%, then the risk-adjusted rate is (4.5 – 5.4) + 6.0 = 5.1%. The provider performed better than expected given the provider’s actual case-mix (5.4% vs. 4.5%, or -0.9%). The risk-adjustment model assumes that the provider would also perform better than expected (and to the same extent) if the provider had an “average” case-mix (6.0% vs. 5.1%, or -0.9%).
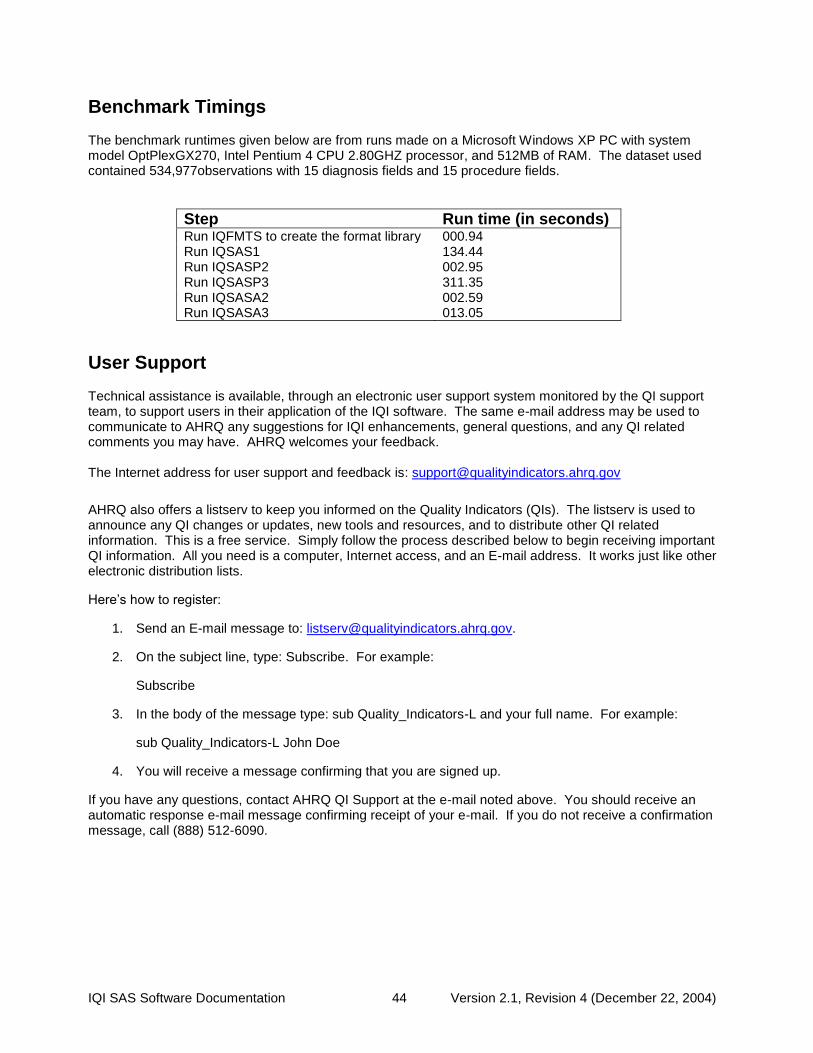
IQI SAS Software Documentation 44 Version 2.1, Revision 4 (December 22, 2004)
Benchmark Timings The benchmark runtimes given below are from runs made on a Microsoft Windows XP PC with system model OptPlexGX270, Intel Pentium 4 CPU 2.80GHZ processor, and 512MB of RAM. The dataset used contained 534,977observations with 15 diagnosis fields and 15 procedure fields.
Step Run time (in seconds) Run IQFMTS to create the format library 000.94 Run IQSAS1 134.44 Run IQSASP2 002.95 Run IQSASP3 311.35 Run IQSASA2 002.59 Run IQSASA3 013.05
User Support Technical assistance is available, through an electronic user support system monitored by the QI support team, to support users in their application of the IQI software. The same e-mail address may be used to communicate to AHRQ any suggestions for IQI enhancements, general questions, and any QI related comments you may have. AHRQ welcomes your feedback. The Internet address for user support and feedback is: [email protected]
AHRQ also offers a listserv to keep you informed on the Quality Indicators (QIs). The listserv is used to announce any QI changes or updates, new tools and resources, and to distribute other QI related information. This is a free service. Simply follow the process described below to begin receiving important QI information. All you need is a computer, Internet access, and an E-mail address. It works just like other electronic distribution lists.
Here’s how to register:
1. Send an E-mail message to: [email protected].
2. On the subject line, type: Subscribe. For example:
Subscribe
3. In the body of the message type: sub Quality_Indicators-L and your full name. For example:
sub Quality_Indicators-L John Doe
4. You will receive a message confirming that you are signed up.
If you have any questions, contact AHRQ QI Support at the e-mail noted above. You should receive an automatic response e-mail message confirming receipt of your e-mail. If you do not receive a confirmation message, call (888) 512-6090.

IQI SAS Software Documentation A-1 Version 2.1, Revision 4 (December 22, 2004)
A.
Appendix A: Log of Revisions to IQI Documentation and Software Version 2.1, Revision 4 The following table summarizes the revisions made to the IQI software, software documentation and the Guide to Inpatient Quality Indicators (Guide) document in release version 2.1, Revision 4. The table lists the component(s) affected by the change and a short summary of the changes that were made.
Component Changes
Software (SAS and SPSS) and Guide
Modified documentation to reflect changes in indicators associated with ICD-9-CM coding updates for FY 2005 (effective 10-1-2004). See separate documentation on ICD-9 coding updates for specific details.1
Guide
1. Corrected the low volume threshold (10) for AAA mortality (IQI #4) in Table 2. 2. Updated the provider, area and population rates in Table 2 and the detailed evidence
section using data from the 2002 HCUP SID files. 3. In the detailed evidence section, added a cross reference from each indicator
description to the indicator's detailed definition in Appendix A.
4. Included Appendix A titles of detailed definitions in the Table of Contents.
Software (SAS and SPSS)
1. Added an explicit age inclusion (age >=18) to Craniotomy mortality (IQI #13). The age inclusion had been implicit in the DRGs 1,2, but not new DRGs 528, 529, 530 (FY 2004) and 543 (FY 2005).
2. Added optional data elements YEAR (year of patient discharge) and DQTR (calendar quarter of patient discharge). If available, these data elements are used to implement a coding change to Stroke mortality (IQI #17) that drops ICD-9-CM code 436 from the denominator for discharges occurring on or after 10/1/2004. However, ICD-9 code 436 will be retained in the denominator if the data elements year and quarter of discharge are not available or if the user selects the option to retain code 436 for purposes of trending over time.
3. Added the calculation and reporting of the expected rate at the stratification level selected by the user. The SAS (IQSASP3.SAS) and SPSS (IQSPSP3.SPS) software now calculates the risk-adjusted rate, the expected rate and the smoothed rate. The rates are saved in the output file. The user also has the option to print the rates or save the rates in a comma-delimited ASCII file. (Note: the parameter file MNSIQP00.TXT is no longer required)
1 "Updates to Version 2.1, Revision 4 – ICD-9-CM Coding Updates," http://www.qualityindicators.ahrq.gov/iqi_download.htm

IQI SAS Software Documentation A-2 Version 2.1, Revision 4 (December 22, 2004)
Component Changes
Software Documentation
(SAS and SPSS)
1. Added new user control parameter YEARQTR to CONTROL_IQI.SAS and IQSPS1.SPS. This parameter is set to 1 if the data elements YEAR and DQTR are available on the input data file. Otherwise the parameter is set to 0.
2. Added optional data elements YEAR (year of patient discharge) and DQTR (calendar
quarter of patient discharge) to Table 4.
3. Revised text to reflect that calculation of expected rates is now incorporated.
4. Updated flowchart (Figure 1) to eliminate the parameter file MNSIQP00.TXT and include "expected" in the description of the rates calculated.

IQI SAS Software Documentation B-1 Version 2.1, Revision 4 (December 22, 2004)
B.
Appendix B: ICD-9-CM and DRG Coding Updates in IQI Release Version 2.1, Revision 4 The following changes were implemented in version 2.1, Revision 4, of the IQI software (both SAS and SPSS) and reflect changes to indicator definitions based on updates to ICD-9-CM codes for Fiscal Year 2004 (effective 10-1-2003). All changes noted below have been incorporated into the software syntax, software documentation and the Guide to Inpatient Quality Indicators. With this software update, the IQI software definitions now incorporate ICD-9-CM codes valid from October 1, 1994 through September 30, 2005.
Indicator Name (#) Component Change
Craniotomy Mortality (IQI #13)
Denominator (Inclusion, Craniotomy)
New DRG code (FY 2005) 543 (Craniotomy w/ implant of chemo agent or acute complex CNS principal diagnosis) was added to the denominator definition of craniotomy. Expected impact on rate: negligible
Stroke Mortality (IQI #17)
Denominator (Inclusion, Stroke)
For discharges beginning in FY 2005, ICD-9-CM code 436 “acute, but ill-defined cerebrovascular disease” is dropped from the denominator definition of stroke because the code inclusion terms exclude “cerebrovascular accident (CVA) NOS, Stroke.” Note: Revision 4 adds optional data elements YEAR (year of patient discharge) and DQTR (calendar quarter of patient discharge) to the input data file specifications. If available, these data elements are used to exclude ICD-9-CM code 436 from the denominator for discharges occurring on or after 10/1/2004. However, ICD-9 code 436 will be retained in the denominator if the data elements year and quarter of discharge are not available or if the user selects the option to retain code 436 for purposes of trending over time or to maintain historical continuity in the rate. However, users are encouraged to transition to the new definition as soon as possible. Expected impact on rate: may result in a decrease in the denominator and resulting increase in the rate. The decrease may be larger in the short-term depending on how quickly coders adapt to the new guidelines.