aiaa 2002-0078 effects of endwall geometry and stacking on ... · ternate turbopump development...
TRANSCRIPT

AIAA 2002-0078Effects of Endwall Geometry andStacking on Two-Stage SupersonicTurbine Performance
Daniel J. Dorney, Lisa W. GriffinNASA Marshall Space Flight CenterMSFC, AL
Frank W. HuberRiverbend Design ServicesPalm Beach Gardens, FL
Douglas L. SondakBoston UniversityBoston, MA
40th Aerospace SciencesMeeting & Exhibit
14-17 January 2002 / Reno, NV
_r permission to copy or to republish, contact the American Institute of Aeronautics and Astronautics,Alexander Bell Drive, Suite 500, Reston, VA 20191-4344
https://ntrs.nasa.gov/search.jsp?R=20030003812 2020-03-19T13:07:17+00:00Z
EFFECTS OF ENDWALL GEOMETRY AND STACKING ON
TWO-STAGE SUPERSONIC TURBINE PERFORMANCE
Daniel J. Dorney* Lisa W. Griffin _
Fluids Dynamics Analysis Branch
NASA Marshall Space Flight Center
Marshall Space Flight Center, Alabama, USA
Prank W. Huber $
Riverbend Design Services
Palm Beach Gardens, Florida, USA
Douglas L. Sondak §
Office of Information Technology
Boston University
Boston, MA, USA
ABSTRACT
The drive towards high-work turbines has led to
designs which can be compact, transonic, super-
sonic, counter rotating, or use a dense drive gas.
These aggressive designs can lead to strong sec-
ondary flows and airfoil flow separation. In many
cases the secondary and separated flows can be
minimized by contouring the hub/shroud endwalls
and/or modifying the airfoil stacking. In this study,
three-dimensional unsteady Navier-Stokes simula-
tions were performed to study three different end-
wall shapes between the first-stage vanes and rotors,
as well as two different stackings for the first-stage
vanes. The predicted results indicate that chang-
ing the stacking of the first-stage vanes can sig-
nificantly impact endwall separation (and turbine
performance) in regions where the endwall profile
changes.
*Aerospace Engineer, Senior Member AIAA.tTeam Leader, Senior Member AIAA.
SPresident, Senior member AIAA.§Senior Scientific Programmer, Senior Member AIAA.
Copyright (_)2002 by the American Institute of Aeronauticsand Astronautics, Inc. No copyright is asserted in the UnitedStates under Title 17, U.S. Code. The U.S. Government has
a royalty-free license to exercise all rights under the copyrightclaimed herein for Governmental Purposes. All other rights
are reserved by the copyright owner.
NOMENCLATURE
C - Axial chord
f - Frequency
M - Mach number
P - Static pressure
r - Radius
Ap - Amplitude of pressure variation
- (r - rhub)/(rt_p -- rhub)
T - Static temperature
W - Work
GREEK SYMBOLS
- Relative circumferential angle
7/ - Efficiency
_/ - ratio of specific heats
p - Density
- Rotor rotational speed
SUBSCRIPTS
in - Inlet
out - Outlet
t - Stagnation quantity, time derivative
ts - Total-to-static
tt - Total-to-total
0 - Vane-1 inlet
4 - Rotor-2 exit
1/2 - Half-amplitudeoc - Free stream
INTRODUCTION
Modern high-work turbines can be compact, tran-
sonic, supersonic, counter rotating, or uses a dense
drive gas. The vast majority of modern rocket tur-
bine designs fall into these categories. These tur-bines are often characterized by large amounts of
flow unsteadiness. The flow unsteadiness can have
a major impact on the turbine performance and
durability. For example, the Space Transportation
Main Engine (STME) fuel turbine, a high-work tran-
sonic design, was found to have an unsteady interrowshock which reduced efficiency by 2 points and in-
creased dynamic loading by 24 percent. The Revolu-
tionary Reusable Technology Turbopump (RRTT),which uses full flow oxygen for its drive gas, was
found to shed vortices with such energy as to raise
serious blade durability concerns. In both cases, the
sources of the problems were uncovered (before tur-
bopump testing) with the application of validated,
unsteady computational fluid dynamics (CFD) to
the designs. In the case of the RRTT and the Al-ternate Turbopump Development (ATD) turbines,
the unsteady CFD codes were used not just to iden-
tify problems, but to guide designs which mitigate
problems due to unsteadiness. Using unsteady flow
analyses as a part of the design process has led toturbine designs with higher performance (which ef-
fects temperature and mass flow rate) and fewer dy-
namics problems. The works of Griffin et al. [1]-[4],
Garcia et al. [5] and Griffin and Dorney [6] are ex-amples of the application of unsteady CFD to rocket
turbine designs.More recently, CFD has been used to design a
two-stage supersonic turbine which will be tested
experimentally during 2002 [7]-[9]. Numerical sim-ulations (including meanline, two-dimensional CFD
and three-dimensional CFD analyses in conjunction
with optimization techniques) were used to design
both the flowpath and the airfoil geometries. Dur-
ing the course of this work a large separated flow
region was detected on the hub endwall between the
first-stage vane and the first-stage rotor.Two methods used are normally to control the
secondary/separated flows (and associated losses) in
supersonic turbines: endwall contouring and airfoil
stacking. In the current investigation the flow path
between the first-stage vanes and rotors, and the
stacking of the first-stage vanes, were varied in an ef-
fort to improve turbine performance. The geometricvariations have been studied by performing a series
of unsteady three-dimensional numerical simulations
for the two-stage turbine.
NUMERICAL ALGORITHM
The governing equations considered in this
study are the time dependent, three-dimensional
Reynolds-averaged Navier-Stokes equations. To ex-tend the equations of motion to turbulent flows, an
eddy viscosity formulation is used. The turbulentviscosity is calculated using the two-layer Baldwin-
Lomax algebraic turbulence model [10].
The numerical algorithm used in the three-
dimensional computational procedure consists of
a time-marching, implicit, finite-difference scheme.
The procedure is third-order spatially accurate and
second-order temporally accurate. The inviscid
fluxes are discretized according to the scheme devel-
oped by Roe [11]. The viscous fluxes are calculated
using standard central differences. An approximate-
factorization technique is used to compute the time
rate changes in the primary variables. Newton sub-
iterations are used at each global time step to in-
crease stability and reduce linearization errors. For
all cases investigated in this study, two Newton sub-
iterations were performed at each time step. Mes-
sage Passing Interface (MPI) and OpenMP softwarehave been implemented into the numerical analysis
to reduce the computation time for large-scale three-dimensional simulations.
The Navier-Stokes analysis uses O- and H-type
zonal grids to discretize the flow field and facili-tate relative motion of the rotating components (see
Fig. 1). The O-grids are body-fitted to the surfaces
of the airfoils and generated using an elliptic equa-
tion solution procedure. They are used to prop-
erly resolve the viscous flow in the blade passagesand to easily apply the algebraic turbulence model.
The algebraically-generated H-grids are used to dis-cretize the remainder of the flow field.
The computational analysis has been validated on
several supersonic turbine geometries (e.g., Refs. [6],
[12], [13]).
BOUNDARY CONDITIONS
The theory of characteristics is used to determine
the boundary conditions at the inlet and exit of the
computational domain. For subsonic inlet flow four
quantities are specified and one is extrapolated from

theinteriorofthecomputationaldomain.In partic-ular,thetotal pressure,total temperature,andthecircumferentialandradialflowanglesarespecifiedasa functionof theradius.TheupstreamrunningRiemanninvariantisextrapolatedfromtheinteriorofthecomputationaldomain.
Forsubsonicoutflowoneflowquantityis speci-fiedandfourareextrapolatedfromtheinteriorofthecomputationaldomain.Thecircumferentialandradialflowangles,totalpressure,andthetotal tem-peratureareextrapolatedfromtheinteriorof thecomputationaldomain.Thepressureratio,P4/Pto
is specified at mid-span of the computational exit
and the pressure at all other radial locations at theexit is obtained by integrating the equation for ra-
dial equilibrium. For supersonic outflow all the flow
variables are extrapolated. Periodicity is enforced
along the outer boundaries of the H-grids in the cir-cumferential direction.
For viscous simulations, no-slip boundary condi-
tions are enforced along the solid surfaces. It is as-sumed that the normal derivative of the pressure is
zero at solid wall surfaces. In addition, a specified
heat flux distribution is held constant in time along
the solid surfaces.
The flow variables at zonal boundaries are explic-
itly updated after each time step by interpolatingvalues from the adjacent grid.
GEOMETRY AND GRIDS
The two-stage supersonic turbine configuration,
typical of those proposed for a reusable launch ve-hicle, has 12 first-stage vanes, 30 first-stage ro-
tors, 73 second-stage vanes and 56 second-stage ro-
tors. In the current effort, a 15-vane/30-rotor/75-
vane/60-rotor (1/2/5/4) airfoil approximation hasbeen made. To keep the pitch-to-chord ratio (block-
age) constant, the first-stage vanes were scaled by a
factor of 12/15, the second-stage vanes were scaled
by a factor of 73/75 and the second-stage rotors werescaled by a factor of 56/60. The tip clearance in the
first- and second-stage rotors was set at the design
value of approximately 2.0% of the respective rotor
heights.The grid densities (number of passagesxixjxk)
for the turbine simulations are presented in Table 1.
The total number of grid points used to discretizethe turbine was 4,139,957. Figure 1 illustrates an
(x - y) view of the grids at midspan, where every
other grid point in each coordinate direction hasbeen removed for clarity. Figure 2 illustrates the
grids used to discretize the clearance region of the
second-stage rotor. Figure 3 shows a perspectiveview of the two-stage turbine. The average value
of y+, the non-dimensional distance of the first gridline above the surface was approximately 1.0 for the
airfoils surfaces and 1.5 for the endwall surfaces.
The simulations were run on 24 (400 MHz) pro-
cessors of an SGI Origin2000. Each simulation was
run for 15.0 global cycles (one complete rotor revo-
lution) at 22,000 iterations per cycle. A global cycleis defined as the time it takes for the two first-stage
rotor blades to pass by the first-stage vane airfoil.
The value of 22,000 iterations per cycle was chosen
to resolve all the (expected) frequencies of interest.
Each iteration required approximately 9.0 seconds
computation time on 24 processors. The time peri-odicity of the solutions was determined by interro-
gating pressure traces at different points along theairfoil surfaces.
NUMERICAL RESULTS
The two-stage turbine under consideration has a
design inlet Mach number of M0 = 0.08, an inlet
static pressure of 2225 psia, and an inlet static tem-
perature of approximately To = 2225 R. The rotorrotates at [2 = 31,343 RPM, the Reynolds number
(based on the inlet conditions and the rotor axial
chord) is approximately 1.2 x 10⁶ and the ratio of the
rotor exit static pressure to vane inlet total pressure
is P4/Pto = 0.1135. The operating fluid is hydrogen-rich steam and the average ratio of specific heats is
-y = 1.3538.Four different simulations have been performed to
determine the effects of endwall shape and first-stage
vane stacking on the performance of the two-stageturbine.
1. Case 1 - The radius of the inner diameter (ID)
and outer diameter (OD) are transitioned fromthe nominal values in the first-stage vane pas-
sage to the final values in the rotor passage be-
ginning three-quarters of the way between the
vane trailing edge and concluding at the rotor
leading edge (see Fig. 4). Case 1 represents
the original turbine geometry based on previ-
ous work [7]-[9].
2. Case 2 - The radius of the ID and OD are tran-
sitioned from the nominal values in the vane
passage to the final values in the rotor passage
beginning at the vane trailing edge and conclud-
ing at the rotor leading edge (see Fig. 4).
3. Case 3 - The radius of the inner diameter (ID)

is keptconstantat thevalueusedin therotor.Theradiusof theODis transitionedfromthenominalvaluein thevanepassageto thefinalvaluein therotorpassagebeginningatthevanetrailingedgeandconcludingattherotorleadingedge(seeFig.4). Note,in thiscasetheheightofthevanewasincreasedto keepthevaneflowareathesameasin Cases1and2.
4. Case4- Theflowpathis identicalto thatusedin Case3. Thevaneairfoilsarestackedalongthetrailingedgeinsteadofthecenterofgravity(asit wasin Cases1,2 and3).
AnoverviewoftheturbineflowfieldispresentedinFigs.5and6,whichcontaininstantaneousabsoluteMachandentropycontours,respectively,atmidspanof the turbinefor Case4. Figure5 highlightsthestrongexpansionandshockstructuresbetweenthefirst-stagevaneandrotors,aswellasweakershockstructuresneartheleadingandtrailingedgesofthesecond-stagevane.Figure6highlightsflowsepara-tionon thesuctionsurfaceof bothrotors,whichistypicalof supersonicturbineflowfields.
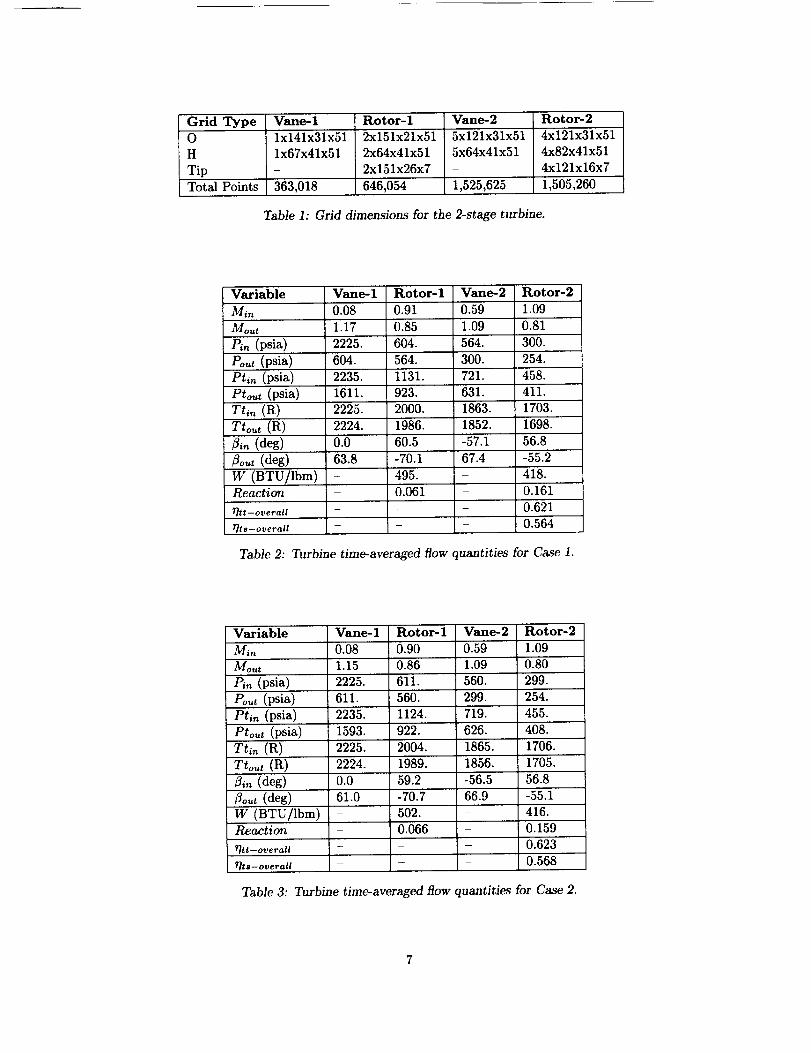
Time-averagedentropycontoursmidwaybetweenthefirst-stagevaneandrotorpassagesfor Case1areshownin Fig.7. Thecontoursshowalargere-gionof separatedflowextendingfromthe hubtoapproximately20%of thespan.Theaxialextentof theregionwasconfinedto theareabetweenthevanetrailingedgeandtherotorleadingedge.It wasinitially theorizedthat the largeseparatedflowre-gionwasbeinginducedby therapidexpansionintheendwallflowpathin Case1. ReducingtheslopeoftheendwallinCases2and3,however,didnotsig-nificantlyaffectthesizeof theseparatedflowregion(seeFigs.8and9). Thenexthypothesisforthelargeseparatedflowregionwasthat stackingthevanesalongthecenterofgravitycausesthewanethroattopointoutwardstowardstheshroudendwall,givingtheflowatendencyto pullawayfromthehubend-wall.Re-stackingthevanesalonga radiallinecon-nectingthetrailingedgepointssignificantlyreducedthesizeoftheseparatedflowregion(seeFig.10).
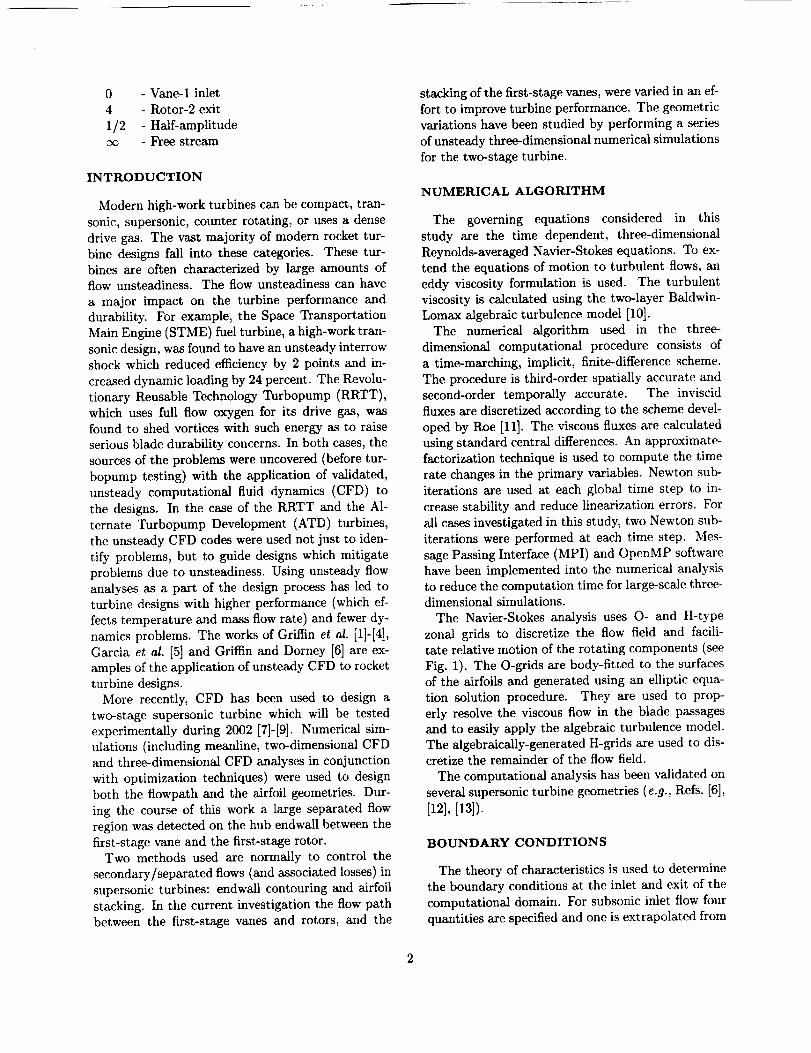
Tables2to 5containthetime-averagedrelative-frameflowquantitiesat the inlet andexitof eachbladerowfor all fourcases.Someof therelevantinformationwhichcanbededucedfromthesetablesincludes:
• Reducingthesizeof theseparatedflowregioninCase4resultedinavalueoftheaveragevaneexitMachnumber(1.37)whichiscloserto thedesignvalueof 1.50.
Reducingthesizeof theseparatedflowregionin Case4 givesasignificantincrease(nearly6points)in turbineefficiencycomparedto Case1. A moredetailedcomparisonof Cases1and4ispresentedbelow.
• Thechangesmadeto thefirst stagehadlittleeffectontheflowin thesecondstage.
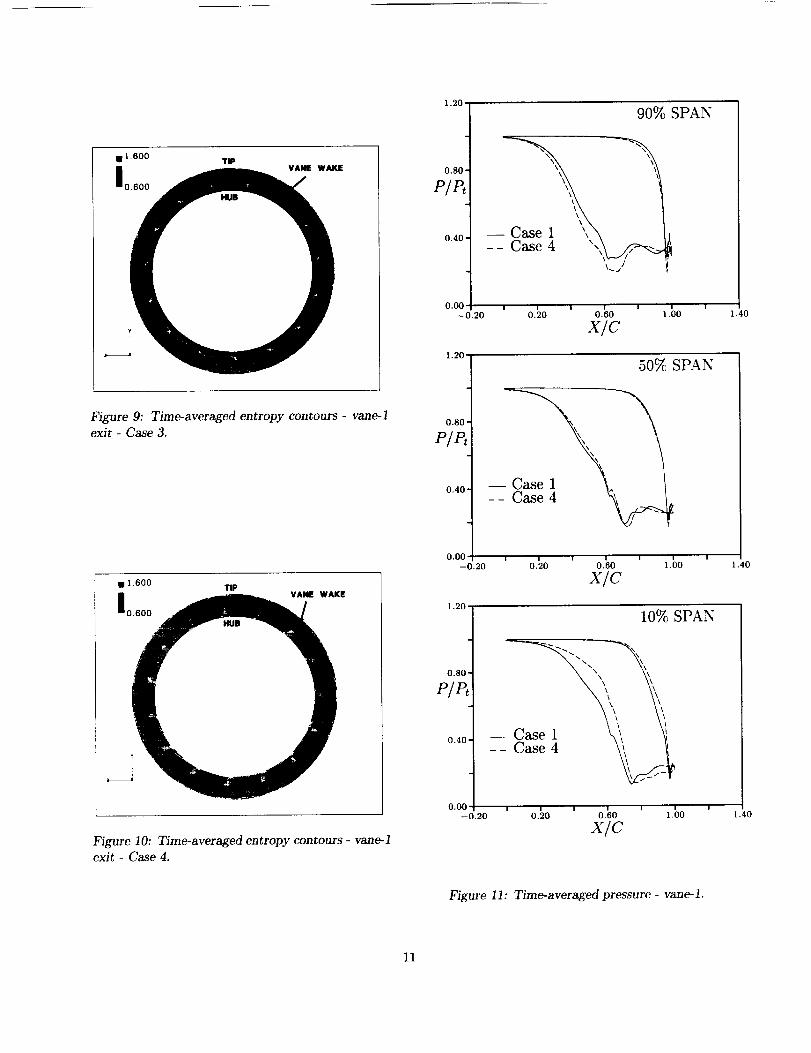
Thedifferencesbetweentheflowfieldsin Cases1and4areexploredin moredetailbycomparingsur-facepressuresandradialprofiles.Figures11and12illustratethetime-averagedsurfacepressuresonthefirst-stagevaneandrotor,respectively,at 10%,50%and90%of thespan.Re-stackingthevaneresultsin the loadingshiftingtowardstheleadingedgeatthehubandtowardsthetrailingedgeatthetip (seeFig.11).Thevaneloadingsaresimilarat 50%ofthespan.TherearesignificantdifferencesbetweentherotorsurfacepressuresinCases1and4(seeFig.12).At 10%spanthesurfacepressuresaremuchgreaterin Case1becauseof thelowMachnumberassoci-atedwith theseparatedflow. Theloadingon therotorat 10%spanisalsogreaterin theCase1thanin Case4. Thepresenceof thelowflowregionnearthehubin Case1forcesmoreof theflowthroughtheoutboardregionsof therotor. Theloadingsat50%and90%spanaresimilarin Cases1and4.
An indicationof theunsteadinessin the turbinecanbeobtainedfromFigs.13-16,whichshowtheunsteadypressureenvelopesfor all fourbladerowsat 10%,50%and90%of the span in Case 4. The un-
steadiness on the first-stage vane, which is generated
mainly by interaction with the rotor potential field
and bow shock, is confined to the unconvered por-
tion of the suction surface by the choked throat in
passage (see Fig. 13). The first-stage rotor blades, aswell as the airfoils in the second stage of the turbine,
experience a significant amount of unsteadiness. Theunsteadiness in these blade rows is generated from
several sources, including interaction with the po-tential fields of the upstream and downstream blade
rows, periodic interaction with the wakes from up-stream blade rows and temporal variations in shock
location and strength. The unsteadiness in all four
blade rows is relatively constant as a function of the
span.Fourier decompositions of the unsteady pressure
at 5% of the axial chord on the suction surface of
the first-stage rotor at 10% and 50% of the span are
shown in Figs. 17 and 18, respectively, for Cases 1and 4. Note, the frequencies in Case 1 were shifted
by 1 kHz to facilitate comparisons. At 10% span the

reductionin theseparatedflowregioncausesthero-torto experiencemoreinfluencefromthevanewake(asindicatedbyanincreasein theunsteadinessnear8kHz). At 50%spanbothcasesexhibitsignificantunsteadinessatthevanepassingfrequencyandtwicethe vanepassingfrequency.Thehigherharmonicmayactuallybecausedbythevanetrailingedgeex-pansionfan,whichisoffsetfromthevanewakebynearlyhalfthevanecircumferentialpitch.
Time-averagedradialprofilesoftheabsoluteMachnumberat theexitofeachbladerowinCases1and4areshowninFigs.19-22.TheMachnumberprofileattheexitofthefirst-stagevane(seeFig.19)clearlyshowstheextentof theseparatedflowregion.Theflowfieldbeginsto recoverbythetimeit exitsthefirst-stagerotor(seeFig.20),andtheMachnumberprofilesarenearlyidenticalin thesecondstageoftheturbine(seeFigs.21and22). Thepresenceoftip leakageflow isevidentbehindboth rotorrows(seeFigs.20and22).
Time-averagedradialprofilesof theabsolutecir-cumferentialflowangleat theexitofeachbladerowinCases1and4areshownin Figs.23-26.Asnotedabove,the largeflow (andangle)deficitnearthefirst-stagevanehubinCase1(seeFig.23)causesaradialshift in theflowdistributionwithintherotor(seeFig.24).Similarto theMachnumberprofiles,theflowangleprofilesin thesecondstagearesim-ilar for bothcases.Thus,thegeomerticvariationsin thefirst-stagedonothaveasignificantimpactontheflowin thesecondstage.
Forcompleteness,thetime-averagedradialprofilesoftheabsolutetotalpressureareshowninFigs.27-30.Asexpected,thecharacterofthetotalpressureprofilesfollowscloselywiththatoftheMachnumberprofiles.Thelargeseparatedflowregionat theexitofthefirst-stagevane,theredistributionoftheflowin thefirst-stagerotor,aswellastherecoveryoftheflowin thesecondstageareall visible.
CONCLUSIONS
A set of unsteady three-dimensional Navier-Stokessimulations has been used to investigate the effects
of endwall shape and first-stage vane stacking on the
performance of a two-stage supersonic turbine. Re-
stacking of the vanes was successfully used to elimi-
nate a large separated/secondary flow region at thehub between the first-stage vanes and rotors. Alter-
ing the shape of the endwall in the first stage hadlittle effect on the separated flow region. There was a
significant performance increase obtained at the de-
sign flow conditions by reducing the separated flow
region. It is anticipated that the benefits of improv-
ing the behavior of the flow near the endwall will be
even greater at off-design operating conditions.
ACKNOWLEDGEMENTS
The computer time for the flow simulations was
provided by NASA Ames Research Center. The au-thors are especially grateful to Mr. Chuck Niggley
for assisting with the use of the computers.
References
[1]Griffin, L. W., and Rowey, R. J., "Analyti-
cal Investigation of the Unsteady AerodynamicEnvironments in Space Shuttle Main Engine
(SSME) Turbines", ASME Paper No. 93-GT-
363, 1993, Cincinnati, OH, June.
[2]Griffin, L. W., and Huber, F. W., "Advance-ment of Turbine Aerodynamic Design Tech-
niques", ASME Paper No. 93-GT-370, Cincin-
nati, 1993, OH, June.
[31Griffin, L. W., Huber, F. W., and Sharma,
O. P., "Performance Improvement Through In-
dexing of Turbine Airfoils: Part 2: Numerical
Simulation", ASME Journal of Turbomachin-
ery, Vol. 118, No. 4, 1996, pp. 636-642.
[4]Griffin, L. W., and Nesman, T., "Prediction
of the Unsteady Aerodymanic Environment inthe RRTT Turbine", presented at the 14th
Workshop for Fluid Dynamic Applications inRocket Propulsion and Launch Vehicle Tech-
nology, NASA/Marshall Space Flight Center,
April 23-25, 1996.
[5]Garcia, R., Griffin, L. W., Benjamin, T. G.,
Cornelison, J. W., Ruf, J. H., and Williams,
R. W., "Computational Fluid Dynamics Anal-
ysis in Support of the Simplex Turbopump De-
sign", NASA CP-3282 Vol. 1, 1995, pp. 462-470.
[6]Griffin, L. W. and Dorney, D. J., "Simulations
of the Unsteady Flow Through the Fastrac Su-
personic Turbine," ASME Journal of Turboma-
chinery, Vol. 122, No. 2, April, 2000, qpp. 225-233
Griffin, L. W., Dorney, D. J., Huber,
F. W., Tran, K., Shyy, W., and Papila,
N., "Detailed Aerodynamic Design Optimiza-tion of an RLV Turbine," AIAA 2001-3397,

37thAIAA/ASME/SAE/ASEEJointPropul-sionConference,SaltLakeCity,UT,July8-11,2001.
[8]Papila,N., Shyy,W, Griffin,L. W., Dorney,D. J., "ShapeOptimizationof SupersonicTur-binesUsingResponseSurfaceandNeuralNet-workMethods,"AIAA 2001-1065,39thAIAAAerospaceSciencesMeetingandExhibit,Reno,NV,January8-11,2001.
[9]Griffin,L.W.,andDorney,D.J., "RLVTurbinePerformanceOptimization,"PERC12thSym-posiumonPropulsion,Cleveland,OH,October26-27,2000.
[10]Baldwin,B. S.,andLomax,H., "ThinLayerApproximationandAlgebraicModelfor Sep-aratedTurbulentFlow,"AIAA Paper78-257,16thAIAA AerospaceSciencesMeetingandExhibit,Huntsville,AL,January,1978.
[11]Roe,P. L., "ApproximateRiemannSolvers,ParameterVectors,andDifferenceSchemes,"Journal of Computational Physics, Vol. 43,
1981, pp. 357-372.
[12] Dorney, D. J., Griffin, L. W., and Huber, F.,
"A Study of the Effects of Tip Clearance in a
Supersonic Turbine," ASME Journal of Turbo-
machinery, Vol. 122, No. 4, October, 2000, pp.674-673.
[13] Dorney, D. J., Griffin, L. W., Huber,F., and Sondak, D. L., "Unsteady Flow
in a Supersonic Turbine Stage With Vari-
able Specific Heats," AIAA Paper 2001-3884,37th AIAA/ASME/SAE/ASEE Joint Propul-
sion Conference, Salt Lake City, UT, July 8-11,
2001, also accepted for publication in the AIAA
Journal of Propulsion and Power.
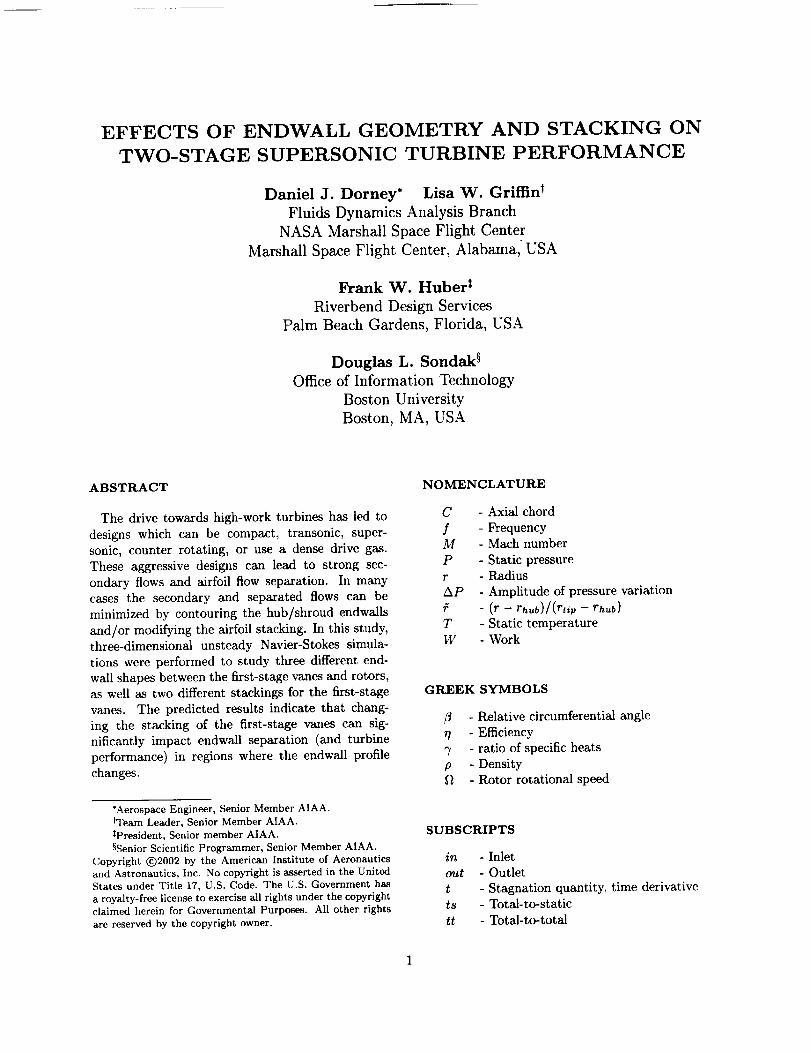
Grid Type Vane-1O 1x141x31x51
H lx67x41x51
Tip
Tot_ Points 363,018
Rotor-1 Vane-2 Rotor-2
2x151x21x51 5x121x31x51 4x121x31x51
2x64x41x51 5x64x41x51 4x82x41x51
2x151x26x7 - 4x121x16x7
646,054 1,525,625 1,505,260
Table 1: Grid dimensions for the 2-stage turbine.
Variable Vane-1 Rotor-1 Vane-2 Rotor-2
Min 0.08 0.91 0.59 1.09
Mout 1.17 0.85 1.09 0.81
Pin (psia) 2225. 604. 564. 300.
Pout (psia) 604. 564. 300. 254.
Pt_,, (psia) 2235. 1131. 721. 458.
Ptout (psia) 1611. 923. 631. 411.
Ttin (R) 2225. 2000. 1863. 1703.
Ttout (R) 2224. 1986. 1852. 1698.
Bin (deg) 0.0 60.5 -57.1 56.8
Bout (deg) 63.8 -70.1 67.4 -55.2
W (BTU/lbm) - 495. - 418.Reaction - 0.061 - 0.161
- 0.621lltt_overal I - _
- 0.564_ts-overall - -
Table 2: Turbine time-averaged flow quantities for Case 1.
Variable Vane-1 Rotor-1 Vane-2 Rotor-2
Min 0.08 0.90 0.59 1.09
Mout 1.15 0.86 1.09 0.80
Pin (psia) 2225. 611. 560. 299.
Pout (psia) 611. 560. 299. 254.
Ptm (psia) 2235. 1124. 719. 455.
Ptout (psia) 1593. 922. 626. 408.
Ttin (R) 2225. 2004. 1865. 1706.
Tto_,t(R) 2224. 1989. 1856. 1705.
Bin (deg) 0.0 59.2 -56.5 56.8
Bout (deg) 61.0 -70.7 66.9 -55.1
W (BTU/lbm) - 502. - 416.Reaction - 0.066 - 0.159
_tt--overall -- -- -- 0.623- - - 0.568
_ts-overall
Table 3: Turbine time-averaged flow quantities for Case 2.

Variable
M.,Mo_t
Pin (psia)
Vane-1 Rotor-1 Vane-2 Rotor-2
0.08 0.91 0.59 0.79
1.15 0.86 1.08 0.85
2225. 598. 554. 300.
Pout (psia) 598. 554. 300. 254.
Ptin (psia) 2235. 1115. 711. 453.
Pto_,t (psia) 1577. 922. 622. 406.
Ttin (R) 2225. 2004. 1865. 1709.
Ttout (R) 2224. 1989. 1857. 1704.
Bin (deg) 0.0 59.1 -57.3 56.7
Bout (deg) 60.0 -70.7 67.5 -55.3
W (BTU/lbm) - 481. - 425.Reaction - 0.059 - 0.165
Oft-overall - - - 0.609
_ts--overall -- -- -- 0.553
Table 4: Turbine time-averaged flow quantities for Case 3.
Variable Vane-1 Rotor-1 Vane-2 Rotor-2
Mm 0.08 1.07 0.59 0.80
Mout 1.37 0.86 1.09 0.86
Pi,,(psia) 2225. 602. 560. 300.
Pout (psia) 602. 560. 300. 254.
Pt_n (psia) 2235. 1237. 720. 454.
Pto_,t (psia) 1835. 926. 625. 408.
Ttin (R) 2225. 1996. 1863. 1707.
Ttout (R) 2223. 1989. 1856. 1703.
ain (deg) 0.0 72.7 -57.3 56.8
ao_,t (deg) 76.4 -69.7 67.5 -55.1
W (BTU/Ibm) - 583. - 427.Reaction - 0.031 - 0.164
- - - 0.680Oft-overall
_]ts-overall - -0.618
Table 5: Turbine time-averaged t_ow quantities for Case 4.

Figure1: Radialviewofthegridat midspan.Figure 3: Perspective view of the turbine.
6.60-
6.00
r (in)
5.40
4.80
Figure 2: Radial view of rotor-2 clearance grid.
......................
1 - 1st STAGE VANE TRAILING EDGE2 - 1st STAGE ROTOR LEADING EDGE
1 2
0.80 1._0 ' 1.40 ' 1.70
X (in)
Figure 4: Endwall flowpath between first-stage vane
and rotor; -- Case 1, - - Case 2, - - - Cases 3,4.
2.00

12.000
0.000• 1.600 TiP
0.600 VANE WAKE
Figure 5: Instantaneous absolute Mach number con-tours - midspan - Case 4.
Figure 7: Time-averaged entropy contours - vane-1exit - Case 1.
• 1,500
0.500• 1.800 TIP
0.600 VANE WAKE
Figure 6: Instantaneous entropy contours - midspan- Case 4.
Figure 8: Time-averaged entropy contours - vane-1exit - Case 2.
10
! 1.600
0.600
TPVANE WAKE
Figure 9: Time-averaged entropy contours - vane-1exit - Case 3.
g 1.600
0.600
TiPVANE WAKE
Figure 10: Time-averaged entropy contours- vane-1exit - Case 4.
1.20 -
0.80
P/ P_
0.40
0.00--0.20
1.20
0.80
P/P_
0.40
0.00
- .20
1.20 ,
0.80
e/P_
0.40
0.00
-0.20
90% SPAN
x:\ "_Nk
_-- Case 1 ', \
-- Case 4 \__
' o.'2o ' 0.'60 ' 1.'oo 'x/c
50% SPAN
_x N
-Casei\_,_ _
Case 4
' o.ho ' o._o ' 1.'0o 'x/c
10% SPAN
\',,1
-- Case 4 \\ t
' 0.20 ' 0.'60 ' 1.'00 '
x/c
1.40
1.40
1.40
Figure 11: Time-averaged pressure - vane- 1.
11

1.20
0.90
0.60
g/
0.30
0.00l
--0.20
-- Case 1-- Case 4
90% SPAN
_/// _\\NN\
' o.'2o ' o.'6o ' 1.'oo '
x/c
0.90"
0.60
P/P
0.30
0.00
-0.20
-- Case 1 50% SPAN-- Case 4
" t _ _-_
\ // _'\\\\\
' o.'2o ' 0/60 ' 1.'oo 'x/c
1.50
1.00
P/P
0.50
0.00
-- ).20
-- Case 1 10% SPAN-- Case 4
II "
' o.ho ' o.;o ' 1'oo '
x/c
1.40
1.40
1.40
0.80
P/Pt
0.40
0.00-0.20
1.20
0.80
P/Pt
0.40
0.00
1.20"
0.80
P/Pt
90% SPAN
-- Minimuni \
---Maximum _._" -_
' 0.20 ' 0.60 ' 1._)0 '
x/o
0.40
}.20
50% SPAN
-- Minimuni \ ..
--- Maximum
0.00-0.20
' o.lo ' o._o ' _.'oo 'x/c
10% SPAN
-- Mini.muiff\/_ _
. -- Maximum
' o._o ' o._o ' 1._o '
x/c
1.40
1.40
1,40
Figure 12: Time-averaged pressure- rotor-1. Figure 13: Pressure envelope - Case 4 - vane-1.
12

0.90
0.60
P/P_
0.30
0.00
-0.20
0.90
0.60
P/g_
0.30
0.00
--0.20
0.90
0.60
g/ P_
0.30
Time-AvgMinimumMaximum
90% SPAN
.. ....... .
". .... o.-"'**'" "",%
' 0.'2o ' o.'_o ' :'oo 'x/c
-- Time-Avg-- Minimum--, Maximum
50% SPAN
..° -
' 0.'20 ' o.'6o ' l:OO '
x/c
0.00-0.20
-- Time-Avg 10% SPAN-- Minimum-- - Maximum
_-, ............ ..-"*'* -" .-- ....... -.,,%
t'
' o.'2o ' o_o ' 1.bo
x/c
1.40
: .40
1.40
1.20"
0.40
0.00
-0.20
1.20
0.80
P/Pt
0.40
0.00
1.20
0.80
P/Pt
0.40
90% SPAN
''...... ................................. .,.
_./ -._.._.,, ._
\'% / f.
_Avg \_- Minimum
--- Maximum
0.'20 ' o._o ' 1.bo
x/c
50% SPAN
-- iVllnlmum "/- -. Maximum
.20 0.'20 ' o._o 'x/c
1 ._00
10% SPAN
.---..
Minimurfi "_/_- - - Maximum
0.00 _ , , ,--0.20 0.'20 0.60 1._}0
x/c
1.40
1.40
1.40
Figure 14: Pressure envelope - Case 4 - rotor-1. Figure 15: Pressure envelope - Case 4 - vane-2.
13

0.900.060
0.60-
e/Pt
0.30 -
0.00-0.20
0.90
0.30
0.00
-0.20
0.90
90% SPAN
,. ... V,
Time-Avg f'-- Minimum-- - Maximum
o._o ' o._o ' a.bo
x/c
50% SPAN
I \/ -- Time-Avg-- Minimurff--- Maximum
o ho ' o_o ' 1.bo '
x/c
1.40
1.40
°
0.60-
P/P °
0.30 -
0.00
-0.20
10% SPAN
..... ....................................... .%
, ',..' -- Time-AvlzMinimum
-- - Maximum
o.ho ' o._o ' 1.bo
x/c1.40
Figure 16: Pressure envelope - Case 4 - rotor-2.
0.040
(AP)0p)Poc
0.020
-- Case 1-- Case 4
0.000 II, I , [I , II
0. 40000. 60000.
/ (Hz)
i tt i i
, I[, ,,20000.
Figure 17: Fourier decomposition of unsteady pres-sure - rotor-1 - 5% axial chord - suction surface -
10% span.
0.060 -
0.040
(AP)II[2)
Poo
0.020t
I
Case 1Case 4
o.ooo ,i I, ,[ , I, ,,,I ! !I
0. 20000. 40000. 60000.
f (Hz)
Figure 18: Fourier decomposition of unsteady pres-sure - rotor-1 - 5% axial chord - suction surface -
50_ span.
80000.
II
80000.
14

1.00
0.50
0.00,.00 0.50 1.00 1.50
M
1.00 ,
-I
o.5o-_
-- Case 1-- Case 4
O.OOI2.00 0.00 0._.0 o._o ' 1_o
M
!
1.60
Figure 19: Absolute Mach number profile - vane-1exit.
Figure 21: Absolute Mach number profile - vane-2exit.
1.00
0.50
0.000.00
CaseCase41 _......
//'/
,L0.30 0.60
M
o.bo
1.00 ,
0.50 q
F Case 1Case 4
0.00 I ,1.20 0.00 0.35 0._50/50
M
1.00
Figure 20: Absolute Mach number profile - rotor-1exit.
Figure 22: Absolute Mach number profile - rotor-2exit.
15

1.00
Case 1-- Case 4
0.50
0.00
-20. 10.
J
....... ti
' 4_). ' 7_}. '
a (deg)
100.
1.00 ,
"4
o.5oq
Case 1Case 4
0.00 ] ,40.0 5(_.0 6(_.0
a (deg)
\
l )
' 70.0!
80.0
Figure 23: Absolute circumferential flow angle pro-file- vane-1 exit.
Figure 25: Absolute circumferential flow angle pro-file - vane-2 exit.
1.00
0.50
0.00
-80.
-- Case 1 -_
/ / //
__" _ w ,
-60. --40.
a (deg)
-_o.
1.00
r
0.50 -
0.00 , , , ,o. -6o.a (deg)
Case 1Case 4
20.
Figure 24: Absolute circumferential flow angle pro-file - rotor-1 exit.
Figure 26: Absolute circumferential flow angle pro-file - rotor-2 exit.
16

1.00
L
I
0.00
500.
-- Case 4
I000. 1500. 2000.
Pt (psia)2500.
1.00
0.50 -
Case 1 "_-_
Case 4 //
\\
1
0.00 , , ,400. 5(]0. 6(_0. 700.
Pt (psia)
!
800.
Figure 27: Absolute total pressure profile - vane-1exit.
Figure 29: Absolute total pressure profile - vane-2exit.
1.00
0.50
0.00
520.
Case 1 __..
Case 4
..}
600. 680. 760.
Pt (psia)
840.
1.00
0.50'
0,00 i I I
240. 280. 320. 360.
Pt (psia)
!
400.
Figure 28: Absolute total pressure profile - rotor-1exit.
Figure 30: Absolute total pressure profile - rotor-2exit.
17