analysis of unsteady tip and endwall heat transfer … · analysis of unsteady tip and endwall heat...
TRANSCRIPT

Vikram ShyamGlenn Research Center, Cleveland, Ohio
Ali Ameri and Jen-Ping ChenThe Ohio State University, Columbus, Ohio
Analysis of Unsteady Tip and Endwall Heat Transferin a Highly Loaded Transonic Turbine Stage
NASA/TM—2010-216740
June 2010
GT2010–23694
https://ntrs.nasa.gov/search.jsp?R=20100025996 2018-08-18T17:17:16+00:00Z

NASA STI Program . . . in Profi le
Since its founding, NASA has been dedicated to the advancement of aeronautics and space science. The NASA Scientifi c and Technical Information (STI) program plays a key part in helping NASA maintain this important role.
The NASA STI Program operates under the auspices of the Agency Chief Information Offi cer. It collects, organizes, provides for archiving, and disseminates NASA’s STI. The NASA STI program provides access to the NASA Aeronautics and Space Database and its public interface, the NASA Technical Reports Server, thus providing one of the largest collections of aeronautical and space science STI in the world. Results are published in both non-NASA channels and by NASA in the NASA STI Report Series, which includes the following report types: • TECHNICAL PUBLICATION. Reports of
completed research or a major signifi cant phase of research that present the results of NASA programs and include extensive data or theoretical analysis. Includes compilations of signifi cant scientifi c and technical data and information deemed to be of continuing reference value. NASA counterpart of peer-reviewed formal professional papers but has less stringent limitations on manuscript length and extent of graphic presentations.
• TECHNICAL MEMORANDUM. Scientifi c
and technical fi ndings that are preliminary or of specialized interest, e.g., quick release reports, working papers, and bibliographies that contain minimal annotation. Does not contain extensive analysis.
• CONTRACTOR REPORT. Scientifi c and
technical fi ndings by NASA-sponsored contractors and grantees.
• CONFERENCE PUBLICATION. Collected papers from scientifi c and technical conferences, symposia, seminars, or other meetings sponsored or cosponsored by NASA.
• SPECIAL PUBLICATION. Scientifi c,
technical, or historical information from NASA programs, projects, and missions, often concerned with subjects having substantial public interest.
• TECHNICAL TRANSLATION. English-
language translations of foreign scientifi c and technical material pertinent to NASA’s mission.
Specialized services also include creating custom thesauri, building customized databases, organizing and publishing research results.
For more information about the NASA STI program, see the following:
• Access the NASA STI program home page at http://www.sti.nasa.gov
• E-mail your question via the Internet to help@
sti.nasa.gov • Fax your question to the NASA STI Help Desk
at 443–757–5803 • Telephone the NASA STI Help Desk at 443–757–5802 • Write to:
NASA Center for AeroSpace Information (CASI) 7115 Standard Drive Hanover, MD 21076–1320

Vikram ShyamGlenn Research Center, Cleveland, Ohio
Ali Ameri and Jen-Ping ChenThe Ohio State University, Columbus, Ohio
Analysis of Unsteady Tip and Endwall Heat Transferin a Highly Loaded Transonic Turbine Stage
NASA/TM—2010-216740
June 2010
GT2010–23694
National Aeronautics andSpace Administration
Glenn Research CenterCleveland, Ohio 44135
Prepared for theTURBO EXPO 2010sponsored by the American Society of Mechanical EngineersGlasgow, Scotland, United Kingdom, June 14–18, 2010

Acknowledgments
This work was supported by the Fundamental Subsonic Fixed Wing program at NASA Glenn Research Center andaddresses the milestone SFW.11.02.003 – Develop and validate unsteady Reynolds-averaged Navier-Stokes (RANS) and
Large Eddy Simulation (LES) methods for engine fl ows. We also acknowledge the support of Dr. Meyer Benzakein ofThe Ohio State University and AVETEC for funding various segments of this research effort and the
Ohio Super Computing Center where the computations were performed.
Available from
NASA Center for Aerospace Information7115 Standard DriveHanover, MD 21076–1320
National Technical Information Service5301 Shawnee Road
Alexandria, VA 22312
Available electronically at http://gltrs.grc.nasa.gov
Trade names and trademarks are used in this report for identifi cation only. Their usage does not constitute an offi cial endorsement, either expressed or implied, by the National Aeronautics and
Space Administration.
This work was sponsored by the Fundamental Aeronautics Program at the NASA Glenn Research Center.
Level of Review: This material has been technically reviewed by technical management.

NASA/TM—2010-216740 1
Analysis of Unsteady Tip and Endwall Heat Transfer in a Highly Loaded Transonic Turbine Stage
Vikram Shyam
National Aeronautics and Space Administration Glenn Research Center Cleveland, Ohio 44135
Ali Ameri and Jen-Ping Chen
The Ohio State University Columbus, Ohio 43210
Abstract
In a previous study, vane-rotor shock interactions and heat transfer on the rotor blade of a highly loaded transonic turbine stage were simulated. The geometry consists of a high pressure turbine vane and downstream rotor blade. This study focuses on the physics of flow and heat transfer in the rotor tip, casing and hub regions. The simulation was performed using the Unsteady Reynolds-Averaged Navier- Stokes (URANS) code MSU-TURBO. A low Reynolds number k-ε model was utilized to model turbulence. The rotor blade in question has a tip gap height of 2.1 percent of the blade height. The Reynolds number of the flow is approximately 3x10⁶ per meter. Unsteadiness was observed at the tip surface that results in intermittent “hot spots”. It is demonstrated that unsteadiness in the tip gap is governed by inviscid effects due to high speed flow and is not strongly dependent on pressure ratio across the tip gap contrary to published observations that have primarily dealt with subsonic tip flows. The high relative Mach numbers in the tip gap lead to a choking of the leakage flow that translates to a relative attenuation of losses at higher loading. The efficacy of new tip geometry is discussed to minimize heat flux at the tip while maintaining choked conditions. In addition, an explanation is provided that shows the mechanism behind the rise in stagnation temperature on the casing to values above the absolute total temperature at the inlet. It is concluded that even in steady mode, work transfer to the near tip fluid occurs due to relative shearing by the casing. This is believed to be the first such explanation of the work transfer phenomenon in the open literature. The difference in pattern between steady and time-averaged heat flux at the hub is also explained.
Introduction
The efficiency of a jet engine is linked to the turbine inlet temperature and it is for this reason that one of the aims of engine design is to maximize the turbine inlet temperature. The temperature at the exit of a modern jet engine combustor can reach values of approximately 2000 K.
This is well in excess of the thermal limits (approximately 1500 K (Ref. 1)) of materials used for stator vanes and rotor blades in the turbine section of the core. In order to operate at these high temperatures, typically at take-off, the turbine components are cooled by bleeding relatively cooler air from the compressor through holes in the surface of the turbine stators and rotors. The aerodynamics and heat transfer in the turbine stage are highly unsteady. A literature review of unsteady stator-rotor interaction can be found in a previous study by Shyam (Ref. 2). It is important to quantify and qualify the thermal load on the blades in order to efficiently and effectively cool them. Even a modest 10 K rise in blade metal temperature can lead to a sharp decline in the longevity of the blade through thermal fatigue and creep (by approximately half (Ref. 1)). A significant concern in turbine rotors is aerodynamic loss due to tip leakage. The pressure distribution set up around the rotor blade results in a pressure gradient across the tip gap of the rotor. The high pressure gas on the pressure side of the blade has a tendency to flow towards the low pressure suction side across the tip. The path of the tip flow depends on several parameters such as blade rotational rate, blade geometry (tapering, twist, camber, tip gap height and tip contouring) and flow inlet angle. No matter what the cause of the leakage flow, it results in a drop in efficiency.
A detailed literature review of the basic features of turbine tip flow and heat transfer has been conducted by Bunker (Ref. 3) and Ameri (Ref. 4). Ameri (Ref. 4) describes the primary flow features seen due to tip leakage: the pressure side separation bubble on the tip surface and the tip leakage vortex. The extent of the bubble and its reattachment are contingent on blade thickness, Mach number, Reynolds number and tip height (Refs. 4 and 5). For subsonic flows, the percentage of inlet flow that constitutes the tip leakage is shown to grow linearly with tip gap height. Studies involving low Mach number flows show a recirculation zone above the tip gap exit due to relative casing motion (Refs. 3, 4, and 6). In both References 3 and 4 the importance of Computational Fluid Dynamics (CFD) in tip flow and heat transfer prediction is emphasized especially due to the difficulty of conducting experimental measurements in a rotating tip

NASA/TM—2010-216740 2
gap. Ameri et al. (Ref. 6) simulated the GE-EEE (Energy Efficient Engine) high pressure turbine stage and studied the tip flow and heat transfer for a smooth tip and for a recessed tip. The cavity height of the recess was varied in the study to analyze the effect of recess depth on tip heat transfer. Two primary vortex structures were observed in the recess. It was found that the recess had negligible effect on loss and did not improve the heat transfer distribution on the tip as a whole. Another study by Ameri et al. (Ref. 7) investigated the effect of upstream casing recess on tip leakage and heat transfer and found that minimal tip heat transfer occurred for a recess height that is almost equal to tip clearance. They concluded that the recess has little effect on efficiency. This can be explained by approximating the effective tip gap geometry by a diverging-converging nozzle. Unless the tip gap height is extremely small, the flow will first be expanded and then recompressed before exiting to the suction side. O'Dowd et al. (Ref. 8) used several techniques to measure the heat transfer coefficient and adiabatic wall temperature on a transonic turbine blade tip (Rolls Royce Environmentally Friendly Engine.) Almost all their measurement techniques showed high heat flux and adiabatic wall temperature in the leading edge region of the tip and a thin band of low heat flux on the aft pressure side edge of the tip. The complexity of measuring accurately the heat flux in the tip gap is elaborated on and it is for this reason that CFD is of great benefit. Hofer and Arts (Ref. 9) conducted an experimental study of leakage flow for a non-rotating linear turbine cascade. The study looked at the impact of cooling in the tip gap for two squealer geometries. They considered a full squealer tip and a suction side squealer tip and concluded that the suction side squealer resulted in higher heat transfer and loss coefficient. This is to be expected because at subsonic conditions, the suction side squealer tip effectively acts as a converging nozzle that accelerates flow through the tip. Hofer et al. (Ref. 9) claim that neglecting the relative casing motion does not significantly alter the results because of previous studies like that of Krishnababu et al. (Ref. 10). The latter studied the effect of relative casing motion on tip heat transfer and tip leakage mass flow for two different tip gap heights. They concluded that the effect of relative casing motion is diminished for larger tip gap heights due to dominant inviscid effects.
More recently, Wheeler et al. (Ref. 11) conducted a steady CFD simulation of tip flow for a transonic turbine rotor using Spalart-Allmaras and standard k-ε turbulence (with wall function) models. They claim that at high speeds, the turbulence model has little effect on heat transfer prediction. However, due to the lack of grid refinement near the wall and the use of wall functions it is not clear that this is in fact the case. Using a quasi-3D
approach, they observed a quicker reattachment of the separation bubble at higher Mach number. They also state that there is a drop in heat transfer coefficient due to decreased turbulent mixing at high Mach numbers and that the flow is dominated by local pressure gradients. As it is pointed out by Wheeler et al. (Ref. 11), high speed flow through the tip gap chokes the flow and therefore provides an opportunity to raise the mass flow through the passage without added aerodynamic penalties.
Shyam et al. (Ref. 12) simulated the flow and heat transfer through a high pressure transonic turbine stage using MSU-TURBO (Refs. 13, 14, and 15). The work focused on validation of the code and comparison with experiment for the rotor blade surface pressure and heat flux. The present study focuses primarily on the flow physics and heat flux in the rotor tip gap and the endwalls. Validation of the code for heat flux simulations can be found in References 2, 12, and 16.
Nomenclature
Variables
δ separation bubble height
Δ percent difference
ratio of specific heats
h tip gap height
M Mach number
p pressure
recovery factor
S entropy
St Stanton number
T temperature
Subscripts
0 total or stagnation conditions at inlet
aw adiabatic wall
relative relative to blade
w, wall denotes isothermal wall temperature

NASA/TM—2010-216740 3
Numerical Setup
This section provides a brief description of the pertinent numerical details related to this work. Further information can be found in References 2 and 12. A highly loaded (pressure ratio across stage approximately 5.0) high pressure turbine stage (Ref. 17) was used for this study. The stage consists of 38 stators and 72 rotors that rotate at approximately 9000 rpm. The rotor blade is three-dimensional with a tip clearance 2.1 percent of the blade span. An O-H grid was generated using GridPro (Program Development Company (PDC)) and has y+<1 at the first point off the wall. The domain was partitioned into 20 blocks for the rotor and 11 blocks for the stator. Details of the grid metrics can be found in References 2 and 12. Figure 1 shows the grid on the rotor blade and the hub. Figure 2 shows the relative positions and sizes of the vane and rotor grids as well as the boundary conditions for the unsteady simulation. The grid consists of approximately 2.5x10⁶ grid points. A discussion of grid density and suitability of the grid for this simulation can be found in References 2 and 12. Figure 3 shows a section of the grid in the tip region (72 cells in tip to casing direction.)
Figure 1.—Rotor blade surface and hub surface mesh (Ref. 2).
Figure 2.—Boundary conditions for unsteady simulation (Ref. 2).
Figure 3.—Grid in the tip region of rotor.
The unsteady simulation was run for approximately 11 complete revolutions of the rotor blade row. Convergence was monitored by observing mass-flow values at stator inlet and rotor exit. Surface heat transfer on the rotor blade was also monitored over several iterations. The solution was deemed converged when surface pressure and heat transfer, 1000 iterations apart, were nearly indistinguishable (percent difference under 0.1 percent). In both cases (steady and unsteady) the solution was initialized ab initio.
The Reynolds number of the flow is approximately 3x10⁶ per meter and is consistent with Tallman et al. (Ref. 17). An isothermal boundary condition was used for all solid surfaces and the wall temperature was set to 0.7 times the reference temperature to simulate realistic flow conditions.
Steady Simulation
For the steady simulation, the stator vane flow was first computed. At the vane inlet a temperature and pressure profile matching experimental conditions were imposed. The exit pressure profile was obtained from a coarse grid 1½ stage unsteady simulation (Ref. 18). The exit total pressure and temperature profiles obtained from the steady simulation of the vane were circumferentially averaged. The profiles thus obtained were used as inlet profiles for the steady rotor simulation. Rotor exit conditions were obtained from (Ref. 18). Periodic boundaries were specified at the tangential boundaries. Results from this case can be found in Luk (Ref. 16).
Unsteady Simulation
An inlet profile of total temperature and total pressure upstream of the vane were specified based on the experimental data of Tallman et al. (Ref. 17). The radial static pressure distribution downstream of the blade was specified at the exit of the rotor blade row. This pressure distribution itself was a product of an unsteady computation for a 1½ stage simulation performed by Green et al. (Ref. 18). Phase lag boundary condition was used in the tangential direction to account for unsteadiness and 31 time steps per period for the rotor
Tip Surface

NASA/TM—2010-216740 4
were saved. This is approximately one fifth the number of time steps that were used to store time history information for phase lag. The simulation took approximately 150,000 iterations to converge at a CFL of 5.0. Both simulations use a low Reynolds number k-ε turbulence model (Ref. 19). The results from the simulation are compared to the data (where available) presented in Tallman et al. (Ref. 17) and to the steady simulations of Luk (Ref. 16). A comparison of Wilcox’s k-ω model and the low Reynolds number model used in this simulation can be found in Reference 12. It was found that for regions of large rates of strain the k-ω model over predicts the surface heat flux.
Results and Discussion
In this section surface heat flux is normalized and presented as Stanton number (Ref. 12),
Pr
VTT
dn
dT
St wall
refwall
wall
Here, is the coefficient of viscosity, n is the distance normal to the wall and ρ, V and Tref are the density, velocity and temperature at the inlet to the stage. Pr is the Prandtl number. In Figures 4, 6 to 15 and 18 the blade surface is colored by contours of Stanton number. Flow visualization was achieved using Fieldview (Intelligent Light).
Rotor Tip
Tip heat transfer is thought to be largely a steady phenomenon dictated by tip geometry. In the experiments of Tallman et al. (Ref. 17), tip heat flux was measured at several locations. Figure 4 shows these probe locations on the tip surface. Figure 5 shows a comparison between simulated heat flux and heat flux measured from experiment at the probe locations shown in Figure 4. The labels ‘Experiment #5’ and ‘Experiment #6’ in Figure 5 refer to the upper and lower bounds of the data samples collected in (Ref. 17). Both the steady and time-averaged simulations over- predict heat flux in the leading edge region of the tip while the predictions at the trailing edge lie within the two data points obtained from experiment. It is possible that the leading edge region of the tip is experiencing laminar or transitional flow (associated with strong pressure gradient in the streamwise direction.) The CFD simulation assumes that the flow is fully turbulent and thus over predicts heat flux near the leading edge. Closer to the trailing edge, there is a better match between simulation and experiment.
Figure 4.—Location of probes (Ref. 12) to measure tip heat flux.
Figure 5.—Tip Stanton number comparison between CFD and experiment.
The blue stripes of low Stanton number (Refs. 2 and 17) on the tip that are visible in Figure 4 for the steady simulation, are also present in the results from the time-averaged simulation. The band of lower Stanton number at the entrance to the tip gap, from the pressure side is caused by separation bubbles in the tip gap. Figure 6 shows time averaged Stanton number on the tip surface along with two planes that are oriented in the streamwise direction and labeled ‘1’ and ‘2’, respectively. Plane 1 is located at approximately x/c = 0.65 and Plane 2 is located at x/c = 0.52, where x/c is the normalized axial distance from the blade leading edge.

NASA/TM—2010-216740 5
Figure 6.—Time-averaged tip Stanton number.
Figure 7.—Plane 1 on the tip surface.
Plane 1 is located in a region where the blue band of lower heat flux is present. Plane 2 is located in a region where the blue band of low heat flux on the tip is absent. Figure 7 shows a close-up view of Plane 1. Plane 1 is colored by normalized flow velocity. Blue indicates flow from pressure side to suction side and yellow indicates flow in the opposite direction (separated.) The green region on Plane 1 represents inflection points in the flow. Two distinct zones of separation are observed: one near the entrance to the tip gap from the pressure side and the other is midway through the tip gap on the casing. Figure 8 shows the region that is circled in Figure 7 in greater detail to verify that the zone is in fact separated. The separation reduces the heat flux by keeping the hot flow from the pressure side away from the tip surface as well as by creating a much larger buffer zone between the
Figure 8.—Zoomed in view of separated zone in Figure 7.
Figure 9.—Plane 2 on the tip surface.
tip and the hot gas than a boundary layer would. This separation zone is not seen in Plane 2 that is shown in Figure 9.
The blue band on the tip surface that is closer to the tip exit, near the suction side of the blade, is caused by the development of the boundary layer on the tip surface as well a separation triggered by shock boundary layer interaction. The boundary layer is thickened due to the presence of shocks and this leads to a further reduction in surface heat flux. These shocks can be seen in Figure 10 that shows density gradient contours along Plane 1 in the tip gap. The fluid from the pressure side over expands as it enters the tip gap and then goes through a series of shocks and expansions before a strong shock at the tip gap exit brings the pressure back to the level of the suction side.
Tip surface
Plane 1
Separation
Casing
Pressure side
Blue bands of low heat flux
…….. -Flow from pressure side to suction side (no separation)
…… . -Inflection point
……. -Separated flow

NASA/TM—2010-216740 6
Figure 10.—Compressions and expansions in the tip gap (on Plane 1).
Figure 11.—Discovery of unsteady “hot spot” (snapshot of video).
While viewing videos of unsteady flow in the tip gap it was observed that there exists a region in the vicinity of Plane 1 where the heat flux rises to levels comparable to that at the leading edge. A snapshot from this video is shown in Figure 11. Although the rise in heat flux is intermittent it could have a significant impact on the life of the blade material. The reattachment line is known to be associated with higher heat flux. However, the unsteadiness of this “hot spot”, as it shall henceforth be referred to, leads to the conclusion that there are other physical processes at work.
An important difference between subsonic and supersonic flows is the manner in which the boundary layer develops as a function of Reynolds number. For a supersonic boundary layer, the boundary layer thickness varies as (Ref. 23),
x
M
x Re
2
For a subsonic boundary layer, the boundary layer width varies as (Ref. 23),
xx Re
1
Here, Rex is the local flow Reynolds number. It is interesting to note that the hot spot occurs downstream of an oblique shock. It also occurs when the shock is at its strongest. This is easily explained because a stronger shock would lead to the downstream relative Mach number being lower and therefore lead to a smaller boundary layer thickness. In addition, the stronger oblique shock increases the temperature downstream of it causing higher heat flux to the surface.
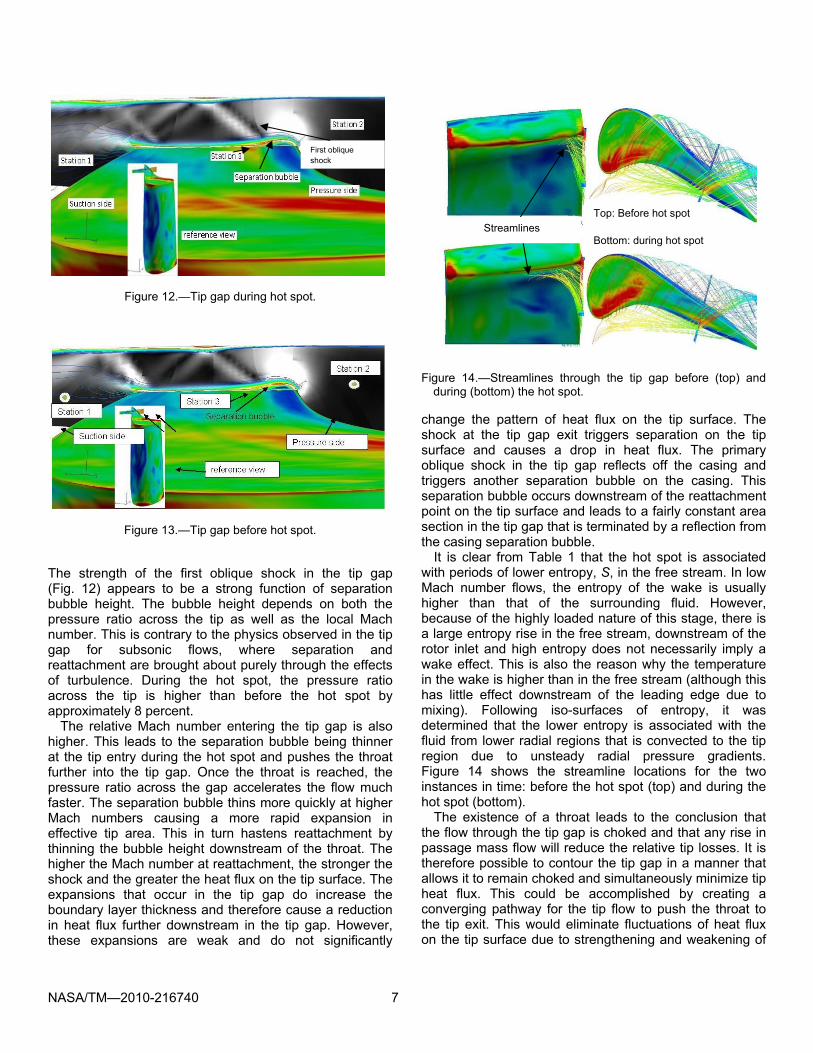
The levels of temperature, entropy, pressure and relative Mach number were analyzed before and during the hot spot. Table 1 shows the computed flow variables at two instances labeled 'before' and 'during' the hot spot. Station 2 refers to the tip gap entrance on the pressure side. Station 1 refers to the tip gap exit on the suction side. Station 3 is located on the tip surface region where the hot spot is observed. The bubble height, δbubble is non-dimensionalized with tip gap height, h. Table 1 shows that an 8 percent drop in tip gap pressure ratio leads to a 25 percent drop in bubble height and a 64 percent increase in Stanton number on the tip surface at station 3. The stations referred to in Table 1 are indicated in Figures 12 and 13 that show density gradient (similar to Schlieren visualizations) in black and white with overlaid vorticity contours in the tip gap during the occurrence of the hot spot and before the occurrence of the hot spot, respectively. When the flow moves from a white region to a black region, it indicates a compression. When the flow moves from a black region to a white region it indicates an expansion.
TABLE 1.—VARIABLES ACROSS TIP GAP NEAR HOT SPOT
Location Station 1 Suction side Station 2 Pressure side Station 3 Bubble(surface) height
P1 S1 P1/P2 P2 Mrelative S2 S1/S2 St δbubble/h
Before 0.167 0.35 0.41 0.41 0.6765 0.088 4.643 0.011 0.254During 0.157 0.121 0.38 0.41 0.6917 0.031 12.31 0.018 0.1905% difference 6.048 65.36 7.9 2.01 2.25 65.25 165 63.6364 25
Plane 1
NASA/TM—2010-216740 7
Figure 12.—Tip gap during hot spot.
Figure 13.—Tip gap before hot spot.
The strength of the first oblique shock in the tip gap (Fig. 12) appears to be a strong function of separation bubble height. The bubble height depends on both the pressure ratio across the tip as well as the local Mach number. This is contrary to the physics observed in the tip gap for subsonic flows, where separation and reattachment are brought about purely through the effects of turbulence. During the hot spot, the pressure ratio across the tip is higher than before the hot spot by approximately 8 percent.
The relative Mach number entering the tip gap is also higher. This leads to the separation bubble being thinner at the tip entry during the hot spot and pushes the throat further into the tip gap. Once the throat is reached, the pressure ratio across the gap accelerates the flow much faster. The separation bubble thins more quickly at higher Mach numbers causing a more rapid expansion in effective tip area. This in turn hastens reattachment by thinning the bubble height downstream of the throat. The higher the Mach number at reattachment, the stronger the shock and the greater the heat flux on the tip surface. The expansions that occur in the tip gap do increase the boundary layer thickness and therefore cause a reduction in heat flux further downstream in the tip gap. However, these expansions are weak and do not significantly
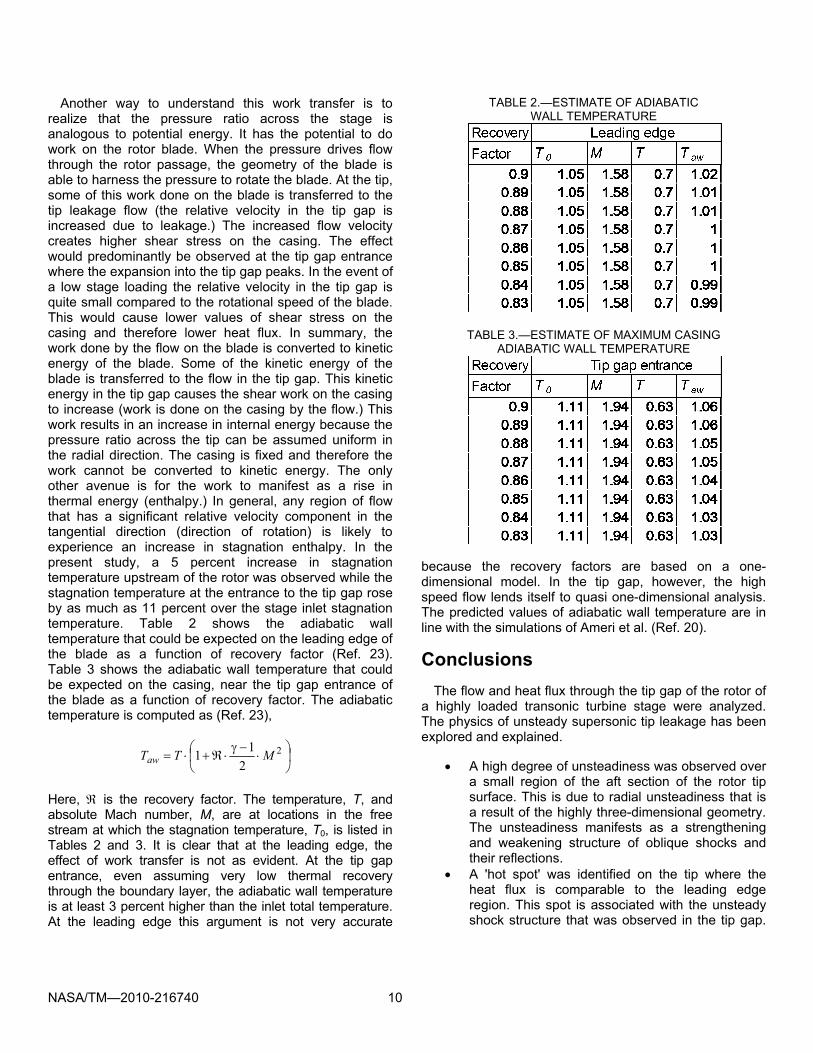
Figure 14.—Streamlines through the tip gap before (top) and
during (bottom) the hot spot.
change the pattern of heat flux on the tip surface. The shock at the tip gap exit triggers separation on the tip surface and causes a drop in heat flux. The primary oblique shock in the tip gap reflects off the casing and triggers another separation bubble on the casing. This separation bubble occurs downstream of the reattachment point on the tip surface and leads to a fairly constant area section in the tip gap that is terminated by a reflection from the casing separation bubble.
It is clear from Table 1 that the hot spot is associated with periods of lower entropy, S, in the free stream. In low Mach number flows, the entropy of the wake is usually higher than that of the surrounding fluid. However, because of the highly loaded nature of this stage, there is a large entropy rise in the free stream, downstream of the rotor inlet and high entropy does not necessarily imply a wake effect. This is also the reason why the temperature in the wake is higher than in the free stream (although this has little effect downstream of the leading edge due to mixing). Following iso-surfaces of entropy, it was determined that the lower entropy is associated with the fluid from lower radial regions that is convected to the tip region due to unsteady radial pressure gradients. Figure 14 shows the streamline locations for the two instances in time: before the hot spot (top) and during the hot spot (bottom).
The existence of a throat leads to the conclusion that the flow through the tip gap is choked and that any rise in passage mass flow will reduce the relative tip losses. It is therefore possible to contour the tip gap in a manner that allows it to remain choked and simultaneously minimize tip heat flux. This could be accomplished by creating a converging pathway for the tip flow to push the throat to the tip exit. This would eliminate fluctuations of heat flux on the tip surface due to strengthening and weakening of
First oblique shock
Top: Before hot spot
Bottom: during hot spot Streamlines

NASA/TM—2010-216740 8
Figure 15.—Hub Stanton number for steady (top) and time-averaged (bottom) simulations (Ref. 2).
oblique shocks and also increase the separation bubble distance in the streamwise direction. Alternatively, one could increase the separation bubble extent in the streamwise direction. This could however lead to a spike in heat flux at reattachment. If the throat were maintained at the tip gap entrance, diverging the tip gap downstream could minimize heat flux by preventing the occurrence of oblique shocks.
Endwall Heat Flux
Figure 15 (reproduced from Reference 2) shows the heat flux on the rotor hub for the steady (top) and time- averaged (bottom) simulations. The heat flux from the time- averaged simulation is higher than the heat flux from the steady simulation near the leading edge on the suction side while it is lower on the pressure side. This thermal redistribution has been discussed in Reference 2. Figure 15 also shows the location of probes at which heat flux was measured during the experiment. The pattern of heat transfer shown in Figure 15 is consistent with the work of Ameri et al. (Ref. 20). Figure 16 shows a comparison between the heat flux predicted by CFD and that obtained by experiment. On the hub, near the leading edge, there is almost a 100 percent difference between the steady and time-averaged simulations. This is partly due to the effect of the wake that interacts with the hub boundary layer.
Figure 16.—Hub Stanton number: comparison between CFD and experiment (Ref. 2).
Figure 17.—Hub boundary layer shape at rotor inlet, characterized by vorticity magnitude (Ref. 2).
Another reason for this difference is that the boundary layer for the steady simulation is rather flat. This is because the inlet profile is defined in a coarse manner that does not accurately capture the turbulent boundary layer in the manner that the time-averaged simulation does. This is why the heat flux computed by the steady simulation in the leading edge region of the hub matches the heat flux measured by experiment. The CFD simulation is fully turbulent and therefore the time-averaged simulation that is able to pass boundary layer information across the sliding interface, over predicts heat flux in the leading edge region of the hub. The 100 percent over prediction is indicative of the fact that the flow in this region is probably laminar. Towards the aft section of the hub the CFD predictions match very well with the experiment because the flow has now become fully turbulent. Figure 17 shows the shape of the inlet boundary layer for the steady (left) and the time-averaged (right) simulations. Here, the abscissa represents the %span with 0 percent at the hub and 100 percent at the casing.
Hub surface
Rotor inlet
0.02
0.00
St

NASA/TM—2010-216740 9
Figure 18.—Stanton number on rotor casing for steady (top) and time-averaged (bottom) of unsteady simulations (Ref. 12).
Figure 18 (again reproduced from Reference 12) shows heat flux on the rotor casing for the steady and time-averaged simulations. On the casing, due to the clearance flow the heat transfer is seen to be higher than on the hub especially in the region adjacent to the pressure side of the blade. This is because the hot air from the pressure side is being sucked towards the suction side and heats up the casing as it travels through the tip gap by the scrubbing action of the tip leakage flow (Ref. 12). The blue strip that follows it is associated with the separation zone described earlier and illustrated in Figure 4.
The heat flux distribution on the casing (Fig. 18) is similar to the work of Ameri et al. (Ref. 20) who observed that the heat flux directly above the rotor tip gap entrance is much higher than elsewhere in the domain because of work transfer involved in the interaction of two frames in relative motion (Refs. 21 and 22). Minimal effects of unsteadiness were observed on the hub and casing surfaces and this is in agreement with Ameri et al. (Ref. 20). In a simulation involving adiabatic walls, it is conceivable that the adiabatic wall temperature in some regions of the flow may rise above the stagnation temperature at the inlet to the stage.
This is due to the fact that the rotation of the blade adds a rotational velocity component to the flow. This additional velocity manifests as an increased shear near the casing because the casing experiences flow in the absolute frame. The fluid near the casing thus experiences an increased enthalpy and thereby higher stagnation
temperature than the stage inlet. This is true for both steady and unsteady simulations where two or more relative frames of motion are involved. Based on this analysis, one would expect a rise in stagnation temperature upstream of the leading edge as well. This region experiences large absolute velocity but the relative velocity is minimal. The shear work due to the rotation is thus converted to enthalpy of the fluid. The shear work and the enthalpy adjust to satisfy the energy equation because the pressure ratio across a stream tube that undergoes varying shear may remain constant in a relative frame of reference. The above discussion is borne out by the following thought experiment. Consider two stream tubes. The first stream tube is located near the casing at the tip gap entrance on the pressure side of the rotor and is oriented in the streamwise direction. The second stream tube is located near the tip surface. Assume that the thermal profile at the rotor blade row inlet is uniform with a stagnation temperature of unity. The energy equation requires that the internal energy convected into the stream tube be equal to the sum of the heat flux added to the tube, the pressure work done on the tube and work due to body forces and shear stresses. Assuming that the walls are adiabatic, it is clear to see that there is no effect of heat flux on the internal energy of the tubes. There are no body forces at work either. Assume that the pressure ratio across both tubes is comparable as are the absolute velocities. This means that the only difference in the internal energies of the two stream tubes is due to the shear work on them. Shear is related to velocity gradient. In the absolute frame of reference, the shear work on the fluid by the casing is approximately 6 times higher than the shear work on the fluid by the tip (or any surface rotating with the blade.) The Reynolds number in the relative frame is lower than in the absolute frame and this leads to a relatively thicker boundary layer. Coupled with a smaller velocity gradient across the boundary layer, this leads to the shear stress at the tip surface (second stream tube) being considerably smaller than at the casing. This is the reason why the stagnation temperature at the casing exceeds that at the tip. For the work presented in this paper (isothermal walls), the added work to the fluid manifests as large Stanton numbers on the casing at the tip gap entrance. This is evident from Figure 18. The average Stanton number at the tip gap entrance on the casing is 0.04. This is twice as high as the largest Stanton number found on the blade surface. The above discussion assumed that the flow in the tip gap is subsonic in the relative frame (to avoid effects of shock-boundary layer interaction.) For the current study this is true in the leading edge to quarter chord region of the tip gap, above which the highest Stanton number on the casing is observed. In addition, the entropy at the tip entrance is fairly constant leading to an increase in stagnation pressure. This is accompanied by a rapid acceleration of flow across the tip gap.
St
pressure side suction side
NASA/TM—2010-216740 10
Another way to understand this work transfer is to realize that the pressure ratio across the stage is analogous to potential energy. It has the potential to do work on the rotor blade. When the pressure drives flow through the rotor passage, the geometry of the blade is able to harness the pressure to rotate the blade. At the tip, some of this work done on the blade is transferred to the tip leakage flow (the relative velocity in the tip gap is increased due to leakage.) The increased flow velocity creates higher shear stress on the casing. The effect would predominantly be observed at the tip gap entrance where the expansion into the tip gap peaks. In the event of a low stage loading the relative velocity in the tip gap is quite small compared to the rotational speed of the blade. This would cause lower values of shear stress on the casing and therefore lower heat flux. In summary, the work done by the flow on the blade is converted to kinetic energy of the blade. Some of the kinetic energy of the blade is transferred to the flow in the tip gap. This kinetic energy in the tip gap causes the shear work on the casing to increase (work is done on the casing by the flow.) This work results in an increase in internal energy because the pressure ratio across the tip can be assumed uniform in the radial direction. The casing is fixed and therefore the work cannot be converted to kinetic energy. The only other avenue is for the work to manifest as a rise in thermal energy (enthalpy.) In general, any region of flow that has a significant relative velocity component in the tangential direction (direction of rotation) is likely to experience an increase in stagnation enthalpy. In the present study, a 5 percent increase in stagnation temperature upstream of the rotor was observed while the stagnation temperature at the entrance to the tip gap rose by as much as 11 percent over the stage inlet stagnation temperature. Table 2 shows the adiabatic wall temperature that could be expected on the leading edge of the blade as a function of recovery factor (Ref. 23). Table 3 shows the adiabatic wall temperature that could be expected on the casing, near the tip gap entrance of the blade as a function of recovery factor. The adiabatic temperature is computed as (Ref. 23),
2
2
11 MTTaw
Here, is the recovery factor. The temperature, T, and absolute Mach number, M, are at locations in the free stream at which the stagnation temperature, T0, is listed in Tables 2 and 3. It is clear that at the leading edge, the effect of work transfer is not as evident. At the tip gap entrance, even assuming very low thermal recovery through the boundary layer, the adiabatic wall temperature is at least 3 percent higher than the inlet total temperature. At the leading edge this argument is not very accurate
TABLE 2.—ESTIMATE OF ADIABATIC WALL TEMPERATURE
TABLE 3.—ESTIMATE OF MAXIMUM CASING ADIABATIC WALL TEMPERATURE
because the recovery factors are based on a one-dimensional model. In the tip gap, however, the high speed flow lends itself to quasi one-dimensional analysis. The predicted values of adiabatic wall temperature are in line with the simulations of Ameri et al. (Ref. 20).
Conclusions
The flow and heat flux through the tip gap of the rotor of a highly loaded transonic turbine stage were analyzed. The physics of unsteady supersonic tip leakage has been explored and explained.
A high degree of unsteadiness was observed over a small region of the aft section of the rotor tip surface. This is due to radial unsteadiness that is a result of the highly three-dimensional geometry. The unsteadiness manifests as a strengthening and weakening structure of oblique shocks and their reflections.
A 'hot spot' was identified on the tip where the heat flux is comparable to the leading edge region. This spot is associated with the unsteady shock structure that was observed in the tip gap.

NASA/TM—2010-216740 11
The aft 70 percent of the tip gap is choked by the formation of a throat at the tip gap entrance. It is thought that this could be used to redesign the tip to push the choke point towards the tip gap exit near the suction side and thus attenuate the heating effect of the oblique shocks. In this case a prolonged separation zone would also be beneficial in the tip gap.
The steady simulation provided better agreement with
experiment for Stanton number on the hub surface, near the rotor inlet. This was found to be due to the simplified manner in which inlet profiles are specified for steady simulations in many CFD solvers. The good agreement with experiment is therefore fortuitous rather than a result of better physical prediction.
The mechanism of work transfer that allows the stagnation enthalpy in certain regions of the flow passage to exceed that at the inlet is also explained. The argument proposed shows that it is not necessary for unsteadiness to be present to achieve such work transfer especially at the rotor tip gap entrance and the rotor leading edge.
References
1. Cumpsty, N., “Jet Propulsion,” Cambridge University Press, 2003.
2. Shyam, V., “3-D Unsteady Simulation of a Modern High Pressure Turbine Stage: Analysis of Heat Transfer and Flow,” PhD Thesis, The Ohio State University, Columbus, Ohio, December 2009.
3. Bunker, R.S., “A Review of Turbine Blade Tip Heat Transfer,” Annals of the New York Academy of Science, Vol. 934, pp. 64–79, January 2006.
4. Ameri, A.A., “Turbine Blade Tip Design and Tip Clearance Treatment,” Notes from von Karman Lecture Series 2004, June 2004.
5. Zhou, C., and Hodson, H., “The Tip Leakage Flow of an Unshrouded High Pressure Turbine Blade With Tip Cooling,” ASME-GT2009-59637, June 2009.
6. Ameri, A.A., Steinthorsson, E., Rigby, D.L., “Effect of Squealer Tip on Rotor Heat Transfer and Efficiency,” Journal of Turbomachinery, Vol. 120, pp. 753–759, October 1998.
7. Ameri, A.A., Steinthorsson, E., Rigby, D.L., “Effects of Tip Clearance and Casing Recess on Heat Transfer and Stage Efficiency in Axial Turbines,” Journal of Turbomachinery, Vol. 121, pp. 683–693, October 1999.
8. O'Dowd, D., Zhang, Q., Ligrani, P., He, L., Friedrichs, S., “Comparison of Heat Transfer Measurement Techniques on a Transonic Turbine Blade Tip,” ASME-GT2009-59376, June 2009.
9. Hofer, T., Arts, T., “Aerodynamic Investigation of the Tip Leakage Flow for Blades with Different Tip
Squealer Geometries at Transonic Conditions,” ASME-GT2009-59909, June 2009.
10. Krishnababu, S.K., Dawes, W.N., Hodson, H.P., Lock, G.D., Hannis, J., Whitney, C., “Aero-Thermal Investigations of Tip Leakage Flow in Axial Flow Turbines, Part II -Effect of Relative Casing Motion,” ASME 2007-GT-27957, May 2007.
11. Wheeler, A.P.S., Atkins, R., He, L., “Turbine Blade Tip Heat Transfer in Low and High Speed Flows,” ASME- GT2009-59404, June 2009.
12. Shyam, V., Ameri, A., Luk, D.F., and Chen, J.P., “3-D Unsteady Simulation of a Modern High Pressure Turbine Stage Using Phase Lag Periodicity: Analysis of Flow and Heat Transfer,” ASME GT2009-60322
13. Chen, J.P., and Whitfield, D.L., “Navier-Stokes Calculations for the Unsteady Flowfield of Turbomachinery,” AIAA–93–0676, January 1993.
14. Chen, J.P., and Barter, J., “Comparison of Time- Accurate Calculations for the Unsteady Interaction in Turbomachinery Stage,” AIAA-98-3292, July 1998.
15. Chen, J.P., and Briley, W.R., “A Parallel Flow Solver for Unsteady Multiple Blade Row Turbomachinery Simulations,” ASME-2001-GT-0348. June 2001.
16. Luk, D.F., “Steady Heat Transfer predictions for a Highly Loaded Single Stage Turbine with a Flat Tip,” Masters Thesis, The Ohio State University, Columbus, Ohio, October 2008.
17. Tallman, J.A., Haldeman, C.W., Dunn,M.G., Tolpadi, A.K., and Bergholz, R.F., “Heat Transfer Measurements and Predictions for a Modern, High-Pressure, Transonic Turbine, Including Endwalls,” ASME-GT2006-90927, May 2006.
18. Green, B.R., Barter, J.W., Haldeman, C.W., and Dunn, M.G., “Averaged and Time-Dependent Aerodynamics of a High Pressure Turbine Blade Tip Cavity and Stationary Shroud: Comparison of Computational and Experimental Results,” ASME-2004-GT-53443, October 2005.
19. Zhu, J., Shih, T.H., “A Turbulence Module for the NPARC Code,” NASA CR-198358, July 1995
20. Ameri, A.A., Rigby ,D.L., Steinthorsson, E., Heidmann, J., and Fabian, J.C., “Unsteady Analysis of Blade and Tip Heat Transfer as Influenced by the Upstream Momentum and Thermal Wakes,” ASME-GT2008-51242, June 2007.
21. Thorpe, S.J., and Ainsworth, R., “The Effects of Blade Passing on the Heat Transfer Coefficient of the Over-tip Casing in a Transonic Turbine Stage,” Proc. 2006 ASME Turbo Expo, Paper GT2006-90534, May 2006.
22. Thorpe, S.J., Miller, R.J., Yoshino, S., Ainsworth, R.W., and Harvey, N.W., “The Effect of Work Processes on the Casing Heat Transfer of a Transonic Turbine,” ASME Turbo Expo, Paper GT2005-68437, 2005.
23. Shapiro, A.H., “The Dynamics and Thermodynamics of Compressible Fluid Flows,” The Ronald Press Company, 1954.

REPORT DOCUMENTATION PAGE Form Approved
OMB No. 0704-0188 The public reporting burden for this collection of information is estimated to average 1 hour per response, including the time for reviewing instructions, searching existing data sources, gathering and maintaining the data needed, and completing and reviewing the collection of information. Send comments regarding this burden estimate or any other aspect of this collection of information, including suggestions for reducing this burden, to Department of Defense, Washington Headquarters Services, Directorate for Information Operations and Reports (0704-0188), 1215 Jefferson Davis Highway, Suite 1204, Arlington, VA 22202-4302. Respondents should be aware that notwithstanding any other provision of law, no person shall be subject to any penalty for failing to comply with a collection of information if it does not display a currently valid OMB control number. PLEASE DO NOT RETURN YOUR FORM TO THE ABOVE ADDRESS.
1. REPORT DATE (DD-MM-YYYY) 01-06-2010
2. REPORT TYPE Technical Memorandum
3. DATES COVERED (From - To)
4. TITLE AND SUBTITLE Analysis of Unsteady Tip and Endwall Heat Transfer in a Highly Loaded Transonic Turbine Stage
5a. CONTRACT NUMBER
5b. GRANT NUMBER
5c. PROGRAM ELEMENT NUMBER
6. AUTHOR(S) Shyam, Vikram; Ameri, Ali; Chen, Jen-Ping
5d. PROJECT NUMBER
5e. TASK NUMBER
5f. WORK UNIT NUMBER WBS 561581.02.08.03.21.03
7. PERFORMING ORGANIZATION NAME(S) AND ADDRESS(ES) National Aeronautics and Space Administration John H. Glenn Research Center at Lewis Field Cleveland, Ohio 44135-3191
8. PERFORMING ORGANIZATION REPORT NUMBER E-17317
9. SPONSORING/MONITORING AGENCY NAME(S) AND ADDRESS(ES) National Aeronautics and Space Administration Washington, DC 20546-0001
10. SPONSORING/MONITOR'S ACRONYM(S) NASA
11. SPONSORING/MONITORING REPORT NUMBER NASA/TM-2010-216740
12. DISTRIBUTION/AVAILABILITY STATEMENT Unclassified-Unlimited Subject Categories: 02 and 34 Available electronically at http://gltrs.grc.nasa.gov This publication is available from the NASA Center for AeroSpace Information, 443-757-5802
13. SUPPLEMENTARY NOTES
14. ABSTRACT In a previous study, vane-rotor shock interactions and heat transfer on the rotor blade of a highly loaded transonic turbine stage were simulated. The geometry consists of a high pressure turbine vane and downstream rotor blade. This study focuses on the physics of flow and heat transfer in the rotor tip, casing and hub regions. The simulation was performed using the Unsteady Reynolds-Averaged Navier- Stokes (URANS) code MSU-TURBO. A low Reynolds number k-ε model was utilized to model turbulence. The rotor blade in question has a tip gap height of 2.1 percent of the blade height. The Reynolds number of the flow is approximately 3x10⁶ per meter. Unsteadiness was observed at the tip surface that results in intermittent “hot spots”. It is demonstrated that unsteadiness in the tip gap is governed by inviscid effects due to high speed flow and is not strongly dependent on pressure ratio across the tip gap contrary to published observations that have primarily dealt with subsonic tip flows. The high relative Mach numbers in the tip gap lead to a choking of the leakage flow that translates to a relative attenuation of losses at higher loading. The efficacy of new tip geometry is discussed to minimize heat flux at the tip while maintaining choked conditions. In addition, an explanation is provided that shows the mechanism behind the rise in stagnation temperature on the casing to values above the absolute total temperature at the inlet. It is concluded that even in steady mode, work transfer to the near tip fluid occurs due to relative shearing by the casing. This is believed to be the first such explanation of the work transfer phenomenon in the open literature. The difference in pattern between steady and time-averaged heat flux at the hub is also explained. 15. SUBJECT TERMS Leakage; Stanton number; Heat transfer; Supersonic turbines; Rotor-stator interactions
16. SECURITY CLASSIFICATION OF: 17. LIMITATION OF ABSTRACT UU
18. NUMBER OF PAGES
17
19a. NAME OF RESPONSIBLE PERSON STI Help Desk (email:[email protected])
a. REPORT U
b. ABSTRACT U
c. THIS PAGE U
19b. TELEPHONE NUMBER (include area code) 443-757-5802
Standard Form 298 (Rev. 8-98)Prescribed by ANSI Std. Z39-18

