aiming higher: assessing higher achievement’s out-of
TRANSCRIPT

AIMING HIGHERAssessing Higher Achievement’s Out-of-School Expansion Efforts
Ivonne GarciaJean Baldwin GrossmanCarla HerreraMarissa StrassbergerMichelle DixonLeigh Linden
June 2020


Aiming HigherAssessing Higher Achievement’s Out-of-School Expansion Efforts
IVONNE GARCIA(MDRC)
JEAN BALDWIN GROSSMAN(MDRC and Princeton University)
CARLA HERRERA(Independent Consultant)
MARISSA STRASSBERGER(MDRC)
MICHELLE DIXON(MDRC)
LEIGH LINDEN(The University of Texas at Austin, BREAD, NBER, J-PAL, IZA)
JUNE 2020

For information about MDRC and copies of our publications, see our website: www.mdrc.org.
Copyright © 2020 by MDRC®. All rights reserved.
FUNDERSFunding for this report came from the U.S. Department of Education under its Investing in Innovation (i3) initiative, un-der grant number U411B140013, and Venture Philanthropy Partners (VPP). The i3 grant called for Higher Achievement to reform its out-of-school-time curriculum and expand to other cities, and for MDRC to conduct an independent evalu-ation of the implementation and impacts of the reform and expansion.
Dissemination of MDRC publications is supported by the following organizations and individuals that help finance MDRC’s public policy outreach and expanding efforts to communicate the results and implications of our work to policymakers, practitioners, and others: The Annie E. Casey Foundation, Arnold Ventures, Charles and Lynn Schusterman Family Foundation, The Edna McConnell Clark Foundation, Ford Foundation, The George Gund Foundation, Daniel and Corinne Goldman, The Harry and Jeanette Weinberg Foun-dation, Inc., The JPB Foundation, The Joyce Foundation, The Kresge Foundation, and Sandler Foundation.
In addition, earnings from the MDRC Endowment help sus-tain our dissemination efforts. Contributors to the MDRC Endowment include Alcoa Foundation, The Ambrose Monell Foundation, Anheuser-Busch Foundation, Bristol-Myers Squibb Foundation, Charles Stewart Mott Foundation, Ford Foundation, The George Gund Foundation, The Grable Foun-dation, The Lizabeth and Frank Newman Charitable Founda-tion, The New York Times Company Foundation, Jan Nich-olson, Paul H. O’Neill Charitable Foundation, John S. Reed, Sandler Foundation, and The Stupski Family Fund, as well as other individual contributors.
The findings and conclusions in this report do not necessar-ily represent the official positions or policies of the funders.

OVERVIEWMany talented students in under-resourced schools do not reach their full potential. Research shows
that by sixth grade, children born into poverty have likely spent 6,000 fewer hours learning than their middle-class counterparts. Higher Achievement, an intensive summer and after-school program, aims to close that learning gap. It offers participants more than 500 hours of academic enrichment activities a year to help them meet the high academic standards expected of college-bound students. Known as “scholars,” Higher Achievement students enter the program during the summer before either fifth or sixth grade and commit to attending through eighth grade. The summer program consists of six weeks of morning classes in English Language Arts (ELA), math, science, and, in some cases, social studies, followed by enrichment activities in the afternoon, including chess, cooking, art, and soccer. During the school year, in addition to the program’s regular study hall and enrichment activities, a cadre of mostly young professionals volunteer one day a week, delivering 75-minute ELA or math lessons to small groups of scholars. These volunteers receive detailed lesson plans and training so they can successfully execute the program’s rigorous curricula. Part of what makes Higher Achievement affordable is its use of volunteers in this way.
An earlier experimental evaluation of Metro DC, Higher Achievement’s f lagship affiliate in Washington, DC, and Alexandria, Virginia, found that the program was effective in improving academic performance two years after students applied. Since then, Higher Achievement has expanded to three new cities: Baltimore, Maryland; Richmond, Virginia; and Pittsburgh, Pennsylvania. Keenly aware that many effective f lagship programs fail to be effective in new locations, the federal government funded this experimental validation study to examine the impacts at these expansion sites. Eligible students were randomly assigned either to a program group that could participate in Higher Achievement, or to a control group that could not enroll in the program. Comparing the two groups’ outcomes provided an estimate of the program’s impacts.
The study found that the expansion sites experienced many of the implementation challenges common to school-based, out-of-school-time programs (for example, staff turnover, coordination with the host school, and lower-than-hoped-for attendance by middle school students), as well as those often seen in new pro-grams (such as a lack of strong relationships with key partners and difficulty recruiting volunteers). Even so, Higher Achievement was found to be at least adequately implemented in all three cities. The study found that the program’s detailed lesson plans, with scripted questions and student instructions, enabled the volunteers to deliver rigorous academic lessons. Training is critical, though, so volunteers know how to respond when “off-script” questions or behavior issues arise.
Higher Achievement continued to be effective in the expansion sites. In particular:
• Program group students’ core grade point average (math, reading, science, and social studies) improved more than the control group’s grades two years after they had applied.
• The second-year grade impacts were particularly strong for students who started Higher Achievement solidly on grade level — the students the program was originally developed to serve.
• The impact on math and reading test scores in Year 2 was positive but not statistically significant.
The ability to improve middle school grades is notable; research shows that students who have stronger grades in middle school are more likely to succeed in high school. Indeed, school grades are more strongly related to later success in the workplace and in life than test score performance. Higher Achievement’s successful replication of the model in new cities suggests it could serve as a model to help students succeed nationwide.
AIMING HIGHER: ASSESSING HIGHER ACHIEVEMENT’S OUT-OF-SCHOOL EXPANSION EFFORTS | iii


CONTENTSOVERVIEW iii
LIST OF EXHIBITS vii
ACKNOWLEDGMENTS ix
EXECUTIVE SUMMARY ES-1
CHAPTER
1 Introduction 1 The Higher Achievement Model 3 Overview of the Evaluation 6
2 Implementation Findings 13 Mentor Recruitment and Retention 13 Mentors as Curriculum Instructors 15 Center Leadership 22 Center Operations and Program Delivery 24 Student Attendance and Engagement 26 Summary of Implementation Findings 29
3 Impacts on Students at Higher Achievement’s Three Expansion Sites 31
4 Reflections and Conclusions 45 Principal Findings 45 Working with Older Students: Lessons Learned 48 Looking Ahead 50
APPENDIX
A Study Recruitment and Impact Sample and Analysis 51
B Baseline Tables for Additional Analytic Samples 59
REFERENCES 67
AIMING HIGHER: ASSESSING HIGHER ACHIEVEMENT’S OUT-OF-SCHOOL EXPANSION EFFORTS | v


LIST OF EXHIBITSTABLE
ES.1 Higher Achievement Year 2 Study Impacts: Test Scores and Course Grades, Expansion Sites Sample ES-3
1.1 Distribution of Higher Achievement Centers Across Sites, by Type 4
1.2 Research Questions and the Data Used to Address Them 9
2.1 2018 Mentor Survey: Mentor Characteristics 14
2.2 Out-of-School-Time Academic Supports and Enrichment Activities, Program and Control Groups 28
3.1 Background Characteristics of Students in Expansion Sites Standardized Test Score Sample, Year 1 32
3.2 Higher Achievement Study Impacts: Test Scores and Course Grades, Expansion Site Sample 34
3.3 Out-of-School-Time Academic Supports and Enrichment Activities, Program and Control Groups 36
3.4 Higher Achievement Study Impacts on Test Scores and Course Grades, Upper and Lower Math Grade Subgroups 40
3.5 Higher Achievement Study Impacts on Test Scores and Course Grades, Gender Subgroups 42
4.1 Comparison of Impacts across Higher Achievement’s Two Studies 46
A.1 Data Availability Rates 55
A.2 Differential Attrition 56
B.1 Background Characteristics of Students in Expansion Sites, Standardized Test Score Sample, Year 2 61
B.2 Background Characteristics of Students in Expansion Sites, Course Grades Sample, Year 1 63
B.3 Background Characteristics of Students in Expansion Sites, Course Grades Sample, Year 2 65
AIMING HIGHER: ASSESSING HIGHER ACHIEVEMENT’S OUT-OF-SCHOOL EXPANSION EFFORTS | vii

FIGURE
1.1 Logic Model of the Higher Achievement Program 4
2.1 Percentage of Mentors with Four Students or Fewer per Small Group in Afterschool Academy, by Site 17
2.2 Percentage of 2018 Mentors with at Least 80 Percent of Common Core-Aligned Lessons Started, by Site and Subject 19
2.3 Percentage of 2018 Mentors Who Adequately Covered Common Core-Aligned Standards, by Site and Subject 20
2.4 Percent of 2018 Mentors Who Used All Four Learning Strategies During Mentoring Lessons, by Affiliate 21
2.5 Frequency of Sites That Met Fidelity by, Indicator 30
3.1 Average GPA of Entire Student Sample at Baseline 35
BOX
1.1 Higher Achievement’s Policies, Procedures, and Culture 5
1.2 A Typical Higher Achievement Weekly Schedule During the School Year 6
1.3 A Description of Higher Achievement’s New Afterschool Curricula 7
2.1 A Description of Higher Achievement’s New Afterschool Curricula 18
3.1 How to Read an Impact Table 37
LIST OF EXHIBITS (CONTINUED)
viii | AIMING HIGHER: ASSESSING HIGHER ACHIEVEMENT’S OUT-OF-SCHOOL EXPANSION EFFORTS
ACKNOWLEDGMENTSMany people contributed to this report and the study upon which it is based. Our first debt
of gratitude goes to the Higher Achievement center directors and the volunteer and scholar coordinators/managers of instruction, as well as the volunteer mentors and teachers at the par-ticipating centers. We’d also like to thank the staff members in the central offices of the school districts, who provided us with critical student records data. The assistance and cooperation of these individuals, who provided the rich and detailed information on which this report is based, was vital to the study going forward.
The study benefited greatly from the support and cooperation of key members of the Higher Achievement organization. Lynsey Jeffries and Lorena Martinez provided helpful feedback on the report. A special thank you goes to Mike DiMarco, Melissa Derricott, and Lorena Martinez, who met with the MDRC team members regularly and supported data collection efforts throughout the study, including providing key program data.
Cristofer Price at Abt Associates provided thorough, thoughtful, and much-welcomed technical assistance related to the study design and its implementation. He also went above and beyond in helping the report team navigate the i3 process. Isaac Castillo and Michelle Gilliard from Venture Philanthropy Partners also gave invaluable feedback.
Several MDRC staff members provided valuable assistance. Daphne Chen and Linda Ouyang played a central role in the collection of Higher Achievement program data, school records, and survey data, and provided general management support for the research team. Linda Ouyang conducted site visits and analyzed survey data as a member of the implementation research team. Lauren Scarola and Douglas Phillips were also key members of the implementation team, conducting site visits and interviews and coding the qualitative data. Lauren Scarola and Margaret Hennessy also contributed to analyzing the qualitative data. Seth Muzzy, Bulent Can, Usha Krishnan, Ron Bass, Jaye Song, and Melinda Jackson helped with the administration of the surveys, and Karen Burchwell helped with survey data collection. Alec Gilfillan also played a key role in analyzing survey data for the implementation study.
Kate Gualtieri, Lauren Scarola, Mary Bambino, and Sonia Drohojowska provided fiscal over-sight. Fred Doolittle, Marie-Andree Somers, and Ali Tufel carefully reviewed earlier drafts of this report and made comments that improved the final product. Jill Kirschenbaum edited the report and Carolyn Thomas prepared it for publication.
The Authors
AIMING HIGHER: ASSESSING HIGHER ACHIEVEMENT’S OUT-OF-SCHOOL EXPANSION EFFORTS | ix


EXECUTIVE SUMMARY“Talent is everywhere, but opportunity is not.”
— Higher Achievement, “Our Mission”
Many talented students in under-resourced schools and neighborhoods do not reach their full potential. Higher Achievement takes on this challenge by providing rigorous yet fun
learning activities during out-of-school time for students in grades five through eight.
THE HIGHER ACHIEVEMENT PROGRAM
Higher Achievement, an intensive summer and after-school program, offers its participants, called “scholars,” more than 500 hours of academic enrichment annually in its Achievement Centers, hosted in select middle schools in low-income neighborhoods. Unlike many academic, out-of-school-time programs in under-resourced schools, Higher Achievement is not a remedial program designed to help struggling students. Rather, it challenges its scholars to meet the high academic standards expected of college-bound students. Students enter Higher Achievement during the summer before fifth or sixth grade and are asked to commit to attending through their eighth-grade year. The program leverages a diverse community of adults after school and in the summer:
• A full-time director and assistant director at each Achievement Center oversee all aspects of the centers and relationships with families as well as school staff in the host middle school.1
• Trained volunteers (“mentors”) deliver 75-minute English Language Arts (ELA) classes and math lessons to groups of three or four scholars after school.
• Part-time staff (“achievement coaches” and “center aides”) oversee study hall sessions and deliver enrichment activities after dinner during the school year.
• During the summer, teachers deliver ELA, math, science, and, at some centers, social studies classes.
During a study of Higher Achievement that began in 2015 — described below — the program operated an Afterschool Academy three days a week (3:30 p.m. to 7:30 p.m.) for 25 weeks during the school year, as well as a six-week, eight-hour-a-day summer program called the Summer Academy.
1 “Assistant director” is used in this report for ease of reading. Higher Achievement calls this position “manager of instruction” or “volunteer and scholar coordinator.” The title varies by city.
EXECUTIVE SUMMARY | ES-1

The program was proven effective in a rigorous evaluation of the f lagship site, DC Metro (Washington, DC, and Alexandria, Virginia), conducted in the mid-2000s. Starting in 2009, Higher Achievement expanded to three new cities: Baltimore, Maryland, in 2009; Richmond, Virginia, in 2011; and Pittsburgh, Pennsylvania, in 2012.2 Keenly aware that many effective f lagship programs fail to stay effective when they expand, the U.S. Department of Education funded a validation study of Higher Achievement in 2015 to examine whether students’ academic performance was positively impacted at the expansion sites and whether a promising program can be scaled up and remain effective. MDRC, in collaboration with the authors of the first study of Higher Achievement, began the validation study in 2015. This report documents that study’s findings.
With funding from this study, Higher Achievement also expanded to new centers, developed additional after-school curricula, and piloted a different enrollment strategy at half of the centers — restricting enrollment to students who attended or would attend the host school, rather than drawing students from several schools.
The study found that even though the program experienced many of the implementation chal-lenges common to out-of-school-time programs and newer programs, it had positive impacts on students two years after they applied; in particular, students’ grades improved significantly. The impact on test scores, while positive, was not large enough to be statistically significant.3 Academic impacts in the first year were positive but small, becoming statistically significant only in the second year, and only for course grades. The second-year grade impacts were particularly strong for students who started Higher Achievement with stronger academic backgrounds — the students the program was originally developed to serve.
THE EVALUATION DESIGN
This report addresses three questions: (1) How did the Higher Achievement centers operate during the study and what lessons are there for similar programs? (2) Did scholars receive more academic enrichment over the two-year study period than they would have received without Higher Achievement? (3) How did Higher Achievement impact scholars’ grades and test scores over the two years since they applied?
Telephone interviews with staff members and mentors combined with surveys of center direc-tors and mentors revealed how the program operated and its challenges. To investigate how the program changed the academic enrichment environment for its scholars and how it affected their academic performance, the research team compared the behavior of the eligible youth who were randomly selected to be offered a spot in the program (the program group) with the outcomes of the nonselected students (the control group). Using school records to compare changes in test
2 Neighborhood district Henrico, Virginia, was added to the Richmond affiliate in 2016.
3 A statistically significant outcome is one that, in all likelihood, resulted from the program rather than chance alone.
ES-2 | AIMING HIGHER: ASSESSING HIGHER ACHIEVEMENT’S OUT-OF-SCHOOL EXPANSION EFFORTS

scores and grades between these two groups (who started out as equally motivated and able), the study concludes that the differences in their outcomes were caused by participation in Higher Achievement, that is, the program’s impact. (See Table ES.1) In addition, a phone survey with a randomly selected subset of program and control group parents showed how their children’s academic enrichment experiences differed.
TABLE ES.1 Higher Achievement Year 2 Study Impacts: Test Scores and Course Grades, Expansion Sites Sample
SCORE/GRADE
OUTCOMEPROGRAM
GROUPCONTROL
GROUPESTIMATED
DIFFERENCEEFFECT
SIZE P-VALUE
Test-score outcomes
Math -0.05 -0.11 0.06 0.06 0.414
ELA 0.00 -0.05 0.05 0.05 0.528
Number of students 394 251
Course-grade outcomes
GPA 2.58 2.43 0.15 0.20 *** 0.006
Math 2.49 2.31 0.18 0.19 ** 0.014
English 2.55 2.39 0.17 0.18 ** 0.017
Science 2.63 2.48 0.15 0.17 ** 0.033
Social Studies 2.65 2.55 0.11 0.12 0.134
Number of students 414 255
SOURCE: MDRC's calculations use student records data from Baltimore, Pittsburgh, and Richmond/Henrico public school districts from the 2014-2015 through 2017-2018 school years. Student records data were combined with baseline application data received from Higher Achievement National.
NOTES: Estimated differences are regression adjusted using ordinary least squares, controlling for baseline characteristics and random assignment block. The values in the column labeled “Program Group” are the observed means for children who were randomly assigned to attend the Higher Achievement program. The “Control Group” values in the next column are the regression-adjusted means for children who were randomly assigned to not attend the Higher Achievement program. The values in the “Effect Size” column are the estimated effect divided by the standard deviation for the sample. Statistical significance levels are indicated as follows: *** = 1 percent; ** = 5 percent; * = 10 percent. GPA is grade point average and is measured on a scale of 1.0 to 4.3. Rounding may cause slight discrepancies in sums and differences.
EXECUTIVE SUMMARY | ES-3

IMPLEMENTATION FINDINGS
Overall, the study found that Higher Achievement expansion sites faced many operational challenges common to other school-based, out-of-school-time programs — for example, staff turnover, coordination with the host school, and lower-than-hoped-for attendance by middle school students — as well as to new programs, such as a lack of strong relationships with key partners and difficulty recruiting enough volunteers. Despite these challenges, the centers were able to put most of the key features of Higher Achievement in place.
Mentor Recruitment and Providing Small Group Learning Settings
All but the Richmond centers were able to recruit adequate numbers of adult volunteers in order to maintain the preferred ratio of four scholars to one mentor and allowing centers to provide small group instruction affordably. Even so, unlike at f lagship affiliate DC Metro, center direc-tors felt they could have used additional mentors to provide scholars with more individualized assistance.
Volunteers as Instructors
Detailed lesson plans with scripted questions and student instructions allowed mentors to deliver rigorous academic lessons, covering most of the intended content. Mentors also succeeded in get-ting scholars to practice various “habits of mind” outlined in the curriculum, such as supporting an argument with examples. However, mentors used instructional strategies such as “turn and talk” to your neighbor — intended to strengthen how a student thinks — less than was hoped for. Centers supported these volunteer efforts through preservice training, but getting mentors to attend brief, post-session training sessions and providing them with individualized feedback throughout the school year was more challenging.
Center Operations and Program Delivery
Operating a three-day-a-week program for 25 weeks during the school year proved doable for all the sites. Operating a five-day-a-week summer program in the same schools was more problem-atic because the host schools were not always open five days a week during the summer months.
Center Leadership
Seasoned leadership — ideally both the center director and assistant director — emerged as the crucial element to successful center operations. However, to the detriment of the program, and like many after-school programs, most centers struggled with turnover in leadership.
Student Attendance
Like other middle school enrichment programs, Higher Achievement struggled to get the stu-dents to make the full three- or five-day-a-week commitment. Middle school students want to
ES-4 | AIMING HIGHER: ASSESSING HIGHER ACHIEVEMENT’S OUT-OF-SCHOOL EXPANSION EFFORTS

participate in a variety of other activities (sports, music, religion), so Higher Achievement was f lexible in its attendance requirements. Despite (or perhaps because of) this f lexibility, over the two years, many more program group students experienced academic enrichment activities than did control group students.4
Student Engagement
Many studies of out-of-school-time programs suggest that the relationships students form with program adults are strongly related to how long students stay and engage in a program. Higher Achievement provides scholars with many adults to bond with, including the center director, the assistant director, study hall supervisors, summer teachers, and ELA and math mentors. The study found that while mentors formed solid relationships with scholars that fostered posi-tive experiences in the program, relationships with the centers’ paid staff seemed particularly important in shaping children’s engagement and behavior. The center staff, who interact with all the scholars at a center, are present every day, both during the school year and summer — often for multiple years. The mentors’ commitments are only for one day a week during the school year, with less than half of them continuing into a second year. The consistency of the center staff ’s presence over a longer period appears to be an important element of scholars’ experience.
IMPACT FINDINGS
• Two years after applying to Higher Achievement, program group students at the expansion sites earned better grades than control group students in English, math, and science.
At the end of the first year, a slight impact on grades was observed, but the effects were too small to be meaningful or significant, other than to hint at progress. By the end of the second year, however, the impacts on grades grew and became statistically significant. The impact on test scores appears to be smaller. After the first year, there were essentially no differences in the test scores of program and control students. After the second year, the differences increased, but were still not large enough to meet established standards of statistical significance. (See Table ES.1.)
• Higher Achievement appeared to be more effective for scholars who joined the program solidly on grade level (earning As or Bs) than students with lower grades.
The grade point average in Year 2 for the program group students earning As or Bs in math at baseline was 0.31 of a standard deviation higher than the grade point average of similarly strong
4 During the first school year, 83 percent of the sampled parents of program students reported that their child attended an academic program (most likely Higher Achievement), compared with only 13 percent of control group parents. During the summer between the first and second school years, 76 percent of program students participated in academic enrichment activities compared with none of the control students. During the second school year, 83 percent of program students participated in academic enrichment activities compared with 13 percent of the control students.
EXECUTIVE SUMMARY | ES-5

control group students. As noted, Higher Achievement is not a remedial program, but was de-signed to accelerate and deepen on-grade learning. Thus, it is not surprising that students who struggled more with grade-level material got less out of the program.
• Higher Achievement also appeared to be particularly advantageous for male scholars.
The impact on boys’ math grades was greater than that on the girls’ math grades in Year 1 and, most likely, in Year 2.5 Without Higher Achievement, boys’ math performance (as ref lected in the control group for boys) fell much more than the girls’ performance over time. With Higher Achievement, however, the fall in boys’ math grades was reduced. That pattern is also seen for grade point average, but the difference in impact by gender over two years is not large enough to be statistically significant.
REFLECTIONS AND CONCLUSIONS
Research shows that by sixth grade, middle class children have likely spent 6,000 more hours learning than children born into poverty.6 The results of this disparity affect all members of society through its impact on the economy. Leveling the educational playing field is thus a goal of many members of society — citizens and policymakers alike. This study shows that Higher Achievement can be part of the solution.
The ability to improve middle school grades is noteworthy because the literature shows that students who have stronger academic achievement in middle school are more likely to succeed in high school.7 Indeed, a growing body of literature is showing that school performance mea-sures such as grades are more strongly related to later success in the workplace and in life than test score performance.8 Researchers believe this is because grades capture not only academic knowledge but also the development of characteristics that are highly valued by employers, such as perseverance, self-control, attentiveness, and other key social-emotional competencies. Employers are demanding and rewarding through higher wages these noncognitive skills more
5 The estimated impact for Year 2 has a p-value of 0.11, which is only slightly larger than the 0.10 threshold for statistical significance.
6 ExpandED Schools, “The 6,000-Hour Learning Gap” (2013), website: www.expandedschools.org/policy-documents/6000-hour-learning-gap#sthash.c2cNWc7o.nrWffwfQ.dpbs.
7 Jean Baldwin Grossman and Siobhan M. Cooney, Paving the Way for Success in High School and Beyond: The Importance of Preparing Middle School Students for the Transition to Ninth Grade (Philadelphia: Public/Private Ventures, 2009); Olga Reyes, Karen L. Gillock, Kimberly Kobus, and Bernadette Sanchez, “A Longitudinal Examination of the Transition into Senior High School for Adolescents from Urban, Low-Income Status, and Predominantly Minority Backgrounds,” American Journal of Community Psychology 28, 4 (2000): 519-544. Although not measured in the study, Higher Achievement’s program model tries to strengthen scholars’ sense of scholastic competence by intentionally giving them not only challenging material but also the individual attention needed to master it.
8 Tim Kautz, James J. Heckman, Ron Diris, Bas Ter Weel, and Lex Borghans, Fostering and Measuring Skills: Improving Cognitive and Non-Cognitive Skills to Promote Lifetime Success (Cambridge, MA: National Bureau of Economic Research, 2014), website: www.nber.org.
ES-6 | AIMING HIGHER: ASSESSING HIGHER ACHIEVEMENT’S OUT-OF-SCHOOL EXPANSION EFFORTS

than they did 20 years ago.9 Afterschool and summer programs that provide young people with challenging activities focused on building one or more personal or social skills such as persistence or character, which underlie many of Higher Achievement’s activities, are effective in promoting social-emotional development.10
Higher Achievement occupies a slightly different educational space than many academically oriented programs in under-resourced neighborhoods. Most of these programs are structured to help students who are performing below grade level, with their academic problems front and center. Higher Achievement was designed to propel academically motivated students in under-resourced schools toward college. This focus helps explain why analyses found that the program was less effective at serving academically struggling students. This is simply not the group that Higher Achievement traditionally targets.
The current evaluation provided Higher Achievement with extensive feedback. Learning from the research team, talking to families in the program, and continuing its own internal evaluation efforts have spurred the organization to improve its offerings in several ways, starting in the 2020-2021 school year. First, it is expanding the Afterschool Academy from three to four days a week and it will start a week earlier in the school year. Two days a week will include mentoring sessions and the other two will focus on enrichment activities. The program is introducing a new curriculum that includes more hands-on activities and is focused on science, technology, engineering, and math (STEM) and humanities, and on building social-emotional skills. Study hall will also be expanded to include both homework help and academic skill-building activities. Higher Achievement centers are also no longer holding a Summer Academy. Instead, they will provide resources to help families enroll in other summer programs with strong track records. This will enable center staff members to meet individually with each scholar and their family to focus on high school planning, college visits, and preparing for the Afterschool Academy. Finally, applicants will have to have earned at least a C in math or ELA to be eligible to enroll, instead of not having any grade requirements. Taken together, these changes are designed to increase opportunities for students to form strong relationships with the program adults and obtain a greater “dosage” of enrichment.
The results of this evaluation should encourage Higher Achievement and funders to further expand the program. Higher Achievement was able to do what few expansion programs have been able to demonstrate: It expanded to new school districts, created experiences for the schol-ars that were more enriching than what they would have gotten without it, and maintained its
9 Diane Whitmore Schanzenbach, Ryan Nunn, Lauren Bauer, Megan Mumford, and Audrey Breitwieser, Seven Facts on Noncognitive Skills from Education to the Labor Market (Washington, DC: The Hamilton Project, Brookings Institution, 2016).
10 Elizabeth Devaney, Supporting Social and Emotional Development through Quality Afterschool Programs (Washington, DC: American Institutes for Research, 2015); Reed W. Larson and Rachel M. Angus, “Adolescents’ Development of Skills for Agency in Youth Programs: Learning to Think Strategically,” Child Development 82, 1 (2011): 277-294; Ida Salusky, Reed W. Larson, Aisha Griffith, Joanna Wu, Marcela Raffaelli, Niwako Sugimura, and Maria Guzman, “How Adolescents Develop Responsibility: What Can Be Learned from Youth Programs,” Journal of Research on Adolescence 24, 3 (2014): 417-430.
EXECUTIVE SUMMARY | ES-7
effectiveness across these new sites. To maintain its quality, Higher Achievement has a culture of constant improvement — always learning from its experiences and adapting — and thus will be continuing its program development in the upcoming years. It serves as a strong model for other after-school and summer programs in its quest to improve implementation quality and effectiveness.
ES-8 | AIMING HIGHER: ASSESSING HIGHER ACHIEVEMENT’S OUT-OF-SCHOOL EXPANSION EFFORTS
CHAPTER
1
Introduction
“Talent is everywhere, but opportunity is not.”— Higher Achievement, “Our Mission”
Many talented students in under-resourced schools do not reach their full potential. Higher Achievement’s mission is to address this opportunity gap and improve educational equity
by providing rigorous and fun learning activities during out-of-school time for students in grades five through eight.
Higher Achievement offers its participants, called “scholars,” more than 500 hours of academic enrichment annually in its Achievement Centers, hosted in select middle schools in low-income neighborhoods. Unlike many such academic out-of-school-time programs, Higher Achievement is not a remedial program designed to help struggling students. Rather, it challenges its scholars to meet the high academic standards expected of all college-bound students. The program does so by using a diverse community of adults — trained volunteers called “mentors,” part-time staff called “achievement coaches,” center aides, and summer teachers — to deliver homework help, enrichment activities, and academic instruction after school and during the summer months.
The program was proven effective in a rigorous evaluation of Higher Achievement’s f lagship site, DC Metro (Washington, DC, and Alexandria, Virginia), conducted in the mid-2000s. Students applying to the program during that study were randomly assigned to a program group and allowed to enroll in Higher Achievement, or to a control group and not allowed to enroll. Researchers then measured the two groups’ academic performance each spring for two years, using a standardized test of reading comprehension and math problem solving.1 By the second spring, the gains in test scores were larger in the program group than in the control group. Fueled by this positive finding, Higher Achievement expanded to three additional affiliates: Baltimore, Maryland; Pittsburgh, Pennsylvania; and Richmond, Virginia.2
1 Herrera, Linden, Arbreton, and Grossman (2011). To assess both reading and math skills in less than three hours, the evaluators could not administer the full battery of reading (vocabulary and reading comprehension) and math (math procedures and problem solving) questions. Instead, they had sample members take only the reading comprehension and math problem solving Stanford Achievement Test (Version 10) subtests, since these subtests required vocabulary knowledge and math procedures knowledge, respectively, and thus were relatively comprehensive.
2 Neighborhood district Henrico, Virginia, was added to the Richmond affiliate in 2016.

Expansion sites, however, rarely have the same impacts as f lagship sites. For a program to be successful at a new location, it needs to adapt to that new environment. In doing so, however, staff members often inadvertently alter or drop critical elements that make the program suc-cessful.3 In addition, the quality of implementation is often weaker in new programs that are less practiced at providing services.4 Finally, because the environments of the expansion cities differ from that of the f lagship program, services that were unique and essential in the original community may be no better than what already exists in the new communities, reducing the program’s impact there. Leaders of social programs are often drawn to expand into neighbor-hoods where need appears high, without first determining what services are already in place and how the new program would improve on them. All these factors tend to make expansion sites less effective than the original one. Keenly aware of this fact, the U.S. Department of Education funds validation studies to determine whether a promising program can be scaled up and remain effective. MDRC, in collaboration with the authors of the first study of Higher Achievement, began a validation study of Higher Achievement in 2015 to examine whether it has remained effective at increasing the academic skills of its scholars in its new expansion sites.
This report documents that study’s findings. No program is static, and like all successful pro-grams, Higher Achievement is constantly adjusting its offerings to adapt to evolving educational priorities and changing conditions. As part of its continuous improvement process, Higher Achievement used the grant for the current study not only to expand to new centers but to pilot a different enrollment strategy (described below) in half of its centers. In addition, because state educational standards had evolved, with many states adopting Common Core State Standards, Higher Achievement also used the grant to commission new after-school English Language Arts (ELA) and math curricula aligned with these standards. Thus, before discussing the revised pro-gram’s impacts, the implementation section in this report discusses how the model operated in the affiliates, the challenges they faced, and what factors helped mitigate those challenges. After the implementation section, the impacts of the program in the expansion sites are presented.
Unlike the earlier impact study of Higher Achievement, which assessed the impacts on reading comprehension and math problem solving skills only, this study examines the impacts on the entire standardized assessment of ELA and math — that is, students’ scores on the full battery of ELA and math questions. Because recent literature indicates that grades are more predictive of future earnings than test scores, the current study also assessed the impacts on English, math, science, and social studies course grades.5
The current study found that even though the expansion program experienced many of the implementation challenges common to out-of-school-time programs and newer programs, it had positive impacts on students two years after they applied. In particular, students’ grades improved significantly. The impact on test scores, while positive, was not large enough to be
3 Paulsell, Del Grosso, and Supplee (2014); Racine (2004).
4 Durlak and DuPre (2008).
5 Heckman and Kautz (2012).
2 | AIMING HIGHER: ASSESSING HIGHER ACHIEVEMENT’S OUT-OF-SCHOOL EXPANSION EFFORTS

statistically significant.6 As seen in the first study, academic impacts in the first year were posi-tive, but small, becoming statistically significant only in the second year, and only for course grades. The second-year grade impacts were particularly strong for students who started Higher Achievement with stronger academic backgrounds — the students the program was originally developed to serve.
THE HIGHER ACHIEVEMENT MODEL
Higher Achievement was founded in 1975 in Washington, DC, and significantly expanded its academic offerings and locations in 1999.7 Supported by both private and public funding, the nonprofit organization runs a multiyear, academically focused out-of-school-time program in under-resourced middle schools. It is designed to serve students into and through their middle school years. The program’s goal is to help young people develop skills, behaviors, and attitudes that will improve their academic performance and ultimately increase their acceptance in competitive high schools that could launch them into college and careers. In 2009, the program expanded to Baltimore, and then to Richmond in 2011 and Pittsburgh in 2012. During the study, it operated 19 Higher Achievement centers in middle schools across the four metropolitan areas (including the DC Metro area of Washington, DC, and Alexandria, Virginia).8 Each affiliate city raises and manages its own funding for its centers, and thus affiliates have different levels of resources and funder requirements. Higher Achievement is guided by a board of directors and has a central office in Washington, DC, home to the program’s chief executive officer and six staff members.
Higher Achievement provides rigorous academic enrichment opportunities to students whose families are interested in making an intensive long-term commitment to their child’s educational development. While students come to the program with varying academic strengths, all of the scholars, supported by their families, want to be their best. Students enter the program in the summer before fifth or sixth grade and are expected to participate through the end of eighth grade for a total of three or four years. They attend Higher Achievement’s six-week Summer Academy, and during the school year they participate in the Afterschool Academy for 25 weeks. Figure 1.1 shows the program’s logic model.
The Higher Achievement Centers
Higher Achievement operates in select middle schools within a district but is typically open to any rising fifth- or sixth-grader in the city. For convenience, students have typically gone to the
6 A statistically significant outcome is one that, in all likelihood, resulted from the program rather than chance alone.
7 The earlier version of the program, which operated from 1975 to 1998 in Washington, DC, only, provided one-third of the hours of services included in the current program and was offered exclusively to gifted and advanced students.
8 Some centers closed during the study. As of 2020, Higher Achievement is operating 14 centers.
AIMING HIGHER: ASSESSING HIGHER ACHIEVEMENT’S OUT-OF-SCHOOL EXPANSION EFFORTS | 3

center closest to their home, even if they do not or will not attend that host school once they enter middle school. This version of the model is called “the magnet program,” in that students from various schools are drawn to the center in one host school. In 2013, after a strategic planning process aimed at increasing school-level engagement and impact, Higher Achievement decided to implement a “single-school” version of the model. The same after-school and summer ser-vices were provided in the single-school centers as in the magnet centers, but only students who attended or were going to attend that host middle school could go to the center there. Higher Achievement believed that the single-school version of the model would enable staff members to serve students better by coordinating more closely with their school-day teachers and by serving a critical mass of students, potentially changing the entire school’s academic climate. In some of these schools, Higher Achievement also agreed to open up its homework help sessions to all of the school’s students, even those who were not Higher Achievement participants. Table 1.1 shows the distribution of model types across the 19 centers that existed any time during the study.
Summer Academy: Teachers deliver curricula (ELA, math, science). Afterschool Academy: Mentors receive training and ongoing support, and deliver new curricula (ELA, math)
PROGRAM COMPONENTS
INPUTSCenter Director, Staff, Students
Summer Academy
Afterschool Academy
Summer Academy
Afterschool Academy
Summer Academy
Afterschool Academy
Summer Academy
Afterschool Academy
GRADE 5 GRADE 6 GRADE 7 GRADE 8
OUTCOMES
Students receive more academic enrichment
Students form relationships with staff and mentors
Improved grades
Improved test scores
RISING 5TH-GRADERS
ENTER PROGRAM
RISING 6TH-GRADERS
ENTER PROGRAM
FIGURE 1.1 Logic Model of the Higher Achievement Program
TABLE 1.1 Distribution of Higher Achievement Centers Across Sites, by Type
CENTER TYPE DC METRO BALTIMORE PITTSBURGH RICHMOND
Magnet 3 2 1 3
Single-School 6 1 2 1
4 | AIMING HIGHER: ASSESSING HIGHER ACHIEVEMENT’S OUT-OF-SCHOOL EXPANSION EFFORTS
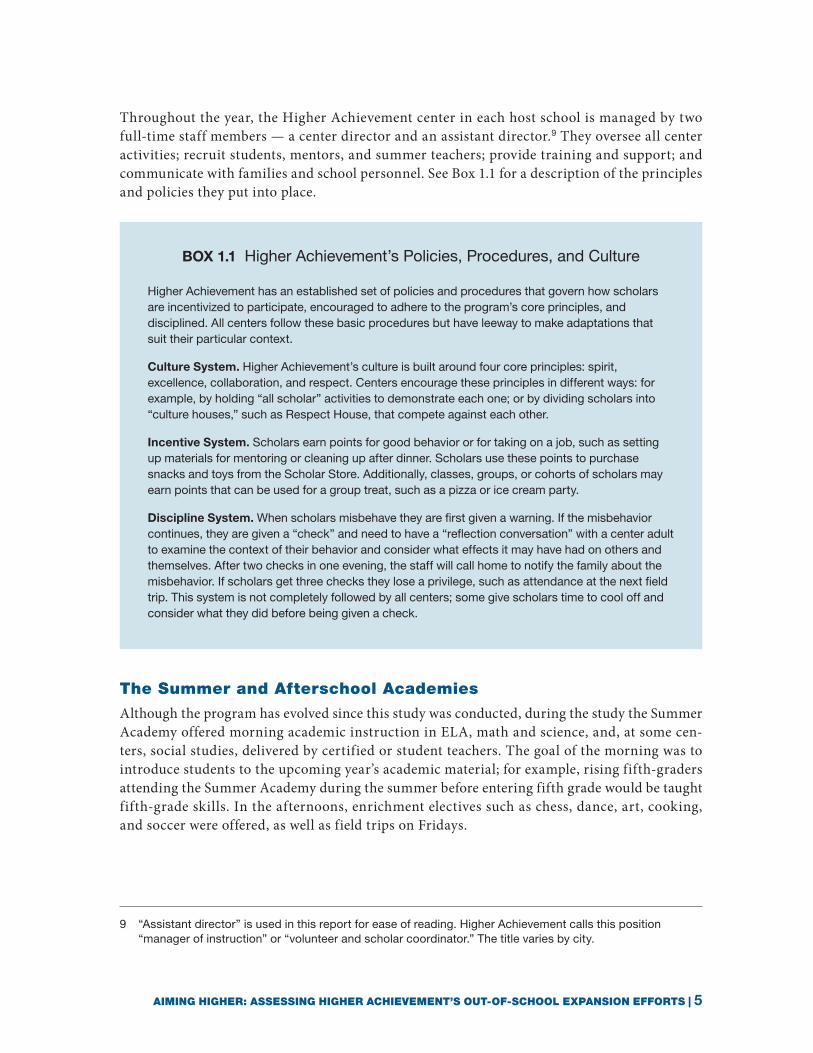
Throughout the year, the Higher Achievement center in each host school is managed by two full-time staff members — a center director and an assistant director.9 They oversee all center activities; recruit students, mentors, and summer teachers; provide training and support; and communicate with families and school personnel. See Box 1.1 for a description of the principles and policies they put into place.
The Summer and Afterschool Academies
Although the program has evolved since this study was conducted, during the study the Summer Academy offered morning academic instruction in ELA, math and science, and, at some cen-ters, social studies, delivered by certified or student teachers. The goal of the morning was to introduce students to the upcoming year’s academic material; for example, rising fifth-graders attending the Summer Academy during the summer before entering fifth grade would be taught fifth-grade skills. In the afternoons, enrichment electives such as chess, dance, art, cooking, and soccer were offered, as well as field trips on Fridays.
9 “Assistant director” is used in this report for ease of reading. Higher Achievement calls this position “manager of instruction” or “volunteer and scholar coordinator.” The title varies by city.
BOX 1.1 Higher Achievement’s Policies, Procedures, and Culture
Higher Achievement has an established set of policies and procedures that govern how scholars are incentivized to participate, encouraged to adhere to the program’s core principles, and disciplined. All centers follow these basic procedures but have leeway to make adaptations that suit their particular context.
Culture System. Higher Achievement’s culture is built around four core principles: spirit, excellence, collaboration, and respect. Centers encourage these principles in different ways: for example, by holding “all scholar” activities to demonstrate each one; or by dividing scholars into “culture houses,” such as Respect House, that compete against each other.
Incentive System. Scholars earn points for good behavior or for taking on a job, such as setting up materials for mentoring or cleaning up after dinner. Scholars use these points to purchase snacks and toys from the Scholar Store. Additionally, classes, groups, or cohorts of scholars may earn points that can be used for a group treat, such as a pizza or ice cream party.
Discipline System. When scholars misbehave they are first given a warning. If the misbehavior continues, they are given a “check” and need to have a “reflection conversation” with a center adult to examine the context of their behavior and consider what effects it may have had on others and themselves. After two checks in one evening, the staff will call home to notify the family about the misbehavior. If scholars get three checks they lose a privilege, such as attendance at the next field trip. This system is not completely followed by all centers; some give scholars time to cool off and consider what they did before being given a check.
AIMING HIGHER: ASSESSING HIGHER ACHIEVEMENT’S OUT-OF-SCHOOL EXPANSION EFFORTS | 5

During the study, the Afterschool Academy operated three days a week from 3:30 p.m. to 7:30 p.m. during the school year (see Box 1.2). It offered informal homework help or “study hall” to large groups of scholars, usually overseen by one or two part-time paid achievement coaches or center
aides or both; dinner followed by enrichment electives; and small-group evening classes led by volunteer mentors who delivered the Higher Achievement curriculum. One evening a week, an ELA mentor delivered a scripted lesson to a small group of scholars; on another evening, a math mentor delivered a scripted lesson to the group; and on the third evening, the day ended after the enrichment activity. Both ELA and math mentors focused some of their sessions on having students write and then provided feedback on their writing. Box 1.3 describes the Afterschool Academy ELA and math curricula in more detail, as used during this study.
OVERVIEW OF THE EVALUATION
To build broader knowledge about the scaling of evidence-based educational interventions, the study examines the following impact questions:
• One year after students applied to participate in Higher Achievement, what was its impact on ELA and math test scores and core course grades (math, reading, science, and social studies) for those assigned to participate in the program compared with those not assigned to participate?
• Two years after students applied, what was the impact of Higher Achievement on ELA and math test scores and core course grades for those assigned to participate in the program compared with those not assigned to participate?
• How did the impact of the single-school model compare with the impact of the original magnet version?
BOX 1.2 A Typical Higher Achievement Weekly Schedule During the School Year
TIME TUESDAY WEDNESDAY THURSDAY
3:00-5:00 p.m. Homework help Homework help Homework help
5:00-5:30 p.m. Dinner Dinner Dinner
5:30-6:15 p.m. Enrichment activity Enrichment activity Enrichment activity
6:15-7:30 p.m. ELA* mentor’s session
Math mentor’s session
NOTE: *English Language Arts.
6 | AIMING HIGHER: ASSESSING HIGHER ACHIEVEMENT’S OUT-OF-SCHOOL EXPANSION EFFORTS

• Was Higher Achievement more effective for particular types of students, such as those enter-ing the program with better academic skills or those entering after fourth grade rather than fifth grade?
Impacts, which are the differences in outcomes between program and control group students, are driven by the extent to which Higher Achievement changed the types of services the two groups of students received. Thus, the study also examines:
• What was the difference in the educational experiences of those assigned to participate in the Higher Achievement program and those not assigned to participate?
An implementation study was also conducted to describe the quantity, quality, and structure of the services delivered by Higher Achievement center staff, summer teachers, and volunteer mentors. The main implementation questions are:
• To what extent were the key Higher Achievement program components (mentor training, small group instruction, the Summer Academy, and so forth) put in place and implemented with the intended frequency, intensity, and duration?
• What are the lessons for the field about how to implement a high-expectation academic pro-gram for middle school students?
BOX 1.3 A Description of Higher Achievement’s New Afterschool Curricula
In 2015, to better align with the new educational standards that most states had adopted based on the Common Core, Higher Achievement hired curricula developers to write new course components for mentors to deliver during the Afterschool Academy. The English Language Arts (ELA) and math curricula were designed to cover a subset of the new standards, with different competencies covered across the two curricula and four grade levels. They included, for example, “Make sense of math problems and persevere in solving them,” “Determine two or more main ideas of a text and explain how they are supported by key details,” and “Write informative/explanatory text to examine a topic and convey ideas, concepts, and information through the selection, organization, and analysis of the relevant content.” The lesson plans were highly scripted, providing mentors with specific instructions for scholars or questions to ask such as, “When reading or listening to me read this passage, circle the words you don’t understand,” or “Use the word ‘shun’ in another context.” In addition to providing content and scripts, the lesson plans asked mentors to use particular instructional practices that were designed to help students learn to analyze or think about issues more deeply, such as encouraging them to “turn and talk” to a neighbor to discuss the answer to a posed question; asking them to “think aloud” when responding to a question; asking them complex “higher-order” questions; and using graphic organizers such as story maps or timelines. Topically, Higher Achievement’s curricula, both math and ELA, covered four social justice themes central to Higher Achievement’s mission: freedom, voice, solidarity, and justice. These themes were in the original curriculum and continued to guide the topics covered in the current one.
AIMING HIGHER: ASSESSING HIGHER ACHIEVEMENT’S OUT-OF-SCHOOL EXPANSION EFFORTS | 7
The Impact Study Design
The study used an experimental design to test the effects of Higher Achievement. Eligible ap-plicants were randomly assigned to one of two research groups: a program group allowed to enroll in the program, or a control group not allowed to enroll. This study design helped ensure that the two groups of students were similar in all characteristics, including hard-to-measure ones such as motivation and ability. The only systematic difference between the program and control groups was their access to Higher Achievement. Thus, any differences that emerged between the outcomes of the two randomly assigned groups can be attributed with confidence to the program, rather than to differences in motivation or ability of the students.
Random AssignmentThe study used a student-level random assignment design. All rising fifth- and sixth-graders who applied to the program in 2015 or 2016 and, along with their families, agreed to participate in the study, were randomly assigned either to the program group and offered a position in Higher Achievement or to the control group that was not allowed to enroll in the program for the dura-tion of the study. (See Appendix A for a description of recruitment and the random assignment process.) Altogether, 1,817 students were randomly assigned across all four sites — 863 at the three expansion sites (Baltimore, Pittsburgh, and Richmond) and 954 at the DC Metro site.
Outcomes and Study SamplesThe data used in the impact study included application data that students and their guardians provided during study enrollment, plus three years of student-level school records: the school year students completed before the first summer of potential participation (Baseline), Year 1, and Year 2. The school records provided data on grades in math, English, science, and social studies, and standardized test performance in math and ELA. There were four impact analysis samples for the study (see Table 1.2 for sample sizes). The Year 1 and Year 2 test score impact analysis samples were based on students who had an ELA and math standardized test score in their first and second years after study enrollment, respectively. The Year 1 and Year 2 course grade impacts were based on students who had both English and math grades in their first and second years, respectively, post-enrollment. These four samples vary in size due to differences in the availability of data across outcomes (state test scores versus course grades) and across years (Year 1 versus Year 2).10 The characteristics of students in these samples are discussed later in this report. Additionally, the research team administered a phone survey to a randomly selected group of program and control group parents, to compare the types of academic supports students received during their out-of-school time in Year 1 and Year 2. Table 1.2 also provides a summary of what data and samples were used to address each research question.
The impact study was originally designed to examine the impacts in the three expansion af-filiates and the mature DC Metro affiliate. However, the study team obtained school records for less than half of the sample in DC Metro — well below the 80 percent range that the federal
10 The four samples — Year 1 test scores, Year 2 test scores, Year 1 course grades, and Year 2 course grades — were very similar in terms of students’ baseline characteristics. The percentage of students for whom the research team had school records did not differ by program status in any of the samples. See Appendix A for more details.
8 | AIMING HIGHER: ASSESSING HIGHER ACHIEVEMENT’S OUT-OF-SCHOOL EXPANSION EFFORTS

TABLE 1.2 Research Questions and the Data Used to Address Them
RESEARCH QUESTION MEASURES AND DATA SOURCE SAMPLE DEFINITION RESULTING SAMPLE
What was the impact of Higher Achievement on test scores a year after applying?a
Treatment and control test scores from the school districts, standardized by the mean and standard deviation of the controls
A student must have Year 1 test scores. Within an affiliate, that sample must constitute at least 65% of the applicants for representativeness.c
Year 1 sample=727 (response rate overall 86%; program group 87%; control group 80%)d
What was the impact of Higher Achievement on course grades a year after applying?b
Course grades from the school districts (1=D or F, 4=A)
A student must have Year 1 math and ELA grades. Within an affiliate, that sample must constitute at least 65% of the applicants for representativeness.c
Year 1 grade sample=753 (response rate overall 86%; program group 90%; control group 83%)d
What was the impact of Higher Achievement on test scores two years after applying?a
TTreatment and control test scores from the school districts standardized by the mean and standard deviation of the controls
A student must have Year 2 test scores. Within an affiliate, that sample must constitute at least 65% of the applicants for representativeness.c
Year 2 sample=753 (response rate overall 75%; program group 75%; control group 74%)d
What was the impact of Higher Achievement on course grades two years after applying?b
Course grades from the school districts (1=D or F, 4=A)
A student must have Year 2 math and ELA grades. Within an affiliate, that sample must constitute at least 65% of the applicants for representativeness.c
Year 2 grade sample=669 (response rate overall 78%; program group 78%; control group 75%)d
What was the contrast between the program and control students' out-of-school-time academic experiences over the two years after they applied to Higher Achievement?
Parent report of out-of-school-time academic experiences during the two years following random assignment.e
Parents in the DC Metro affiliate were not included since DC Metro students are not included in the impact analyses.
Parents=155 (response rate overall 65%)
Did the centers operate Higher Achievement with fidelity?
Center director surveys;f mentor surveys;g adequacy thresholds were set by the National Higher Achievement Office
Within an affiliate, responses were obtained for at least 65% of the targeted respondents for representativeness.
Center director sample=19 (100%); Mentor survey sample=421 (84.4%); all affiliates included
NOTES: aTest scores assessed and included were for math and English Language Arts (ELA) subjects. bCourse grades assessed and included were for math, ELA, science, and social studies subjects. cHigher Achievement serves youth in four affiliate cities: Baltimore, DC Metro, Pittsburgh, and Richmond. dDC Metro sample failed the affiliate requirement and thus was not included. eThe parent survey was fielded to a random sample of 25% of parents whose children applied two years prior; parents were surveyed online or by phone. fThe center director survey was fielded in 2018. gThe mentor survey was fielded to all mentors volunteering in 2018.
AIMING HIGHER: ASSESSING HIGHER ACHIEVEMENT’S OUT-OF-SCHOOL EXPANSION EFFORTS | 9

government recommends for generalizing results to the represented population (namely, Higher Achievement scholars in DC Metro).11 It was also well below the proportion of records obtained for the three expansion affiliates. Even more problematic, these data were not missing randomly. Students living in the District of Columbia made up 80 percent of the DC Metro sample. Half of the District of Columbia’s students attended charter schools to which they had to apply, while the other half attended their neighborhood public schools.12 The research on charter schools is replete with concerns that students who choose to attend one are different from their peers who stay in public schools.13 So by extension, program impacts could be different for the District of Columbia’s charter school students than for its public school students. While District of Columbia Public Schools provided data on all of the students enrolled in public schools, only two small charter schools provided the research team with data (representing only 25 of the 494 records not received from the DC Metro affiliate). In addition, school records from the other expan-sion affiliates did not indicate which sample members were charter students and which were public school students. As a result, it was not possible to parse out charter school students in the expansion affiliates in order to compare them with charter school students in the DC Metro affiliate. Thus, because the data obtained for the DC Metro affiliate was not representative of the scholars the program served, nor could a similar dataset be created for the other affiliates, the impact portion of the report discusses only the impacts at the expansion sites, all of which had school records data available for the majority of students.
The Implementation Study Design
To assess the delivery of the Higher Achievement program, mentors and center directors com-pleted surveys in the spring of each year, 2016 through 2018. The research team also conducted site visits at centers in July 2018 to interview center staff about the Summer Academy, and con-ducted additional site visits from November 2018 to January 2019 to interview center staff and mentors in the Afterschool Academy. National organization staff were interviewed in December 2019. To align the implementation survey information with the interview data, the survey data used to support the interview data in this report come from the 2018 surveys. See Table 1.2 for information about survey response rates.
The implementation study sought to determine the success sites had in implementing the Higher Achievement program model. The study team worked with the national organization staff to specify the core components of the model and determine the minimum thresholds for each of
11 School records were obtained for 48 percent of the DC Metro sample members in Year 1 and 40 percent in Year 2. The target rate of 80 percent comes from the U.S. Office of Management and Budget, which reviews most federal evaluations and research projects and asserts minimum methodology requirements for federally funded projects. It characterizes the response rate as “probably the most widely cited single number associated with the generalizability of a survey’s results.” U.S. Office of Management and Budget (2016).
12 In school year 2017-2018, 47 percent of the 91,000 children in kindergarten through twelfth grade in Washington, DC, enrolled in charter schools. District of Columbia Public Schools (2020).
13 Cohodes (2018).
10 | AIMING HIGHER: ASSESSING HIGHER ACHIEVEMENT’S OUT-OF-SCHOOL EXPANSION EFFORTS

these components necessary to deem the component “adequately delivered.” The survey data were then combined with program records to assess the extent to which the sites adequately implemented each of these core Higher Achievement components across their centers.
AIMING HIGHER: ASSESSING HIGHER ACHIEVEMENT’S OUT-OF-SCHOOL EXPANSION EFFORTS | 11


CHAPTER
2
Implementation Findings
This section discusses the implementation lessons learned from Higher Achievement’s ex-perience that could be useful for a wide range of youth programs. This includes those that
use adult volunteers, programs that hope to use adult volunteers to deliver an academic cur-riculum, and other out-of-school-time programs more generally. The experiences of centers in all four affiliates, including DC Metro, underlie the conclusions in the implementation study. The section starts with a discussion of mentor recruitment, including a description of the types of mentors Higher Achievement recruited during the study period. Next, the discussion turns to a set of findings about what it takes to successfully use volunteers to deliver academic lessons in a curriculum.
MENTOR RECRUITMENT AND RETENTION
• Higher Achievement successfully recruited an educated and professional group of volun-teers to be mentors. However, most center directors and assistant directors felt they could have used more mentors than they had.
One of the goals of having mentors was to expose scholars to college-educated professionals. Table 2.1 shows that Higher Achievement was indeed successful at recruiting many such individuals. Among the mentors who completed the spring 2018 survey, most had a bachelor’s degree or above (75 percent) and were employed (83 percent). The mentors were also fairly young. Thirty-six percent were 25 or younger, and another 38 percent were ages 26 to 35. A little over 60 percent were White, and 21 percent were Black.
Though all centers had volunteers, the expansion sites had fewer than they wanted. Only the DC Metro centers exceeded their targeted number of mentors (by 7 percent).1 Richmond, Pittsburgh, and Baltimore all fell short of their targets (69 percent, 68 percent, and 61 percent of their re-cruitment goal, respectively). Mentor recruitment was challenging for several reasons, includ-ing a center’s location, which might be far from public transportation and the city center, in an
1 The success rate was calculated by dividing the number of mentors that center directors reported hoping to have by the number of mentors they reported actually having on the 2018 Center Director survey.

TABLE 2.1 2018 Mentor Survey: Mentor Characteristics
CHARACTERISTIC MENTORS (%) OBSERVATIONS (N)
Female 62.5 260
Age25 and under 35.8 14926 to 35 38.0 158Over 35 23.3 97
Student 25.5 106
Parent 15.6 65
RaceWhite 60.8 253Black 20.9 87Hispanic/Latino 8.4 35Asian 7.9 33
Highest completed educationBachelor's and above 74.8 311High school diploma/GED, some college, associate's degree 20.0 83Other 4.8 20
Working 82.9 345Youth-related background 16.8 70Working in a helping profession 15.6 65
Number of semesters mentoring1 12.7 532 40.4 1683 7.9 334+ 38.9 162
Mentors planning to returnDefinitely 33.2 138Probably 41.6 173
Sample size 416
SOURCE: MDRC calculations based on surveys distributed and collected in 2018 from mentors in Baltimore, DC Metro, Pittsburgh, and Richmond affiliates.
NOTES: Findings in this table are based on data for 416 volunteer respondents. Sample size for individual items varies due to nonresponse. Percentages may not add up to 100 due to lack of representation of mentor subgroups and rounding.
14 | AIMING HIGHER: ASSESSING HIGHER ACHIEVEMENT’S OUT-OF-SCHOOL EXPANSION EFFORTS

unsafe neighborhood, or both; and competing priorities for potential volunteers. New centers were particularly challenged with recruitment because they were less known in their community and lacked connections with organizations such as local colleges and employers that provide a steady stream of volunteers to more established Higher Achievement centers. As a result, it is not surprising that the longest-operating site, DC Metro (started in 1975), was the most able to recruit adequate numbers, while the expansion sites — Baltimore (2009), Richmond (2011), and Pittsburgh (2012) — had more difficulty.
Centers that struggled to recruit mentors also experienced turnover in center leadership, sug-gesting that having consistent leaders may help with both mentor recruitment and retention. Experienced leaders may be better recruiters, and mentors continue to volunteer year after year, in part because of their relationships with center leaders.
Despite these challenges, a core group of dedicated mentors returned to volunteer year after year at each center. In the spring of 2018, more than a third of the mentors surveyed (39 percent on average across sites) reported having mentored for two years or more.
MENTORS AS CURRICULUM INSTRUCTORS
During the school year, Higher Achievement is able to provide high-standard academic lessons in a small group setting at a reasonable cost only because it uses volunteers to deliver the after-school curricula. These individuals are not teachers, so they need training in how to teach the curriculum and how to run small group lessons. The program also tries to limit the number of scholars in each mentor’s group to no more than four because managing group dynamics and discipline gets more difficult with larger groups. This section examines how well centers did in creating the structures needed for the mentors to be successful curricula instructors. This includes whether mentors were trained and received the suggested amount of ongoing supports, and whether the centers were able to limit the number of scholars in mentors’ groups to four or less as prescribed by the model. Then it discusses how successful mentors were in actually delivering the curriculum as planned. In particular, mentors were supposed to cover most of the lesson plans — adhering to specific academic standards and instructional practices. Only information from centers that actually used their volunteers in this way is included in this sec-tion. As a result, two centers in Baltimore that used mentors to provide homework help only and paid teachers to deliver the curriculum are excluded from these analyses.
Group Size and Mentor Training• All but the Richmond centers had enough mentors to deliver the Higher Achievement
curriculum in small group settings. Even so, staff members at a majority of the centers felt the program would be stronger if the groups were smaller and said they wished they had more mentors.
Higher Achievement’s model stipulates that the role of mentors is to deliver the Afterschool Academy curricula material to small groups of scholars with, at most, a scholar-to-mentor ratio
AIMING HIGHER: ASSESSING HIGHER ACHIEVEMENT’S OUT-OF-SCHOOL EXPANSION EFFORTS | 15

of 4 to 1. Only the centers in Richmond did not have enough mentors to reach “adequacy,” that is, the 4-to-1 ratio for at least 75 percent of their mentoring groups.2 (See Figure 2.1.) Even so, over 60 percent of all center directors using mentors as instructors reported wanting even more mentors.
Additional mentors meant more scholars could be in groups of two or three rather than four, allowing mentors to provide them with individualized help. Having just the 4-to-1 ratio also meant it was more difficult to provide the needed coverage when mentors inevitably missed a day of service. One solution for when a mentor was absent was to combine two smaller groups of scholars into one larger one, but this made it even harder to maintain anything close to the prescribed 4-to-1 ratio, particularly in those centers that already had too few mentors. More mentors and, by extension, smaller mentoring groups, on the other hand, made it less detrimental to combine groups when a mentor was out. When centers did have extra mentors, they could pair up people who may not have been able to attend every week. And with teams of two, groups always had at least one familiar mentor each week. This would have been difficult or impossible in centers that did not have enough mentors to begin with.
• Centers succeeded at ensuring that volunteers attended pre-service training. However, get-ting mentors to attend ongoing training sessions and providing them with individualized feedback throughout the school year was more challenging.
To prepare mentors for their work with scholars, Higher Achievement offers a formal, two-hour orientation session before the start of the Afterschool Academy as well as an additional Welcome Week orientation for new and returning mentors at the beginning of the school year. Mentors who cannot attend the two-hour orientation (for example, because they started later in the school year) can attend an individual phone or on-site orientation with a staff member. A total of 95 percent of 2018 mentors reported attending the formal pre-service orientation, the Welcome Week orientation, or a one-on-one training later in the school year.
Once an Afterschool Academy got started, Higher Achievement encouraged mentors to get more curricula instruction in Mentor Lounges — brief, 20-minute group meetings after the sessions with scholars were over. The curricula developers had hoped that mentors would attend these meetings after most of their sessions. However, while 96 percent of mentors reported attending at least one Mentor Lounge, only 14 percent attended more than 10 — that is, less than half of the meetings offered during the 26-week program. Getting volunteers to stay after 7:30 p.m., especially those who came straight from work, was challenging. To overcome this, some assistant directors emailed mentors the content of the lounges so they could review it at their convenience at home. Many mentors (62 percent) reported that the Mentor Lounges were helpful; they just did not want to stay later in the evening.
2 Two of the three centers in Baltimore had certified teachers deliver the curriculum instead of mentors. They are excluded from this section’s discussion about using mentors as instructors.
16 | AIMING HIGHER: ASSESSING HIGHER ACHIEVEMENT’S OUT-OF-SCHOOL EXPANSION EFFORTS

Center staff also provided ongoing support through observation of the mentoring groups and individualized feedback. However, only two of the four sites passed the threshold of at least 75 percent of their mentors receiving feedback on their teaching once every few months. Mentors generally felt that Higher Achievement staff were supportive, with the vast majority (94 percent) reporting in the research team’s survey that they felt the staff seemed willing to help them.
FIGURE 2.1 Percentage of Mentors with Four Students or Fewer per Small Group in Afterschool Academy, by Site
SOURCE: MDRC calculations based on surveys distributed and collected in 2018 from mentors in Baltimore, DC Metro, Pittsburgh, and Richmond affiliates.
NOTE: The sample includes one center and 13 mentors for Baltimore; eight centers and 240 mentors for DC Metro; three centers and 54 mentors for Pittsburgh; and four centers and 75 mentors for Richmond. At least 75 percent of mentors must have reported an average group size of four or fewer students in order to be deemed as adequately implemented, indicated by the dashed line.
10097
78
71
0
10
20
30
40
50
60
70
80
90
100
Baltimore DC Metro Pittsburgh Richmond
Percentage of Mentors
AIMING HIGHER: ASSESSING HIGHER ACHIEVEMENT’S OUT-OF-SCHOOL EXPANSION EFFORTS | 17

Altogether, close to three-fourths (72 percent) of the mentors reported they had received suf-ficient training from Higher Achievement.
Mentors’ Ability to Deliver the Curricula as Planned• With the level of support and structure that was given, mentors were able to cover most
lesson content as well as have scholars practice various “habits of mind,” such as support-ing an argument with examples. However, mentors used instructional strategies such as “turn and talk,” intended to strengthen how a student thinks, less than was hoped for.
The new Higher Achievement curriculum contains 16 math and 16 English Language Arts (ELA) lessons, with four additional writing lessons for both math and ELA mentors. The curriculum is scripted and fairly structured, with each lesson suggesting certain instructional strategies to help scholars learn to think critically. Lessons also include different standards and practices aimed at having scholars practice various “habits of mind.” (See Box 2.1 for a more detailed description of these curriculum components.)
As shown in Figure 2.2, most mentors started at least 80 percent of their Common Core-aligned lessons in both math and ELA. The mentors in Baltimore struggled a bit more in ELA, with about two-thirds starting at least 80 percent of ELA lessons (compared with over 90 percent at the
BOX 2.1 A Description of Higher Achievement’s New Afterschool Curricula
In 2015, to better align with the new educational standards that most states had adopted based on the Common Core, Higher Achievement hired curricula developers to write new course components for mentors to deliver during the Afterschool Academy. The English Language Arts (ELA) and math curricula were designed to cover a subset of the new standards, with different competencies covered across the two curricula and four grade levels. They included, for example, “Make sense of math problems and persevere in solving them,” “Determine two or more main ideas of a text and explain how they are supported by key details,” and “Write informative/explanatory text to examine a topic and convey ideas, concepts, and information through the selection, organization, and analysis of the relevant content.” The lesson plans were highly scripted, providing mentors with specific instructions for scholars or questions to ask such as, “When reading or listening to me read this passage, circle the words you don’t understand,” or “Use the word ‘shun’ in another context.” In addition to providing content and scripts, the lesson plans asked mentors to use particular instructional practices that were designed to help students learn to analyze or think about issues more deeply, such as encouraging them to “turn and talk” to a neighbor to discuss the answer to a posed question; asking them to “think aloud” when responding to a question; asking them complex “higher-order” questions; and using graphic organizers such as story maps or timelines. Topically, Higher Achievement’s curricula, both math and ELA, covered four social justice themes central to Higher Achievement’s mission: freedom, voice, solidarity, and justice. These themes were in the original curriculum and continued to guide the topics covered in the current one.
18 | AIMING HIGHER: ASSESSING HIGHER ACHIEVEMENT’S OUT-OF-SCHOOL EXPANSION EFFORTS

other sites). Thus, Baltimore was the only site — and only in ELA — not to reach the minimum threshold of at least 75 percent of mentors starting at least 80 percent of lessons in math and ELA.
Most mentors also reported delivering the curriculum using the guidance provided. For example, as shown in Figure 2.3, the vast majority of mentors reported that their scholars used the outlined standards during their lessons, with slightly more variability in writing (which fewer groups
FIGURE 2.2 Percentage of 2018 Mentors with at Least 80 Percent of Common Core-Aligned Lessons Started, by Site and Subject
SOURCE: MDRC calculations based on surveys distributed and collected in 2018 from mentors in Baltimore, DC Metro, Pittsburgh, and Richmond affiliates.
NOTE: The sample includes one center and 13 mentors for Baltimore; eight centers and 218 mentors for DC Metro; three centers and 21 mentors for Pittsburgh; and four centers and 63 mentors for Richmond. Mentors delivered either math or English Language Arts curriculum. The percentages above reflect the number of mentors within that given subject. At least 75 percent of mentors must have delivered 80 percent or more prescribed lessons in order to be deemed as adequately implemented, indicated by the dashed line.
67
95100
9388
93
100
92
0
10
20
30
40
50
60
70
80
90
100
Baltimore DC Metro Pittsburgh Richmond
Percentage of Mentors
ELA Math
AIMING HIGHER: ASSESSING HIGHER ACHIEVEMENT’S OUT-OF-SCHOOL EXPANSION EFFORTS | 19

used) than in ELA and math. All four sites passed the minimum threshold of at least 80 percent of mentors covering these standards in their work. Thus, training volunteers to reinforce these standards seems quite doable.
Yet, as shown in Figure 2.4, fewer than the expected number of mentors reported using the instructional strategies provided to them. Over half of the curricula instructors in all four
FIGURE 2.3 Percentage of 2018 Mentors Who Adequately Covered Common Core-Aligned Standards, by Site and Subject
SOURCE: MDRC calculations based on surveys distributed and collected in 2018 from mentors in Baltimore, DC Metro, Pittsburgh, and Richmond affiliates.
NOTE: The sample includes one center and 13 mentors for Baltimore; eight centers and 218 mentors for DC Metro; three centers and 21 mentors for Pittsburgh; and four centers and 63 mentors for Richmond. Mentors delivered either math or ELA curriculum, while all mentors delivered the writing curriculum. The percentages above reflect the number of mentors within that given subject. Over 80 percent of mentors need to have implemented a minimum of two math or ELA components and one writing component “a few times or more” in order to be deemed as adequately implemented, indicated by the dashed line.
100 100
83
100100
88 87
95100
97100 100
0
10
20
30
40
50
60
70
80
90
100
Baltimore DC Metro Pittsburgh Richmond
Percentage of Mentors
Reading Writing Math
20 | AIMING HIGHER: ASSESSING HIGHER ACHIEVEMENT’S OUT-OF-SCHOOL EXPANSION EFFORTS

sites used the instructional strategies outlined for them at least “a few times” (in 1 percent to 20 percent of their sessions) during the school year. But use of the strategies varied a lot across sites, with 92 percent of Baltimore mentors using all four strategies, compared with 75 percent in DC Metro, 71 percent in Richmond, and 67 percent in Pittsburgh. Only Baltimore passed the minimum threshold of at least 80 percent of mentors using each of the four strategies at least “a few times” during the year.
FIGURE 2.4 Percentage of 2018 Mentors Who Used all Four Learning Strategies During Mentoring Lessons, by Affiliate
SOURCE: MDRC calculations based on surveys distributed and collected in 2018 from mentors in Baltimore, DC Metro, Pittsburgh, and Richmond affiliates.
NOTE: The sample includes one center and 13 mentors for Baltimore; eight centers and 218 mentors for DC Metro; three centers and 21 mentors for Pittsburgh; and four centers and 63 mentors for Richmond. Strategies were defined as (1) using graphic organizers, (2) “think aloud,” (3) “turn and talk,” and (4) asking complex, “higher order” questions. Adequate implementation of a strategy was defined as being used “a few times or more.” Over 80 percent of mentors must have used each of the four strategies at least “a few times” in order to be deemed as adequately implemented, indicated by the dashed line.
92
75
6771
0
10
20
30
40
50
60
70
80
90
100
Baltimore DC Metro Pittsburgh Richmond
Percentage of Mentors
AIMING HIGHER: ASSESSING HIGHER ACHIEVEMENT’S OUT-OF-SCHOOL EXPANSION EFFORTS | 21

CENTER LEADERSHIP
• Having seasoned leaders — ideally both the center director and assistant director — emerged as the crucial element for successful center operations.
Interviews with center staff (directors, assistant directors, and other paid staff) suggest that dedicated and experienced leaders were a major asset to the program. They cared deeply about Higher Achievement’s mission, were committed to helping scholars succeed, and were willing to go above and beyond to make sure the program was running smoothly. Interviewees described their leaders as supportive, calm and clear-headed, open, and organized. Experienced leaders were more knowledgeable about the program and were better equipped to work with the unique characteristics of their center and its host school and community. During their tenure, these Higher Achievement leaders built and maintained important relationships with a wide group of stakeholders: host-school staff, employers and colleges that referred mentors, other volunteers, other center staff, and scholars and their families. Interviewees also valued when the assistant director had teaching experience because they were better able to provide teaching and behavior management support to mentors and summer teachers.
During the summer, teachers were hired at each center to teach ELA, math, science, and, at some centers, social studies; during the school year, part-time achievement coaches and center aides were hired to run study hall and electives.3 At many centers, the leadership and staff members alike noted that their organization operated as a cohesive, close-knit team. Again, this was largely due to the center leaders. They built time into the schedule for staff to collaborate (for example, having daily, all-staff check-ins or scheduling time for teachers to plan lessons together), and led by example by working cohesively as a center director/assistant director team. Staff members who worked in teams also supported each other in various ways. For example, teachers planned lessons together; veteran teachers gave tips to newer ones; and all were f lexible and willing to take on additional responsibilities to help each other.
While interviews suggested that center staffs were considered strong overall and individuals came to the organization with high energy and built close relationships with scholars, this senti-ment was not universal. Occasionally, interviewees mentioned more negative aspects of staffing that challenged program implementation. Criticisms included center leaders who did not have strong relationships with or the respect of the scholars, as well as staff members who had not embraced Higher Achievement’s policies, procedures, and culture. These more negative senti-ments tended to come up at centers with new leadership, reiterating the importance of having seasoned center leaders.
3 Electives offered by centers included gardening, engineering, art, journalism, singing, cooking, step, soccer, volleyball, yoga, acting, sewing, drumming, science, radio, and wrestling.
22 | AIMING HIGHER: ASSESSING HIGHER ACHIEVEMENT’S OUT-OF-SCHOOL EXPANSION EFFORTS

• Like many after-school programs, most centers struggled with leadership turnover, to the detriment of the program.4
Keeping experienced staff in leadership positions proved difficult. Over the three-year study period, more than half of the centers had three or more directors, more than three-fourths had three or more assistant directors, and almost half had both — three or more center directors and three or more assistant directors.5 In other words, most centers had a new staff member in one or both leadership positions three or more times over the three-year study period. While some of the turnover was due to center staff being promoted to other positions within Higher Achievement, which helped create career pipelines and overall strength within the organization, turnover had a negative effect on the centers.
Some of this leadership turnover was likely tied to challenges with Higher Achievement’s staff-ing structure. Interviews with center directors and assistant directors suggest that centers are understaffed and leadership staff are overworked. When teaching and part-time staff positions go unfilled, assistant directors must step in, which in turn takes time away from their other responsibilities and puts a strain on the center director, who must then take on some of the as-sistant director’s duties. These staffing gaps add to what center directors reported is an already overwhelming number of tasks they are responsible for, including running programming (co-ordinating activities, field trips, cross-center events, and all-scholar meetings), managing staff and volunteers, communicating with parents, managing scholar behavior, coordinating with the host school, and completing administrative work.
Many center directors also had to contend with inadequate or inappropriate center space and a lack of resources common to many school-based programs.6 Nearly two-thirds of center direc-tors surveyed (65 percent) reported experiencing at least one major challenge related to resource issues, such as competition for space with other programs in the host school or noise levels. Interviewees also noted other issues. Center activities might be spread across multiple f loors in large buildings, making it difficult to manage activities happening simultaneously and requir-ing long transitions between each one. A lack of adequate cell phone reception meant that a center director sitting in one area in order to be available for parent phone calls couldn’t oversee programming in other areas. Some directors said they had to schedule programming around the school custodian’s arrival, which left little time to prepare on-site for the day’s activities. These difficulties all added to center leadership’s workloads and stress levels, likely contribut-ing to the high rate of turnover. Many interviewees reported the need for a third full-time staff member, in part to take on more administrative duties. For these reasons, several DC Metro centers applied for an AmeriCorps fellow, which would give them a third full-time, year-round staff person. These centers benefited from having an extra staff member to take on tasks such
4 Next Generation Youth Work Coalition (2010).
5 To calculate these totals, the research team did not include instances when an assistant director moved up to the director role at a particular center; this happened at several locations and did not have the same detrimental impact on operations as true turnover.
6 Raley, Grossman, and Walker (2005).
AIMING HIGHER: ASSESSING HIGHER ACHIEVEMENT’S OUT-OF-SCHOOL EXPANSION EFFORTS | 23

as scholar recruitment, supporting high school placement efforts,7 teaching summer classes, and teaching electives.
Interviews suggested that turnover in center leadership substantially affected the quality of pro-gramming, particularly at centers that had lost both key positions at the same time. When center leaders left, established relationships with host-school staff, who had supported the program in a variety of ways, were lost. For example, some school principals provided extra resources such as projectors for all-scholar meetings or access to copiers; custodians provided access to space; and teachers shared information about how scholars were doing during the school day. Of the center directors surveyed, 65 percent reported a major challenge related to working with the host-school. The top two issues included challenges with the host-school teachers (47 percent) — for example, those who lacked knowledge about the Higher Achievement program; and challenges with the host-school administration (29 percent) — for example, a host-school administration’s lack of effort with recruitment. Having strong supportive relationships with the host-school staff may be key to implementing school-based expanded learning programs more broadly. For example, an evaluation of the Reading Partners tutoring program,8 in which adult volunteers deliver a scripted ELA lesson during the school day to first-, second-, and third-graders, found that the program was implemented with high fidelity in large part because the host-school staff supported the program and believed in its value for their students.9
Interviews further suggested that leadership turnover negatively affected Higher Achievement scholars’ engagement and behavior. The feel of the program changed with each new leader, resulting in a lack of consistency for scholars. Consistency was noted as particularly important for scholars because many did not experience consistency in their personal lives. When center leaders left, scholars lost the relationships they had built with them — relationships that were reported by center staff as being key to keeping scholars engaged in the program.
CENTER OPERATIONS AND PROGRAM DELIVERY
• Operating a three-day-a-week program for 25 weeks of the school year proved doable for all the sites. Operating a five-day-a-week summer program was more problematic.
All of the sites surpassed the threshold of offering 75 days of Afterschool Academy — that is, at least three days a week of activities for 25 weeks. Some centers were even open four days a week due to funder requirements. However, not all sites were able to adequately provide the five-day-a-week Summer Academy. While all of the centers in Baltimore and Pittsburgh met the minimum
7 As scholars move into the eighth grade, center staff members increase their focus on high school placement for these youth. Because this study describes scholars’ experiences during their first two years of Higher Achievement, the research team did not collect implementation data on this aspect of the program.
8 Reading Partners is a one-on-one volunteer tutoring program in elementary schools in low-income neighborhoods targeting students’ reading skills. Reading Partners (2020).
9 Jacob, Smith, Willard, and Rifkin (2014).
24 | AIMING HIGHER: ASSESSING HIGHER ACHIEVEMENT’S OUT-OF-SCHOOL EXPANSION EFFORTS
threshold of 24 days, none of the centers in Richmond did, and only half of the DC Metro centers did. Center directors noted that some missed days could be attributed to structural challenges with the host school. For example, Richmond centers offered activities only four days a week due to a stipulation that they could only operate when Richmond Public Schools summer school was operating (that is, Monday through Thursday). In addition, one center in DC Metro had to cancel its Summer Academy for several days due to high temperatures and a lack of air conditioning.
During the Summer Academy, most scholars experienced scholar-to-teacher ratios of 16-to-1 or lower (the Higher Achievement maximum for group size in the summer program), except in Richmond, where this was true for only one-third of classes.10 Although a 16-to-1 ratio is consistent with the Higher Achievement model, summer teachers often noted that varying skill levels of their scholars required teachers to provide more individualized support, which was challenging when working with these larger classroom sizes. All DC Metro centers benefited from a partnership with a teacher training program and were able to assign two teachers to classrooms, allowing them to differentiate instruction according to each scholar’s skill level.
• Two centers in Baltimore used their mentors to provide homework help rather than to deliver the curricula during the Afterschool Academy — an approach that allowed them to offer more individualized, tailored homework help.
As described above, the standard Higher Achievement staffing model involves large groups of scholars working independently to complete their homework, while being monitored and helped as needed by part-time paid staff and volunteer mentors leading small groups through the curriculum. Due to funding requirements, these program components operated differently in two of the three Baltimore centers: Homework help was managed by the volunteer mentors, who worked with small groups of scholars as they completed their homework, while the men-toring curriculum was taught by paid, certified teachers to grade-level classrooms of scholars. Thus, in these centers, the standard Higher Achievement staffing model for homework help and mentoring was reversed.
The traditional study hall style of homework help, in which staff members work with large groups of students, was challenging to manage when some students did not have homework, when homework varied because students attended different schools, or when students finished their work at different times. Students with no homework and those who finished early were more likely to misbehave and distract other students. In the two Baltimore centers with a reversed staffing model, this was less of a problem because mentors could provide more individualized
10 The research team assumed that all summer scholars in a particular grade level received their academic classes together, delivered by a single teacher — a conservative assumption, given that some centers, particularly in DC Metro, had more than one teacher per grade level. A center meets the summer classroom size goal for a given grade level if there are 16 or fewer summer scholars in that grade. A center’s score is the percentage of the three study grade levels that meet the classroom size goal — that is, one of the three (33 percent), two of the three (66 percent), or all three (100 percent). For example, an overall percentage of 33 percent for Richmond for 2018 means that only one of the three grade levels (classes) in Richmond’s centers had a scholar-to-teacher ratio of 16-to-1 or lower.
AIMING HIGHER: ASSESSING HIGHER ACHIEVEMENT’S OUT-OF-SCHOOL EXPANSION EFFORTS | 25

attention to scholars and were able to address these challenges more easily than staff at other centers who worked with much larger groups.
STUDENT ATTENDANCE AND ENGAGEMENT
• Despite offering most of the requisite days, Higher Achievement, like other middle school programs, struggled with student attendance. Even so, program group students still expe-rienced more enrichment activities during the two years of their study involvement than did control group students.
Keeping middle school students in any after-school program three days a week is a difficult task. Interviews with center staff echoed findings from earlier studies identifying the desire of young people to participate in other after-school and summer activities as the primary reason for nonattendance.11 In the summer, family activities also competed with the program. Forty-one percent of center directors reported that scholar attendance was a major challenge for them, and 40 percent of mentors similarly noted that irregular scholar attendance was challenging. Getting middle school students to consistently attend any program more than one or two days a week is a well-documented challenge.12 These young people want to be involved in a wider range of experiences than when they were younger, such as sports teams. To avoid scholars dropping out, Higher Achievement centers allowed some scholars to miss parts of the Afterschool Academy so they could attend other activities — for example, to go to a practice for their sports team — or so they could be picked up early to accommodate their parents’ schedules. Consequently, some scholars missed certain parts of the Afterschool Academy — in most cases, electives or home-work help if they came late or mentoring if they left early.
Similarly, centers allowed scholars with poor overall program attendance to stay on the roster. They did this to maintain a full roster (41 percent of center directors surveyed reported experi-encing major challenges related to scholars dropping out before the end of the school year) and to stay true to Higher Achievement’s top priority, which is to serve students who can benefit from the program. Higher Achievement typically experienced significant dropout rates (about 20 percent) after scholars’ first summer, in large part because many parents only wanted “sum-mer coverage” or because the burden of picking up their children three days a week at 7:30 p.m. proved to be too much. Interviewees also reported a drop in enrollment as scholars made the transition from seventh to eighth grade. This was probably because by seventh grade, scholars had had two or three years of the program and may have wanted to try a new activity. To retain scholars, staff tried a number of ways to foster engagement: providing them with a voice in the center, such as including their perspectives in all-center activities; giving them choices, such as letting them choose what was in the Scholar Store; and offering leadership opportunities, such as leading a session at an all-center event.13
11 Grossman et al. (2002).
12 Dynarski et al. (2003); Grossman et al. (2002).
13 Sites hosted several all-center events during both Summer and Afterschool Academies, when all centers got together to take part in a joint activity such as a poetry competition or a center spirit competition.
26 | AIMING HIGHER: ASSESSING HIGHER ACHIEVEMENT’S OUT-OF-SCHOOL EXPANSION EFFORTS

Despite these challenges, the parent survey (see Table 2.2) shows that most students in the program group received academic enrichment through a formal program (most likely Higher Achievement). Eighty-three percent of the program group participated in an academic activity during some or most of the first school year after enrollment, 76 percent participated during some or most of the next summer, and 83 percent participated during some or most of the fol-lowing school year.14
• The instructional sessions in the Afterschool Academy and Summer Academy were engag-ing when they incorporated fun elements such as games or competitions, the content was relevant to the scholars’ lives, and the material was appropriately challenging. Typically, the new curricula did not incorporate these features.
Interviews revealed that scholar engagement levels (and resulting scholar behavior) varied by activity. Scholars tended to be more engaged and better behaved during field trips, electives, some components of mentoring, and summer classes (that is, math and science). They were less engaged in the new Afterschool Academy curricula sessions and in study hall when they did not have homework. Sixty-nine percent of mentors surveyed noted that maintaining scholars’ interest was one of their greatest challenges. Nearly two-thirds of center directors surveyed (65 percent) reported that a major challenge was that the curriculum was not engaging enough for scholars. In fact, this was among the top challenges reported by center directors. Interviews further sug-gested that the particular social justice issues used to discuss the four themes — freedom, voice, solidarity, and justice — were outdated and not relevant to scholars’ lives, while the scripted and text-heavy nature of the lessons made them seem monotonous and dense.15 In addition, the way the curriculum was formatted — following the same structure and repeating concepts across lessons — made it seem repetitive and uninteresting. This was particularly problematic for older scholars, who seemed to tire of the curriculum after being taught similar lessons year after year.
These challenges led mentors and summer teachers to make changes to their various curricula. Center leadership allowed and often encouraged these changes. In some cases, center leadership worked directly with teachers and mentors to create these adaptations, even though the scripted nature of the curricula suggests that the developers did not intend for individuals to make such adaptations. To make the material more engaging and relatable, mentors and staff added ex-amples from scholars’ lives, structured activities as games, and incorporated more discussions. The interviews suggest that mentors, teachers, and center leaders alike viewed the curriculum as a starting point — meant to be adapted to make it work in their center’s particular context and for their scholars.
An additional challenge to instructors, especially mentors, was how to make the curriculum material appropriate to each scholar, given the diversity of ability levels. Mentors and staff noted
14 In the first randomized controlled trial, 75 percent of the sample completed one year, and 70 percent completed the second.
15 For example, the Black Lives Matter movement started during the study, but because the curricula were developed before it started, it was not discussed despite many students and staff feeling that it was a key social justice issue of the day.
AIMING HIGHER: ASSESSING HIGHER ACHIEVEMENT’S OUT-OF-SCHOOL EXPANSION EFFORTS | 27

that the scholars who were disengaged or tended to act out were often the ones who either couldn’t keep up with their peers or were ahead of them and bored. Most interviewees, especially in the summer, noted that the curriculum was too advanced for many scholars.16 To help them get through lessons that required more background knowledge, teachers and mentors had to teach skills not laid out in the lesson plan. Teachers were at an advantage in overcoming this challenge
16 Teachers may not have known that the summer curricula were intentionally previewing the next year’s material.
TABLE 2.2 Out-of-School-Time Academic Supports and Enrichment Activities, Program and Control Groups
ACADEMIC SUPPORTS AND ENRICHMENT ACTIVITIESPROGRAM
GROUPCONTROL
GROUPESTIMATED
DIFFERENCE P-VALUE
Over the past two years did student…
Receive any kind of academic help or enrichment within a broader program after school? (%) 96.6 62.5 34.1 *** 0.000
ELA 92.1 25.0 67.1 *** 0.000Math 94.4 50.0 44.4 *** 0.000Other subject 41.6 2.8 38.8 *** 0.000
Attend academic program or academic activity as part of a broader program? (%) 97.7 13.3 84.3 *** 0.000
School year, Year 1 82.6 11.1 71.5 *** 0.000Summer, Year 2 75.6 0.0 75.6 *** 0.000School year, Year 2 82.6 13.3 69.2 *** 0.000
Receive individual tutoring or homework help that was not part of a broader after-school program? (%) 10.5 82.2 -71.8 *** 0.000
School year, Year 1 7.0 77.8 -70.8 *** 0.000Summer, Year 2 1.2 4.4 -3.3 0.327School year, Year 2 7.0 68.9 -61.9 *** 0.000
Average number of hours per week
Student reads for fun 0.7 0.3 0.4 *** 0.000
Parent spends time helping student with homework and school projects 1.9 2.5 -0.7 *** 0.000
Sample size 89 74
SOURCE: MDRC calculations based on surveys distributed and collected in 2017 and 2018 from parents in Baltimore, Pittsburgh, and Richmond affiliates.
NOTES: A two-tailed t-test was applied to each estimated impact. Sample size for individual items varies due to nonresponse or skipped questions. Statistical significance levels are indicated as follows: *** = 1 percent; ** = 5 percent; * = 10 percent.
28 | AIMING HIGHER: ASSESSING HIGHER ACHIEVEMENT’S OUT-OF-SCHOOL EXPANSION EFFORTS

because they could draw from activities they had implemented during the school year that they knew worked well. Most mentors did not have such a background to draw on. Interviewed mentors noted that the curriculum should have specified how to differentiate instruction for scholars at different skill levels. Indeed, 38 percent of mentors reported struggling with the different skill levels in their groups. At one center, the assistant director completely changed the curricula to make it more engaging for scholars and more adaptable, allowing mentors to choose what to teach based on their individual scholars’ needs.
• Relationships with Higher Achievement adults were important in fostering engagement and retention.
Scholars develop relationships with the various Higher Achievement adults they engage with, from the leadership staff they interact with year-round (during both Afterschool and Summer Academies), to the part-time staff and mentors they interact with during the school year, and the teachers they meet with during the summer. Mentors reported developing close relation-ships with their scholars. More than three-fourths (77 percent) reported feeling close to their scholars. The research team did not collect comparable information from scholars, so it cannot directly report on how the youth felt about these relationships. However, research shows that while not identical, closeness ratings of adult-youth relationships as reported by the adults are highly correlated with those reported by the youth.17
Interviews with staff suggested that adult-scholar relationships were key to fostering scholar en-gagement in the program. Scholars came back year after year in large part because they had built close relationships with the staff and mentors they saw at the program. In fact, some interviewees noted that the primary way staff members engaged scholars was by building a relationship with them. Over the years, Higher Achievement has allotted more time in the program to fostering relationships — for example, by waiting to start curriculum instruction until the second week of the Afterschool Academy, so the first week can be dedicated to relationship-building activities.
SUMMARY OF IMPLEMENTATION FINDINGS
Higher Achievement centers faced many operational barriers that made implementation chal-lenging: barriers that are common in school-based out-of-school-time programs such as staff turnover, coordination with the host school, and lower-than-hoped-for attendance by middle school students; and in new programs, such as the lack of strong relationships with key part-ners, and difficulty recruiting volunteers. Despite these challenges, the Higher Achievement expansion centers were able to put the key features of the program into place at least adequately. (See Figure 2.5.)
17 Parra et al. (2002).
AIMING HIGHER: ASSESSING HIGHER ACHIEVEMENT’S OUT-OF-SCHOOL EXPANSION EFFORTS | 29

FIGURE 2.5 Frequency of Sites That Met Fidelity, by Indicator
SOURCE: MDRC calculations based on Higher Achievement attendance data, and surveys distributed and collected in 2018 from mentors and center directors in Baltimore, DC Metro, Pittsburgh, and Richmond affiliates.
NOTES: Fidelity was assessed through a list of 10 indicators that fall into one of the key components of the Higher Achievement model. In the order above, the following are the definitions of each indicator: ASA Days, the number of days Afterschool Academy operated; Group Size, provided small group learning sessions with a 4:1 student-to-mentor ratio or smaller; Lessons Delivered, percentage of structured ELA or math lessons delivered; Common Core Standards, implemented at least three Common Core curriculum components “a few times” or more during the year, including two ELA or math components plus one writing component; Learning Strategies, mentors implemented each of the four learning strategies at least “a few times” or more during the year, including use of graphic organizers, “think aloud,” “turn and talk,” and asking “higher order” questions; SA Days, the number of days Summer Academy operated; SA Class Size, held small summer class sizes with a 16:1 student-to-teacher ratio or smaller; Mentor Training, the number of hours training was offered to mentors; Mentor Feedback, main staff provided instruction feedback to mentors at least once every few months; Homework Help, percentage of homework-help sessions offered in single-school models.
0
1
2
3
4
Number of Sites That Met Fidelity
Fidelity Measure, by Indicator
ASA Days Group Size Lessons Delivered
Common Core
Standards
Learning Strategies
SA Days SA Class Size
Mentor Training
Mentor Feedback
Homework Help
30 | AIMING HIGHER: ASSESSING HIGHER ACHIEVEMENT’S OUT-OF-SCHOOL EXPANSION EFFORTS

CHAPTER
3
Impacts on Students at Higher Achievement’s Three Expansion Sites
The previous chapter discussed the implementation lessons learned from Higher Achievement’s experience that could be useful for other youth programs. This chapter looks at whether the
Higher Achievement model shows promise for successfully expanding into new locations and replicating some of the results it had with students at its f lagship location. The analysis is based on the impacts Higher Achievement had on students at the program’s three expansion sites. First, to understand who these young people were, the characteristics of the program and con-trol group students are presented. Then, the impacts on student outcomes are provided. Unlike the earlier study of Higher Achievement, which only examined test score impacts, this report examines impacts on both test scores and grades. The final discussion examines whether the program is more or less effective for particular types of students. These findings are potentially useful for improving how the program identifies students for enrollment.
• In the expansion sites, Higher Achievement centers enrolled low-income students who maintained an average of B-minus. Scholars were mostly Black (roughly 80 percent), and about 15 percent were Hispanic, representative of their communities.
Table 3.1 shows the baseline characteristics of the program and control groups in the expansion sites.1 Over 60 percent of students enrolling in the program were rising fifth-graders, with about 37 percent enrolling as rising sixth-graders. A little over half were girls, and the vast majority were eligible for free or reduced-price lunch, having an average annual family income of a little over $26,000. About 40 percent of parents had a high school degree or less, and about 40 percent had some postsecondary education, with an additional 15 percent having a postsecondary degree. The table also shows that scholars had experienced many life stressors in the year before they applied to the program, including bullying (24 percent), someone moving into or out of their
1 Table 3.1 presents characteristics of the program and control groups from the Year 1 test-score sample, that is, the sample that was included in test-score impact analyses for Year 1. Percentages for each group were very similar in all the other samples, that is, Year 2 test scores, Year 1 grades, and Year 2 grades. All noted differences are statistically controlled in the impact analyses. See Appendix B for baseline characteristics of these samples. Due to incomplete application data, the report team had baseline descriptive characteristics for 1,446 (80 percent) of the 1,817 students who were randomized.

CHARACTERISTICPROGRAM
GROUPCONTROL
GROUPESTIMATED
DIFFERENCEEFFECT
SIZE P-VALUE
Over-age for grade (%)a 11.7 11.5 0.3 0.01 0.920
Grade at baseline (%)4th grade 62.3 61.7 0.6 0.01 0.752
5th grade 36.6 37.2 -0.5 -0.01 0.806
Race/Ethnicity (%)White non-Hispanic 3.3 2.7 0.6 0.04 0.603
Black non-Hispanic 79.9 85.0 -5.1 -0.13 ** 0.047
Hispanic 15.0 12.3 2.7 0.08 0.251
Male (%) 45.7 42.5 3.2 0.06 0.291
Annual household income ($) 26,827 26,652 175 0.01 0.921
Qualifies for free/reduced-price lunch (%) 87.4 91.5 -4.1 -0.13 0.154
Standardized test score, baseline test scoresELA -0.02 -0.02 0.00 0.00 0.994
Math -0.05 0.04 -0.09 -0.10 0.212
Baseline course gradesGPA 2.74 2.81 -0.07 -0.09 0.223
English 2.59 2.70 -0.11 -0.12 0.123
Math 2.55 2.60 -0.06 -0.06 0.404
Science 2.93 2.96 -0.03 -0.03 0.654
Social Studies 2.92 2.98 -0.06 -0.07 0.375
Parent education (%)Less than high school diploma 7.2 4.8 2.4 0.10 0.186
GED or high school diploma 37.2 33.3 3.9 0.08 0.326
Some college, associate's degree, orprofessional/vocational certificate 40.2 46.5 -6.3 -0.13 0.128
Bachelor's, master's, or doctorate degree 15.3 15.4 0.0 0.00 0.995
(continued)
TABLE 3.1 Background Characteristics of Students in Expansion Sites, Standardized Test-Score Sample, Year 1
32 | AIMING HIGHER: ASSESSING HIGHER ACHIEVEMENT’S OUT-OF-SCHOOL EXPANSION EFFORTS
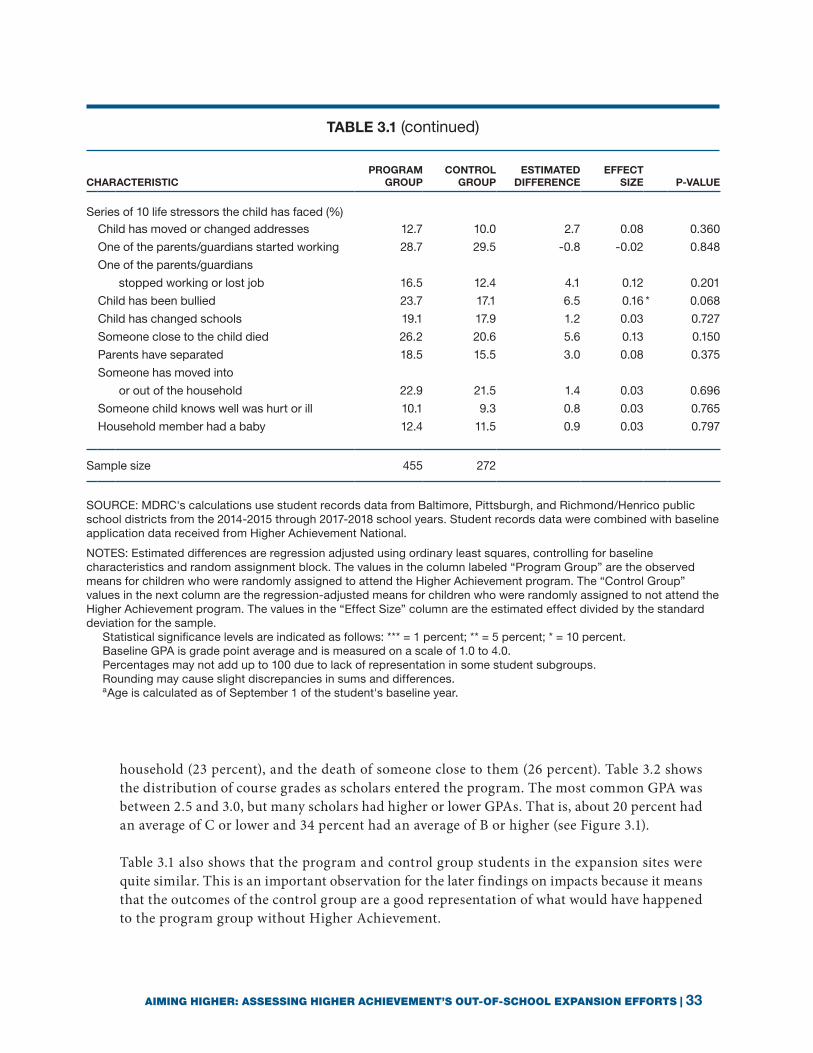
household (23 percent), and the death of someone close to them (26 percent). Table 3.2 shows the distribution of course grades as scholars entered the program. The most common GPA was between 2.5 and 3.0, but many scholars had higher or lower GPAs. That is, about 20 percent had an average of C or lower and 34 percent had an average of B or higher (see Figure 3.1).
Table 3.1 also shows that the program and control group students in the expansion sites were quite similar. This is an important observation for the later findings on impacts because it means that the outcomes of the control group are a good representation of what would have happened to the program group without Higher Achievement.
CHARACTERISTICPROGRAM
GROUPCONTROL
GROUPESTIMATED
DIFFERENCEEFFECT
SIZE P-VALUE
Series of 10 life stressors the child has faced (%)Child has moved or changed addresses 12.7 10.0 2.7 0.08 0.360
One of the parents/guardians started working 28.7 29.5 -0.8 -0.02 0.848
One of the parents/guardians
stopped working or lost job 16.5 12.4 4.1 0.12 0.201
Child has been bullied 23.7 17.1 6.5 0.16 * 0.068
Child has changed schools 19.1 17.9 1.2 0.03 0.727
Someone close to the child died 26.2 20.6 5.6 0.13 0.150
Parents have separated 18.5 15.5 3.0 0.08 0.375
Someone has moved into
or out of the household 22.9 21.5 1.4 0.03 0.696
Someone child knows well was hurt or ill 10.1 9.3 0.8 0.03 0.765
Household member had a baby 12.4 11.5 0.9 0.03 0.797
Sample size 455 272
SOURCE: MDRC's calculations use student records data from Baltimore, Pittsburgh, and Richmond/Henrico public school districts from the 2014-2015 through 2017-2018 school years. Student records data were combined with baseline application data received from Higher Achievement National.
NOTES: Estimated differences are regression adjusted using ordinary least squares, controlling for baseline characteristics and random assignment block. The values in the column labeled “Program Group” are the observed means for children who were randomly assigned to attend the Higher Achievement program. The “Control Group” values in the next column are the regression-adjusted means for children who were randomly assigned to not attend the Higher Achievement program. The values in the “Effect Size” column are the estimated effect divided by the standard deviation for the sample. Statistical significance levels are indicated as follows: *** = 1 percent; ** = 5 percent; * = 10 percent. Baseline GPA is grade point average and is measured on a scale of 1.0 to 4.0. Percentages may not add up to 100 due to lack of representation in some student subgroups. Rounding may cause slight discrepancies in sums and differences. aAge is calculated as of September 1 of the student's baseline year.
TABLE 3.1 (continued)
AIMING HIGHER: ASSESSING HIGHER ACHIEVEMENT’S OUT-OF-SCHOOL EXPANSION EFFORTS | 33

TABLE 3.2 Higher Achievement Study Impacts: Test Scores and Course Grades, Expansion Sites Sample
OUTCOMEPROGRAM
GROUPCONTROL
GROUPESTIMATED
DIFFERENCEEFFECT
SIZE P-VALUE
Year 1
Test-score outcomesMath -0.06 -0.05 -0.01 -0.01 0.887
ELA -0.02 -0.02 0.00 0.00 0.986
Number of students 455 272
Course-grade outcomesGPA 2.74 2.68 0.05 0.07 0.217
Math 2.54 2.45 0.09 0.09 0.138
English 2.67 2.62 0.05 0.06 0.387
Science 2.81 2.81 0.00 0.00 0.951
Social Studies 2.92 2.86 0.06 0.06 0.297
Number of students 470 283
Year 2
Test-score outcomesMath -0.05 -0.11 0.06 0.06 0.414
ELA 0.00 -0.05 0.05 0.05 0.528
Number of students 394 251
Course-grade outcomesGPA 2.58 2.43 0.15 0.20 *** 0.006
Math 2.49 2.31 0.18 0.19 ** 0.014
English 2.55 2.39 0.17 0.18 ** 0.017
Science 2.63 2.48 0.15 0.17 ** 0.033
Social Studies 2.65 2.55 0.11 0.12 0.134
Number of students 414 255
SOURCE: MDRC's calculations use student records data from Baltimore, Pittsburgh, and Richmond/Henrico public school districts from the 2014-2015 through 2017-2018 school years. Student records data were combined with baseline application data received from Higher Achievement National.
NOTES: Estimated differences are regression adjusted using ordinary least squares, controlling for baseline characteristics and random assignment block. The values in the column labeled “Program Group” are the observed means for children who were randomly assigned to attend the Higher Achievement program. The “Control Group” values in the next column are the regression-adjusted means for children who were randomly assigned to not attend the Higher Achievement program. The values in the “Effect Size” column are the estimated effect divided by the standard deviation for the sample. Statistical significance levels are indicated as follows: *** = 1 percent; ** = 5 percent; * = 10 percent. GPA is grade point average and is measured on a scale of 1.0 to 4.3. Rounding may cause slight discrepancies in sums and differences.
34 | AIMING HIGHER: ASSESSING HIGHER ACHIEVEMENT’S OUT-OF-SCHOOL EXPANSION EFFORTS

• The expansion-site program group students participated in more academic enrichment programs outside of school than the control group students.
As mentioned previously, a survey was administered to a randomly selected sample of about 25 percent of program and control parents to learn about the types of academic supports students received during their out-of-school time over the two-year study period. The bigger the difference in supports received by the two groups of students (the service contrast), the bigger the effect one might expect the Higher Achievement program to have had on program group’s outcomes.
FIGURE 3.1 Average GPA of Entire Student Sample at Baseline
SOURCE: MDRC’s calculations use student records data from Baltimore, Pittsburgh, and Richmond/Henrico public school districts from the 2014-2015 through 2017-2018 school years. Analyses combined student records data with baseline application data received from Higher Achievement National.
NOTES: Baseline GPA is grade point average and is measured on a scale of 1.0 to 4.0.
8.5
12.1
20.3
25.0
16.717.4
0
5
10
15
20
25
1.5 2 2.5 3 3.5 4
Percentage of Students
Average GPA (math, ELA, science, social studies) at baseline
1
Median GPA = 2.75
Mean GPA = 2.77
AIMING HIGHER: ASSESSING HIGHER ACHIEVEMENT’S OUT-OF-SCHOOL EXPANSION EFFORTS | 35
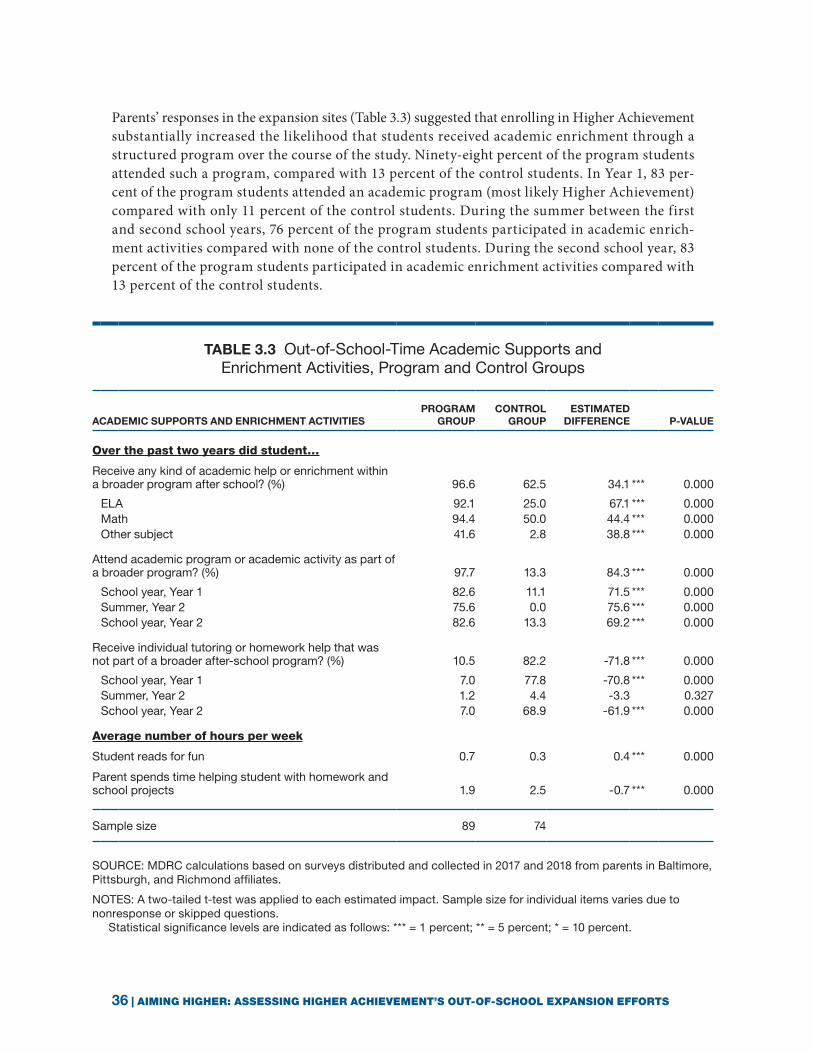
Parents’ responses in the expansion sites (Table 3.3) suggested that enrolling in Higher Achievement substantially increased the likelihood that students received academic enrichment through a structured program over the course of the study. Ninety-eight percent of the program students attended such a program, compared with 13 percent of the control students. In Year 1, 83 per-cent of the program students attended an academic program (most likely Higher Achievement) compared with only 11 percent of the control students. During the summer between the first and second school years, 76 percent of the program students participated in academic enrich-ment activities compared with none of the control students. During the second school year, 83 percent of the program students participated in academic enrichment activities compared with 13 percent of the control students.
TABLE 3.3 Out-of-School-Time Academic Supports and Enrichment Activities, Program and Control Groups
ACADEMIC SUPPORTS AND ENRICHMENT ACTIVITIESPROGRAM
GROUPCONTROL
GROUPESTIMATED
DIFFERENCE P-VALUE
Over the past two years did student…
Receive any kind of academic help or enrichment within a broader program after school? (%) 96.6 62.5 34.1 *** 0.000
ELA 92.1 25.0 67.1 *** 0.000Math 94.4 50.0 44.4 *** 0.000Other subject 41.6 2.8 38.8 *** 0.000
Attend academic program or academic activity as part of a broader program? (%) 97.7 13.3 84.3 *** 0.000
School year, Year 1 82.6 11.1 71.5 *** 0.000Summer, Year 2 75.6 0.0 75.6 *** 0.000School year, Year 2 82.6 13.3 69.2 *** 0.000
Receive individual tutoring or homework help that was not part of a broader after-school program? (%) 10.5 82.2 -71.8 *** 0.000
School year, Year 1 7.0 77.8 -70.8 *** 0.000Summer, Year 2 1.2 4.4 -3.3 0.327School year, Year 2 7.0 68.9 -61.9 *** 0.000
Average number of hours per week
Student reads for fun 0.7 0.3 0.4 *** 0.000
Parent spends time helping student with homework and school projects 1.9 2.5 -0.7 *** 0.000
Sample size 89 74
SOURCE: MDRC calculations based on surveys distributed and collected in 2017 and 2018 from parents in Baltimore, Pittsburgh, and Richmond affiliates.
NOTES: A two-tailed t-test was applied to each estimated impact. Sample size for individual items varies due to nonresponse or skipped questions. Statistical significance levels are indicated as follows: *** = 1 percent; ** = 5 percent; * = 10 percent.
36 | AIMING HIGHER: ASSESSING HIGHER ACHIEVEMENT’S OUT-OF-SCHOOL EXPANSION EFFORTS
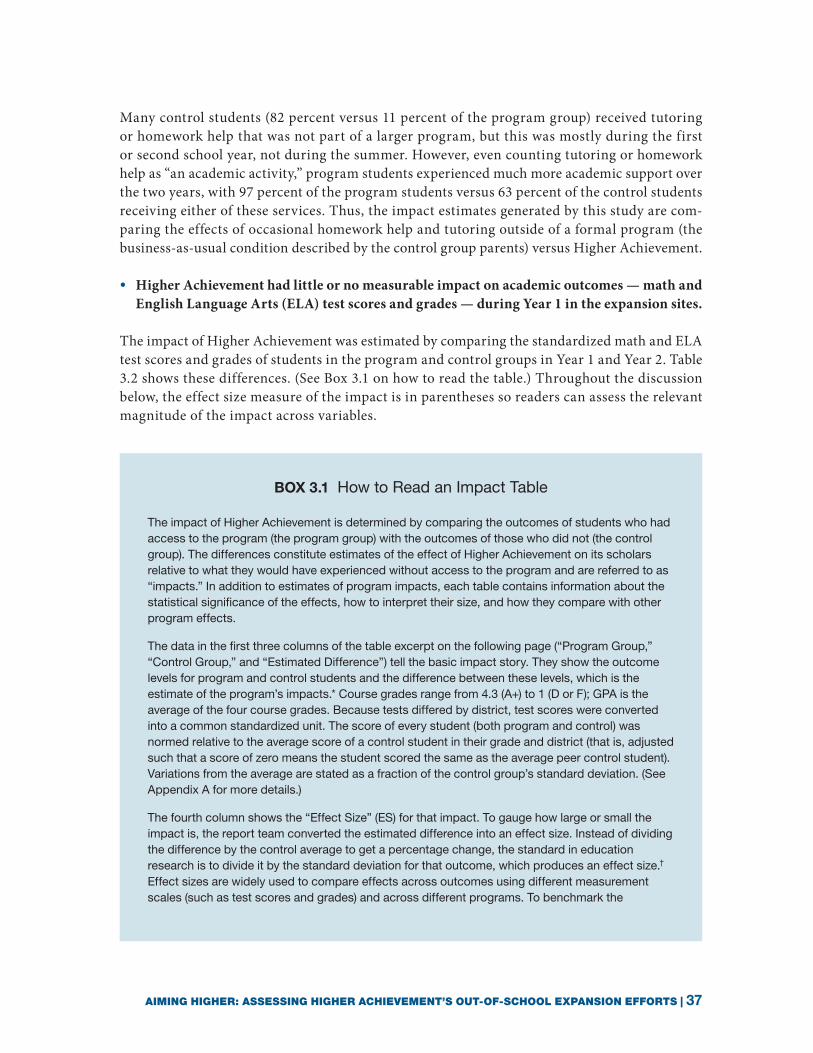
Many control students (82 percent versus 11 percent of the program group) received tutoring or homework help that was not part of a larger program, but this was mostly during the first or second school year, not during the summer. However, even counting tutoring or homework help as “an academic activity,” program students experienced much more academic support over the two years, with 97 percent of the program students versus 63 percent of the control students receiving either of these services. Thus, the impact estimates generated by this study are com-paring the effects of occasional homework help and tutoring outside of a formal program (the business-as-usual condition described by the control group parents) versus Higher Achievement.
• Higher Achievement had little or no measurable impact on academic outcomes — math and English Language Arts (ELA) test scores and grades — during Year 1 in the expansion sites.
The impact of Higher Achievement was estimated by comparing the standardized math and ELA test scores and grades of students in the program and control groups in Year 1 and Year 2. Table 3.2 shows these differences. (See Box 3.1 on how to read the table.) Throughout the discussion below, the effect size measure of the impact is in parentheses so readers can assess the relevant magnitude of the impact across variables.
BOX 3.1 How to Read an Impact Table
The impact of Higher Achievement is determined by comparing the outcomes of students who had access to the program (the program group) with the outcomes of those who did not (the control group). The differences constitute estimates of the effect of Higher Achievement on its scholars relative to what they would have experienced without access to the program and are referred to as “impacts.” In addition to estimates of program impacts, each table contains information about the statistical significance of the effects, how to interpret their size, and how they compare with other program effects.
The data in the first three columns of the table excerpt on the following page (“Program Group,” “Control Group,” and “Estimated Difference”) tell the basic impact story. They show the outcome levels for program and control students and the difference between these levels, which is the estimate of the program’s impacts.* Course grades range from 4.3 (A+) to 1 (D or F); GPA is the average of the four course grades. Because tests differed by district, test scores were converted into a common standardized unit. The score of every student (both program and control) was normed relative to the average score of a control student in their grade and district (that is, adjusted such that a score of zero means the student scored the same as the average peer control student). Variations from the average are stated as a fraction of the control group’s standard deviation. (See Appendix A for more details.)
The fourth column shows the “Effect Size” (ES) for that impact. To gauge how large or small the impact is, the report team converted the estimated difference into an effect size. Instead of dividing the difference by the control average to get a percentage change, the standard in education research is to divide it by the standard deviation for that outcome, which produces an effect size.† Effect sizes are widely used to compare effects across outcomes using different measurement scales (such as test scores and grades) and across different programs. To benchmark the
AIMING HIGHER: ASSESSING HIGHER ACHIEVEMENT’S OUT-OF-SCHOOL EXPANSION EFFORTS | 37

effect sizes presented here, the effect size of the impacts on math problem solving and reading comprehension in Higher Achievement’s earlier impact study were 0.03 and 0.02, respectively, in the first year, and 0.10 and 0.08, respectively, in the second year. For additional context, the effect of peer tutoring, measured in effect size, is approximately 0.4, and the effect of Reading Recovery, a highly effective out-of-school-time, teacher-led, one-on-one reading intervention, is 0.8.‡
The fifth column shows the statistical p-value for the impact. This is the probability that the impact is really the result of random chance, rather than a true difference between the program and control groups, and thus a result of the program being evaluated; the lower the value, the more one can be sure that there is a true difference between the program and control group outcomes. Conventionally, differences are deemed statistically significant when the p-value for a difference is 0.10 or less (that is, the difference reflects random chance error 10 percent of the time or less). Tables indicate the level of statistical significance with asterisks. In particular, one asterisk indicates that the p-value was 0.10 or less. Two asterisks signify a p-value of 0.05 or less, while three asterisks signify a p-value of 0.01 or less. It is also useful to consider potential impacts when impacts have p-values that are only slightly larger than the 0.10 threshold (for example, 0.15).
Study Impacts: Course Grade Outcomes of Year 2
OUTCOMEPROGRAM
GROUPCONTROL
GROUPESTIMATED
DIFFERENCEEFFECT
SIZE P-VALUE
GPA 2.58 2.43 0.15 0.20 *** 0.006
Math 2.49 2.31 0.18 0.19 ** 0.014
In Tables 3.4 and 3.5, there is one additional column labeled “Differential Significance.” The number of “daggers” in this column indicate how likely it is that the observed difference between the impacts for the two subgroups (for example, the impact for boys versus the impact for girls, or for Black versus non-Black students) is not due to random chance. Just as the asterisks indicate how likely an impact is real, the daggers in these tables indicate how likely the difference between impacts is real. With a base premise that impacts are the same across groups, one dagger indicates that a difference of the size observed would occur, by chance alone, only 10 percent or less of the times it was tested; two daggers indicate a difference of the size observed would occur by chance only 5 percent or less of the times it was tested; and three daggers indicate a difference of the size observed would occur by chance only 1 percent or less of the times it was tested.
NOTES: *The estimated difference controls for student characteristics and the specific lottery in which a student participated. See Appendix A for more details. †The standard deviation is the average distance each sample member’s outcome is from the average of that outcome. Outcomes that are more spread out have larger standard deviations. If most of the students score from 400 to 600 and the average is 500, the standard deviation will be smaller than if most students score between 200 and 800 with an average of 500. An impact of 10 points on test scores is more impressive when the distribution of scores is tighter. Effect sizes reflect this; percentage change does not. ‡Greenwood et al. (1993); What Works Clearinghouse (2013).
BOX 3.1 (continued)
38 | AIMING HIGHER: ASSESSING HIGHER ACHIEVEMENT’S OUT-OF-SCHOOL EXPANSION EFFORTS

As shown in Table 3.2, Higher Achievement had no effect on students’ math and ELA test scores in the first year (-0.01 and 0.00, respectively). The difference between the program group’s and the control group’s GPA in the first year was 0.05 (on a 1-4.3 scale), thus the impact was positive (0.07), but not statistically significant. Therefore, in the first year, Higher Achievement had little or no measurable impact on academic outcomes in the expansion sites.
• The impact on academic outcomes grew in the second year, becoming statistically signifi-cant for grades but not test scores.
By Year 2, Higher Achievement’s impact on grades grew and became statistically significant. The impact Higher Achievement had on students’ average GPA was a statistically significant effect of 0.15 (or effect size of 0.20). Examining the impacts in specific subjects, the study found that Higher Achievement had positive and statistically significant second-year impacts on math (0.19), English (0.18), and science (0.17) grades. Although the estimated impact of Higher Achievement on social studies course grades was positive (0.12), it was not large enough to be statistically significant. The impacts on students’ test scores in the second year were positive but also not large enough to be statistically significant. The math test-score impact (0.06) and the ELA test score (0.05) were less than half the size of the course-grade impacts.
• In the expansion sites, Higher Achievement appeared to be more effective for academically stronger scholars who joined the program.
In Higher Achievement’s earlier impact study, there was no strong evidence to suggest that Higher Achievement was more or less effective for different types of scholars — boys versus girls, those who came to the program with higher versus lower test scores, students who entered before fifth rather than sixth grade, or those from different geographic areas.2 This study also investigated whether there were different impacts for different subgroups of students, as well as whether the impact in single-school centers was the same as that in the magnet centers. Additionally, to generate evidence that could be useful for addressing diversity and equity concerns, the report team examined whether impacts for Black students were similar to those of other scholars. While, of course, the “estimated difference” will be numerically different for various groups, it is highlighted only if the difference between the size of the impacts for the two subgroups (for example, the size of the impact for boys versus the size of the impact for girls) was big enough to be statistically significant.
Table 3.4 shows strong evidence that by Year 2, Higher Achievement had larger impacts on course grades and test scores for students who came to the program earning either As or Bs in math compared with students who came to the program with lower math grades.3 Across the expansion sites, 72 percent of applicants with baseline math grades had earned As or Bs in math the year they were applying. For these students, Higher Achievement produced positive and sta-
2 Herrera, Linden, Arbreton, and Grossman (2011).
3 The median baseline math grade was a B. The findings also hold when one defines the two groups by the median baseline math test score.
AIMING HIGHER: ASSESSING HIGHER ACHIEVEMENT’S OUT-OF-SCHOOL EXPANSION EFFORTS | 39

UPPER LOWER
OUTCOMEPROGRAM
GROUPCONTROL
GROUPEFFECT
SIZE P-VALUEPROGRAM
GROUPCONTROL
GROUPEFFECT
SIZE P-VALUEDIFFERENTIALSIGNIFICANCE
Year 1
Test-score outcomes
Math standardized test score 0.22 0.20 0.02 0.843 -0.77 -0.65 -0.12 0.683
ELA standardized test score 0.21 0.25 -0.04 0.665 -0.61 -0.71 0.10 0.753
Number of students 285 176 118 69
Course-grade outcomes
GPA 2.89 2.86 0.04 0.636 2.29 2.16 0.20 0.335
Math course grade 2.72 2.67 0.05 0.544 2.04 1.67 0.48 * 0.076
English course grade 2.88 2.80 0.08 0.378 2.10 2.20 -0.12 0.514
Science course grade 2.94 2.96 -0.02 0.775 2.33 2.35 -0.03 0.912
Social Studies course grade 3.02 3.03 -0.01 0.872 2.72 2.45 0.28 0.204
Number of students 327 198 130 74
Year 2
Test-score outcomes
Math standardized test score 0.22 0.09 0.13 0.162 -0.85 -0.61 -0.32 0.288 †
ELA standardized test score 0.29 0.19 0.09 0.317 -0.92 -0.32 -0.66 0.162 ††
Number of students 285 176 118 69
Course-grade outcomes
GPA 2.78 2.55 0.31 *** 0.001 1.99 2.12 -0.22 0.406 †††
Math course grade 2.69 2.40 0.31 *** 0.003 1.98 2.19 -0.27 0.317 ††
English course grade 2.75 2.56 0.21 ** 0.043 1.95 2.02 -0.10 0.757
Science course grade 2.88 2.60 0.33 *** 0.002 1.88 2.14 -0.32 0.231 †††
Social Studies course grade 2.85 2.67 0.20 ** 0.040 2.13 2.11 0.02 0.903 †
Number of students 285 176 118 69
(continued)
TABLE 3.4 Higher Achievement Study Impacts on Test Scores and Course Grades, Upper and Lower Math Grade Subgroups
40 | AIMING HIGHER: ASSESSING HIGHER ACHIEVEMENT’S OUT-OF-SCHOOL EXPANSION EFFORTS

SOURCE: MDRC’s calculations use student records data from Baltimore, Pittsburgh, and Richmond/Henrico public school districts from the 2014-2015 through 2018-2019 school years. Analyses combined student records data with baseline application data received from Higher Achievement National.
NOTES: Estimated differences are regression adjusted using ordinary least squares, controlling for baseline characteristics and random assignment block. The values in the column labeled “Program Group” are the observed means for children who were randomly assigned to attend the Higher Achievement program. The “Control Group” values in the next column are the regression-adjusted means for children who were randomly assigned to not attend the Higher Achievement program. The values in the “Effect Size” column are the estimated effect divided by the standard deviation for the sample. Statistical significance levels are indicated as follows: *** = 1 percent; ** = 5 percent; * = 10 percent. Differences across subgroup impacts were tested for statistical significance. Statistical significance levels for differences in impacts across subgroups (F-test) are indicated as follows: ††† = 1 percent; †† = 5 percent; † = 10 percent. GPA is grade point average and is measured on a scale of 1.0 to 4.32. Rounding may cause slight discrepancies in sums and differences.
TABLE 3.4 (continued)
tistically significant impacts in Year 2 on all four course grades (the GPA impact was 0.31), and the difference in GPA impacts between the two groups of students (namely between those with higher versus lower grades at enrollment) was statistically significant. The Year 2 impacts on both math and ELA test scores were also significantly different across the two types of students, with larger impacts on the students who entered the program with strong math skills (the math impact was 0.13; and the ELA impact was 0.09).
The pattern of having larger impacts on academically stronger students was also seen for those who entered Higher Achievement with stronger ELA grades. However, the difference in GPA impacts between youth entering the program with higher and lower ELA grades was not sta-tistically significant at conventional levels (the p-value was 0.14). The impacts on math and ELA test scores for students with better ELA grades (0.18 for both) appear to be larger than for students with lower ELA grades, and the difference between subgroup impacts was statistically significant for ELA tests.
Taking these two subgroup analyses together, it appears that Higher Achievement had larger impacts on outcomes for students who started the program on grade level — the students it traditionally targets. During the study period, the program ended up accepting students with lower course grades than it usually enrolls, in order to fill its rosters, allowing it to investigate whether to broaden program intake. The implementation study discussed in Chapter 2 found that students who struggled more academically had trouble engaging with the Afterschool and Summer Academy curricula. The subgroup impact analyses support the idea that they were not well served. They may also have been the students who dropped out of the program, but without program participation data the study cannot address this hypothesis.
• The subgroup analyses also suggest that Higher Achievement may be particularly beneficial for boys with respect to their math performance.
Table 3.5 shows that the impacts on boys’ math grades in Year 1 and math test scores in Year 2 were significantly greater than the impacts on girls in those outcomes (as shown by the “dagger” in the last column). The differences in impacts on math grades between boys and girls in Year 2
AIMING HIGHER: ASSESSING HIGHER ACHIEVEMENT’S OUT-OF-SCHOOL EXPANSION EFFORTS | 41

TABLE 3.5 Higher Achievement Study Impacts on Test Scores and Course Grades, Gender Subgroups
MALE FEMALE
OUTCOMEPROGRAM
GROUPCONTROL
GROUPEFFECT
SIZE P-VALUE PROGRAM
GROUPCONTROL
GROUPEFFECT
SIZE P-VALUE DIFFERENTIALSIGNIFICANCE
Year 1
Test-score outcomes
Math standardized test score -0.04 -0.11 0.06 0.560 -0.03 -0.04 0.01 0.923
ELA standardized test score -0.23 -0.33 0.09 0.395 0.11 0.01 0.10 0.258
Number of students 210 118 245 154
Course-grade outcomes
GPA 2.69 2.53 0.21 ** 0.036 2.77 2.70 0.09 0.293
Math course grade 2.51 2.25 0.26 ** 0.010 2.53 2.46 0.07 0.492 †
English course grade 2.51 2.46 0.05 0.686 2.78 2.65 0.14 0.166
Science course grade 2.78 2.66 0.14 0.259 2.85 2.81 0.05 0.590
Social Studies course grade 2.97 2.81 0.17 0.109 2.94 2.91 0.04 0.719
Number of students 219 123 251 160
Year 2
Test-score outcomes
Math standardized test score -0.02 -0.25 0.21 0.166 -0.01 0.02 -0.03 0.789 †
ELA standardized test score -0.17 -0.20 0.02 0.863 0.17 0.11 0.06 0.557
Number of students 176 108 218 143
Course-grade outcomes
GPA 2.49 2.27 0.28 ** 0.021 2.68 2.55 0.18 0.128
Math course grade 2.50 2.14 0.37 ** 0.014 2.56 2.44 0.14 0.243
English course grade 2.41 2.13 0.31 ** 0.017 2.66 2.55 0.12 0.316
Science course grade 2.50 2.35 0.16 0.298 2.76 2.54 0.26 ** 0.050
Social Studies course grade 2.59 2.50 0.09 0.464 2.74 2.67 0.08 0.525
Number of students 184 109 230 146(continued)
42 | AIMING HIGHER: ASSESSING HIGHER ACHIEVEMENT’S OUT-OF-SCHOOL EXPANSION EFFORTS

was marginally statistically significant (p = 0.11). Higher Achievement’s stronger effect on boys does not appear to be due to boys being stronger in math at baseline than girls, or to boys being less likely to drop out of the program. Instead, it appears that without Higher Achievement, boys’ math performance (as ref lected in the control group’s outcomes) fell much more than girls’ over time. With Higher Achievement, however, the fall in boys’ math grades was reduced. That pattern is also seen for boys’ overall grade point average, but the differences between the impact on boys versus girls in Year 2 was not large enough to be statistically significant.
Impacts did not differ significantly between any other subgroups of students. In particular, analyses did not reveal strong evidence that students in single-school and magnet programs were affected differently; the same was true for students in the different sites (including Baltimore, which, as discussed earlier, implemented a slightly different program model in two of its centers).
In summary, Higher Achievement had a positive impact on its scholars’ academic performance, on their grades in particular, two years after they enrolled. Higher Achievement did not have a significant impact on grades or test scores in Year 1, or test scores in Year 2. By Year 2, however, the impact on grades was positive overall, and was especially strong for students who came to Higher Achievement solidly on grade level, earning As and Bs in their classes. The two-year impact on scholars’ grades was the same whether they enrolled as rising fifth- or sixth-graders, regardless of race, and across all the expansion sites. The impacts on outcomes among scholars attending single-school centers were also similar to the impacts for those in magnet centers.
SOURCE: MDRC’s calculations use student records data from Baltimore, Pittsburgh, and Richmond/Henrico public school districts from the 2014-2015 through 2018-2019 school years. Analyses combined student records data with baseline application data received from Higher Achievement National.
NOTES: Estimated differences are regression adjusted using ordinary least squares, controlling for baseline characteristics and random assignment block. The values in the column labeled “Program Group” are the observed means for children who were randomly assigned to attend the Higher Achievement program. The “Control Group” values in the next column are the regression-adjusted means for children who were randomly assigned to not attend the Higher Achievement program. The values in the “Effect Size” column are the estimated effect divided by the standard deviation for the sample. Statistical significance levels are indicated as follows: *** = 1 percent; ** = 5 percent; * = 10 percent. Differences across subgroup impacts were tested for statistical significance. Statistical significance levels for differences in impacts across subgroups (F-test) are indicated as follows: ††† = 1 percent; †† = 5 percent; † = 10 percent. GPA is grade point average and is measured on a scale of 1.0 to 4.3. Rounding may cause slight discrepancies in sums and differences.
TABLE 3.5 (continued)
AIMING HIGHER: ASSESSING HIGHER ACHIEVEMENT’S OUT-OF-SCHOOL EXPANSION EFFORTS | 43


CHAPTER
4
Reflections and Conclusions
By sixth grade, middle class children have likely spent 6,000 more hours learning than children born into poverty.1 The results of this disparity affect all members of society, in part through
the impact on the economy. Leveling the educational playing field is thus a goal of citizens and policymakers alike. This study shows that Higher Achievement can be part of the solution.
Higher Achievement has now undergone its second randomized controlled study that docu-ments the program’s positive impacts on the academic performance of its scholars. Table 4.1 summarizes this evidence base. The first study found that the basic model worked in DC Metro, the program’s f lagship affiliate, while this study shows that it continues to be effective in three expansion cities that have made adaptations to ref lect changing educational priorities.
PRINCIPAL FINDINGS
The principal impact finding of the current study is that two years after applying to Higher Achievement, program group students in the expansion sites earned better grades than control group students in English, math, and science. At the end of the first year, a slight impact on grades was observed, but the magnitude of the effects was too small to be meaningful or significant, other than to hint at progress. But after two years, positive and statistically significant impacts on students’ grades were observed. In the first year, the impacts on students’ English Language Arts (ELA) and math test scores, on the other hand, as measured by each school district’s stan-dardized test scores, were much smaller than those on grades. That is, there were essentially no differences between the test scores of students who were admitted to Higher Achievement and those who were not. After the second year, the difference in test scores increased, but it was still not enough to meet established standards of statistical significance and thus be truly meaningful.
1 ExpandED Schools (2013).

The ability to improve middle school grades is notable. Literature shows that students who have stronger academic achievement in middle school are more likely to succeed in high school.2 Indeed, a growing body of literature shows that school performance measures beyond test scores, such as grades, are more strongly related to later success in the workplace and in life than test score performance.3 Researchers believe this is because grades capture not only academic knowledge but also the development of characteristics that are highly valued by employers, such as per-severance, self-control, attentiveness, and other key social-emotional competencies. A recent summary of this literature points out that U.S. employers are both demanding and rewarding
2 Grossman and Cooney (2009); Reyes, Gillock, Kobus, and Sanchez (2000). Although not measured in the study, Higher Achievement’s program model tries to strengthen scholars’ sense of scholastic competence by intentionally giving them not only challenging material but also the individual attention needed to master it.
3 Kautz et al. (2014).
TABLE 4.1 Comparison of Impacts Across Higher Achievement's Two Studies
FIRST EVALUATION CURRENT EVALUATION
VARIA BLE YEAR 1 YEAR 2 YEAR 1 YEAR 2
Earned As/Bs at baseline (%) 52 52 34 34
Percentage difference of program vs. control students receiving academic enrichment in a program over the two-year period 57 *** 50 *** 71 *** 69 ***
Math impacta
Problem solving 0.03 0.10 *** - -
Total math score - - -0.01 0.06
Reading impacta
Comprehension 0.02 0.08 * - -
Total reading score - - 0.00 0.05
Grade (GPA) impacta - - 0.07 0.20 ***
Math - - 0.09 0.19 **
Reading - - 0.06 0.18 **
Science - - 0.00 0.17 **
Social Studies - - 0.06 0.12
SOURCE: MDRC calculation and Herrera, Linden, Arbreton, and Grossman (2011).
NOTES: Hyphens indicate unavailable data. Statistical significance levels are indicated as follows: *** = 1 percent; ** = 5 percent; * = 10 percent. aValues represent effect sizes.
46 | AIMING HIGHER: ASSESSING HIGHER ACHIEVEMENT’S OUT-OF-SCHOOL EXPANSION EFFORTS

through higher wages these noncognitive skills more than they did 20 years ago.4 After-school and summer programs that provide young people with a sequence of challenging activities that are explicitly focused on building one or more personal or social skills (such as persistence or character, which underlie many of Higher Achievement activities) have been shown to be effec-tive in promoting social-emotional development.5
This study found that the magnitude of the test-score impacts increased between Years 1 and 2, paralleling the pattern observed with the grade impacts and the pattern over time in academic outcomes observed in the first study. However, in this study, the impact on test scores was not large enough to be statistically significant, even in Year 2. Three factors may have led to the current study’s inability to detect ELA and math skill gains. First, the difficulty mentors had using the new after-school curricula likely dampened test-score impacts. Second, the current study consisted of many more students who were academically struggling (that is, earned Cs or lower at baseline) than were included in the first study, and subgroup analyses suggest that Higher Achievement is less effective at serving these types of students. Third, in the first study, to minimize the burden on families, the researchers administered only the reading comprehension and math problem solving subtests of a well-known standardized test, not the other subtests, such as vocabulary and numerical operations, which contribute to students’ total ELA and math scores, as was used in the current study.6 If the program’s impacts on these other components are smaller than those on comprehension and problem solving, the average impacts on the total scores would be smaller than on comprehension and problem solving alone.
The pattern of small or no impacts in the first year followed by larger academic impacts in the second, seen in this study for both grades and test scores, parallels the longitudinal pattern of impacts seen in Higher Achievement’s first evaluation and other evaluations of out-of-school-time programs. As was noted in the first study, this pattern suggests that changes in academic outcomes take time to occur, requiring a minimum of a year of participation.7 One policy and funding implication of this pattern is that programs that fail to produce measurable impacts after a year should not be dismissed out of hand, as they may very well produce results after students have had more exposure to the program. Thus, academic out-of-school-time programs should take active steps to retain students year to year if they want to have impacts.
Another important aspect of the study to keep in mind is that Higher Achievement occupies a slightly different educational space than many academically oriented programs in under-resourced neighborhoods. Most government- and foundation-supported academic summer and after-school programs in these communities are remedial. Students’ academic problems are front and center, and the programs are structured to help children who are performing below grade level. Higher Achievement is not a remedial program. Instead, it aims to accelerate and deepen
4 Schanzenbach et al. (2016).
5 Devaney (2015); Larson and Angus (2011); Salusky et al. (2014).
6 The Stanford Achievement Test (10th edition) was used at the time of the study by many districts (but not Washington, DC, or Alexandria) to assess their schools’ impacts on math and reading.
7 Metz, Goldsmith, and Arbreton (2008).
AIMING HIGHER: ASSESSING HIGHER ACHIEVEMENT’S OUT-OF-SCHOOL EXPANSION EFFORTS | 47
on-grade learning. That focus helps explain why earlier analyses found that the program was less effective at serving academically struggling students; they are simply not the group that Higher Achievement traditionally targets.
This study also has lessons for how out-of-school-time programs operate, especially those for middle school students. Many studies of out-of-school-time programs suggest that the relation-ships students form with program adults are strongly related to how long the students stay and engage in the program. These adult-youth relationships are particularly important for middle-schoolers (compared with elementary and high school students).8 Higher Achievement provides scholars with many adults to bond with — the center director, the assistant director, study hall supervisors, summer teachers, and ELA and math mentors. This implementation study found that while mentors formed good relationships with scholars that fostered positive experiences in the program, relationships with the centers’ paid staff seemed particularly important in shaping students’ engagement and behavior. The center staff, which interacted with all of the scholars at a given center, was present every day during the school year and summer months, often for multiple years. The mentors’ commitments, on the other hand, were only for one day a week during the school year, with less than half continuing into a second year. The consistency of the center staff ’s presence over a longer period appears to be an important element of a scholar’s experience. Thus, finding ways to minimize staff turnover appears to be important for youth programming, especially programs serving middle school students.
One of the interesting features of Higher Achievement is its use of volunteers to deliver academic lessons in the evening during the school year. It is not the only program to have effectively used volunteers as instructors. For example, Reading Partners uses volunteers, similar to Higher Achievement’s mentors, to deliver scripted ELA lessons one-on-one to students in kindergarten through fifth grade. Experience Corps volunteers teach students in first through third grade, and Jumpstart uses volunteers in its Foster Grandparent program to help teach preschool children literacy fundamentals. Higher Achievement, however, engages volunteers to work with older students. Several lessons associated with working with this age group emerged in this study.
WORKING WITH OLDER STUDENTS: LESSONS LEARNED
Training Volunteers
Like earlier evaluations,9 this study found that volunteers can be trained to deliver scripted aca-demic lessons. However, literature on volunteer tutoring also shows that training is critical to success so that the volunteers know how to respond when “off-script” questions or issues arise. Higher Achievement’s after-school curricula scripts assumed mastery of on-grade-level skills; for example, a sixth-grade scholar was assumed to have mastery of the skills learned in first through fifth grade. Still, the implementation interviews revealed that many of the scholars lacked some of these assumed skills. Because the number and types of skills students are expected to have
8 Grossman, Campbell, and Raley (2007).
9 Garcia, Price, Avila, and Somers (2019); Jacob, Smith, Willard, and Rifkin (2014).
48 | AIMING HIGHER: ASSESSING HIGHER ACHIEVEMENT’S OUT-OF-SCHOOL EXPANSION EFFORTS

acquired grows as they progress through school, middle school students can struggle with a wider range of issues than elementary school students. Thus, it is harder for scripted curricula aimed at older youth to cover all of the possible issues. Interviews with program staff, teachers, and mentors all indicated that to be effective, Higher Achievement instructors had to differen-tiate the lessons’ content to account for different levels of understanding among scholars. But mentors, who were not certified teachers, had little guidance on how to do this and commonly reported that they struggled to successfully deliver the curricula because their mentees came to them with different academic skill sets. Providing volunteers with more extensive guidance on how to adjust instruction accordingly is likely to be an important step in helping them be even more effective.
Managing Behavior and Engagement
Behavior management and its mirror issue, engagement, make up another training topic that appears to be more important — and, at the same time, more challenging — for volunteers teaching older students. Unlike the findings of many evaluations of programs for younger students, Higher Achievement staff and mentors both noted that scholars’ engagement and behavior were challenging, especially that of the seventh-graders. Children ages 10 to 15 are going through tremendous social-emotional and psychological changes. Engagement techniques that were effective in the early elementary school grades no longer work as well as students get older. Indeed, techniques that work for fifth-graders are less effective with seventh-graders. The Higher Achievement mentors and staff found that strategies such as allowing scholars to have input into programming activities and providing them with leadership opportunities worked best to foster engagement. These techniques become more important as students get older. For this reason, tailoring training and support for volunteers depending on the age of their scholars may be important.
Instructional Practices and Timing of Training
Unrelated to the age of the scholars, this study found that volunteers helped students learn by covering a lesson’s skill, such as how to solve a math expression containing parentheses. However, mentors were less likely to execute the parts of the lessons aimed at fostering high-level thinking, instructional practices such as having scholars “think aloud” or “turn and talk” with their bud-dies. Such training in the role and purpose of various instructional practices is rare but crucial. Even teachers do not always fully understand how certain practices are critical in achieving a curriculum’s goal.10 Better training needs to be developed that will help volunteers effectively use the instructional practices that underpin school districts’ recent standards.
More broadly, although the program was successful at engaging mentors in pre-service training, providing training and feedback to mentors after the start of programming was more challeng-ing; in fact, this aspect of fidelity was among the most difficult to implement across sites. Even when programs expend significant efforts on developing ongoing training, getting volunteer
10 Rappaport et al. (2017).
AIMING HIGHER: ASSESSING HIGHER ACHIEVEMENT’S OUT-OF-SCHOOL EXPANSION EFFORTS | 49

mentors to engage in these trainings is one of their biggest challenges.11 It is important to en-sure that key components of the Higher Achievement program are highlighted in pre-service training sessions and that ongoing training is offered in multiple ways that fit with mentor’s lives, for example, at times and using media that are convenient for them, including providing training material online.
LOOKING AHEAD
The current evaluation provided Higher Achievement with extensive feedback. Learning from the report team over five years about program challenges, talking to students’ families, and continuing its own internal evaluation efforts have spurred Higher Achievement to improve its program in several ways starting in the 2020-2021 school year. First, it is expanding the Afterschool Academy from three days a week to four, and it is starting it a week earlier in the school year. Two days a week will include mentoring sessions and the other two will have enrich-ment activities. The organization is introducing a new curriculum that includes more hands-on activities for the scholars and is focusing on STEM (science, technology, engineering, and math) and humanities as well as on building social-emotional skills. This curriculum also differs for the seventh- and eighth-graders, to keep these older scholars engaged. Study hall will also be expanded to include both homework help and academic skill-building activities across all four days. In addition, Higher Achievement is discontinuing its Summer Academy. Instead it will provide resources to help families enroll in other summer-long programs with strong track re-cords. This will enable center staff to hold individual meetings with each scholar and their family to focus on high school planning, college visits, and preparing for the Afterschool Academy. Finally, applicants will have to have earned at least a C in math or ELA to be eligible to enroll, instead of not having any grade requirements. Taken together, these changes are designed to increase opportunities for scholars to form strong relationships with the program adults and to obtain a greater “dosage” of enrichment.
The results of this evaluation should encourage Higher Achievement and funders to further expand the program. Higher Achievement was able to do what few programs have been able to demonstrate: It expanded to new school districts, was able to create experiences for the scholars that were more enriching than they would have gotten without the program, and maintained its effectiveness across the new sites. To maintain its quality, the program has a culture of constant improvement, always learning from its experiences and adapting. As a result, it is continuing its program development in the upcoming years. The findings in this report are also useful for other after-school and summer programs in their quest to improve implementation quality and effectiveness.
11 Herrera, DuBois, and Grossman (2013); Jarjoura et al. (2018).
50 | AIMING HIGHER: ASSESSING HIGHER ACHIEVEMENT’S OUT-OF-SCHOOL EXPANSION EFFORTS

APPENDIX
A
Study Recruitment and Impact Sample and Analysis


Higher Achievement staff recruited the same group of children for the study — rising fifth- and sixth-graders — as they usually did for their program, except this time they recruited
more than they needed to fill each center. They advertised the program in district schools, and interested parents filled out the application. Parents and children were then invited for in-person interviews during which Higher Achievement staff made certain that they understood the long-term and intensive time commitment required to participate in the study. The staff also explained that because Higher Achievement was participating in an MDRC evaluation and there were more students who wanted to participate than there were spaces for, all program spots would be filled using a lottery and only families that agreed to participate in the study could be entered into the lottery. Families that won the lottery would be offered a position, while families that did not could not reapply to the program. Staff answered any questions the parent or child had about the study and if parents agreed to let their child participate, they were given a consent form and the child was given an assent form to sign. Once families agreed to participate in the study, parents completed a supplemental application form that asked additional baseline ques-tions such as the parents’ education and income.
Both the standard Higher Achievement application form and the supplemental form developed for this study collected sociodemographic information about the parents and the children so that Higher Achievement could describe the population they serve as well as collect emergency contact numbers. The study team used these data to describe the characteristics of the sample, ensure the program and control groups were balanced, investigate subgroup impacts, and use the data as covariates in the impact analyses.
STUDENT RANDOMIZATION
Once MDRC received the parents’ signed consent form, the child’s signed assent form, and all of the family’s application information, the child was entered into MDRC’s random assignment system. Lotteries were held in the expansion sites four times during the study: spring 2015, fall 2015, spring 2016, and fall 2016. An additional spring 2017 lottery was also held in the DC Metro affiliate. Because random assignment occurred over multiple years, after the first lottery the identities of applicants were checked against the current list of control group members to ensure that control families were not reapplying. All first-time program applicants who agreed to participate in the study were deemed eligible to be randomly assigned into either the program or control group. Each year, randomization was conducted separately by center and by grade level (rising fifth- and sixth-graders) and in some cases, by gender or other characteristics. To the degree possible, researchers set the program-control ratio at 50 percent or one-to-one. If there were not enough applicants to fill a center’s grade level and gender requirements, the researchers aimed for a 66 percent random assignment ratio, with two program students for every control student. In a few cases, even a 66 percent ratio would not fulfill the center’s requirements; in those instances, the students needed to fill the center were randomly selected. Those not selected were deemed control students.
AIMING HIGHER: ASSESSING HIGHER ACHIEVEMENT’S OUT-OF-SCHOOL EXPANSION EFFORTS | 53
IMPACT DATA
Student Records
Student records data were requested from school districts where study students were enrolled, namely Alexandria City Public Schools, Baltimore City Schools, DC Public Schools (DCPS), Richmond Public Schools and Henrico County Public Schools, and Pittsburgh Public Schools.1 In addition, given the large number of students in the DC area who indicated they would attend charter schools in the fall of Year 1, student records data were requested from the most common DC-area charter schools mentioned by students in their applications for Higher Achievement. Data requested included student demographic variables; school identifiers; standardized test scores in math and English Language Arts (ELA); course grades in math, ELA, social studies, and science; attendance, and disciplinary information. These data were requested for the student’s baseline year (before the study began) and for the next two years.
Student records data files received from districts and charter schools were cleaned and processed and then combined with Higher Achievement application data and students’ random assignment blocks from the randomization. This analytic dataset was used to conduct baseline equivalence analyses and impact analyses.
Treatment of Missing Values
For model covariates with missing data, the report team assigned variables for which a value is missing a value of zero and then included an indicator variable set to one if the value of the original variable is zero.2 Both the reassigned variable and the indicator variable were included as covariates in the model described below.
In the case of outcomes with missing data, those records were omitted from the analysis. As described in the section below, the analytic samples were defined by the presence of non-missing values in key outcome variables.
Analytic Sample Definition
To optimize the study’s ability to statistically detect effects, and due to differences in data avail-ability across outcomes (standardized test scores and course grades) and by year, the report team decided to define the analytic samples to maximize their size. This resulted in four analytic samples: Year 1 test scores, Year 2 test scores, Year 1 course grades, and Year 2 course grades. For inclusion in the test-score samples, a student’s record had to contain both math and ELA standardized test scores in that particular follow-up year — that is, both scores in follow-up Year 1 for Year 1 sample, and both scores in follow-up Year 2 for Year 2 sample. For inclusion in the course-grade samples, a student’s record had to contain both math and ELA course grades in
1 DCPS and Alexandria are grouped together as DC Metro, and Richmond and Henrico are grouped together as Richmond for affiliate-level analyses.
2 This approach is described in Puma, Olsen, Bell, and Price (2009).
54 | AIMING HIGHER: ASSESSING HIGHER ACHIEVEMENT’S OUT-OF-SCHOOL EXPANSION EFFORTS
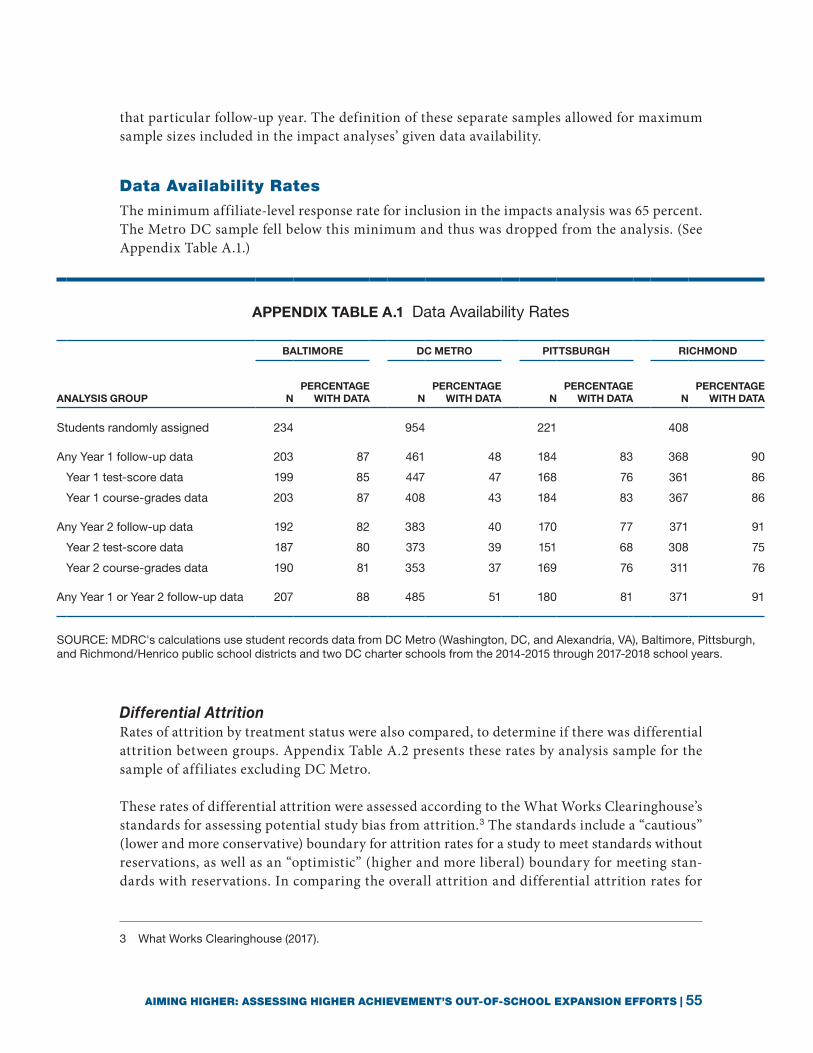
that particular follow-up year. The definition of these separate samples allowed for maximum sample sizes included in the impact analyses’ given data availability.
Data Availability Rates
The minimum affiliate-level response rate for inclusion in the impacts analysis was 65 percent. The Metro DC sample fell below this minimum and thus was dropped from the analysis. (See Appendix Table A.1.)
Differential AttritionRates of attrition by treatment status were also compared, to determine if there was differential attrition between groups. Appendix Table A.2 presents these rates by analysis sample for the sample of affiliates excluding DC Metro.
These rates of differential attrition were assessed according to the What Works Clearinghouse’s standards for assessing potential study bias from attrition.3 The standards include a “cautious” (lower and more conservative) boundary for attrition rates for a study to meet standards without reservations, as well as an “optimistic” (higher and more liberal) boundary for meeting stan-dards with reservations. In comparing the overall attrition and differential attrition rates for
3 What Works Clearinghouse (2017).
APPENDIX TABLE A.1 Data Availability Rates
BALTIMORE DC METRO PITTSBURGH RICHMOND
ANALYSIS GROUP NPERCENTAGE
WITH DATA NPERCENTAGE
WITH DATA NPERCENTAGE
WITH DATA NPERCENTAGE
WITH DATA
Students randomly assigned 234 954 221 408
Any Year 1 follow-up data 203 87 461 48 184 83 368 90
Year 1 test-score data 199 85 447 47 168 76 361 86
Year 1 course-grades data 203 87 408 43 184 83 367 86
Any Year 2 follow-up data 192 82 383 40 170 77 371 91
Year 2 test-score data 187 80 373 39 151 68 308 75
Year 2 course-grades data 190 81 353 37 169 76 311 76
Any Year 1 or Year 2 follow-up data 207 88 485 51 180 81 371 91
SOURCE: MDRC's calculations use student records data from DC Metro (Washington, DC, and Alexandria, VA), Baltimore, Pittsburgh, and Richmond/Henrico public school districts and two DC charter schools from the 2014-2015 through 2017-2018 school years.
AIMING HIGHER: ASSESSING HIGHER ACHIEVEMENT’S OUT-OF-SCHOOL EXPANSION EFFORTS | 55

each analytic sample, both Year 1 samples fall below the optimistic boundary attrition threshold but above the cautious boundary. Both Year 2 samples are under the cautious boundary. This means that the Year 2 samples have a tolerable threat of bias under cautious assumptions (that is, that the differential was not induced by the program), while the Year 1 samples have a toler-able threat of bias under optimistic assumptions.
Processing and Recoding of Key Variables for Impact Analysis
Test Scores — NormalizationResearchers received data from three different standardized tests.4 As each of these tests had different scoring scales and test content varied by grade level, it was necessary to standardize these different scoring systems to a common scale that could be used to make fair comparisons for the test analytic samples. This standardization was accomplished by normalization, in which the mean of a group is subtracted from the individual score value and the difference is divided by the group’s standard deviation. This produces a distribution centered around a mean of zero, with values above the mean having positive normalized scores and values below the mean having negative normalized scores. Test scores for all three years were normalized by school district and by student grade level in order to account for variation across these factors. Normalization for baseline test scores used the standard deviation of the pooled treatment and control student sample, whereas normalization for follow-up Year 1 and Year 2 test scores used the standard deviation of the control student sample.
4 These tests were: the Pennsylvania System of State Assessment (PSSA) for Pittsburgh; the Partnership for Assessment of Readiness for College and Careers (PARCC) for Washington, DC, and Baltimore; and the Virginia Standards of Learning (SOL) for Alexandria, Henrico, and Richmond.
APPENDIX TABLE A.2 Differential Attrition
YEAR 1 ATTRITION (%) YEAR 2 ATTRITION (%)
PROGRAM STATUS STUDENTS RANDOMLY
ASSIGNED (TOTAL N)TEST
SCORESCOURSEGRADES
TESTSCORES
COURSEGRADES
Program 524 13 10 25 21
Control 339 20 15 26 22
Percent differentialattrition (program groupvs. control group) 7 5 1 1
SOURCE: MDRC's calculations use student records data from Baltimore, Pittsburgh, and Richmond/Henrico public school districts from the 2014-2015 through 2017-2018 school years. Student records data were combined with baseline application data received from Higher Achievement National.
NOTES: Attrition rates have been regression adjusted by random assignment block and by analysis sample for the sample of affiliates excluding DC Metro.
56 | AIMING HIGHER: ASSESSING HIGHER ACHIEVEMENT’S OUT-OF-SCHOOL EXPANSION EFFORTS

Course Grade ConversionsCourse-grade data varied by school district and by grade level and needed conversion to a com-mon scale for fair comparisons. In general, elementary course grades were given on a numeric scale of 1-4, whereas middle or secondary school grades were given on a letter grade scale of A through F. Letter grades were first converted to a 0-4 numeric scale, where A = 4 and F = 0. Select school districts also graded up to A+, so any A+ grades were additionally converted to a numeric value of 4.3. Once this was complete, the two scales (0-4.3 and 1-4) needed to be reconciled so grades could be standardized across the three years of data. To do this, the decision was made to code grade values of 0 to 1 (that is, collapse D and F into a single value), so all grades would be measured on the same 1-4.3 scale. This affected 300 student records across all districts.
In cases where a student had both elementary-level and secondary-level grades in the same subject within the same year, the mean across the two course-grade values was taken after standardization to the 1-4.3 scale.
MODELS USED FOR IMPACT ANALYSIS
The impact of the Higher Achievement model was estimated by fitting the following statisti-cal model to students in the analysis sample who were assigned to Higher Achievement or the business-as-usual control group:
where the variables in this model are defined as follows:
= O utcome of interest for student i;
= Indicator for group membership (=1 if student i is assigned to Higher Achievement and =0 if the student is assigned to the business-as-usual control group);
= Set of D indicators for the random assignment blocks (=1 if student i is in random assignment block d, and =0 otherwise). As noted earlier, random assignment was conducted by clusters;
= A set of S student-level covariates for student i; these variables are included to improve the precision of the impact estimates;
= A student-level random error for student i, assumed to be independently and identi-cally distributed.
In this model, the estimate of is a fixed-effects estimate of the impact of the Higher Achievement model in the centers in the study.5 There are several features to note about this model:
5 In other words, the results only apply to the centers in the study, and they should not be generalized to a different set of centers.
AIMING HIGHER: ASSESSING HIGHER ACHIEVEMENT’S OUT-OF-SCHOOL EXPANSION EFFORTS | 57

• Random assignment blocks: The model includes a set of indicators for random assignment blocks. Controlling for blocks in the model serves two purposes. First, it accounts for differ-ences in the random assignment ratio (proportion of students assigned to each experimental group) across blocks to provide an unbiased estimate of impacts.6 Second, it improves the precision of the impact estimates by explaining some of the variation in student outcomes among students in the sample.
• Student-level covariates: The model also controls for students’ baseline characteristics, includ-ing their race/ethnicity; gender; grade level at baseline (fourth or fifth grade); whether the student is over-age for their grade level; whether the student is eligible for free or reduced-price lunch; whether the student experienced a series of 10 life stressors in the past year;7 parent education; and students’ baseline math and ELA standardized test scores (for math and ELA test score outcomes) or students’ baseline math, ELA, social studies, and science course grades (for math, ELA, social studies, science, and GPA course-grade outcomes8). Controlling for students’ baseline characteristics and outcomes improves the precision of the estimated impact.
6 There are several ways to account for variation in the random assignment ratio. The two most common are to: (1) “block-mean” center the covariates on the right-hand side of the model, or (2) include block indicators in the model. These two methods produce the same impact estimate. See Raudenbush (2009).
7 Stressors include: child has moved or changed addresses, one of the parents/guardians started working, one of the parents/guardians stopped working or lost job, child has been bullied, child has changed schools, someone close to the child died, parents have separated, someone has moved into or out of the household, someone child knows well was hurt or ill, household member had a baby.
8 GPA was created as the mean of available individual subject area grades. Baseline GPA, though not explicitly used as a covariate, is an arithmetic function of the grades in individual subject areas. Thus, the model accounts for variation in baseline GPA for GPA as an outcome.
58 | AIMING HIGHER: ASSESSING HIGHER ACHIEVEMENT’S OUT-OF-SCHOOL EXPANSION EFFORTS

APPENDIX
B
Baseline Tables for Additional Analytic Samples

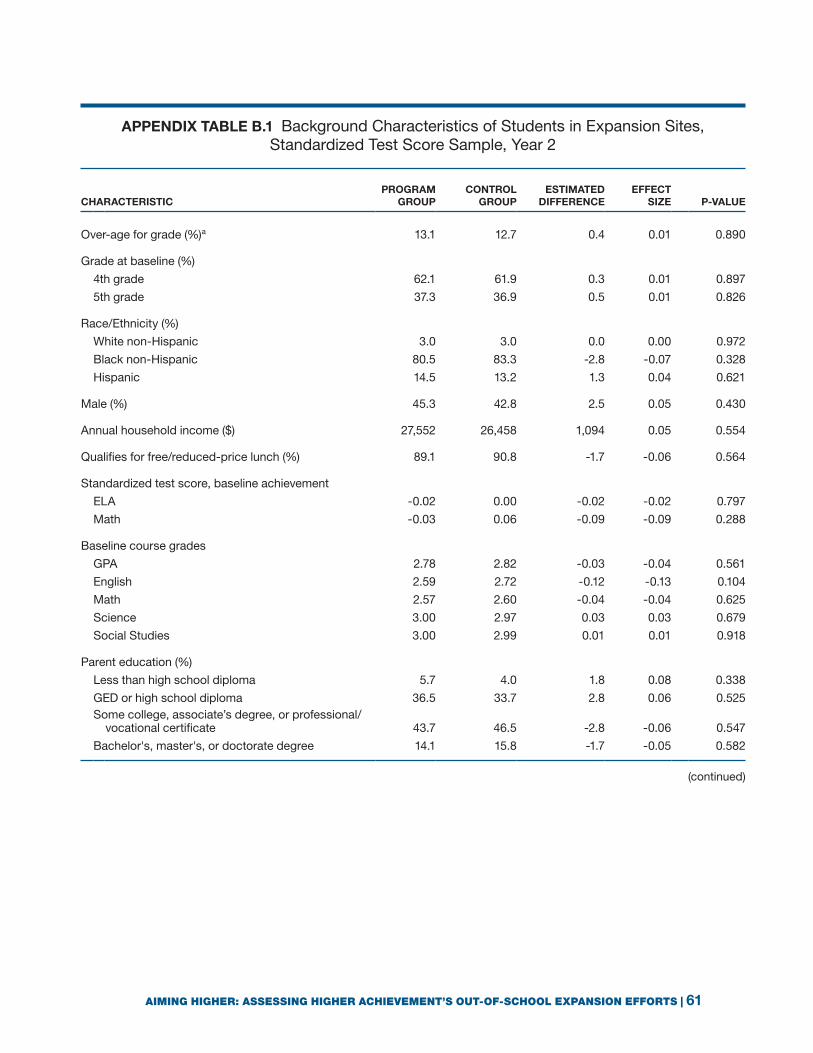
CHARACTERISTICPROGRAM
GROUPCONTROL
GROUPESTIMATED
DIFFERENCEEFFECT
SIZE P-VALUE
Over-age for grade (%)a 13.1 12.7 0.4 0.01 0.890
Grade at baseline (%)
4th grade 62.1 61.9 0.3 0.01 0.897
5th grade 37.3 36.9 0.5 0.01 0.826
Race/Ethnicity (%)
White non-Hispanic 3.0 3.0 0.0 0.00 0.972
Black non-Hispanic 80.5 83.3 -2.8 -0.07 0.328
Hispanic 14.5 13.2 1.3 0.04 0.621
Male (%) 45.3 42.8 2.5 0.05 0.430
Annual household income ($) 27,552 26,458 1,094 0.05 0.554
Qualifies for free/reduced-price lunch (%) 89.1 90.8 -1.7 -0.06 0.564
Standardized test score, baseline achievement
ELA -0.02 0.00 -0.02 -0.02 0.797
Math -0.03 0.06 -0.09 -0.09 0.288
Baseline course grades
GPA 2.78 2.82 -0.03 -0.04 0.561
English 2.59 2.72 -0.12 -0.13 0.104
Math 2.57 2.60 -0.04 -0.04 0.625
Science 3.00 2.97 0.03 0.03 0.679
Social Studies 3.00 2.99 0.01 0.01 0.918
Parent education (%)
Less than high school diploma 5.7 4.0 1.8 0.08 0.338
GED or high school diploma 36.5 33.7 2.8 0.06 0.525 Some college, associate’s degree, or professional/
vocational certificate 43.7 46.5 -2.8 -0.06 0.547
Bachelor's, master's, or doctorate degree 14.1 15.8 -1.7 -0.05 0.582
(continued)
APPENDIX TABLE B.1 Background Characteristics of Students in Expansion Sites, Standardized Test Score Sample, Year 2
AIMING HIGHER: ASSESSING HIGHER ACHIEVEMENT’S OUT-OF-SCHOOL EXPANSION EFFORTS | 61

CHARACTERISTICPROGRAM
GROUPCONTROL
GROUPESTIMATED
DIFFERENCEEFFECT
SIZE P-VALUE
Series of 10 life stressors the child has faced (%)
Child has moved or changed addresses 13.1 9.8 3.3 0.10 0.296
One of the parents/guardians started working 26.3 31.0 -4.7 -0.10 0.300 One of the parents/guardians stopped working
or lost job 16.0 13.7 2.3 0.06 0.516
Child has been bullied 23.0 18.2 4.8 0.12 0.206
Child has changed schools 19.5 18.1 1.4 0.04 0.701
Someone close to the child died 24.2 21.8 2.4 0.06 0.564
Parents have separated 17.9 16.8 1.1 0.03 0.772
Someone has moved into or out of the household 22.4 22.4 0.0 0.00 0.999
Someone child knows well was hurt or ill 9.9 9.5 0.3 0.01 0.914
Household member had a baby 10.9 13.2 -2.2 -0.07 0.541
Sample size 394 251
SOURCE: MDRC's calculations use student records data from Baltimore, Pittsburgh, and Richmond/Henrico public school districts from the 2014-2015 through 2017-2018 school years. Analyses combined student records data with baseline application data received from Higher Achievement National.
NOTES: Estimated differences are regression adjusted using ordinary least squares, controlling for baseline characteristics and random assignment block. The values in the column labeled “Program Group” are the observed means for children who were randomly assigned to attend the Higher Achievement program. The “Control Group” values in the next column are the regression-adjusted means for children who were randomly assigned to not attend the Higher Achievement program. The values in the “Effect Size” column are the estimated effect divided by the standard deviation for the sample. Statistical significance levels are indicated as follows: *** = 1 percent; ** = 5 percent; * = 10 percent. Baseline GPA is grade point average and is measured on a scale of 1.0 to 4.0. Percentages may not add up to 100 due to lack of representation in some student subgroups. Rounding may cause slight discrepancies in sums and differences. aAge is calculated as of September 1 of the student's baseline year.
APPENDIX TABLE B.1 (continued)
62 | AIMING HIGHER: ASSESSING HIGHER ACHIEVEMENT’S OUT-OF-SCHOOL EXPANSION EFFORTS

CHARACTERISTICPROGRAM
GROUPCONTROL
GROUPESTIMATED
DIFFERENCEEFFECT
SIZE P-VALUE
Over-age for grade (%)a 12.2 10.9 1.4 0.04 0.586
Grade at baseline (%)
4th grade 61.4 61.6 -0.2 0.00 0.916
5th grade 36.7 37.0 -0.2 0.00 0.917
Race/Ethnicity (%)
White non-Hispanic 3.5 2.6 0.9 0.06 0.413
Black non-Hispanic 79.8 84.3 -4.5 -0.12 * 0.066
Hispanic 15.2 12.8 2.4 0.07 0.292
Male (%) 46.8 43.1 3.7 0.07 0.206
Annual household income ($) 26,331 26,522 -191 -0.01 0.910
Qualifies for free/reduced-price lunch (%) 88.4 91.8 -3.5 -0.12 0.203
Standardized test score, baseline achievement
ELA -0.06 -0.02 -0.04 -0.04 0.582
Math -0.08 0.05 -0.13 -0.13 * 0.078
Baseline course grades
GPA 2.72 2.80 -0.08 -0.10 0.137
English 2.57 2.69 -0.12 -0.13 * 0.072
Math 2.53 2.59 -0.07 -0.07 0.308
Science 2.91 2.95 -0.04 -0.05 0.528
Social Studies 2.89 2.97 -0.08 -0.09 0.235
Parent education (%)
Less than high school diploma 7.3 4.6 2.7 0.11 0.129
GED or high school diploma 36.5 35.1 1.4 0.03 0.726 Some college, associate’s degree, or professional/
vocational certificate 41.7 44.8 -3.1 -0.06 0.445
Bachelor's, master's, or doctorate degree 14.6 15.5 -0.9 -0.03 0.744
(continued)
APPENDIX TABLE B.2 Background Characteristics of Students in Expansion Sites, Course-Grades Sample, Year 1
AIMING HIGHER: ASSESSING HIGHER ACHIEVEMENT’S OUT-OF-SCHOOL EXPANSION EFFORTS | 63

APPENDIX TABLE B.2 (continued)
CHARACTERISTICPROGRAM
GROUPCONTROL
GROUPESTIMATED
DIFFERENCEEFFECT
SIZE P-VALUE
Series of 10 life stressors the child has faced (%)
Child has moved or changed addresses 11.9 10.6 1.4 0.04 0.628
One of the parents/guardians started working 27.7 31.1 -3.4 -0.08 0.409 One of the parents/guardians stopped working
or lost job 16.7 13.2 3.5 0.10 0.277
Child has been bullied 22.9 18.3 4.6 0.11 0.197
Child has changed schools 20.2 18.1 2.1 0.05 0.527
Someone close to the child died 26.6 21.1 5.5 0.13 0.152
Parents have separated 18.7 16.4 2.3 0.06 0.495
Someone has moved into or out of the household 23.5 21.6 2.0 0.05 0.583
Someone child knows well was hurt or ill 10.3 9.4 0.9 0.03 0.734
Household member had a baby 12.8 12.6 0.1 0.00 0.972
Sample size 470 283
SOURCE: MDRC's calculations use student records data from Baltimore, Pittsburgh, and Richmond/Henrico public school districts from the 2014-2015 through 2017-2018 school years. Analyses combined student records data with baseline application data received from Higher Achievement National.
NOTES: Estimated differences are regression adjusted using ordinary least squares, controlling for baseline characteristics and random assignment block. The values in the column labeled “Program Group” are the observed means for children who were randomly assigned to attend the Higher Achievement program. The “Control Group” values in the next column are the regression-adjusted means for children who were randomly assigned to not attend the Higher Achievement program. The values in the “Effect Size” column are the estimated effect divided by the standard deviation for the sample. Statistical significance levels are indicated as follows: *** = 1 percent; ** = 5 percent; * = 10 percent. Baseline GPA is grade point average and is measured on a scale of 1.0 to 4.0. Percentages may not add up to 100 due to lack of representation in some student subgroups. Rounding may cause slight discrepancies in sums and differences. aAge is calculated as of September 1 of the student's baseline year.
64 | AIMING HIGHER: ASSESSING HIGHER ACHIEVEMENT’S OUT-OF-SCHOOL EXPANSION EFFORTS

APPENDIX TABLE B.3 Background Characteristics of Students in Expansion Sites, Course-Grades Sample, Year 2
CHARACTERISTICPROGRAM
GROUPCONTROL
GROUPESTIMATED
DIFFERENCEEFFECT
SIZE P-VALUE
Over-age for grade (%)a 12.8 12.5 0.3 0.01 0.913
Grade at baseline (%)
4th grade 61.6 61.7 -0.1 0.00 0.957
5th grade 37.2 36.7 0.5 0.01 0.809
Race/Ethnicity (%)
White non-Hispanic 2.9 2.9 -0.1 0.00 0.966
Black non-Hispanic 80.3 83.6 -3.4 -0.09 0.236
Hispanic 15.0 13.0 2.0 0.06 0.439
Male (%) 44.5 42.5 2.0 0.04 0.503
Annual household income ($) 26,593 26,513 80 0.00 0.965
Qualifies for free/reduced-price lunch (%) 90.6 91.0 -0.4 -0.01 0.886
Standardized test score, baseline achievement
ELA -0.07 0.01 -0.07 -0.07 0.377
Math -0.07 0.06 -0.13 -0.13 0.119
Baseline course grades
GPA 2.75 2.82 -0.07 -0.09 0.238
English 2.59 2.72 -0.14 -0.14 * 0.071
Math 2.54 2.61 -0.07 -0.07 0.343
Science 2.95 2.98 -0.03 -0.03 0.676
Social Studies 2.96 2.98 -0.02 -0.03 0.736
Parent Education (%)
Less than high school diploma 6.9 3.9 3.1 0.13 0.104
GED or high school diploma 35.3 33.5 1.8 0.04 0.677 Some college, associate's degree, or professional/
vocational certificate 44.3 46.6 -2.3 -0.05 0.620
Bachelor's, master's, or doctorate degree 13.4 16.0 -2.6 -0.07 0.407
(continued)
AIMING HIGHER: ASSESSING HIGHER ACHIEVEMENT’S OUT-OF-SCHOOL EXPANSION EFFORTS | 65

CHARACTERISTICPROGRAM
GROUPCONTROL
GROUPESTIMATED
DIFFERENCEEFFECT
SIZE P-VALUE
Series of 10 life stressors the child has faced (%)
Child has moved or changed addresses 12.7 9.1 3.5 0.11 0.238
One of the parents/guardians started working 25.4 30.1 -4.7 -0.10 0.292 One of the parents/guardians stopped working
or lost job 16.9 13.9 3.0 0.08 0.397
Child has been bullied 22.0 19.0 3.0 0.07 0.433
Child has changed schools 20.1 17.9 2.3 0.06 0.517
Someone close to the child died 25.0 22.5 2.5 0.06 0.542
Parents have separated 18.4 16.1 2.3 0.06 0.519
Someone has moved into or out of the household 23.4 22.2 1.2 0.03 0.761
Someone child knows well was hurt or ill 10.2 8.9 1.3 0.04 0.648
Household member had a baby 10.8 13.0 -2.2 -0.07 0.545
Sample size 447 279
SOURCE: MDRC's calculations use student records data from Baltimore, Pittsburgh, and Richmond/Henrico public school districts from the 2014-2015 through 2017-2018 school years. Analyses combined student records data with baseline application data received from Higher Achievement National.
NOTES: Estimated differences are regression adjusted using ordinary least squares, controlling for baseline characteristics and random assignment block. The values in the column labeled “Program Group” are the observed means for children who were randomly assigned to attend the Higher Achievement program. The “Control Group” values in the next column are the regression-adjusted means for children who were randomly assigned to not attend the Higher Achievement program. The values in the “Effect Size” column are the estimated effect divided by the standard deviation for the sample. Statistical significance levels are indicated as follows: *** = 1 percent; ** = 5 percent; * = 10 percent. Baseline GPA is grade point average and is measured on a scale of 1.0 to 4.0. Percentages may not add up to 100 due to lack of representation in some student subgroups. Rounding may cause slight discrepancies in sums and differences. aAge is calculated as of September 1 of the student's baseline year.
APPENDIX TABLE B.3 (continued)
66 | AIMING HIGHER: ASSESSING HIGHER ACHIEVEMENT’S OUT-OF-SCHOOL EXPANSION EFFORTS

REFERENCESCohodes, Sarah. 2018. “Policy Issue: Charter Schools and the Achievement Gap.” The Future of
Children (Winter): 1-16.
Devaney, Elizabeth. 2015. Supporting Social and Emotional Development Through Quality Afterschool Programs. Beyond the Bell: Research to Practice in the Afterschool and Expanded Learning Field. Washington, DC: American Institutes for Research.
District of Columbia Public Schools. 2020. “DCPS at a Glance: Enrollment.” Website: https://dcps.dc.gov/page/dcps-glance-enrollment.
Durlak, Joseph A., and Emily P. DuPre. 2008. “Implementation Matters: A Review of Research on the Influence of Implementation on Program Outcomes and the Factors Affecting Implementation.” American Journal of Community Psychology 41, 3-4: 327-350.
Dynarski, Mark, Mary Moore, John Mullens, Philip Gleason, Susanne James-Burdumy, Linda Rosenberg, Carol Pistorino, Tim Silva, John Deke, Wendy Mansfield, Sheila Heaviside, and Daniel Levy. 2003. When Schools Stay Open Late: The National Evaluation of the 21st-Century Community Learning Centers Program. First Year Findings. Princeton, NJ: Mathematica Policy Research.
ExpandED Schools. 2013. “The 6,000-Hour Learning Gap.” Website: https://www.expandedschools.org/policy-documents/6000-hour-learning-gap#sthash.c2cNWc7o.nrWffwfQ.dpbs.
Garcia, Ivonne, Madeline Price, Osvaldo Avila, and Marie-Andrée Somers. 2019. Evaluation of the Jumpstart Foster Grandparent Program. New York: MDRC.
Greenwood, Charles R., Barbara Terry, Cheryl A. Utley, Debra Montagna, and Dale Walker. 1993. “Achievement, Placement, and Services: Middle School Benefits of Classwide Peer Tutoring Used at the Elementary School.” School Psychology Review 22, 3: 497-516.
Grossman, Jean, Margo Campbell, and Becca Raley. 2007. Quality Time After School: What Instructors Can Do to Enhance Learning. Philadelphia: Public/Private Ventures.
Grossman, Jean Baldwin, and Siobhan M. Cooney. 2009. Paving the Way for Success in High School and Beyond: The Importance of Preparing Middle School Students for the Transition to Ninth Grade. Philadelphia: Public/Private Ventures.
Grossman, Jean Baldwin, Marilyn L Price, Veronica Fellerath, Linda Z Jucovy, Lauren J Kotloff, Rebecca Raley, and Karen E. Walker. 2002. Multiple Choices after School: Findings from the Extended-Service Schools Initiative. Philadelphia: Public/Private Ventures; New York: MDRC.
AIMING HIGHER: ASSESSING HIGHER ACHIEVEMENT’S OUT-OF-SCHOOL EXPANSION EFFORTS | 67

Heckman, James J., and Tim Kautz. 2012. “Hard Evidence on Soft Skills.” Labour Economics 19, 4: 451-464.
Herrera, Carla, David L. DuBois, and Jean Baldwin Grossman. 2013. The Role of Risk: Mentoring Experiences and Outcomes for Youth with Varying Risk Profiles. New York: A Public/Private Ventures project distributed by MDRC.
Herrera, Carla, Leigh L. Linden, Amy J.A. Arbreton, and Jean Baldwin Grossman. 2011. Testing the Impact of Higher Achievement’s Year-Round Out-of-School-Time Program on Academic Outcomes. Philadelphia: Public/Private Ventures.
Higher Achievement. 2020. “Our Mission.” Website: https://higherachievement.org/about/mission-history/.
Jacob, Robin Tepper, Thomas J. Smith, Jacklyn A. Willard, and Rachel E. Rifkin. 2014. Reading Partners: The Implementation and Effectiveness of a One-on-One Tutoring Program Delivered by Community Volunteers. New York: MDRC.
Jarjoura, G. Roger, Manolya Tanyu, Janet Forbush, Carla Herrera, and Thomas E. Keller. 2018. Evaluation of the Mentoring Enhancement Demonstration Program: Technical Report. Washington, DC: National Criminal Justice Reference Service, American Institutes for Research.
Kautz, Tim, James J. Heckman, Ron Diris, Bas Ter Weel, and Lex Borghans. 2014. Fostering and Measuring Skills: Improving Cognitive and Non-Cognitive Skills to Promote Lifetime Success. Cambridge, MA: National Bureau of Economic Research.
Larson, Reed W., and Rachel M. Angus. 2011. “Adolescents’ Development of Skills for Agency in Youth Programs: Learning to Think Strategically.” Child Development 82, 1: 277-294.
Metz, Rachel A., Julie Goldsmith, and Amy J.A. Arbreton. 2008. Putting It All Together: Guiding Principles for Quality After-School Programs Serving Preteens. Philadelphia: Public/Private Ventures.
Next Generation Youth Work Coalition. 2010. “The Case for Investing in America’s Youth Workers.” Wellesley, MA: Next Generation Youth Work Coalition, National Institute on Out-of-School Time.
Parra, Gilbert R., David L. DuBois, Helen A. Neville, Aalece O. Pugh-Lilly, and Nan Povinelli. 2002. “Mentoring Relationships for Youth: Investigation of a Process-Oriented Model.” Journal of Community Psychology 30, 4: 367-388.
REFERENCES (CONTINUED)
68 | AIMING HIGHER: ASSESSING HIGHER ACHIEVEMENT’S OUT-OF-SCHOOL EXPANSION EFFORTS

Paulsell, Diane, Patricia Del Grosso, and Lauren Supplee. 2014. “Supporting Replication and Scale-Up of Evidence-Based Home Visiting Programs: Assessing the Implementation Knowledge Base.” American Journal of Public Health 104, 9: 1624-1632.
Puma, Michael J., Robert B. Olsen, Stephen H. Bell, and Cristofer Price. 2009. What to Do When Data Are Missing in Group Randomized Controlled Trials. (NCEE 2009-0049.) Washington, DC: National Center for Education, Evaluation and Regional Assistance, Institute of Education Sciences, U.S. Department of Education.
Racine, David. 2004. Capturing the Essential Elements. Philadelphia: Public/Private Ventures.
Raley, Rebecca, Jean Grossman, and Karen E. Walker. 2005. Getting It Right: Strategies for After-School Success. Philadelphia: Public/Private Ventures.
Rappaport, Shelley, Jean Grossman, Ivonne Garcia, Pei Zhu, Osvaldo Avila, and Kelly Granito. 2017. Group Work Is Not Cooperative Learning: An Evaluation of PowerTeaching in Middle Schools. A Report from the Investing in Innovation (i3) Evaluation. New York: MDRC.
Raudenbush, Stephen W. 2009. “Analyzing Effect Sizes: Random-Effects Models.” Pages 295-316 in Harris Cooper, Larry V. Hedges, and Jeffrey C. Valentine (eds.), The Handbook of Research Synthesis and Meta-Analysis, Second Edition. New York: Russell Sage Foundation.
Reading Partners. 2020. Website: https://readingpartners.org/.
Reyes, Olga, Karen L. Gillock, Kimberly Kobus, and Bernadette Sanchez. 2000. “A Longitudinal Examination of the Transition into Senior High School for Adolescents from Urban, Low-Income Status, and Predominantly Minority Backgrounds.” American Journal of Community Psychology 28, 4: 519-544.
Salusky, Ida, Reed W. Larson, Aisha Griffith, Joanna Wu, Marcela Raffaelli, Niwako Sugimura, and Maria Guzman. 2014. “How Adolescents Develop Responsibility: What Can Be Learned from Youth Programs.” Journal of Research on Adolescence 24, 3: 417-430.
Schanzenbach, Diane Whitmore, Ryan Nunn, Lauren Bauer, Megan Mumford, and Audrey Breitwieser. 2016. Seven Facts on Noncognitive Skills from Education to the Labor Market. Washington, DC: The Hamilton Project, Brookings Institution.
U.S. Office of Management and Budget. 2016. Questions and Answers When Designing Surveys for Information Collections. Washington, DC: U.S. Office of Management and Budget, Office of Information and Regulatory Affairs.
REFERENCES (CONTINUED)
AIMING HIGHER: ASSESSING HIGHER ACHIEVEMENT’S OUT-OF-SCHOOL EXPANSION EFFORTS | 69

What Works Clearinghouse. 2013. Beginning Reading Intervention Report: Reading Recovery. Washington, DC: Institute of Education Sciences, U.S. Department of Education.
What Works Clearinghouse. 2017. Standards Handbook, Version 4.0. Washington, DC: Institute of Education Sciences, U.S. Department of Education.
REFERENCES (CONTINUED)
70 | AIMING HIGHER: ASSESSING HIGHER ACHIEVEMENT’S OUT-OF-SCHOOL EXPANSION EFFORTS

ABOUT MDRCMDRC IS A NONPROFIT, NONPARTISAN SOCIAL AND EDU-CATION POLICY RESEARCH ORGANIZATION DEDICATED TO learning what works to improve the well-being of low-income people. Through its research and the active communication of its findings, MDRC seeks to enhance the effectiveness of social and education policies and programs.
Founded in 1974 and located in New York; Oakland, California; Washington, DC; and Los Angeles, MDRC is best known for mounting rigorous, large-scale, real-world tests of new and ex-isting policies and programs. Its projects are a mix of demon-strations (field tests of promising new program approaches) and evaluations of ongoing government and community initiatives. MDRC’s staff members bring an unusual combination of research and organizational experience to their work, providing expertise on the latest in qualitative and quantitative methods and on pro-gram design, development, implementation, and management. MDRC seeks to learn not just whether a program is effective but also how and why the program’s effects occur. In addition, it tries to place each project’s findings in the broader context of related research — in order to build knowledge about what works across the social and education policy fields. MDRC’s findings, lessons, and best practices are shared with a broad audience in the policy and practitioner community as well as with the general public and the media.
Over the years, MDRC has brought its unique approach to an ever-growing range of policy areas and target populations. Once known primarily for evaluations of state welfare-to-work programs, today MDRC is also studying public school reforms, employment programs for ex-prisoners, and programs to help low-income students succeed in college. MDRC’s projects are organized into five areas:
• Promoting Family Well-Being and Children’s Development
• Improving Public Education
• Raising Academic Achievement and Persistence in College
• Supporting Low-Wage Workers and Communities
• Overcoming Barriers to Employment
Working in almost every state, all of the nation’s largest cities, and Canada and the United Kingdom, MDRC conducts its proj-ects in partnership with national, state, and local governments, public school systems, community organizations, and numerous private philanthropies.