air po caly pse ii · 2018-05-31 · bengal, karnataka, tamil nadu and maharashtra are also...
TRANSCRIPT
POCALYPSE II
AIR
ASSESSMENT OF AIR POLLUTION IN INDIAN CITIES

Airpocalypse II: Assessment of Air Pollution in Indian Cities
Written by
AcknowledgementsNandikesh Sivalingam, Abid Shah, Ruhie Kumar
DesignPenmi Rungsung, Greenpeace
Published by GPET, released in January 2018
For more information, contact:[email protected]
Printed on 100% recycled paper
1. Introduction
2. Methodology
3. Inference and Analysis
3.1 Andhra Pradesh
3.2 Assam
3.3 Himachal Pradesh
3.4 Goa
3.5 Gujarat
3.6 Madhya Pradesh
3.7 Maharashtra
3.8 Odisha
3.9 Rajasthan
3.10 Uttar Pradesh
3.11 Uttarakhand
3.12 West Bengal
3.13 Bihar
3.14 Haryana
3.15 Delhi
3.16 Karnataka
3.17 Telangana
3.18 Tamil Nadu
5. Way Forward
6. Comparison of facts on air pollution across the world7. Appendix-I: PM Levels across India (Annual Average 2016/2015)
4678910111213141516171819202122232425
3.19 Punjab 263.20 Kerala 27
31
4. Air Pollution Monitoring network and exposure
29
32
35
CONTENT
SUMMARY
The report now in your hands brings together and highlights data vis-à-vis air quality for no less than 280 Indian cities spread across the country. Sadly, in many cases this is going from bad to worse, and without much sign of a let up in near future unless the Government and people join hands to fight this fast approaching airpocalypse.
The PM , or particulate matter, data for these cities is available here up to the year 2016 and in some cases until 2015. The data shows 228 (more than 80% of the cities/town where Air Quality Monitoring data was available) cities, have not been complying with the annual permissible concentration of 60µg/m³ which is prescribed by Central Pollution Control Board (CPCB) under the National Ambient Air Quality Standards (NAAQS). And none of the cities have been found to adhere to the standard set by the World Health Organization (WHO) at 20 µg/m³. Thus, all these cities without a single exception are going beyond the permissible limit supposed to be followed internationally to stay within the safe limits for the sake of human health as well as the environment.
Even if we assume that the present number of manual air quality monitoring stations represents the air quality for the entire population in the district, the data in the report covered 280 cities with a population of 630 million, or 53% of the total population, leaving out only 20 districts where air quality was monitored under NAMP, but we could not get access to the data.
Out of the 630 million Indians covered by the data, 550 million live in areas exceeding national standard for PM , and 180 million live in areas where the air pollution levels are more than twice the stipulated standards. This includes 47 million children under 5 years of age, living in areas where the standard is exceeded and 17 million in areas where the air pollution levels are more than twice the stipulated standards. Apart from this, 580 million Indians live in districts with no air quality data available, including 59 million children under 5 years of age.
Thick smog and haze have been hovering across northern India indicating that bad air is not confined to big cities alone. It's not seasonal, toxic air is engulfing our spaces - urban and rural equally, the urgency on deteriorating air quality cannot be stressed enough.
The report like its previous counterpart - released a year ago - shows once again that deadly air quality due to pollution is not a problem confined to Delhi-NCR (National Capital Region) alone. Other metropolises too are hardly any better off, though this fact was also highlighted in the last report on air quality. Thus, it would be safe to say that pollution levels remained high in most cities with some fluctuations, increases or decreases, in the case of a few cities when compared from 2015 levels. In the absence of any measurable target-driven approach on the part of state and central government agencies, it is difficult to say that the improvement in air quality in a few cities is actually due to weather or behavioural changes in local sources of pollution, or due to action initiated under the clean air policy that the government is supposed to enforce.
data for these cities is being made available here upto as late as the year 2016 and in some cases until 2015.
The PM10OR PARTICULATEMATTER
Fire rages on in the fields, covering the sky in a thick blanket of smoke, Panipat, Haryana.
© Saagnik Paul / Greenpeace
2
Harshit Sharma, GreenpeaceLauri Myllyvirta, GreenpeaceSunil Dahiya, Greenpeace

Airpocalypse II: Assessment of Air Pollution in Indian Cities
Written by
AcknowledgementsNandikesh Sivalingam, Abid Shah, Ruhie Kumar
DesignPenmi Rungsung, Greenpeace
Published by GPET, released in January 2018
For more information, contact:[email protected]
Printed on 100% recycled paper
1. Introduction
2. Methodology
3. Inference and Analysis
3.1 Andhra Pradesh
3.2 Assam
3.3 Himachal Pradesh
3.4 Goa
3.5 Gujarat
3.6 Madhya Pradesh
3.7 Maharashtra
3.8 Odisha
3.9 Rajasthan
3.10 Uttar Pradesh
3.11 Uttarakhand
3.12 West Bengal
3.13 Bihar
3.14 Haryana
3.15 Delhi
3.16 Karnataka
3.17 Telangana
3.18 Tamil Nadu
5. Way Forward
6. Comparison of facts on air pollution across the world7. Appendix-I: PM10 Levels across India (Annual Average 2016/2015)
4678910111213141516171819202122232425
3.19 Punjab 263.20 Kerala 27
31
4. Air Pollution Monitoring network and exposure
29
32
35
CONTENT
SUMMARY
The report now in your hands brings together and highlights data vis-à-vis air quality for no less than 280 Indian cities spread across the country. Sadly, in many cases this is going from bad to worse, and without much sign of a let up in near future unless the Government and people join hands to fight this fast approaching airpocalypse.
The PM , or particulate matter, data for these cities is available here up to the year 2016 and in some cases until 2015. The data shows 228 (more than 80% of the cities/town where Air Quality Monitoring data was available) cities, have not been complying with the annual permissible concentration of 60µg/m³ which is prescribed by Central Pollution Control Board (CPCB) under the National Ambient Air Quality Standards (NAAQS). And none of the cities have been found to adhere to the standard set by the World Health Organization (WHO) at 20 µg/m³. Thus, all these cities without a single exception are going beyond the permissible limit supposed to be followed internationally to stay within the safe limits for the sake of human health as well as the environment.
Even if we assume that the present number of manual air quality monitoring stations represents the air quality for the entire population in the district, the data in the report covered 280 cities with a population of 630 million, or 53% of the total population, leaving out only 20 districts where air quality was monitored under NAMP, but we could not get access to the data.
Out of the 630 million Indians covered by the data, 550 million live in areas exceeding national standard for PM , and 180 million live in areas where the air pollution levels are more than twice the stipulated standards. This includes 47 million children under 5 years of age, living in areas where the standard is exceeded and 17 million in areas where the air pollution levels are more than twice the stipulated standards. Apart from this, 580 million Indians live in districts with no air quality data available, including 59 million children under 5 years of age.
Thick smog and haze have been hovering across northern India indicating that bad air is not confined to big cities alone. It's not seasonal, toxic air is engulfing our spaces - urban and rural equally, the urgency on deteriorating air quality cannot be stressed enough.
The report like its previous counterpart - released a year ago - shows once again that deadly air quality due to pollution is not a problem confined to Delhi-NCR (National Capital Region) alone. Other metropolises too are hardly any better off, though this fact was also highlighted in the last report on air quality. Thus, it would be safe to say that pollution levels remained high in most cities with some fluctuations, increases or decreases, in the case of a few cities when compared from 2015 levels. In the absence of any measurable target-driven approach on the part of state and central government agencies, it is difficult to say that the improvement in air quality in a few cities is actually due to weather or behavioural changes in local sources of pollution, or due to action initiated under the clean air policy that the government is supposed to enforce.
data for these cities is being made available here upto as late as the year 2016 and in some cases until 2015.
The PM10OR PARTICULATEMATTER
Fire rages on in the fields, covering the sky in a thick blanket of smoke, Panipat, Haryana.
© Saagnik Paul / Greenpeace
2
Harshit Sharma, GreenpeaceLauri Myllyvirta, GreenpeaceSunil Dahiya, Greenpeace

A year ago, in January 2017 to be precise, Greenpeace India released the report Airpocalypse: Assessment of Air Pollution in Indian Cities. The main purpose of this report was to show that air pollution is a growing national problem and it needs to be addressed with equal and utmost seriousness at a countrywide level and not only in Delhi or the National Capital Region as mostly has so far been the case. The report also tried to identify major sources of pollution in different parts of the country based on past research and available data. While trying to show a way forward for the nation through applicability of our long-term goals to solve the air pollution crisis at the all-India level, an emphasis on the short-term solutions based on the extent, degree and levels of pollution afflicting specific regions in acute form were provided in the report.
This year the second version of the “Airpocalypse” report has updated data for the year 2016 for approximately 158 cities. And wherever data was not available for 2016, older data from 2015 is used for the purpose of assessing where our cities stand in terms of air quality.
Severe air pollution has been disrupting everyday life in India. This is more so in big cities during the winter though smaller cities and the villages forming the periphery of many cities can hardly be said to be any better off. In 2015 air pollution (PM2.5) levels in India increased so rapidly that they overtook those in China. This was one of the highlights of our report last year and this continues to be so this year. Pollution levels are increasing across the country and it is more worrying in north India where its impact on health is feared to be rampant. Notwithstanding the alarming air pollution levels across the country the emphasis so far has more been on the Delhi-NCR region. This is despite the acceptance of the fact that the major part of Delhi’s pollution is coming from outside its borders, meaning neighbouring states cannot said to be in the safe zone. So much so that pollution levels in other states like Uttar Pradesh, Bihar, West Bengal, Karnataka, Tamil Nadu and Maharashtra are also increasing quite a bit.
The recent submission by the Honorable Minister for Environment, Forest and Climate Change, Dr Harshvardhan, in the Rajya Sabha that the MOEF&CC has prepared a National Clean Air Programme, strengthens the argument and the fact that air pollution is posing a national health emergency today. However, the country is yet to come to terms with the fact that air pollution is a national problem. Our actions outside Delhi-NCR still seem to be to city boundary specific and missing the regional nature and proportions of pollution. Such a selective approach cannot be effective in tackling the health emergency that rampant air pollution has come to pose. We as a country today have to understand air pollution comprehensively and have to win the fight against it.
Delhi still remains the top-most polluted city followed by many more towns like nearby Faridabad and Bhiwadi and far off Dehradun, Varanasi, and Patna. These towns are strewn along the fertile and heavily populated Indo-Gangetic basin. Together these critically polluted cities point to not just the need for long-term action plans but also cry for a strict emergency response in an immediate, short-term and time-bound manner to bring pollution levels down drastically and ward off an impending health and economic emergency. Though a graded response action plan (GRAP) for Delhi-NCR region has been notified, the implementation of it remains disappointingly poor. The long-term action plan for Delhi-NCR is still being discussed, leaving the rest of the country virtually in the cold. This is despite the fact that the CPCB has sent notices to many states to come up with action plans to bring pollution levels down. As we will see in the following pages of this report, most pollution control boards lack the capacity and understanding of how to even draft meaningful policies to curb air pollution.
Unlike in the North many cities in the southern part of the country may not need emergency response plans but most of them do need long term action plans to bring pollution levels down below NAAQS limits and aim to meet WHO standards for air quality.
What is palpably clear is that none of the cities/states have measurable targets aimed at reducing pollution levels. Most actions suggested untill now are just initiatives on paper that have no monitoring mechanism to achieve their estimated benefit through the implementation of targeted policies. The good news is that the central government has formulated a National Clean Air Programme (NCAP). This is supposed to seek and ensure source-wise solutions in a time-bound manner for the entire country. Though the government has almost doubled the number of real-time monitoring stations spread across the country it has a long way to go to ensure clean and safe air to ward off the hazards faced by the country and its people.
An action plan should have the following components:
These strategies should be formalised into a time-bound action plan with clearly defined targets and penalties to ensure accountability. While some actions might need to be city or region-specific, these are going to be under a broad range of actions that will be universally applicable.
Public participation is critical in reducing air pollution along with centralised actions and policies rolled out by the Government at national and regional levels.
1. Institute robust monitoring of air quality across the country and make the data publicly available in real time. This should be coupled with a health advisory and ‘red alerts’ for bad-air days so that the public is able to take steps to protect their health and the environment. Measures like shutting down schools, reduction of traffic, shutting down power plants and industries etc should automatically come into force as soon as air quality deteriorates beyond a level and takes alarming proportions.
2. Use the data as a basis tofine-tune pollution reduction strategies that must, inter alia seek to improve public transport and reduce petrol/diesel vehicle use, strengthen enforcement to take polluting vehicles off the roads, introduce higher fuel standards (Bharat VI), enforce stricter emission regulations and improved efficiency for thermal power plants and industries, move from diesel generators to rooftop solar power backup, increase use of clean, renewable energy, offer incentives for electric vehicles, dust removal from roads, regulate construction activities and stop burning of biomass and waste.
INTRODUCTION
The current edition of the report has annual PM levels for 280 cities and towns across the country as compared to the 168 cities in the earlier version.
The need is to act as a country and reach across cities and regional
pollution and its sources.
4

6
The Central Pollution Control Board has instituted the National Air Quality Monitoring Programme (NAMP). Under the NAMP, three air pollutants viz., Sulphur Dioxide (SO2), Nitrogen Dioxide (NO ) and Particulate Matter size equal to or less than 10 micron (PM ), have been identified for regular monitoring at all the locations. The NAMP network presently comprises 683 operating monitoring stations located in 300 cities/towns in 29 states and 6 union territories across the country.
Greenpeace India tried to collect data on PM levels for these NAMP stations spread across the country (because the data for PM2.5 was limited to very few cities and places which would not have been enough to see the extent of the spread of pollution levels across much of the country) through various sources such as Right to Information (RTI) applications filed with the SPCB (State Pollution Control Boards) to gather data, SPCBs’ websites and annual reports of SPCBs and from ENVIS Centre on Control of Pollution Water, Air and Noise etc.
There are lots of challenges with respect to relying on government data on air quality due to various factors. The primary one being the majority of the measurements are taken manually making the data quality very subjective. The other factors are the location of monitoring stations and data collection from them in the case of far flung and remote areas. These often become dysfunctional for long periods of time making the average values somewhat skewed. Industrial clusters like Korba in Chhattisgah and Cuddalore in Tamil Nadu show PM10 levels below NAAQS possibly because of such factors.
The data is definitely useful to prove that air quality is poor across the country in almost all states by the government’s own readings and to prove the need to expand real time air quality monitoring to standardise the reading across the country.
The extent of air pollution in India is turning into a public health and economic crisis. There are increasing numbers of people who die a premature death every year due to increasing levels of pollution. Deaths due to air pollution are only a fraction less than the number of deaths caused by tobacco usage. The Global Burden of Disease (GBD), a comprehensive regional and global research programme with 500 researchers representing over 300 institutions and 50 countries, has estimated that 3,283 Indians died every single day due to outdoor air pollution in India in 2015. This brings the number of deaths due to air pollution in the country in 2015 to 11.98 lakh. On the economic front, loss of productivity and the forced closures of schools and industries have already started impacting the economy. The World Bank estimates that India loses around 3% of its GDP due to air pollution. This makes air pollution one of the biggest issues to fight if we are to protect peoples’ lives, ensure public health and save the economy.
Air pollution is a complex issue, requiring an array of solutions. There are many sources that contribute to pollution across the country. Depending on region and climatic conditions, the contribution of different sources of pollution add up to the overall scourge of pollution. This stretches over vast parts of the country though it is quite clear that irrespective of where you live, burning of fossil fuels (coal and oil) contributes majorly to air pollution levels across regions.
METHODOLOGY
The NAMPnetwork
PRESENTLY COMPRISES 683 OPERATING MONITORING STATIONS LOCATED IN 300 CITIES/TOWNS IN 29 STATES AND 6 UNION TERRITORIES ACROSS THE COUNTRY.
Brick kilns, also a major source of pollution. Western Uttar Pradesh.
© Saagnik Paul / Greenpeace
The Rashtrapathi Bhavan behind a blanket of haze and smog at Rajpath, New Delhi.
© Subrata Biswas/ Greenpeace
ANDHRA PRADESH
INFERENCE AND ANALYSIS
Action Plan to reduce Air Pollution Levels:
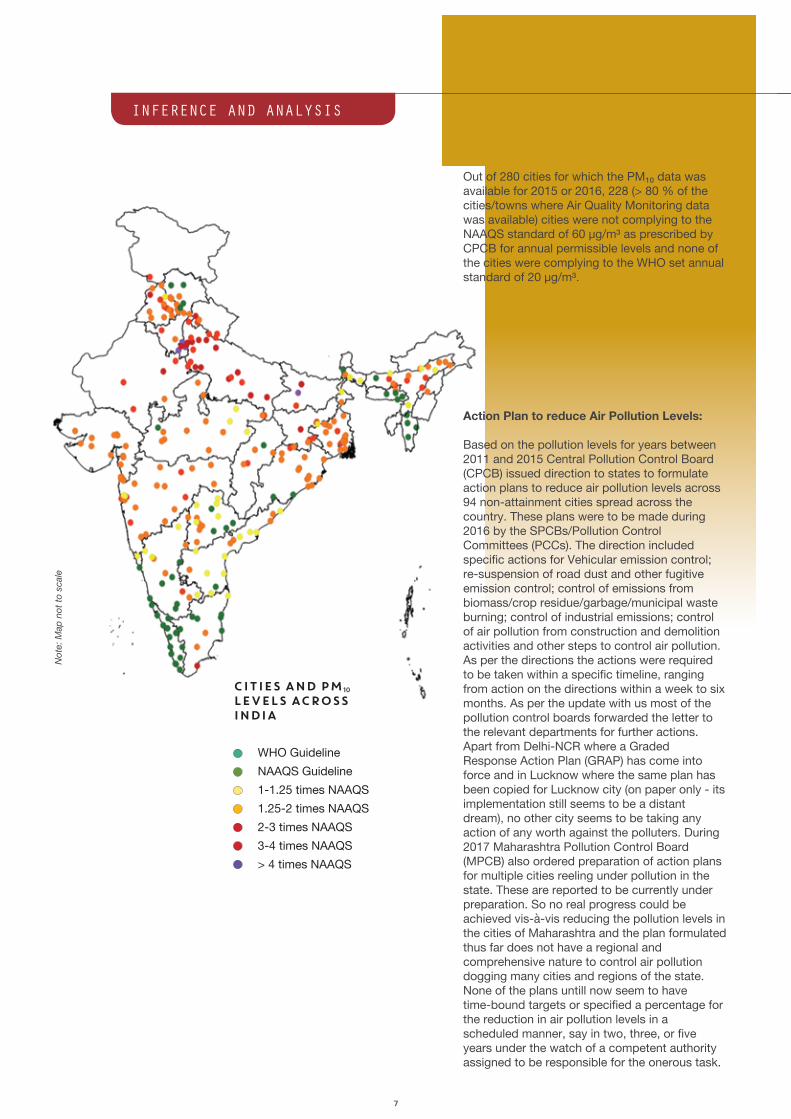
Based on the pollution levels for years between 2011 and 2015 Central Pollution Control Board (CPCB) issued direction to states to formulate action plans to reduce air pollution levels across 94 non-attainment cities spread across the country. These plans were to be made during 2016 by the SPCBs/Pollution Control Committees (PCCs). The direction included specific actions for Vehicular emission control; re-suspension of road dust and other fugitive emission control; control of emissions from biomass/crop residue/garbage/municipal waste burning; control of industrial emissions; control of air pollution from construction and demolition activities and other steps to control air pollution. As per the directions the actions were required to be taken within a specific timeline, ranging from action on the directions within a week to six months. As per the update with us most of the pollution control boards forwarded the letter to the relevant departments for further actions. Apart from Delhi-NCR where a Graded Response Action Plan (GRAP) has come into force and in Lucknow where the same plan has been copied for Lucknow city (on paper only - its implementation still seems to be a distant dream), no other city seems to be taking any action of any worth against the polluters. During 2017 Maharashtra Pollution Control Board (MPCB) also ordered preparation of action plans for multiple cities reeling under pollution in the state. These are reported to be currently under preparation. So no real progress could be achieved vis-à-vis reducing the pollution levels in the cities of Maharashtra and the plan formulated thus far does not have a regional and comprehensive nature to control air pollution dogging many cities and regions of the state. None of the plans untill now seem to have time-bound targets or specified a percentage for the reduction in air pollution levels in a scheduled manner, say in two, three, or five years under the watch of a competent authority assigned to be responsible for the onerous task.
Monthly average PM data for the year 2016 was obtained from 25 ambient air quality-monitoring stations installed across 15 cities and towns in Andhra Pradesh.
The data indicates that all the 15 cities had higher concentrations of PM ³) and all of them had at least three times more polluted air compared to the WHO annual standard for PM . The pollution level seems to be consistent between 2015 and 2016 with small increases for Visakhapatnam and Vizinagaram along with a slight decrease for Guntur, Kurnool, Vijayawada and Eluru but the decrease is insignificant compared to what is required to bring pollution levels down to breathable air quality as per the Indian standards levels, leaving aside the WHO standards.
Three cities i.e. Anantapur, Vijaywada and Vizianagram recorded PM levels above the daily standard of 100 µg/m3 for about three months consecutively. Monthly patterns also show variation in months with peak pollution levels in different cities. Vizianagram had peak PM levels between July and October, while Anantpur and Vijayawada had peak levels between April and November. Similarly PM levels were consistently ranging between 70 µg/m3 to 90 µg/m3 throughout the year for Guntur and Visakhapatnam.
Vizianagaram recorded the highest PM levels for a given month in the state with values breaching the 130 µg/m3 level in October 2016, while Vijayawada had the highest annual average for PM where annual PM levels were about 1.7 times the NAAQS prescribed annual standard and 5 times the WHO annual Standard. Annual PM average for 2016 for Vijayawada, Guntur, Vizianagaram, Anantapur, and Visakhapatnam were 101, 88, 86, 85 and 77 respectively.
Except Kurnool and
Tirupati (BETWEEN JUNE
TO SEPTEMBER) ALL OTHER
CITIES RECORDED PM10
LEVELS ABOVE 60 ³ (ANNUAL NAAQS
STANDARD FOR PM10) FOR
ALMOST EVERY month
meaning consistent
high levels of air
pollution around the
year.
PM10 levels across Andhra Pradesh during 2015 & 2016
PM
10 (M
G/M
3)
40
60
80
120
100
20
0
40
60
80
120
100
20
0
ANANTAPU
R
CHITTO
OR
ELURU
GUNTUR
KADAPA
KAKINADA
KURNOOL
NELLO
RE
ONGO
LE
RAJAHM
UNDRY
SRIK
AKULAM
TIRUPA
TI
VIJAYAW
ADA
VISAKAPA
TNAM
VIZIA
GANAGARAM
2015 AVERAGE 2016 AVERAGE NAAQS WHO
CITIES
MONTH
Out of 280 cities for which the PM data was available for 2015 or 2016, 228 (> 80 % of the cities/towns where Air Quality Monitoring data was available) cities were not complying to the NAAQS standard of 60 µg/m³ as prescribed by CPCB for annual permissible levels and none of the cities were complying to the WHO set annual standard of 20 µg/m³.
87
Not
e: M
ap n
ot to
sca
le
CITIES AND PM10
LEVELS ACROSS INDIA
WHO GuidelineNAAQS Guideline1-1.25 times NAAQS1.25-2 times NAAQS2-3 times NAAQS 3-4 times NAAQS> 4 times NAAQS
Monthly Average PM10 levels across Andhra Pradesh during 2016
JAN MAY SEPMAR JUL NOVFEB JUN OCTAPR AUG DEC
PM
10 (
µG/M
3)
ANANTPURAM CHITOOR ELURU GUNTUR KADAPA KAKINADA
KURNOOL NELLORE ONGOLE RAJAHMUNDRY SRIKAKULAM TIRUPATI
VIJAYAWADA VISAKAPATNAM VIZIAGANAGARAM NAAQS WHO
ANDHRAPRADESH

ANDHRA PRADESH
INFERENCE AND ANALYSIS
Action Plan to reduce Air Pollution Levels:
Based on the pollution levels for years between 2011 and 2015 Central Pollution Control Board (CPCB) issued direction to states to formulate action plans to reduce air pollution levels across 94 non-attainment cities spread across the country. These plans were to be made during 2016 by the SPCBs/Pollution Control Committees (PCCs). The direction included specific actions for Vehicular emission control; re-suspension of road dust and other fugitive emission control; control of emissions from biomass/crop residue/garbage/municipal waste burning; control of industrial emissions; control of air pollution from construction and demolition activities and other steps to control air pollution. As per the directions the actions were required to be taken within a specific timeline, ranging from action on the directions within a week to six months. As per the update with us most of the pollution control boards forwarded the letter to the relevant departments for further actions. Apart from Delhi-NCR where a Graded Response Action Plan (GRAP) has come into force and in Lucknow where the same plan has been copied for Lucknow city (on paper only - its implementation still seems to be a distant dream), no other city seems to be taking any action of any worth against the polluters. During 2017 Maharashtra Pollution Control Board (MPCB) also ordered preparation of action plans for multiple cities reeling under pollution in the state. These are reported to be currently under preparation. So no real progress could be achieved vis-à-vis reducing the pollution levels in the cities of Maharashtra and the plan formulated thus far does not have a regional and comprehensive nature to control air pollution dogging many cities and regions of the state. None of the plans untill now seem to have time-bound targets or specified a percentage for the reduction in air pollution levels in a scheduled manner, say in two, three, or five years under the watch of a competent authority assigned to be responsible for the onerous task.
Monthly average PM data for the year 2016 was obtained from 25 ambient air quality-monitoring stations installed across 15 cities and towns in Andhra Pradesh.
The data indicates that all the 15 cities had higher concentrations of PM ³) and all of them had at least three times more polluted air compared to the WHO annual standard for PM . The pollution level seems to be consistent between 2015 and 2016 with small increases for Visakhapatnam and Vizinagaram along with a slight decrease for Guntur, Kurnool, Vijayawada and Eluru but the decrease is insignificant compared to what is required to bring pollution levels down to breathable air quality as per the Indian standards levels, leaving aside the WHO standards.
Three cities i.e. Anantapur, Vijaywada and Vizianagram recorded PM levels above the daily standard of 100 µg/m3 for about three months consecutively. Monthly patterns also show variation in months with peak pollution levels in different cities. Vizianagram had peak PM levels between July and October, while Anantpur and Vijayawada had peak levels between April and November. Similarly PM levels were consistently ranging between 70 µg/m3 to 90 µg/m3 throughout the year for Guntur and Visakhapatnam.
Vizianagaram recorded the highest PM levels for a given month in the state with values breaching the 130 µg/m3 level in October 2016, while Vijayawada had the highest annual average for PM where annual PM levels were about 1.7 times the NAAQS prescribed annual standard and 5 times the WHO annual Standard. Annual PM average for 2016 for Vijayawada, Guntur, Vizianagaram, Anantapur, and Visakhapatnam were 101, 88, 86, 85 and 77 respectively.
Except Kurnool and
Tirupati (BETWEEN JUNE
TO SEPTEMBER) ALL OTHER
CITIES RECORDED PM10
LEVELS ABOVE 60 ³ (ANNUAL NAAQS
STANDARD FOR PM10) FOR
ALMOST EVERY month
meaning consistent
high levels of air
pollution around the
year.
PM10 levels across Andhra Pradesh during 2015 & 2016
40
60
80
120
100
20
0
40
60
80
120
100
20
0
ANANTAPU
R
CHITTO
OR
ELURU
GUNTUR
KADAPA
KAKINADA
KURNOOL
NELLO
RE
ONGO
LE
RAJAHM
UNDRY
SRIK
AKULAM
TIRUPA
TI
VIJAYAW
ADA
VISAKAPA
TNAM
VIZIA
GANAGARAM
2015 AVERAGE 2016 AVERAGE NAAQS WHO
CITIES
MONTH
Out of 280 cities for which the PM data was available for 2015 or 2016, 228 (> 80 % of the cities/towns where Air Quality Monitoring data was available) cities were not complying to the NAAQS standard of 60 µg/m³ as prescribed by CPCB for annual permissible levels and none of the cities were complying to the WHO set annual standard of 20 µg/m³.
87
Not
e: M
ap n
ot to
sca
le
CITIES AND PM10
LEVELS ACROSS INDIA
WHO GuidelineNAAQS Guideline1-1.25 times NAAQS1.25-2 times NAAQS2-3 times NAAQS 3-4 times NAAQS> 4 times NAAQS
Monthly Average PM10 levels across Andhra Pradesh during 2016
JAN MAY SEPMAR JUL NOVFEB JUN OCTAPR AUG DEC
ANANTPURAM CHITOOR ELURU GUNTUR KADAPA KAKINADA
KURNOOL NELLORE ONGOLE RAJAHMUNDRY SRIKAKULAM TIRUPATI
VIJAYAWADA VISAKAPATNAM VIZIAGANAGARAM NAAQS WHO
ANDHRAPRADESH

HIMACHAL PRADESH
ASSA
M
Monthly average PM data for the year 2015 was available for 11 cities and towns of Himachal Pradesh. The data indicates that 7 cities out of 11 had higher concentrations of PM than the annual
³).
Monthly average PM data for the year 2016 was obtained from 5 ambient air quality-monitoring stations installed across Guwahati
across Assam.
The data indicates that 12 cities except Bongaigaon had higher concentrations of PM than the annual average levels prescribed
³) and all of them had at-least three times more polluted air as compared to the WHO annual standard for PM . The pollution level seems to be on the higher side between 2015 and 2016 for Guwahati where data for 2015 and 2016 was available.
Kala Amb recorded
the highest annual
average PM10 levels in
the state with values
breaching 118 ³ in
2015 while Paonta
Sahib, Damtal, Baddi
and Sunder Nagar
followed with PM10
levels at 116, 104, 88
and 82 respectively.
PM10 levels across HIMACHAL Pradesh during 2015 & 2016
2015 AVERAGE 2016 AVERAGE NAAQS WHO
Nagaon recorded
THE highest annual
average PM10 levels
in the state with
values breaching
142 ³ in 2015
while Golaghat,
Nalbari, Tinsukia,
Margherita and
Dibrugarh
following with
annual average PM10
levels at 124, 121,
119, 114 and 110
respectively.
PM10 levels across ASSAM during 2015 & 2016
40
60
80
120
100
160
140
20
0
BONGAIG
AON
DARANGA
DIBRUGARH
GOLA
GHAT
GUWAHATI
LAKHIM
PUR
MARGHER
ITA
NAGAON
SILC
HER
NALBARI
SIVASA
GAR
TEZP
UR
TINSU
KIA
2015 AVERAGE 2016 AVERAGE NAAQS WHO
CITIES
40
60
80
120
100
140
20
0
BADDI
DAMTA
L
DHARAMSH
ALA
KALA A
MB
MANALI
NALAGARH
PAONTA
SAHIB
PARW
ANOO
SHIM
LA
SUNDAR N
AGARUNA
CITIES
109
ASSAM HIMACHALPRADESH

GUJARAT
GOA
Monthly PM data for 14 cities and towns in Gujarat, for the period of December 2015 to November 2016, was obtained from 61 manual monitoring stations run by state pollution control board under various programmes.
Assessment of air pollution levels from this data indicates higher PM levels than the 60 µg/m3 annual standard, prescribed under NAAQS, for all 14 cities and towns while nine of these fourteen had annual average PM levels higher than the daily standard of 100µg/m3, staying above the prescribed limit particularly between the months of August and February.
A general observation of the data spread across 61 locations in 14 cities and towns indicates a lower spatial variation with average PM values for the 12-month period ranging between 90 µg/m3 to 110 µg/m3.
Ahmedabad had the highest PM levels, both annual and peak levels, with annual average at 107 µg/m3 and peak levels reaching 127 µg/m3 during October 2016. PM10 levels for some major cities such as Ahmedabad, Vadodara, Bharuch, Bhavnagar, Bhuj, Jamnagar, Rajkot, Surat and Vapi are 107, 102, 100, 91, 103, 93, 92, 93 and 102 µg/m3 respectively.
The data from 14 manual monitoring stations installed across Goa shows that 10 out of 14 stations were breaching the annual average PM ³) prescribed by CPCB. The annual average PM for Goa between May 2016 to April 2017 was more than three times the annual standard prescribed by the WHO and it showed increasing pollution levels compared to 2015 annual average.
Honda and Usgao with their respective average monthly PM levels measured during the month of April 2017 as 205 and 136 registered the highest amongst other stations during this period.
The Pollution level
seems to be on an
increasing trend
between 2015 and
2016 with all cities
recording higher
pollution levels in
2016 compared to
2015.
PM10 levels across Gujarat during 2015 & 2016
2015 AVERAGE 2016 AVERAGE NAAQS WHO
Six stations
installed at Amona,
Bicholin, Codli,
Honda, Ponda and
Usgao had average
PM10 levels above
100 ³ for a
continuous stretch
of three to four
months in 2016-17.
PM10 levels across Goa during 2015 & 2016-17 (May 2016-April 2017)
20
30
40
60
50
70
10
0
GOA
2015 AVERAGE 2016 AVERAGE
CITY
40
60
80
120
100
20
0
AHMED
ABAD
ANKLESH
WAR
BHARUCH
BHUJ
JAM
NAGAR
MORBI
RAJKOT
SANAND
SARIG
AM
SURAT
VADODARA
VAPI
VATVA/A
HMED
ABAD
BHAVNAGAR
CITIES
1211
100
150
200
250
50
0
MONTH
Monthly Average PM10 levels across Goa between May 2016 to April 2017
May16 JUN JUL AUG SEP OCT NOV DEC JAN FEB MAR APR
AMONA ASSANORA BICHOLIM CODLI CURCHOREM HONDA
KUNDAIM MARAGAO PONDA QUEPEM-TILAMOL SANGUEM USGAO
CUNCOLIM TUEM NAAQS WHO
40
60
80
120
100
20
0
140
MONTH
Monthly Average PM10 levels across Gujarat for 2016
DEC15 MAY SEPMARFEB JUL NOVJAN16 JUN OCTAPR AUG
AHMEDABAD ANKLESHWAR BARODA BHARUCH BHAVNAGAR BHUJ
JAMNAGAR MORBI RAJKOT SANAND SARIGAM SURAT
VAPI VATVA NAAQS WHO
GOA
GUJARAT

GUJARAT
GOA
Monthly PM data for 14 cities and towns in Gujarat, for the period of December 2015 to November 2016, was obtained from 61 manual monitoring stations run by state pollution control board under various programmes.
Assessment of air pollution levels from this data indicates higher PM levels than the 60 µg/m3 annual standard, prescribed under NAAQS, for all 14 cities and towns while nine of these fourteen had annual average PM levels higher than the daily standard of 100µg/m3, staying above the prescribed limit particularly between the months of August and February.
A general observation of the data spread across 61 locations in 14 cities and towns indicates a lower spatial variation with average PM values for the 12-month period ranging between 90 µg/m3 to 110 µg/m3.
Ahmedabad had the highest PM levels, both annual and peak levels, with annual average at 107 µg/m3 and peak levels reaching 127 µg/m3 during October 2016. PM10 levels for some major cities such as Ahmedabad, Vadodara, Bharuch, Bhavnagar, Bhuj, Jamnagar, Rajkot, Surat and Vapi are 107, 102, 100, 91, 103, 93, 92, 93 and 102 µg/m3 respectively.
The data from 14 manual monitoring stations installed across Goa shows that 10 out of 14 stations were breaching the annual average PM ³) prescribed by CPCB. The annual average PM for Goa between May 2016 to April 2017 was more than three times the annual standard prescribed by the WHO and it showed increasing pollution levels compared to 2015 annual average.
Honda and Usgao with their respective average monthly PM levels measured during the month of April 2017 as 205 and 136 registered the highest amongst other stations during this period.
The Pollution level
seems to be on an
increasing trend
between 2015 and
2016 with all cities
recording higher
pollution levels in
2016 compared to
2015.
PM10 levels across Gujarat during 2015 & 2016
2015 AVERAGE 2016 AVERAGE NAAQS WHO
Six stations
installed at Amona,
Bicholin, Codli,
Honda, Ponda and
Usgao had average
PM10 levels above
100 ³ for a
continuous stretch
of three to four
months in 2016-17.
PM10 levels across Goa during 2015 & 2016-17 (May 2016-April 2017)
20
30
40
60
50
70
10
0
GOA
2015 AVERAGE 2016 AVERAGE
CITY
40
60
80
120
100
20
0
AHMED
ABAD
ANKLESH
WAR
BHARUCH
BHUJ
JAM
NAGAR
MORBI
RAJKOT
SANAND
SARIG
AM
SURAT
VADODARA
VAPI
VATVA/A
HMED
ABAD
BHAVNAGAR
CITIES
1211
100
150
200
250
50
0
MONTH
Monthly Average PM10 levels across Goa between May 2016 to April 2017
May16 JUN JUL AUG SEP OCT NOV DEC JAN FEB MAR APR
AMONA ASSANORA BICHOLIM CODLI CURCHOREM HONDA
KUNDAIM MARAGAO PONDA QUEPEM-TILAMOL SANGUEM USGAO
CUNCOLIM TUEM NAAQS WHO
40
60
80
120
100
20
0
140
MONTH
Monthly Average PM10 levels across Gujarat for 2016
DEC15 MAY SEPMARFEB JUL NOVJAN16 JUN OCTAPR AUG
AHMEDABAD ANKLESHWAR BARODA BHARUCH BHAVNAGAR BHUJ
JAMNAGAR MORBI RAJKOT SANAND SARIGAM SURAT
VAPI VATVA NAAQS WHO
GOA
GUJARAT

Maharashtra
Madh
ya P
rade
sh
Month-wise PM data for 2016, provided by the state pollution control board, was taken from 65 manual as well as continuous monitoring stations covering 24 cities and towns in Maharashtra. Most of the cities that recorded PM levels above daily limits showed higher trends between the months of January and May and again rising during October to December indicating a seasonal variation with a dip in pollution levels during monsoon season and again reaching peak levels during October to December for many cities.
Nanded had the highest annual average PM levels for the year with 151 µg/m3 while Mumbai recorded the highest monthly average in Maharashtra with PM values remaining more than three times above the annual limit during December 2016.
Annual PM levels for some of the major cities of Maharashtra such as Mumbai, Thane, Pune, Nashik, Nagpur, Navi Mumbai, Panvel are 130, 117, 99, 86, 82, 93, 118 respectively.
The Pollution level seems to be consistent between 2015 and 2016 with small increases for Badlapur, Chandrapur, Dombivali, Mumbai and Ullasnagar along with a slight decrease for Akola, Amravati, Nanded and Kolhapur etc. Yet, the decrease is insignificant compared to what is required to bring pollution levels down to breathable air quality according to Indian standards levels, let alone the WHO standards.
PM data for 2016/2015 was obtained from 37 manual monitoring stations of regional pollution control boards covering 13 cities and towns of Madhya Pradesh, of which monthly values were available for nine cities and the annual average was made available for the rest. Assessment of data obtained from these stations shows annual PM levels to be above the annual average limit of 60 µg/m3, prescribed under NAAQS, for all the thirteen cities, of which two cities had an average annual PM level above the daily limit of 100µg/m3. Bhopal, Indore, Gwalior and Pithampur (Dhar District) had PM levels above the daily limit, prescribed under NAAQS, consecutively from January to May during 2016.
Assessment of data
from these stations
shows annual PM10
levels were above
the annual average
limit of 60 ³, prescribed under
NAAQS, for all the 24
cities while 14 cities
had annual average
PM10 levels above
the daily limit of 100
³.
PM10 levels across Maharashtra during 2015 & 2016
2015 AVERAGE 2016 AVERAGE NAAQS WHO
2015 AVERAGE 2016 AVERAGE NAAQS WHO
The pollution level
seems to be
consistent between
2015 and 2016 with a
slight decrease for
Chindwara,
Gawalior, Indore,
Pithampur,
Singrauli etc. but
the decrease is
insignificant
compared to what is
required to bring
pollution levels
down to breathable
air quality
according to Indian
standards levels let
alone the WHO
standards.
PM10 levels across Madhya Pradesh during 2015 & 2016
406080
120100
200
140
180160
AK
OLA
AM
RA
VA
TI
AU
RA
NG
AB
AD
BA
DLA
PU
R
CH
AN
DR
AP
UR
DO
MB
IVLI
JALG
AO
N
JALN
A
KO
LH
AP
UR
LA
TU
R
LO
TE
MU
MB
AI
NA
GP
UR
NA
ND
ED
NA
SH
IK
NA
VI M
UM
BA
I
PU
NE
SA
NG
LI
SO
LA
PU
R
TH
AN
E
ULH
ASN
AG
AR
AM
BER
NA
TH
PA
NV
EL
TA
LO
JA
KA
LY
AN
BH
IWA
ND
I
CITIES
40
60
80
120
100
20
0
140
180
160
AMLA
I/SH
AHDOL
DEWAS
BHOPA
L
CHHINDW
ARA
GWALI
OR
INDO
RE
JABA
LPUR
NAGDA
PITH
AMPU
R
SAGAR
SATN
A
SINGRAULI
UJJAIN
KATNI
CITIES
1413
100
150
200
250
50
0
MONTH
Monthly Average PM10 levels across Maharashtra for 2016
AKOLA AMBERNATH AMRAVATI AURANGABAD BADLAPUR BHIWANDI
CHANDRAPUR DOMBIVLI JALGAON JALNA KALYAN KOLHAPUR
MUMBAI NAGPUR NANDED NASHIK NAVI MUMBAILATURPUNE SANGLI TALOJA THANE ULHASNAGARPANVEL
NAAQS WHO
JAN16 MAY SEPMAR JUL NOVFEB JUN OCTAPR AUG DEC
MADHYA PRADESH
MAHARASHTRA
RAJASTHAN
ODIS
HA
Data on monthly air pollution trends regarding PM levels during 2016 for Rajasthan was obtained from 30 manual monitoring station covering 7 cities that are operated by the state pollution control board under National Air Monitoring Programme.
An assessment of data obtained from these stations shows the annual PM levels were not only above the annual average standard of 60 µg/m3 but also remained above the daily standard of 100 µg/m3, prescribed under NAAQS, for all of the cities in Rajasthan for which the data was available. These values were between two to four times above the prescribed annual standard, numbers varying from city to city. Except for Kota where we observed a dip in PM levels below the prescribed annual standard during July to September, the values remained above the standard throughout the year for the rest of the six cities. Although observation of the monthly trends also indicates a general dip in PM throughout the state during July to September while it remains high in other seasons reaching peak levels during the winter and the months around the cold season.
Bhiwadi recorded the highest PM levels both in terms of annual average and peak value with an annual average PM value of 249 µg/m3 and a peak value recorded at 376 µg/m3 for the year 2016.
The Pollution level seems to be consistent between 2015 and 2016 with little variations on upside for Jaipur and Jodhpur along with slight decrease for Alwar, Kota and Udaipur but the decrease being really insignificant to bring pollution levels down to breathable air quality according to Indian standards levels, leave aside the WHO standards.
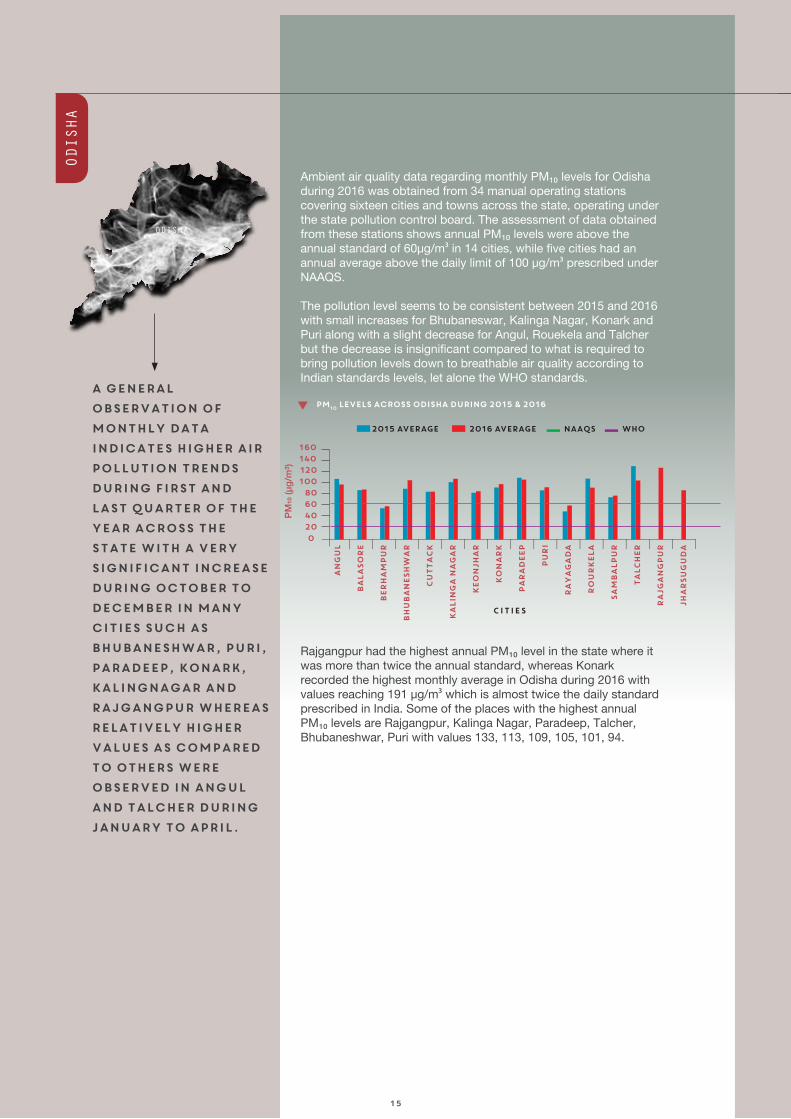
Ambient air quality data regarding monthly PM levels for Odisha during 2016 was obtained from 34 manual operating stations covering sixteen cities and towns across the state, operating under the state pollution control board. The assessment of data obtained from these stations shows annual PM levels were above the annual standard of 60µg/m3 in 14 cities, while five cities had an annual average above the daily limit of 100 µg/m3 prescribed under NAAQS.
The pollution level seems to be consistent between 2015 and 2016 with small increases for Bhubaneswar, Kalinga Nagar, Konark and Puri along with a slight decrease for Angul, Rouekela and Talcher but the decrease is insignificant compared to what is required to bring pollution levels down to breathable air quality according to Indian standards levels, let alone the WHO standards.
Rajgangpur had the highest annual PM level in the state where it was more than twice the annual standard, whereas Konark recorded the highest monthly average in Odisha during 2016 with values reaching 191 µg/m3 which is almost twice the daily standard prescribed in India. Some of the places with the highest annual PM levels are Rajgangpur, Kalinga Nagar, Paradeep, Talcher, Bhubaneshwar, Puri with values 133, 113, 109, 105, 101, 94.
Annual PM10 levels
for 2016 for Alwar,
Bharatpur Bhiwadi,
Jaipur, Jodhpur,
Kota and Udaipur
were 144, 126, 262,
218, 169, 106, 142.
PM10 levels across RAJASTHAN during 2015 & 2016
2015 AVERAGE 2016 AVERAGE NAAQS WHO
2015 AVERAGE 2016 AVERAGE NAAQS WHO
A general
observation of
monthly data
indicates higher air
pollution trends
during first and
last quarter of the
year across the
state with a very
significant increase
during October to
December in many
cities such as
Bhubaneshwar, Puri,
Paradeep, Konark,
Kalingnagar and
Rajgangpur whereas
relatively higher
values as compared
to others were
observed in Angul
and Talcher during
January to April.
PM10 levels across Odisha during 2015 & 2016
150
100
50
0
200
300
250
ALWAR JAIPUR JODHPUR KOTA UDAIPUR BHIWADI BHARATPUR
CITIES
406080
120100
200
140160
AN
GU
L
BA
LA
SO
RE
BER
HA
MP
UR
BH
UB
AN
ESH
WA
R
CU
TTA
CK
KA
LIN
GA
NA
GA
R
KEO
NJH
AR
KO
NA
RK
PA
RA
DEEP
PU
RI
RA
YA
GA
DA
RO
UR
KELA
SA
MB
ALP
UR
TA
LC
HER
RA
JGA
NG
PU
R
JHA
RSU
GU
DA
CITIES
1615
ODISHA
RAJASTHAN

RAJASTHAN
ODIS
HA
Data on monthly air pollution trends regarding PM levels during 2016 for Rajasthan was obtained from 30 manual monitoring station covering 7 cities that are operated by the state pollution control board under National Air Monitoring Programme.
An assessment of data obtained from these stations shows the annual PM levels were not only above the annual average standard of 60 µg/m3 but also remained above the daily standard of 100 µg/m3, prescribed under NAAQS, for all of the cities in Rajasthan for which the data was available. These values were between two to four times above the prescribed annual standard, numbers varying from city to city. Except for Kota where we observed a dip in PM levels below the prescribed annual standard during July to September, the values remained above the standard throughout the year for the rest of the six cities. Although observation of the monthly trends also indicates a general dip in PM throughout the state during July to September while it remains high in other seasons reaching peak levels during the winter and the months around the cold season.
Bhiwadi recorded the highest PM levels both in terms of annual average and peak value with an annual average PM value of 249 µg/m3 and a peak value recorded at 376 µg/m3 for the year 2016.
The Pollution level seems to be consistent between 2015 and 2016 with little variations on upside for Jaipur and Jodhpur along with slight decrease for Alwar, Kota and Udaipur but the decrease being really insignificant to bring pollution levels down to breathable air quality according to Indian standards levels, leave aside the WHO standards.
Ambient air quality data regarding monthly PM levels for Odisha during 2016 was obtained from 34 manual operating stations covering sixteen cities and towns across the state, operating under the state pollution control board. The assessment of data obtained from these stations shows annual PM levels were above the annual standard of 60µg/m3 in 14 cities, while five cities had an annual average above the daily limit of 100 µg/m3 prescribed under NAAQS.
The pollution level seems to be consistent between 2015 and 2016 with small increases for Bhubaneswar, Kalinga Nagar, Konark and Puri along with a slight decrease for Angul, Rouekela and Talcher but the decrease is insignificant compared to what is required to bring pollution levels down to breathable air quality according to Indian standards levels, let alone the WHO standards.
Rajgangpur had the highest annual PM level in the state where it was more than twice the annual standard, whereas Konark recorded the highest monthly average in Odisha during 2016 with values reaching 191 µg/m3 which is almost twice the daily standard prescribed in India. Some of the places with the highest annual PM levels are Rajgangpur, Kalinga Nagar, Paradeep, Talcher, Bhubaneshwar, Puri with values 133, 113, 109, 105, 101, 94.
Annual PM10 levels
for 2016 for Alwar,
Bharatpur Bhiwadi,
Jaipur, Jodhpur,
Kota and Udaipur
were 144, 126, 262,
218, 169, 106, 142.
PM10 levels across RAJASTHAN during 2015 & 2016
2015 AVERAGE 2016 AVERAGE NAAQS WHO
2015 AVERAGE 2016 AVERAGE NAAQS WHO
A general
observation of
monthly data
indicates higher air
pollution trends
during first and
last quarter of the
year across the
state with a very
significant increase
during October to
December in many
cities such as
Bhubaneshwar, Puri,
Paradeep, Konark,
Kalingnagar and
Rajgangpur whereas
relatively higher
values as compared
to others were
observed in Angul
and Talcher during
January to April.
PM10 levels across Odisha during 2015 & 2016
150
100
50
0
200
300
250
ALWAR JAIPUR JODHPUR KOTA UDAIPUR BHIWADI BHARATPUR
CITIES
406080
120100
200
140160
AN
GU
L
BA
LA
SO
RE
BER
HA
MP
UR
BH
UB
AN
ESH
WA
R
CU
TTA
CK
KA
LIN
GA
NA
GA
R
KEO
NJH
AR
KO
NA
RK
PA
RA
DEEP
PU
RI
RA
YA
GA
DA
RO
UR
KELA
SA
MB
ALP
UR
TA
LC
HER
RA
JGA
NG
PU
R
JHA
RSU
GU
DA
CITIES
1615
ODISHA
RAJASTHAN

UTTARAKHAND
UTTA
R PR
ADES
H
Data on monthly PM levels in Uttarakhand during 2016 was provided by the state pollution control board from eight manual monitoring stations installed across six cities operated by the state pollution control under the National Air Quality Monitoring Programme.
Assessment of data from these stations shows that the annual average PM levels for all the six cities remained above both the prescribed annual standard of 60 µg/m3 and the daily standard of 100 µg/m3 as well. These figures were between two to four times higher than the annual standard varying from city to city. A general observation of the data indicates a slight variation in the monthly trends of PM levels with a dip in levels around the monsoon season in some of the cities whereas very less variation is seen in others.
Dehradun had the highest PM levels in the state with annual average levels going four times above the annual standard and almost two and a half times above the daily standard prescribed under the National Ambient Air Quality Standard. Dehradun was also amongst the most polluted cities in the country in terms of PM levels. Annual PM levels during 2016 in the six cities of Dehradun, Rudrapur, Haldwani, Haridwar, Kashipur, Rishikesh were 238, 142, 130, 128, 121 and 118 µg/m3 respectively.
Ambient air quality data regarding monthly PM levels for Uttar Pradesh during 2016 was obtained from 61 operating stations covering 21 cities and towns strewn across the state and operating under the state pollution control board. Assessment of data obtained from these stations shows annual PM levels for all the cities/towns were far above the daily limit of 100 µg/m3 prescribed under NAAQS, leave aside the WHO limits.
Ghaziabad and Varanasi had the highest annual PM level in the state where it was more than twice the annual standard, whereas Hapur recorded highest monthly average in Uttar Pradesh during 2016 with values reaching 443 µg/m3 in November and December 2016 which is almost 4.5 times the daily standard prescribed in India. Some of the places with highest annual PM levels are Ghaziabad, Varanasi, Hapur, Bareilly, Firozabad, Kanpur and Lucknow with values 236, 236, 235, 226, 223, 217 and 211 respectively.
The pollution level seems to be consistent between 2015 and 2016 with little variations on upside for Firozabad, Kanpur, Lucknow, Moradabad, Noida and Varanasi along with slight decrease for Allahabad, Ghaziabad, Jhansi and Rai Bareilly, the decrease being really insignificant to bring pollution levels down to breathable air quality according to Indian standards levels, leave aside the WHO standards.
There is an
increasing trend in
the pollution level
between 2015 and
2016, almost for all
the cities/towns
where data was
recorded across
Uttrakhand; with
Deharadun leading
the rest with highest
increase.
PM10 levels across Uttarakhand during 2015 & 2016
2015 AVERAGE 2016 AVERAGE NAAQS WHO
2015 AVERAGE 2016 AVERAGE NAAQS WHO
A general
observation of
monthly data
indicates higher air
pollution trends
during first and
last quarter of the
year across the
state with a very
significant increase
during October to
December in many
cities such as Hapur,
Noida, Lucknow,
Ghaziabad and
Varanasi etc.PM10 levels across UTTAR PRADESH during 2015 & 2016
150
100
50
0
200
300
250
DEHRADUN HALDWANI HARIDWAR KASHIPUR RISHIKESH RUDRAPUR
CITIES
CITIES
0
AG
RA
ALLA
HA
BA
DA
NP
AR
A/
SO
NB
HA
DR
A
BA
REIL
LY
FIR
OZ
AB
AD
GA
JRA
ULA
GH
AZ
IAB
AD
GO
RA
KH
PU
R
JHA
NSI
KA
NP
UR
KH
UR
JA
LU
CK
NO
W
MO
RA
DA
BA
D
NO
IDA
RA
I B
AR
EIL
LY
REN
USA
GA
R/
SO
NB
HA
DR
A
UN
NA
O
VA
RA
NA
SI
HA
PU
R
MA
TH
UR
A
SA
HA
RA
NP
UR
MEER
UT
150
100
50
200
300
250
1817
100
300
200
400
500
0
MONTH
Monthly Average PM10 levels across Uttar Pradesh for 2016
JAN16 MAY SEPMAR JUL NOVFEB JUN OCTAPR AUG DEC
AGRA ALLAHABAD BAREILLY FIROZABAD GAJRAULA GHAZIABAD
GORAKHPUR HAPUR JHANSI KANPUR KHURJA LUCKNOW
MEERUT MORADABAD NOIDA RAE BAREILLY SAHARANPURMATHURAUNNAO VARANASISONBHADRA NAAQS WHO
UTTARPRADESH
UTTARAKHAND

UTTARAKHAND
UTTA
R PR
ADES
H
Data on monthly PM levels in Uttarakhand during 2016 was provided by the state pollution control board from eight manual monitoring stations installed across six cities operated by the state pollution control under the National Air Quality Monitoring Programme.
Assessment of data from these stations shows that the annual average PM levels for all the six cities remained above both the prescribed annual standard of 60 µg/m3 and the daily standard of 100 µg/m3 as well. These figures were between two to four times higher than the annual standard varying from city to city. A general observation of the data indicates a slight variation in the monthly trends of PM levels with a dip in levels around the monsoon season in some of the cities whereas very less variation is seen in others.
Dehradun had the highest PM levels in the state with annual average levels going four times above the annual standard and almost two and a half times above the daily standard prescribed under the National Ambient Air Quality Standard. Dehradun was also amongst the most polluted cities in the country in terms of PM levels. Annual PM levels during 2016 in the six cities of Dehradun, Rudrapur, Haldwani, Haridwar, Kashipur, Rishikesh were 238, 142, 130, 128, 121 and 118 µg/m3 respectively.
Ambient air quality data regarding monthly PM levels for Uttar Pradesh during 2016 was obtained from 61 operating stations covering 21 cities and towns strewn across the state and operating under the state pollution control board. Assessment of data obtained from these stations shows annual PM levels for all the cities/towns were far above the daily limit of 100 µg/m3 prescribed under NAAQS, leave aside the WHO limits.
Ghaziabad and Varanasi had the highest annual PM level in the state where it was more than twice the annual standard, whereas Hapur recorded highest monthly average in Uttar Pradesh during 2016 with values reaching 443 µg/m3 in November and December 2016 which is almost 4.5 times the daily standard prescribed in India. Some of the places with highest annual PM levels are Ghaziabad, Varanasi, Hapur, Bareilly, Firozabad, Kanpur and Lucknow with values 236, 236, 235, 226, 223, 217 and 211 respectively.
The pollution level seems to be consistent between 2015 and 2016 with little variations on upside for Firozabad, Kanpur, Lucknow, Moradabad, Noida and Varanasi along with slight decrease for Allahabad, Ghaziabad, Jhansi and Rai Bareilly, the decrease being really insignificant to bring pollution levels down to breathable air quality according to Indian standards levels, leave aside the WHO standards.
There is an
increasing trend in
the pollution level
between 2015 and
2016, almost for all
the cities/towns
where data was
recorded across
Uttrakhand; with
Deharadun leading
the rest with highest
increase.
PM10 levels across Uttarakhand during 2015 & 2016
2015 AVERAGE 2016 AVERAGE NAAQS WHO
2015 AVERAGE 2016 AVERAGE NAAQS WHO
A general
observation of
monthly data
indicates higher air
pollution trends
during first and
last quarter of the
year across the
state with a very
significant increase
during October to
December in many
cities such as Hapur,
Noida, Lucknow,
Ghaziabad and
Varanasi etc.PM10 levels across UTTAR PRADESH during 2015 & 2016
150
100
50
0
200
300
250
DEHRADUN HALDWANI HARIDWAR KASHIPUR RISHIKESH RUDRAPUR
CITIES
CITIES
0
AG
RA
ALLA
HA
BA
DA
NP
AR
A/
SO
NB
HA
DR
A
BA
REIL
LY
FIR
OZ
AB
AD
GA
JRA
ULA
GH
AZ
IAB
AD
GO
RA
KH
PU
R
JHA
NSI
KA
NP
UR
KH
UR
JA
LU
CK
NO
W
MO
RA
DA
BA
D
NO
IDA
RA
E B
AR
EIL
LY
REN
USA
GA
R/
SO
NB
HA
DR
A
UN
NA
O
VA
RA
NA
SI
HA
PU
R
MA
TH
UR
A
SA
HA
RA
NP
UR
MEER
UT
150
100
50
200
300
250
1817
100
300
200
400
500
0
MONTH
Monthly Average PM10 levels across Uttar Pradesh for 2016
JAN16 MAY SEPMAR JUL NOVFEB JUN OCTAPR AUG DEC
AGRA ALLAHABAD BAREILLY FIROZABAD GAJRAULA GHAZIABAD
GORAKHPUR HAPUR JHANSI KANPUR KHURJA LUCKNOW
MEERUT MORADABAD NOIDA RAE BAREILLY SAHARANPURMATHURAUNNAO VARANASISONBHADRA NAAQS WHO
UTTARPRADESH
UTTARAKHAND

BIHAR
WEST
BEN
GAL
Month-wise PM2.5 data was available from Bihar Pollution Control Board but to keep the consistency for the data across the country we have converted PM2.5 to PM10 using a factor of 47% of Total PM being PM2.5 ¹and used that in the compiled table at the end of the report.
Data from January to December 2016, was obtained from three air pollution monitoring stations installed in three cities of Bihar under the state pollution control board. Assessment of air pollution levels from this data indicates that all the three cities had annual PM2.5 levels above both annual and daily standards prescribed under NAAQS. The annual PM2.5 values for all the three cities were between 72 to 123 µg/m3, which are between two to four times higher than the prescribed annual standard of 40 µg/m3.
The deviation in PM2.5 levels is significantly high, particularly in case of Patna and Muzaffarpur, as PM2.5 levels during peak months reach very high levels as compared to the levels during monsoon months. In Patna and Muzaffarpur PM2.5 reached alarming levels during January 2016 with values remaining five times above the daily-prescribed standard.
Patna had the highest annual PM2.5 level and also the highest peak levels of the three cities during 2016. The annual levels for Patna, Muzaffarpur and Gaya in 2016 were 123, 111 and 72 µg/m3 respectively.
PM data for the year 2016 for West Bengal was obtained from manual ambient air quality monitoring stations operated by the state pollution control board installed across 16 cities and districts of West Bengal. Assessment of this data indicates that annual average PM levels for 15 cities were above the annual average standard of 60 µg/m3, prescribed under NAAQS, while for six cities the annual average values were above the daily prescribed standard of 100 µg/m3. A spatial variation in data is visible across the state with cities where annual PM values were recorded above the daily standard had also been found to be around two times higher than the annual standard, while for the rest of the cities the annual average values varied between 60 µg/m3 to 100 µg/m3.
A general observation of the monthly data shows a similar pattern in seasonal variation in particulate levels as seen in most parts of the country, with a drop in PM values during the monsoon while increased levels during other seasons and particularly during winter season. But in many cities of West Bengal the deviation between the lower and the higher values are much more significant. This could be due to very high presence of PM particulates recorded during winter and the months around and relatively lower levels of PM particulates sustained for longer period because of both advancing and retreating monsoon seen in this part of the country.
Burdwan had the highest annual average PM levels in the state during 2016 at 140 µg/m3 which is more than twice the annual standard, while Kolkata had the highest monthly average in the state at 264 µg/m3 which is more than four times higher than the prescribed annual standard. The annual average PM levels in 2016 for some of the most polluted places in the state such as Burdwan, Kolkata, Murshidabad, Birbhum, 24 Parganas South and Bankura were 140, 124, 116, 113, 112 and 106 µg/m3 respectively.
The monthly air
pollution trends
clearly show a
seasonal variation
in PM2.5 levels
through the year,
which is common in
all the three cities
with relatively
lower levels during
summer and monsoon
season and higher
levels during rest of
the year and
reaching peak levels
during the months of
January, November
and December.
PM10 levels across BIHAR during 2015 & 2016
2015 AVERAGE 2016 AVERAGE NAAQS WHO
2015 AVERAGE 2016 AVERAGE NAAQS WHO
The annual average
pollution levels for
2015 and 2016
across Kolkata
shows an increasing
trend for pollution
levels, which is
worrying and needs
to be checked.
PM10 levels across West Bengal during 2015 & 2016
150
100
50
0
200
300
250
PATNA MUZAFFARPUR GAYA
CITIES
406080
120100
200
140
180160
ASA
NSO
L
BA
RA
CK
PO
RE
DA
NK
UN
I
DU
RG
AP
UR
HA
LD
IA
HO
WR
AH
KA
LY
AN
I
KO
LK
ATA
MA
LD
A
RA
NIG
AN
J
SIL
IGU
RI
SO
UTH
SU
BU
RB
AN
ULU
BER
IA
BU
RD
WA
N
MU
RSH
IDA
BA
D
BIR
BH
UM
24
PA
RG
AN
AS
24
PA
RG
AN
AS
BA
NK
UR
A
HO
OG
HLY
MA
DIN
IPO
RE W
EST
MA
DIN
IPO
RE E
AST
JALP
AIG
UR
I
DIN
AJP
UR
NO
RTH
CO
OC
HB
EH
AR
DA
RLEEIN
G
CITIES
2019
¹ http://www.thehindu.com/sci-tech/energy-and-environment/global-studies-on-indias-air-quality-flawed-cpcb/article17379615.ece
100
300
200
400
500
600
700
0
MONTH
PM10 levels across Bihar during 2016
JAN16 MAY SEPMAR JUL NOVFEB JUN OCTAPR AUG DEC
PATNA MUZAFFARPUR GAYA NAAQS WHO
WESTBENGAL
BIHAR

BIHAR
WEST
BEN
GAL
Month-wise PM2.5 data was available from Bihar Pollution Control Board but to keep the consistency for the data across the country we have converted PM2.5 to PM10 using a factor of 47% of Total PM being PM2.5 ¹and used that in the compiled table at the end of the report.
Data from January to December 2016, was obtained from three air pollution monitoring stations installed in three cities of Bihar under the state pollution control board. Assessment of air pollution levels from this data indicates that all the three cities had annual PM2.5 levels above both annual and daily standards prescribed under NAAQS. The annual PM2.5 values for all the three cities were between 72 to 123 µg/m3, which are between two to four times higher than the prescribed annual standard of 40 µg/m3.
The deviation in PM2.5 levels is significantly high, particularly in case of Patna and Muzaffarpur, as PM2.5 levels during peak months reach very high levels as compared to the levels during monsoon months. In Patna and Muzaffarpur PM2.5 reached alarming levels during January 2016 with values remaining five times above the daily-prescribed standard.
Patna had the highest annual PM2.5 level and also the highest peak levels of the three cities during 2016. The annual levels for Patna, Muzaffarpur and Gaya in 2016 were 123, 111 and 72 µg/m3 respectively.
PM data for the year 2016 for West Bengal was obtained from manual ambient air quality monitoring stations operated by the state pollution control board installed across 16 cities and districts of West Bengal. Assessment of this data indicates that annual average PM levels for 15 cities were above the annual average standard of 60 µg/m3, prescribed under NAAQS, while for six cities the annual average values were above the daily prescribed standard of 100 µg/m3. A spatial variation in data is visible across the state with cities where annual PM values were recorded above the daily standard had also been found to be around two times higher than the annual standard, while for the rest of the cities the annual average values varied between 60 µg/m3 to 100 µg/m3.
A general observation of the monthly data shows a similar pattern in seasonal variation in particulate levels as seen in most parts of the country, with a drop in PM values during the monsoon while increased levels during other seasons and particularly during winter season. But in many cities of West Bengal the deviation between the lower and the higher values are much more significant. This could be due to very high presence of PM particulates recorded during winter and the months around and relatively lower levels of PM particulates sustained for longer period because of both advancing and retreating monsoon seen in this part of the country.
Burdwan had the highest annual average PM levels in the state during 2016 at 140 µg/m3 which is more than twice the annual standard, while Kolkata had the highest monthly average in the state at 264 µg/m3 which is more than four times higher than the prescribed annual standard. The annual average PM levels in 2016 for some of the most polluted places in the state such as Burdwan, Kolkata, Murshidabad, Birbhum, 24 Parganas South and Bankura were 140, 124, 116, 113, 112 and 106 µg/m3 respectively.
The monthly air
pollution trends
clearly show a
seasonal variation
in PM2.5 levels
through the year,
which is common in
all the three cities
with relatively
lower levels during
summer and monsoon
season and higher
levels during rest of
the year and
reaching peak levels
during the months of
January, November
and December.
PM10 levels across BIHAR during 2015 & 2016
2015 AVERAGE 2016 AVERAGE NAAQS WHO
2015 AVERAGE 2016 AVERAGE NAAQS WHO
The annual average
pollution levels for
2015 and 2016
across Kolkata
shows an increasing
trend for pollution
levels, which is
worrying and needs
to be checked.
PM10 levels across West Bengal during 2015 & 2016
150
100
50
0
200
300
250
PATNA MUZAFFARPUR GAYA
CITIES
406080
120100
200
140
180160
ASA
NSO
L
BA
RA
CK
PO
RE
DA
NK
UN
I
DU
RG
AP
UR
HA
LD
IA
HO
WR
AH
KA
LY
AN
I
KO
LK
ATA
MA
LD
A
RA
NIG
AN
J
SIL
IGU
RI
SO
UTH
SU
BU
RB
AN
ULU
BER
IA
BU
RD
WA
N
MU
RSH
IDA
BA
D
BIR
BH
UM
24
PA
RG
AN
AS
24
PA
RG
AN
AS
BA
NK
UR
A
HO
OG
HLY
MA
DIN
IPO
RE W
EST
MA
DIN
IPO
RE E
AST
JALP
AIG
UR
I
DIN
AJP
UR
NO
RTH
CO
OC
HB
EH
AR
DA
RLEEIN
G
CITIES
2019
¹ http://www.thehindu.com/sci-tech/energy-and-environment/global-studies-on-indias-air-quality-flawed-cpcb/article17379615.ece
100
300
200
400
500
600
700
0
MONTH
PM10 levels across Bihar during 2016
JAN16 MAY SEPMAR JUL NOVFEB JUN OCTAPR AUG DEC
PATNA MUZAFFARPUR GAYA NAAQS WHO
WESTBENGAL
BIHAR

DELHI
HARY
ANA
Data on monthly PM levels during 2016 in Delhi was obtained from 6 manually operated air quality monitoring stations installed across Delhi, operating under the Delhi Pollution Control Committee. Assessment of air quality from this data indicates that annual PM levels were between four to seven times higher than the annual standard prescribed under NAAQS at all the six locations. Not only were the annual values above the annual standard, but they were also way above the daily standard. Except for a couple of months at two stations we do not see any of the months having PM below the daily standard of 100 µg/m3.
Observing the monthly trends we clearly see a significant seasonal variation in PM values. This seasonal pattern is common across most of the other parts of the country, i.e. a dip in PM level during monsoon and higher level during winter and the months around the cold season. But in case of Delhi this variation was most significant as the overall PM levels during November 2016 deteriorated to 464 µg/m3 (average of all the six stations), which is highest in the country. At Anand Vihar PM level during November 2016 were 833 µg/m3, which is eight times the daily standard and again highest in the country for a given station.
Anand Vihar had both the highest peak levels and annual levels during 2016 with annual levels remaining four times above daily standard. Annual PM levels during 2016 for RK Puram, Mandir Marg, Punjabi Bagh, Civil Lines, IGI Airport and Anand Vihar were 276, 238, 274, 282, 247 and 423 µg/m3 respectively. Overall annual PM level for Delhi during 2016 was at 290 µg/m3, thus exposing its over 2 million inhabitants to extreme levels of air pollution.
Monthly PM2.5 data for 2016 was obtained from air quality monitoring stations installed in four cities and operating under the state pollution control board, but to keep the consistency for the data across the country we have converted PM2.5 to PM using a factor of 47% of total PM being PM2.5 ²and used that in the compiled table at the end of the report. Assessment of air quality from this data indicates that annual PM2.5 levels for all the four cities were above the annual limit of 40 µg/m3, prescribed under NAAQS, while two cities had this annual level above the daily prescribed standard of 60 µg/m3. Two of these four cities neighbouring the national capital namely Gurgaon and Faridabad, had excessively high PM2.5 levels as the annual average value were around three times higher than the annual standard.
Observing the monthly pattern we can infer that relatively lower levels are observed during monsoon while higher levels can be seen during winters and the months around. But in case of Gurgaon and Faridabad we see a drastic increase in PM2.5 levels during winters, thus extremely deteriorating air quality.
Faridabad had both highest annual levels and highest peak levels for PM2.5 during 2016, with annual level at 128 µg/m3, while peak levels were critically high during January 2016 at 258 µg/m3, which is more than four times the prescribed daily standard.
The annual average
pollution levels for
2015 and 2016 across
Delhi shows an
increasing trend for
pollution levels,
displaying alarming
levels of pollution
and requires a
check.
PM10 levels across DELHI during 2015 & 2016
Annual PM2.5 level
for the other three
cities i.e. Gurgaon,
Rohtak and
Panchkula were 107,
55 and 52 ³ respectively.
150
100
50
0
200
300
250
DELHI
CITIES
PM10 levels across HARYANA during 2015 & 2016
60
40
20
0
80
120
140
100
FARIDABAD GURGAON ROHTAK PANCHKULA
CITIES
2015 AVERAGE 2016 AVERAGE NAAQS WHO
2015 AVERAGE 2016 AVERAGE NAAQS WHO
2221
50
150
100
200
250
300
0
MONTH
Monthly Average PM10 levels across Haryana for 2016
JAN16 MAY SEPMAR JUL NOVFEB JUN OCTAPR AUG DEC
ROHTAK FARIDABAD GURGAON PANCHKULA NAAQS WHO
² http://www.thehindu.com/sci-tech/energy-and-environment/global-studies-on-indias-air-quality-flawed-cpcb/article17379615.ece
100
300200
800900
0
400500600700
MONTH
Monthly Average PM10 levels across DELHI for 2016
JAN16 MAY SEPMAR JUL NOVFEB JUN OCTAPR AUG DEC
RK PURAM MANDIR MARG PUNJABI BAGH CIVIL LINES IGI AIRPORTANAND VIHAR NAAQS WHO
HARYANA
DELHI
.

DELHI
HARY
ANA
Data on monthly PM levels during 2016 in Delhi was obtained from 6 manually operated air quality monitoring stations installed across Delhi, operating under the Delhi Pollution Control Committee. Assessment of air quality from this data indicates that annual PM levels were between four to seven times higher than the annual standard prescribed under NAAQS at all the six locations. Not only were the annual values above the annual standard, but they were also way above the daily standard. Except for a couple of months at two stations we do not see any of the months having PM below the daily standard of 100 µg/m3.
Observing the monthly trends we clearly see a significant seasonal variation in PM values. This seasonal pattern is common across most of the other parts of the country, i.e. a dip in PM level during monsoon and higher level during winter and the months around the cold season. But in case of Delhi this variation was most significant as the overall PM levels during November 2016 deteriorated to 464 µg/m3 (average of all the six stations), which is highest in the country. At Anand Vihar PM level during November 2016 were 833 µg/m3, which is eight times the daily standard and again highest in the country for a given station.
Anand Vihar had both the highest peak levels and annual levels during 2016 with annual levels remaining four times above daily standard. Annual PM levels during 2016 for RK Puram, Mandir Marg, Punjabi Bagh, Civil Lines, IGI Airport and Anand Vihar were 276, 238, 274, 282, 247 and 423 µg/m3 respectively. Overall annual PM level for Delhi during 2016 was at 290 µg/m3, thus exposing its over 2 million inhabitants to extreme levels of air pollution.
Monthly PM2.5 data for 2016 was obtained from air quality monitoring stations installed in four cities and operating under the state pollution control board, but to keep the consistency for the data across the country we have converted PM2.5 to PM using a factor of 47% of total PM being PM2.5 ²and used that in the compiled table at the end of the report. Assessment of air quality from this data indicates that annual PM2.5 levels for all the four cities were above the annual limit of 40 µg/m3, prescribed under NAAQS, while two cities had this annual level above the daily prescribed standard of 60 µg/m3. Two of these four cities neighbouring the national capital namely Gurgaon and Faridabad, had excessively high PM2.5 levels as the annual average value were around three times higher than the annual standard.
Observing the monthly pattern we can infer that relatively lower levels are observed during monsoon while higher levels can be seen during winters and the months around. But in case of Gurgaon and Faridabad we see a drastic increase in PM2.5 levels during winters, thus extremely deteriorating air quality.
Faridabad had both highest annual levels and highest peak levels for PM2.5 during 2016, with annual level at 128 µg/m3, while peak levels were critically high during January 2016 at 258 µg/m3, which is more than four times the prescribed daily standard.
The annual average
pollution levels for
2015 and 2016 across
Delhi shows an
increasing trend for
pollution levels,
displaying alarming
levels of pollution
and requires a
check.
PM10 levels across DELHI during 2015 & 2016
Annual PM2.5 level
for the other three
cities i.e. Gurgaon,
Rohtak and
Panchkula were 107,
55 and 52 ³ respectively.
150
100
50
0
200
300
250
DELHI
CITIES
PM10 levels across HARYANA during 2015 & 2016
60
40
20
0
80
120
140
100
FARIDABAD GURGAON ROHTAK PANCHKULA
CITIES
2015 AVERAGE 2016 AVERAGE NAAQS WHO
2015 AVERAGE 2016 AVERAGE NAAQS WHO
2221
50
150
100
200
250
300
0
MONTH
Monthly Average PM10 levels across Haryana for 2016
JAN16 MAY SEPMAR JUL NOVFEB JUN OCTAPR AUG DEC
ROHTAK FARIDABAD GURGAON PANCHKULA NAAQS WHO
² http://www.thehindu.com/sci-tech/energy-and-environment/global-studies-on-indias-air-quality-flawed-cpcb/article17379615.ece
100
300200
800900
0
400500600700
MONTH
Monthly Average PM10 levels across DELHI for 2016
JAN16 MAY SEPMAR JUL NOVFEB JUN OCTAPR AUG DEC
RK PURAM MANDIR MARG PUNJABI BAGH CIVIL LINES IGI AIRPORTANAND VIHAR NAAQS WHO
HARYANA
DELHI
.

TELANGANAKARN
ATAK
A
Monthly PM data for 2016 was obtained form 39 air quality monitoring stations operated by the state pollution control under various programmes of the state and central government. These stations cover a total of 11 cities and districts of Telangana, but a majority those are installed in Hyderabad.
Assessment of air quality from this data indicates that of the eleven cities and districts, seven had annual PM level above the annual standard of 60 µg/m3 prescribed under NAAQS. While at some places these levels were marginally above the annual standard, at rest of the places PM levels were between 10 to 50 percent above the annual standard.
Observing the monthly patterns indicates higher air pollution trends during the months of January to February and then between October to December. But the degree of variation is not the same for the entire place; as for some places this variation is significant while at others the variation is very low. At Hyderabad and Medak the variation is quiet high as there is clear spike in PM levels in October, which is sustained in the consecutive months.
Hyderabad had the highest annual PM levels and also recorded highest peak levels during November 2016 with PM levels recorded at 117 µg/m3, which is 17% higher than the daily standard and almost twice as high as the annual standard. In 2016 Hyderabad had five months during which its PM levels were recorded above the daily standard of 100 µg/m3.
Monthly PM10 data for 2016 was obtained from 31 manual as well as continuous ambient air quality monitoring stations installed under the state pollution control board covering Bengaluru and 17 other major cities and towns of Karnataka.
Assessment of air quality from this data indicates that annual PM levels in ten cities were above the annual PM standard of 60µg/m3 prescribed under the NAAQS, while four cities had annual levels above the daily standard, which is 100 µg/m3. Annual PM levels also indicate a sporadic distribution in pollution levels as places with higher PM levels are spread throughout the state in no particular pattern.
A general observation of the monthly trends shows that although there is a general trend in monthly pollution levels with higher PM levels during and around winters and a dip in levels during monsoon, but the degree of seasonal variation in PM levels is not the same for all the places. PM levels had remained almost two times higher than the daily PM standard during peak months in cities where higher seasonal variation is seen.
The pollution level seems to be consistent between 2015 and 2016 with little variations on upside for Tumkuru, Bidar, Hubli and Dharwad along with slight decrease for Bangalore, Davanagere, Kolar and Gulbarga etc. but the decrease being really insignificant to bring pollution levels down to breathable air quality according to Indian standards levels, leave aside the WHO standards.
In 2016, Bengaluru
had eight months of
being above the daily
prescribed standard
of 100 ³. Tumkur
had the highest
annual PM10 values in
2016 in the state
(although the data
for Tumkur is for six
months only).
Annual PM10 levels
for Tumkur, Bidar,
Bangalore,
Davangere, Raichur
and Hubli are 144,
113, 106, 84, 88, and
87 respectively.
PM10 levels across KARNATAKA during 2015 & 2016
2015 AVERAGE 2016 AVERAGE NAAQS WHO
100
150
200
50
0
BA
NG
ALO
RE
MY
SO
RE
TU
MK
UR
BID
AR
DA
VA
NG
ER
E
RA
ICH
UR
HU
BLI
DH
AR
WA
D
KO
LA
R
GU
LB
AR
GA
BELG
AU
M
BELLA
RY
MA
NG
ALO
RE
CH
ITR
AD
UR
G
MA
ND
YA
KA
RW
AR
BH
AD
RA
VA
TI
HA
SSA
N
CITIES
2015 AVERAGE 2016 AVERAGE NAAQS WHO
PM10 levels across TELANGANA during 2015 & 2016
40
60
80
120
100
20
0
HYDERABA
D
KARIMNAGAR
KHAMM
AM
KOTH
UR
NALGONDA
PATA
NCHERU
RAMAGUNDAM
SANGARED
DY
WARANGAL
MED
AK
MAHABO
OBN
AGAR
ADILABA
D
NIZAM
ABAD
KOTH
AGUDEM
CITIES
Annual PM10 levels
for Hyderabad,
Medak,
Mahboobnagar,
Ramagundam and
Warangal are 93, 77,
77, 68 and 67 ³ respectively.
2423
100
150
200
50
0
MONTH
Monthly Average PM10 levels across Karnataka for 2016
JAN16 FEB MAR APR MAY JUN JUL AUG SEP OCT NOV DEC
BANGALORE BELGAUM BELLARY BHADRAVATI BIDAR CHITRADURG
DAVANGERE DHARWAD GULBARGA HASSAN HUBLI KOLAR
MANGALORE MYSORE
MANDYA
RAICHUR TUMKUR NAAQS WHO
Monthly Average PM10 levels across TELANGANA for 2016
ADILABAD HYDERABAD KARIMNAGAR KHAMMAM KOTHAGUDEMMAHABOOBNAGAR MEDAK NALGONDA NIZAMABADRAMAGUNDAM WARANGAL NAAQS WHO
406080
100120
200
MONTH
JAN16 FEB MAR APR MAY JUN JUL AUG SEP OCT NOV DEC
KARNATAKA TELANGANA

PUNJAB
TAMI
L NA
DU
Monthly average PM data for year 2016 was obtained from 26 ambient air quality-monitoring stations installed across 14 cities and towns across Punjab.
The pollution level seems to be consistent between 2015 and 2016 with little variations on upside for Amritsar, Bhatinda, Faridkot and Dera Baba Nanak along with slight decrease for Khanna, Jalandhar, Patiala and Sangrur but the decrease being really insignificant to bring pollution levels down to breathable air quality according to Indian standards levels aside the WHO standards.
Monthly average PM data for year 2016 was obtained from 23 ambient air quality-monitoring stations installed across 7 cities and towns of Tamil Nadu.
The data indicates that three out of seven cities had higher concentrations of PM than the annual average levels prescribed
³). The pollution level seems to be consistent between 2015 and 2016 with little variations on upside for Chennai, Madurai, Coimbatore, Metur and Thoothukudi along with slight decrease for Cuddalore and Salem.
Thoothukudi
recorded highest
PM10 levels with
values breaching
182 ³ level in
2016 while Madurai
and Chennai
following with 82
and 71 respectively.
The data indicates
that all the 14 cities
had higher
concentrations of
PM10 than the annual
average levels
prescribed by CPCB
(60 ³) and all of
them had at-least
four times more
polluted air as
compared to WHO
annual standard for
PM10.
PM10 levels across TAMIL NADU during 2015 & 2016
2015 AVERAGE 2016 AVERAGE NAAQS WHO
150
100
50
0
200
CHENNAI
COIM
BATO
RE
CUDDALORE
MADURAI
MET
TUR
SALE
M
TRIC
HY
THOOTH
UKUDI
CITIES
PM10 levels across PUNJAB during 2015 & 2016
50
100
150
200
250
0
AMRIT
SAR
BATH
INDA
DERA B
ABA N
ANAK
DERA B
ASSI
FARID
KOT
MANDI G
OBI
NDGARH
HOSH
IARPU
R
JALA
NDHAR
KHANNA
LUDHIA
NA
NAYA NANGAL
PATI
ALA
SANGRUR
SBS N
AGAR
RASULP
UR
2015 AVERAGE 2016 AVERAGE NAAQS WHO
CITIES
2625
100
200
150
250
50
0
MONTH
Monthly Average PM10 levels across TAMIL NADU for 2016
JAN16 FEB MAR APR MAY JUN JUL AUG SEP OCT NOV DEC
CHENNAI COIMBATORE CUDDALORE MADURAI METTUR SALEM
THOOTHUKUDI NAAQS WHO
TAMIL NADUPUNJAB

KERA
LA
Monthly average PM data for year 2016 was obtained for 14 cities and towns across Kerala. The data indicates that all the 14 cities had lower concentrations of PM than the annual average levels
³. The
Kerala is the only
state where all the
cities/towns where
ambient air quality
is being monitored
are showing annual
average values
within the
prescribed limits by
CPCB through NAAQS.
2015 AVERAGE 2016 AVERAGE NAAQS WHO
PM10 levels across KERALA during 2015 & 2016
20
30
40
60
50
10
0
70
ALAPP
UZHA
KOCHI
KOLL
AM
KOTT
AYAM
KOZH
IKODE
MALA
PPURAM
PALA
KKAD
PATH
ANAMTH
ITTA
THIR
UVANANTHAPU
RAM
THRIS
SUR
WAYANAD
KANNUR
KASARGO
D
IDUKKI
CITIES
27
village, Korba district, Chhattisgarh, India.
© Sri Kolari / Greenpeace
KERALA

KERA
LA
Monthly average PM data for year 2016 was obtained for 14 cities and towns across Kerala. The data indicates that all the 14 cities had lower concentrations of PM than the annual average levels
³. The
Kerala is the only
state where all the
cities/towns where
ambient air quality
is being monitored
are showing annual
average values
within the
prescribed limits by
CPCB through NAAQS.
2015 AVERAGE 2016 AVERAGE NAAQS WHO
PM10 levels across KERALA during 2015 & 2016
PM
10 (M
G/M
3)
20
30
40
60
50
10
0
70
ALAPP
UZHA
KOCHI
KOLL
AM
KOTT
AYAM
KOZH
IKODE
MALA
PPURAM
PALA
KKAD
PATH
ANAMTH
ITTA
THIR
UVANANTHAPU
RAM
THRIS
SUR
WAYANAD
KANNUR
KASARGO
D
IDUKKI
CITIES
27
village, Korba district, Chhattisgarh, India.
© Sri Kolari / Greenpeace
KERALA

3029
The data compiled in the report is a comprehensive set of data on air quality in India. It covers 280 cities with a population of 630 million or 53% of the total population (assuming a district with even one manual station covers the entire population of the said district):
These estimates are extremely conservative because of the assumption that the present air quality-monitoring network for respective districts covers the entire population of the mentioned districts. Whereas, in reality most of these stations are only centered around few towns, hence the actual number of people with complete absence of air quality data would be much higher.
1.Out of the 630 million Indians covered by the data, 550 million live in areas exceeding national standard for PM10, and 180 million live in areas where the air pollution levels are more than twice the stipulated standards. This includes 47 million children under 5 years of age, living in areas where the standard is exceeded and 17 million in areas where the air pollution levels are more than twice the stipulated standards.
2. The largest numbers of people in areas with more than twice the stipulated levels of pollution are in Uttar Pradesh (64 million), followed by Rajasthan (20 million), Maharashtra (19 million), Delhi (17 million) and Bihar (15 million).
3. The most are children under 5 years of age, living in areas where the standard is exceeded more than twice are also in Uttar Pradesh (6.3 million) and Rajasthan (2.1 million), followed by Bihar (1.7 million), Maharashtra (1.4 million) and Delhi (1.4 million).
4. 580 million Indians live in districts with no air quality data available, including 59 million children under 5 years of age.
5. Real time data is available for only 190 million Indians, or 16% of the population.
6. After Delhi, Maharashtra and Andhra Pradesh have the highest coverage of real-time data, while 23 states have no real time data available to public.
7. The largest number of people living in areas with no data is Uttar Pradesh (133 million), followed by Bihar (89 million), Madhya Pradesh (48 million) and Rajasthan (45 million).
AIR POLLUTION MONITORING NETWORK AND EXPOSURE PM10 AIR QUALITY BY STATEFOR DISTRICTS WITH DATA
PM10 AIR QUALITYBY DISTRICT
Exceeds twice IndianNational Standard
Exceeds IndianNational Standard
Exceeds WHOguideline
National totalPuducherry
MizoramKerala
MeghalayaHimachal Pradesh
OdishaAndhra Pradesh
Madhya PradeshGujarat
GoaDaman & Diu
Dadara & Nagar HavelliChandigarh
Arunachal PradeshWest Bengal
KarnatakaTamil Nadu
MaharashtraAssam
ChhattisgarhPunjab
NagalandHaryana
JharkhandRajasthan
Uttar PradeshUttarakhandNCT of Delhi
Jammu & KashmirBihar
0 20 40 60 80 100
0 20 40 60 80 100
National total
Puducherry
Mizoram
Kerala
Meghalaya
Himachal Pradesh
Odisha
Andhra Pradesh
Madhya Pradesh
Gujarat
Goa
Daman & Diu
Dadara & Nagar HavelliChandigarh
Arunachal Pradesh
West Bengal
Karnataka
Tamil Nadu
Maharashtra
Assam
Chhattisgarh
Punjab
Nagaland
HaryanaJharkhand
Rajasthan
Uttar Pradesh
Uttarakhand
NCT of Delhi
Jammu & Kashmir
Bihar
Manipur
Tripura
LakshadweepAndaman & Nicobar Island
Sikkim
AIR QUALITY DATACOVERAGE BY STATE
No data
Manual data
Real-time data
STATUS OF AIR QUALITYBY DISTRICT
Real-time data
Manual data
No data
No data
Exceeds twice IndianNational Standard
Exceeds IndianNational Standard
Exceeds WHOguideline
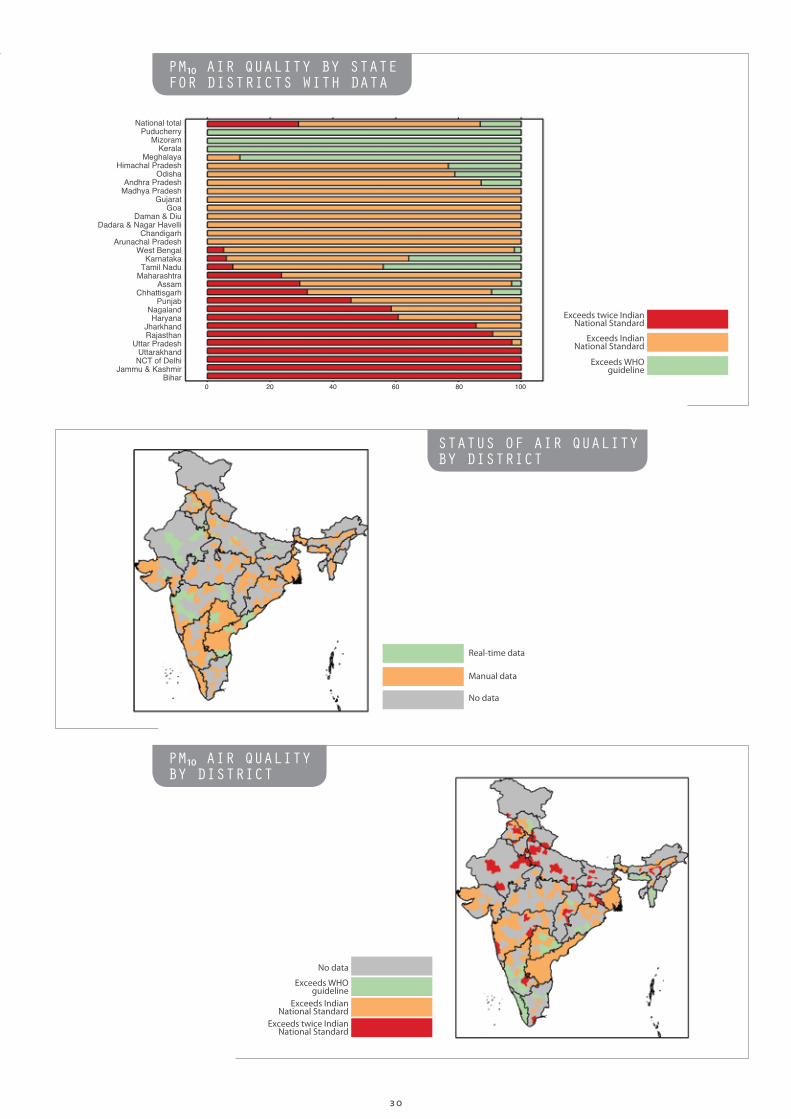

WAY FORWARD
GOVERNMENT INITIATIVE
ACTION PLAN
TRANSPARENT DATA
SHORT TERM MEASURES
LONG TERM MEASURES
PEOPLE’s INITIATIVE
1 2 3 4
It requires a system , which approaches, understands and assesses pollution levels regularly while initiating action to tackle and control it effectively. The first step in this direction is to have a robust monitoring of air quality through a mechanism installed across the country. This is necessary to bring information about pollution levels in real time and through use of data resulting into collected strategies evolved to reduce pollution levels and protect public health. The strategies to reduce pollution should synthesize into a concrete action plan, which should be implemented in a time bound manner with specific targets and penalties.
Government of India should adopt time-bound national and regional action plans, which have clear targets for regions and penalties in case of non-compliance. This should include providing transparent data to the public on air quality, besides short and long term measures to reduce air pollution.
Public participation is critical in reducing air pollution. Our choices for electricity and transportation could play a major role in managing pollution levels in many parts of the country. Efforts should be made in some of the key areas such as:
Improving NAQI monitoring systems and providing access to data to the public on a real time basis for the whole country is absolutely necessary, given the rising levels of air pollution through most parts of the country. This should be coupled with a timely health advisory in order to enable the public to take suitable decisions and steps to protect their health and the environment.
Issuing red alert and health advisories during bad air-days, shutting down schools, taking polluting vehicles off the roads through odd-even registration number as also other schemes and shutting down power plants and industries etc are some of the short term steps that the central and state governments can undertake in case of air pollution levels reaching alarming levels.
Improving public transport, limiting the number of polluting vehicles on the road, introducing less polluting fuel (Bharat VI), strict emission regulations and improved efficiency for thermal power plants and industries, moving from diesel generators to rooftop solar power systems, increased use of clean renewable energy, electric vehicles, removing dust from roads, regulating construction activities, stopping biomass burning etc. can be the long term measures.
Moving towards rooftop solar and other forms of decentralisEd renewable energy solutions
Increased usage of public transport, cycling and walking
Using energy efficient appliances and reducing household energy usage
Waste minimisation, segregation and recycling, which will reduce burning of waste in streets as well as at the landfills along with energy reductions and saving in transporting huge quantities of waste
COMPARISON OF FACTS ONAIR POLLUTION AROUND THE WORLD
CHINA INDIA US EU TAIWAN S KOREA
Change in satellite-based PM2.5 levels from 2010 to 2015
PM2.5 trend
PM2.5 in capital city, annual (µg/m³)
PM2.5 air quality standard, annual (µg/m³)
Deaths per day from air pollution in 2013
Online PM2.5 monitoring
Share of thermal power plants with basic pollution controls (desulphurisation, particle controls)
Target for PM2.5 or deadline for meeting national air quality standards
Key policy measures: power sector
Falling since measurements started
16.1 and 18.1 (depending on the location within the capital city)
15
76 stations
20 by 2016 15 by 2020
Establish targets for electricity from renewable in national. energy transition (20% from RE, 50% from gas, and 30% from coal by 2025). Phase out of old and high pollution power units. Decrease/adjust power outputs during air pollution seasons. Update pollution control technology for power units. Establish air pollution rate based on seasonal difference
Stable since measurements started
26
26
35 stations in 28 cities (2016. 12)
18 by 2022
22% reduction by 2022. The top of the line emission facilities & strict standards for 5 units of new coal plants. LNG transition for 4 units of new coal plants. Early shut down for 10 units of over 30 years old coal plants. Strict emissions regulations for 39 units of operating coal plants. Strict management for SRF plant 20% RE by 2030
-17%
Falling since 2011; 2015 was the best on record
81
35
2,700
1,500 stations in 900 cities & towns
95%
2030; most key cities have an interim target for 2017
Strict emission norms for existing and new power plants, ramped-up enforcement, renewable electricity targets included in national air action plan, elimination of old plants
13%
Increasing steadily for past 10 years; 2015 was the worst year on record
128
40
1,800
87 station in 52 cities
10%
None
Strict emissions norms notified in 2015
-15%
Falling since measurements started
12
15
250
770 stations in 540 cities & towns
60%
2012; violating areas are currently implementing new plans
Updated emission norms
-20% (from 2005 to 2013)
Falling since measurements started
18
25 (from 2020, 20)
640
1,000 stations in 400 cities & towns
75%
25 by 2015, 20 by 2020
Updated Best Available Technology requirements by 2022
3231
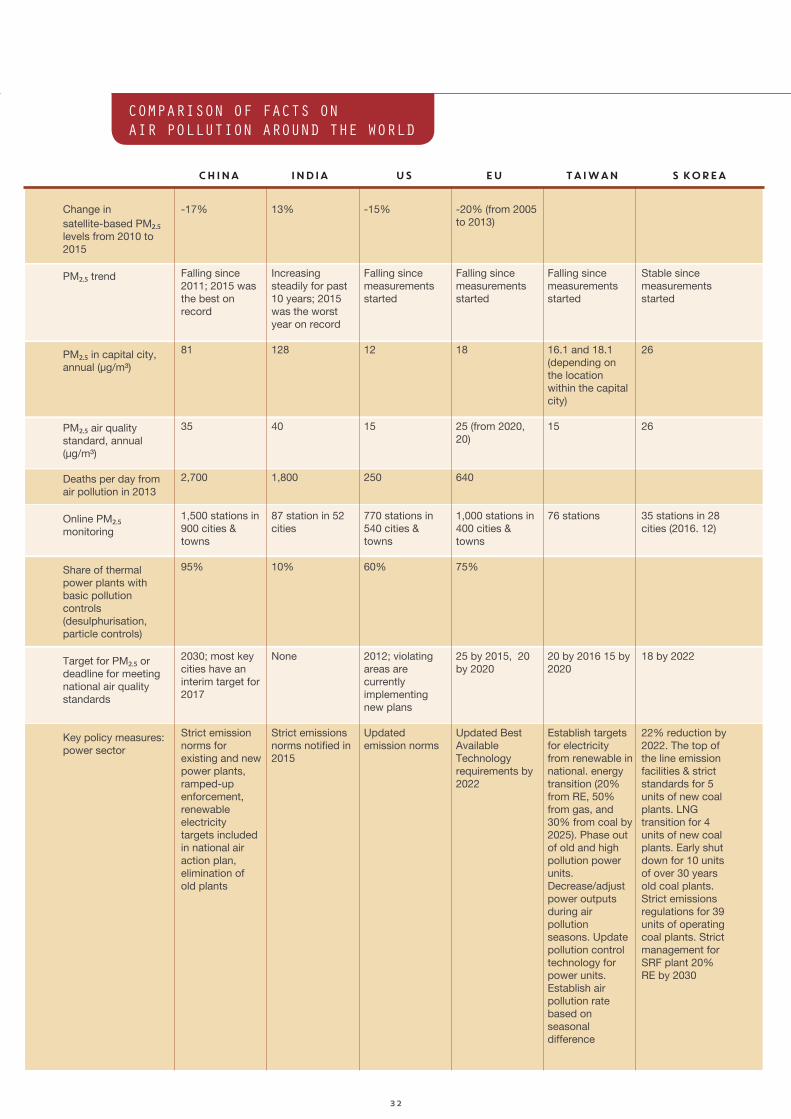

CHINA INDIA US EU TAIWAN S KOREA
Key policy measures: industry
Key policy measures: transport
Key policy measures: other sectors
Consequences for missing targets
Stricter emission standards for boilers. Phase out of old boilers. Transit of 6,000 boiler that are currently using oil as fuel to gas.
Phase out 80,000 old diesel cars by 2019. Phase out 1,000,000 old scooters by 2019. Promote filter installation for diesel cars. Promote use of electrical vehicles.
Strengthen standards for air pollution control equipment at construction sites. Establish regulation on air pollution control equipment for restaurants.
No legal action for the government but will surely receive pressure and condemn from the society (since air pollution is one of the most discussed and concerned issue in the whole society. For that industry which will have to be in compliance with related regulations, there will be fine if they failed to meet the standards
43% reduction by 2022 Emissions charge on NO² Strict VOC management.
43% reduction by 2022 for Vehicles Low pollution measures for diesel vehicle & support EV, Hydrogen Vehicles.
24% reduction by 2022 for off road emissions Measures for Ships and Construction machinery
15% reduction by 2022 for fugitive dust. Diplomatic efforts with other countries for trans boundary air pollution.
Ramped-up enforcement of industrial emission norms and monitoring. Absolute coal consumption cuts and a ban on increasing coal-fired boilers in key regions.
Controlling number of cars EURO4/5/6 Electric vehicle mandate.
Replacing household coal use with gas and electricity.
Promotion of province governors depends on meeting targets
Government is in the process of setting up standards for 35 different polluting industries, especially with SO² and NOx emissions.
Bharat VI standards will come into place by 2020. 100% new electric vehicle policy by 2030. 100% electrification of railways by 2020.
Replacing biomass based cooking stoves with LPG to reduce indoor air pollution. Working with farmers to reduce air pollution due to open crop burning. Banning garbage burning.
None but courts time to time impose penalties for non-compliance
Emissions standards for 174 major source categories, representing 90 percent of emissions of 30 priority pollutants.
Emission standards comparable to EURO6; mandatory emission measurements.
Emissions from agriculture, waste burning etc. are regulated on State and local level; areas that violate air quality standards are subject to more restrictions
States must adopt emission reduction measures into law that are demonstrated to enable meeting targets; must account for pollution transport into downwind states; periodic review.
Best Available Technology requirements for all polluting industries. Emission ceilings for air pollutants for each member state that fall over time.
EURO6 emission standards for cars and trucks; mandatory emission measurements. CO2 emission standards that encourage electrification.
National emissions ceilings and national air pollution control programmes cover agriculture, domestic heating and non-road mobile machinery and solvents etc.
Cities & countries face legal action for not meeting standards.
CHINA INDIA US EU TAIWAN S KOREA
Coverage of government measures
“Air Pollution Control Strategy”, which national and city level government agencies should established relevant regulations and plans accordingly. National emission standards for power plants and industrial sectors. “Air Pollution Control Act”, which is in modification process right now, and the main modification elements are to establish regulations/guidelines for air pollution emission cut, transportation and authorization city government to take action according to local air quality.
All the government administration will take roles for PM2.5 reduction in their responsible sector by 2022 and government department of the policy coordination will review, evaluate, improve the plan when the target years come.
National, regional and city-level action plans with measurable 5-year targets National emission standards for power plants, industrial sectors and vehicles
Mainly action in individual cities with no measurable targets Recently introduced India-wide emission standards for thermal power plants; Introduction of Bharat VI vehicle emission norms are proposed by April 2020. Only Delhi NCR region has an emergency response plan and the courts have asked the government to notify long term action plan for Delhi NCR
National air quality targets; implementation plans approved on federal level and executed on state level National emission standards for power plants, industrial sectors and vehicles
“Clean Air For Europe” action plan Europe-wide emission standards for power plants, industry and cars Most countries and key cities have own plans
3433
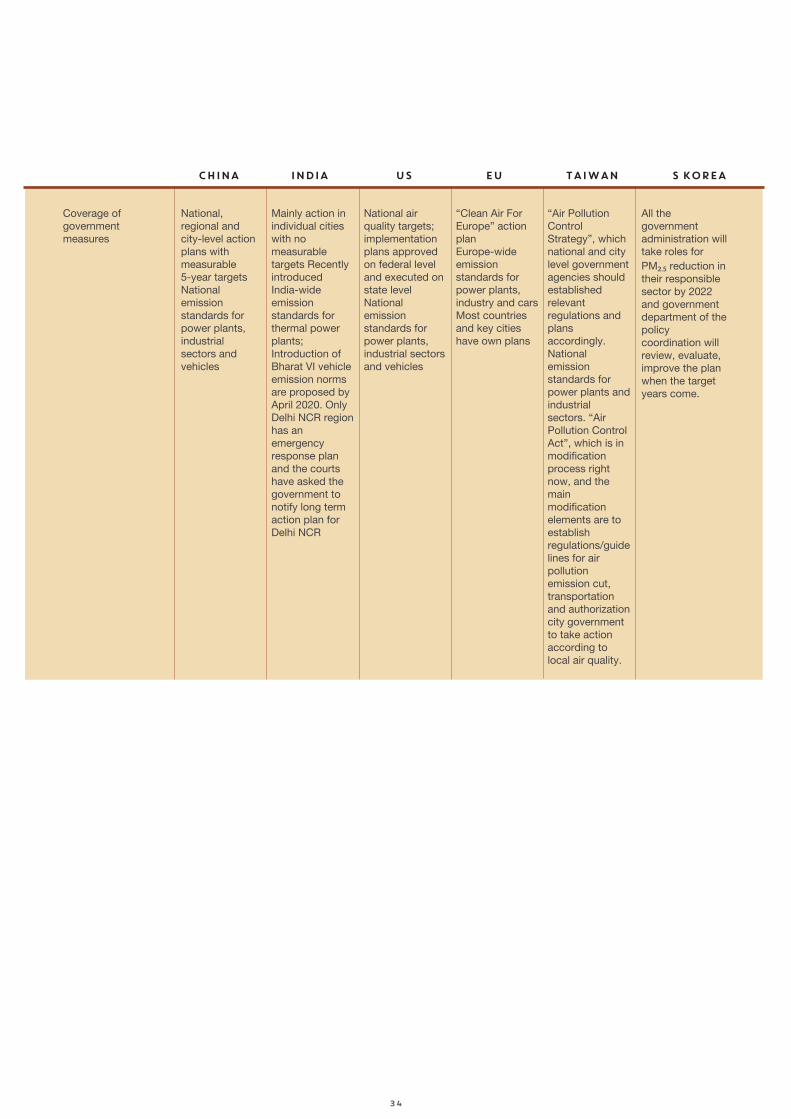
CHINA INDIA US EU TAIWAN S KOREA
Key policy measures: industry
Key policy measures: transport
Key policy measures: other sectors
Consequences for missing targets
Stricter emission standards for boilers. Phase out of old boilers. Transit of 6,000 boiler that are currently using oil as fuel to gas.
Phase out 80,000 old diesel cars by 2019. Phase out 1,000,000 old scooters by 2019. Promote filter installation for diesel cars. Promote use of electrical vehicles.
Strengthen standards for air pollution control equipment at construction sites. Establish regulation on air pollution control equipment for restaurants.
No legal action for the government but will surely receive pressure and condemn from the society (since air pollution is one of the most discussed and concerned issue in the whole society. For that industry which will have to be in compliance with related regulations, there will be fine if they failed to meet the standards
43% reduction by 2022 Emissions charge on NO² Strict VOC management.
43% reduction by 2022 for Vehicles Low pollution measures for diesel vehicle & support EV, Hydrogen Vehicles.
24% reduction by 2022 for off road emissions Measures for Ships and Construction machinery
15% reduction by 2022 for fugitive dust. Diplomatic efforts with other countries for trans boundary air pollution.
Ramped-up enforcement of industrial emission norms and monitoring. Absolute coal consumption cuts and a ban on increasing coal-fired boilers in key regions.
Controlling number of cars EURO4/5/6 Electric vehicle mandate.
Replacing household coal use with gas and electricity.
Promotion of province governors depends on meeting targets
Government is in the process of setting up standards for 35 different polluting industries, especially with SO² and NOx emissions.
Bharat VI standards will come into place by 2020. 100% new electric vehicle policy by 2030. 100% electrification of railways by 2020.
Replacing biomass based cooking stoves with LPG to reduce indoor air pollution. Working with farmers to reduce air pollution due to open crop burning. Banning garbage burning.
None but courts time to time impose penalties for non-compliance
Emissions standards for 174 major source categories, representing 90 percent of emissions of 30 priority pollutants.
Emission standards comparable to EURO6; mandatory emission measurements.
Emissions from agriculture, waste burning etc. are regulated on State and local level; areas that violate air quality standards are subject to more restrictions
States must adopt emission reduction measures into law that are demonstrated to enable meeting targets; must account for pollution transport into downwind states; periodic review.
Best Available Technology requirements for all polluting industries. Emission ceilings for air pollutants for each member state that fall over time.
EURO6 emission standards for cars and trucks; mandatory emission measurements. CO2 emission standards that encourage electrification.
National emissions ceilings and national air pollution control programmes cover agriculture, domestic heating and non-road mobile machinery and solvents etc.
Cities & countries face legal action for not meeting standards.
CHINA INDIA US EU TAIWAN S KOREA
Coverage of government measures
“Air Pollution Control Strategy”, which national and city level government agencies should established relevant regulations and plans accordingly. National emission standards for power plants and industrial sectors. “Air Pollution Control Act”, which is in modification process right now, and the main modification elements are to establish regulations/guidelines for air pollution emission cut, transportation and authorization city government to take action according to local air quality.
All the government administration will take roles for PM2.5 reduction in their responsible sector by 2022 and government department of the policy coordination will review, evaluate, improve the plan when the target years come.
National, regional and city-level action plans with measurable 5-year targets National emission standards for power plants, industrial sectors and vehicles
Mainly action in individual cities with no measurable targets Recently introduced India-wide emission standards for thermal power plants; Introduction of Bharat VI vehicle emission norms are proposed by April 2020. Only Delhi NCR region has an emergency response plan and the courts have asked the government to notify long term action plan for Delhi NCR
National air quality targets; implementation plans approved on federal level and executed on state level National emission standards for power plants, industrial sectors and vehicles
“Clean Air For Europe” action plan Europe-wide emission standards for power plants, industry and cars Most countries and key cities have own plans
3433
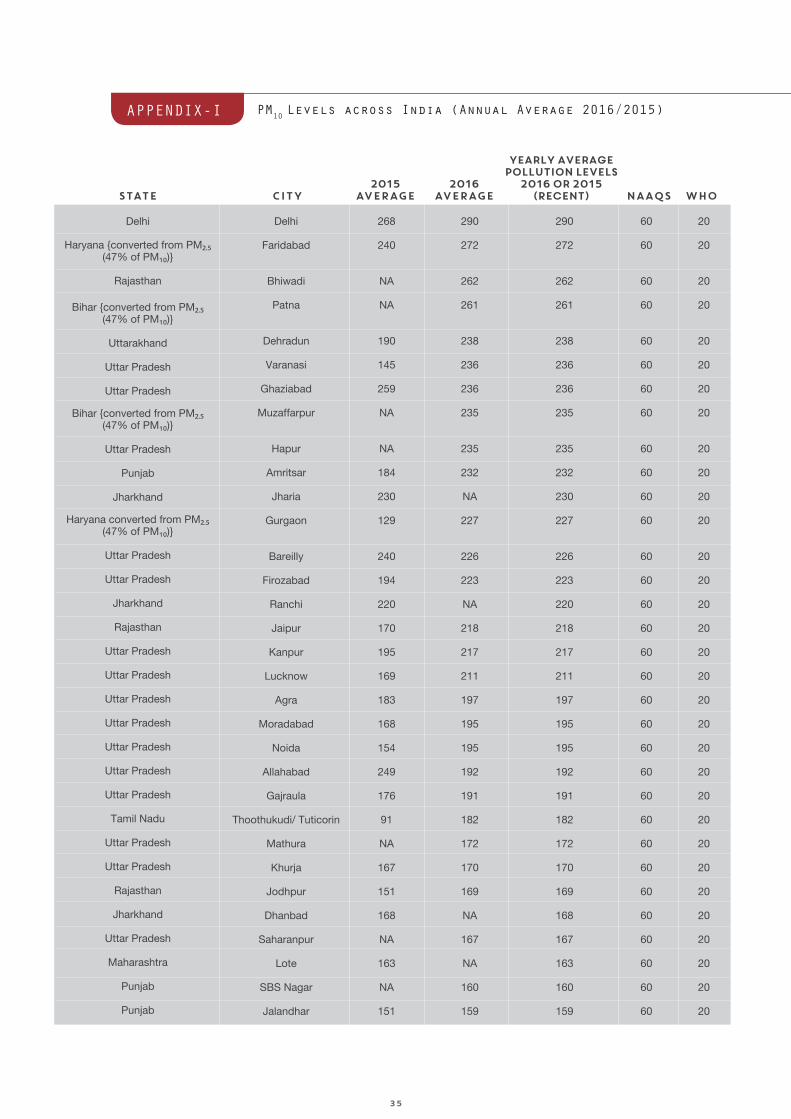
CITY NAAQS WHOSTATE2015
AVERAGE2016
AVERAGE
Yearly AveragePollution Levels
2016 or 2015(Recent)
PM10 Levels across India (Annual Average 2016/2015)APPENDIX-I
Delhi
Haryana {converted from PM2.5 (47% of PM )}
Rajasthan
Bihar {converted from PM2.5 (47% of PM )}
Uttarakhand
Uttar Pradesh
Uttar Pradesh
Bihar {converted from PM2.5 (47% of PM )}
Uttar Pradesh
Punjab
Jharkhand
Haryana converted from PM2.5 (47% of PM )}
Uttar Pradesh
Uttar Pradesh
Jharkhand
Rajasthan
Uttar Pradesh
Uttar Pradesh
Uttar Pradesh
Uttar Pradesh
Uttar Pradesh
Uttar Pradesh
Uttar Pradesh
Tamil Nadu
Uttar Pradesh
Uttar Pradesh
Rajasthan
Jharkhand
Uttar Pradesh
Maharashtra
Punjab
Punjab
Delhi
Faridabad
Bhiwadi
Patna
Dehradun
Varanasi
Ghaziabad
Muzaffarpur
Hapur
Amritsar
Jharia
Gurgaon
Bareilly
Firozabad
Ranchi
Jaipur
Kanpur
Lucknow
Agra
Moradabad
Noida
Allahabad
Gajraula
Thoothukudi/ Tuticorin
Mathura
Khurja
Jodhpur
Dhanbad
Saharanpur
Lote
SBS Nagar
Jalandhar
268
240
NA
NA
190
145
259
NA
NA
184
230
129
240
194
220
170
195
169
183
168
154
249
176
91
NA
167
151
168
NA
163
NA
151
290
272
262
261
238
236
236
235
235
232
NA
227
226
223
NA
218
217
211
197
195
195
192
191
182
172
170
169
NA
167
NA
160
159
290
272
262
261
238
236
236
235
235
232
230
227
226
223
220
218
217
211
197
195
195
192
191
182
172
170
169
168
167
163
160
159
60
60
60
60
60
60
60
60
60
60
60
60
60
60
60
60
60
60
60
60
60
60
60
60
60
60
60
60
60
60
60
60
20
20
20
20
20
20
20
20
20
20
20
20
20
20
20
20
20
20
20
20
20
20
20
20
20
20
20
20
20
20
20
20
CITY NAAQS WHOSTATE2015
AVERAGE2016
AVERAGE
Yearly AveragePollution Levels
2016 or 2015(Recent)
Uttar Pradesh
Uttar Pradesh
Bihar {converted from PM2.5 (47% of PM )}
Maharashtra
Karnataka
Rajasthan
Jharkhand
Assam
Uttarakhand
Rajasthan
Uttar Pradesh
West Bengal
Maharashtra
Punjab
Uttar Pradesh
Jharkhand
Odisha
Uttar Pradesh
Maharashtra
Uttarakhand
Uttarakhand
West Bengal
Punjab
Nagaland
Rajasthan
Jammu & Kashmir
West Bengal
Assam
West Bengal
Uttar Pradesh
Maharashtra
Meghalaya
Maharashtra
Uttarakhand
Meerut
Gorakhpur
Gaya
Nanded
Tumkur
Alwar
Saraikela Kharsawan
Nagaon
Rudrapur
Udaipur
Rai Bareilly
Burdwan
Dombivli
Ludhiana
Renusagar/Sonbhadra
Jamshedpur
Rajgangpur
Anpara/ Sonbhadra
Mumbai
Haldwani
Haridwar
Dankuni
Mandi Gobindgarh
Dimapur
Bharatpur
Jammu
Uluberia
Golaghat
Kolkata
Unnao
Akola
Byrnihat
Badlapur
Kashipur
NA
162
NA
167
118
227
144
142
125
156
157
NA
103
140
139
135
NA
133
103
139
123
127
130
126
NA
125
125
124
109
118
127
123
103
108
157
154
153
151
144
144
NA
NA
142
142
140
140
140
139
NA
NA
133
133
130
130
128
NA
126
NA
126
NA
NA
NA
124
124
123
NA
122
121
157
154
153
151
144
144
144
142
142
142
140
140
140
139
139
135
133
133
130
130
128
127
126
126
126
125
125
124
124
124
123
123
122
121
60
60
60
60
60
60
60
60
60
60
60
60
60
60
60
60
60
60
60
60
60
60
60
60
60
60
60
60
60
60
60
60
60
60
20
20
20
20
20
20
20
20
20
20
20
20
20
20
20
20
20
20
20
20
20
20
20
20
20
20
20
20
20
20
20
20
20
20
3635

CITY NAAQS WHOSTATE2015
AVERAGE2016
AVERAGE
Yearly AveragePollution Levels
2016 or 2015(Recent)
PM10 Levels across India (Annual Average 2016/2015)APPENDIX-I
Maharashtra
Assam
Chhattisgarh
West Bengal
Assam
Maharashtra
Uttarakhand
Himachal Pradesh
Punjab
Maharashtra
Haryana converted from PM2.5 (47% of PM10)}
West Bengal
Himachal Pradesh
Maharashtra
Maharashtra
Maharashtra
Assam
West Bengal
Punjab
West Bengal
Odisha
Karnataka
West Bengal
West Bengal
Punjab
Jharkhand
Assam
Haryana converted from PM2.5 (47% of PM )}
Odisha
Chhattisgarh
Uttar Pradesh
Chhattisgarh
Punjab
Telangana
Ambernath
Nalbari
Raipur
Haldia
Tinsukia
Panvel
Rishikesh
Kala Amb
Bathinda
Thane
Rohtak
Murshidabad
Paonta Sahib
Ulhasnagar
Taloja
Chandrapur
Margherita
Raniganj
Khanna
Birbhum
Kalinga Nagar
Bidar
Barrackpore
24 Parganas South
Rasulpur
West Singhbhum
Dibrugarh
Panchkula
Paradeep
Raigarh
Jhansi
Bhilai
Patiala
Kothur
NA
121
138
120
119
NA
119
118
111
117
92
NA
116
101
NA
94
114
114
122
NA
100
59
113
NA
NA
111
110
92
110
NA
119
107
110
107
121
NA
121
NA
NA
118
118
NA
117
117
116
116
NA
116
115
115
NA
NA
114
113
113
113
NA
112
112
NA
NA
110
109
109
108
NA
107
NA
121
121
121
120
119
118
118
118
117
117
116
116
116
116
115
115
114
114
114
113
113
113
113
112
112
111
110
110
109
109
108
107
107
107
60
60
60
60
60
60
60
60
60
60
60
60
60
60
60
60
60
60
60
60
60
60
60
60
60
60
60
60
60
60
60
60
60
20
20
20
20
20
20
20
20
20
20
20
20
20
20
20
20
20
20
20
20
20
20
20
20
20
20
20
20
20
20
20
20
20
CITY NAAQS WHOSTATE2015
AVERAGE2016
AVERAGE
Yearly AveragePollution Levels
2016 or 2015(Recent)
Gujarat
Gujarat
Rajasthan
West Bengal
Karnataka
Punjab
Gujarat
Odisha
Himachal Pradesh
Maharashtra
Chandigarh
Gujarat
Gujarat
Assam
Odisha
Gujarat
Gujarat
Maharashtra
Gujarat
Andhra Pradesh
West Bengal
Madhya Pradesh
Gujarat
Maharashtra
West Bengal
Chhattisgarh
Punjab
West Bengal
Odisha
Gujarat
Madhya Pradesh
Punjab
Madhya Pradesh
Nagaland
Madhya Pradesh
Ahmedabad
Vatva/ Ahemdabad
Kota
Bankura
Bangalore
Faridkot
Sanand
Talcher
Damtal
Amravati
Chandigarh
Sarigam
Bhuj
Guwahati
Bhubaneswar
Vapi
Vadodara
Jalgaon
Ankleshwar
Vijayawada
Durgapur
Gwalior
Bharuch
Pune
24 Parganas North
Bilaspur
Dera Bassi
Asansol
Angul
Morbi
Indore
Dera Baba Nanak
Ujjain
Kohima
Pithampur
91
NA
133
NA
119
90
93
136
104
108
85
88
86
98
85
86
86
107
84
109
101
125
83
77
NA
99
96
97
102
93
97
79
95
95
121
107
106
106
106
106
106
105
105
NA
104
104
104
103
103
103
102
102
102
102
101
NA
100
100
99
98
98
97
NA
97
97
96
95
NA
NA
95
107
106
106
106
106
106
105
105
104
104
104
104
103
103
103
102
102
102
102
101
101
100
100
99
98
98
97
97
97
97
96
95
95
95
95
60
60
60
60
60
60
60
60
60
60
60
60
60
60
60
60
60
60
60
60
60
60
60
60
60
60
60
60
60
60
60
60
60
60
60
20
20
20
20
20
20
20
20
20
20
20
20
20
20
20
20
20
20
20
20
20
20
20
20
20
20
20
20
20
20
20
20
20
20
20
3837

CITY NAAQS WHOSTATE2015
AVERAGE2016
AVERAGE
Yearly AveragePollution Levels
2016 or 2015(Recent)
PM10 Levels across India (Annual Average 2016/2015)APPENDIX-I
West Bengal
Odisha
Odisha
Gujarat
Maharashtra
Telangana
Gujarat
Maharashtra
Arunachal Pradesh
Punjab
Gujarat
West Bengal
Maharashtra
Gujarat
Punjab
West Bengal
Madhya Pradesh
Assam
Maharashtra
West Bengal
Dadra and Nagar Haveli
Himachal Pradesh
Andhra Pradesh
Himachal Pradesh
West Bengal
Karnataka
Madhya Pradesh
West Bengal
Odisha
Odisha
Karnataka
West Bengal
Maharashtra
Andhra Pradesh
Tamil Nadu
Hooghly
Puri
Konark
Surat
Navi Mumbai
Hyderabad
Jamnagar
Kolhapur
Itanagar
Sangrur
Rajkot
Madinipore West
Aurangabad
Bhavnagar
Naya Nangal
South Suburban/Kolkata
Jabalpur
Tezpur
Jalna
Siliguri
Khadoli
Nalagarh
Guntur
Baddi
Howrah
Raichur
Bhopal
Kalyani
Jharsuguda
Rourkela
Hubli
Malda
Nashik
Vizianagaram
Trichy
NA
87
88
89
126
92
85
97
92
100
83
NA
83
NA
82
90
90
90
115
89
89
89
100
88
124
92
155
87
NA
104
81
82
77
84
85
94
94
94
93
93
93
93
92
NA
92
92
92
91
91
90
NA
NA
NA
90
NA
NA
NA
88
NA
88
88
87
NA
87
87
87
86
86
86
NA
94
94
94
93
93
93
93
92
92
92
92
92
91
91
90
90
90
90
90
89
89
89
88
88
88
88
87
87
87
87
87
86
86
86
85
60
60
60
60
60
60
60
60
60
60
60
60
60
60
60
60
60
60
60
60
60
60
60
60
60
60
60
60
60
60
60
60
60
60
60
20
20
20
20
20
20
20
20
20
20
20
20
20
20
20
20
20
20
20
20
20
20
20
20
20
20
20
20
20
20
20
20
20
20
20
CITY NAAQS WHOSTATE2015
AVERAGE2016
AVERAGE
Yearly AveragePollution Levels
2016 or 2015(Recent)
Andhra Pradesh
Telangana
Meghalaya
Karnataka
Odisha
Daman and Diu
Maharashtra
Tamil Nadu
Maharashtra
Odisha
Himachal Pradesh
Madhya Pradesh
Odisha
Himachal Pradesh
Maharashtra
Assam
Madhya Pradesh
West Bengal
Odisha
Andhra Pradesh
Telangana
Madhya Pradesh
Telangana
Maharashtra
Karnataka
Jharkhand
West Bengal
West Bengal
Punjab
Assam
Madhya Pradesh
Andhra Pradesh
Karnataka
Karnataka
Tamil Nadu
Anantapur
Patancheru
Umsning
Davangere
Balasore
Daman
Solapur
Madurai
Nagpur
Keonjhar
Sunder Nagar
Singrauli
Cuttack
Una
Sangli
Lakhimpur
Chhindwara
Madinipore East
Sambalpur
Visakhapatnam
Medak
Sagar
Mahaboobnagar
Latur
Dharwad
Sindri
Jalpaiguri
Dinajpur North
Hoshiarpur
Silcher
Katni
Srikakulam
Kolar
Gulbarga
Chennai
88
85
84
109
82
83
74
64
83
80
82
90
81
80
77
79
84
NA
77
61
NA
102
NA
78
69
75
NA
NA
73
72
NA
72
63
95
81
85
NA
NA
84
83
NA
82
82
82
82
NA
81
81
NA
79
NA
78
78
78
77
77
77
77
76
75
NA
75
73
NA
NA
72
72
72
72
71
85
85
84
84
83
83
82
82
82
82
82
81
81
80
79
79
78
78
78
77
77
77
77
76
75
75
75
73
73
72
72
72
72
72
71
60
60
60
60
60
60
60
60
60
60
60
60
60
60
60
60
60
60
60
60
60
60
60
60
60
60
60
60
60
60
60
60
60
60
60
20
20
20
20
20
20
20
20
20
20
20
20
20
20
20
20
20
20
20
20
20
20
20
20
20
20
20
20
20
20
20
20
20
20
20
4039

CITY NAAQS WHOSTATE2015
AVERAGE2016
AVERAGE
Yearly AveragePollution Levels
2016 or 2015(Recent)
PM10 Levels across India (Annual Average 2016/2015)APPENDIX-I
Andhra Pradesh
Assam
Madhya Pradesh
Maharashtra
Telangana
Assam
Arunachal Pradesh
Maharashtra
Madhya Pradesh
Andhra Pradesh
Telangana
Telangana
Andhra Pradesh
Goa
Karnataka
Andhra Pradesh
Andhra Pradesh
Telangana
West Bengal
Andhra Pradesh
Andhra Pradesh
Telangana
Andhra Pradesh
Telangana
Himachal Pradesh
Andhra Pradesh
Meghalaya
Odisha
Madhya Pradesh
Chhattisgarh
Odisha
Telangana
Tamil Nadu
Tamil Nadu
Kerala
Eluru
Sivasagar
Satna
Kalyan
Sangareddy
Daranga
Naharlagun
Bhiwandi
Amlai/Shahdol
Kadapa
Ramagundam
Warangal
Kurnool
Goa
Belgaum
Nellore
Ongole
Adilabad
Coochbehar
Rajahmundry
Chittoor
Nizamabad
Kakinada
Nalgonda
Parwanoo
Tirupati
Shillong
Rayagada
Nagda
Korba
Berhampur
Kothagudem
Coimbatore
Mettur
Thrissur
77
70
88
NA
70
69
69
NA
NA
70
65
58
82
55
64
66
67
NA
NA
62
67
NA
62
76
60
62
59
50
59
65
54
NA
46
49
48
70
NA
70
70
NA
NA
NA
69
69
69
68
67
67
66
66
66
65
65
63
63
63
63
62
60
NA
60
NA
59
NA
58
58
58
58
56
55
70
70
70
70
70
69
69
69
69
69
68
67
67
66
66
66
65
65
63
63
63
63
62
60
60
60
59
59
59
58
58
58
58
56
55
60
60
60
60
60
60
60
60
60
60
60
60
60
60
60
60
60
60
60
60
60
60
60
60
60
60
60
60
60
60
60
60
60
60
60
20
20
20
20
20
20
20
20
20
20
20
20
20
20
20
20
20
20
20
20
20
20
20
20
20
20
20
20
20
20
20
20
20
20
20
CITY NAAQS WHOSTATE2015
AVERAGE2016
AVERAGE
Yearly AveragePollution Levels
2016 or 2015(Recent)
Himachal Pradesh
Karnataka
Kerala
Kerala
Telangana
Tamil Nadu
Kerala
Kerala
Kerala
Tamil Nadu
Karnataka
Kerala
Telangana
Karnataka
Assam
Himachal Pradesh
Karnataka
Kerala
Karnataka
Mizoram
Kerala
Karnataka
Kerala
Mizoram
Karnataka
Kerala
Meghalaya
Himachal Pradesh
Meghalaya
Kerala
Puducherry
Puducherry
Kerala
Mizoram
Mizoram
Meghalaya
West Bengal
Meghalaya
Kerala
Karnataka
Shimla
Bellary
Kottayam
Thiruvananthapuram
Karimnagar
Salem
Kochi
Kozhikode
Wayanad
Cuddalore
Mysore
Kannur
Khammam
Mangalore
Bongaigaon
Manali
Chitradurg
Kollam
Mandya
Aizawl
Kasargod
Karwar
Palakkad
Lunglei
Bhadravati
Malappuram
Khliehriat
Dharamshala
Dawki
Idukki
Karaikal
Pondicherry
Alappuzha
Kolasib
Champhai
Tura
Darjeeling
Nongstoin
Pathanamthitta
Hassan
55
NA
61
55
64
54
40
48
37
56
49
NA
60
36
47
47
47
46
42
44
NA
NA
47
40
NA
44
37
36
36
NA
35
35
45
33
33
30
NA
26
24
25
NA
54
54
53
52
51
51
51
50
49
48
48
48
47
NA
NA
46
46
45
NA
42
42
41
NA
38
37
NA
NA
NA
35
NA
NA
35
NA
NA
NA
29
NA
26
26
55
54
54
53
52
51
51
51
50
49
48
48
48
47
47
47
46
46
45
44
42
42
41
40
38
37
37
36
36
35
35
35
35
33
33
30
29
26
26
26
60
60
60
60
60
60
60
60
60
60
60
60
60
60
60
60
60
60
60
60
60
60
60
60
60
60
60
60
60
60
60
60
60
60
60
60
60
60
60
60
20
20
20
20
20
20
20
20
20
20
20
20
20
20
20
20
20
20
20
20
20
20
20
20
20
20
20
20
20
20
20
20
20
20
20
20
20
20
20
20
4241

CITY NAAQS WHOSTATE2015
AVERAGE2016
AVERAGE
Yearly AveragePollution Levels
2016 or 2015(Recent)
PM10 Levels across India (Annual Average 2016/2015)APPENDIX-I
Andhra Pradesh
Assam
Madhya Pradesh
Maharashtra
Telangana
Assam
Arunachal Pradesh
Maharashtra
Madhya Pradesh
Andhra Pradesh
Telangana
Telangana
Andhra Pradesh
Goa
Karnataka
Andhra Pradesh
Andhra Pradesh
Telangana
West Bengal
Andhra Pradesh
Andhra Pradesh
Telangana
Andhra Pradesh
Telangana
Himachal Pradesh
Andhra Pradesh
Meghalaya
Odisha
Madhya Pradesh
Chhattisgarh
Odisha
Telangana
Tamil Nadu
Tamil Nadu
Kerala
Eluru
Sivasagar
Satna
Kalyan
Sangareddy
Daranga
Naharlagun
Bhiwandi
Amlai/Shahdol
Kadapa
Ramagundam
Warangal
Kurnool
Goa
Belgaum
Nellore
Ongole
Adilabad
Coochbehar
Rajahmundry
Chittoor
Nizamabad
Kakinada
Nalgonda
Parwanoo
Tirupati
Shillong
Rayagada
Nagda
Korba
Berhampur
Kothagudem
Coimbatore
Mettur
Thrissur
77
70
88
NA
70
69
69
NA
NA
70
65
58
82
55
64
66
67
NA
NA
62
67
NA
62
76
60
62
59
50
59
65
54
NA
46
49
48
70
NA
70
70
NA
NA
NA
69
69
69
68
67
67
66
66
66
65
65
63
63
63
63
62
60
NA
60
NA
59
NA
58
58
58
58
56
55
70
70
70
70
70
69
69
69
69
69
68
67
67
66
66
66
65
65
63
63
63
63
62
60
60
60
59
59
59
58
58
58
58
56
55
60
60
60
60
60
60
60
60
60
60
60
60
60
60
60
60
60
60
60
60
60
60
60
60
60
60
60
60
60
60
60
60
60
60
60
20
20
20
20
20
20
20
20
20
20
20
20
20
20
20
20
20
20
20
20
20
20
20
20
20
20
20
20
20
20
20
20
20
20
20
CITY NAAQS WHOSTATE2015
AVERAGE2016
AVERAGE
Yearly AveragePollution Levels
2016 or 2015(Recent)
Himachal Pradesh
Karnataka
Kerala
Kerala
Telangana
Tamil Nadu
Kerala
Kerala
Kerala
Tamil Nadu
Karnataka
Kerala
Telangana
Karnataka
Assam
Himachal Pradesh
Karnataka
Kerala
Karnataka
Mizoram
Kerala
Karnataka
Kerala
Mizoram
Karnataka
Kerala
Meghalaya
Himachal Pradesh
Meghalaya
Kerala
Puducherry
Puducherry
Kerala
Mizoram
Mizoram
Meghalaya
West Bengal
Meghalaya
Kerala
Karnataka
Shimla
Bellary
Kottayam
Thiruvananthapuram
Karimnagar
Salem
Kochi
Kozhikode
Wayanad
Cuddalore
Mysore
Kannur
Khammam
Mangalore
Bongaigaon
Manali
Chitradurg
Kollam
Mandya
Aizawl
Kasargod
Karwar
Palakkad
Lunglei
Bhadravati
Malappuram
Khliehriat
Dharamshala
Dawki
Idukki
Karaikal
Pondicherry
Alappuzha
Kolasib
Champhai
Tura
Darjeeling
Nongstoin
Pathanamthitta
Hassan
55
NA
61
55
64
54
40
48
37
56
49
NA
60
36
47
47
47
46
42
44
NA
NA
47
40
NA
44
37
36
36
NA
35
35
45
33
33
30
NA
26
24
25
NA
54
54
53
52
51
51
51
50
49
48
48
48
47
NA
NA
46
46
45
NA
42
42
41
NA
38
37
NA
NA
NA
35
NA
NA
35
NA
NA
NA
29
NA
26
26
55
54
54
53
52
51
51
51
50
49
48
48
48
47
47
47
46
46
45
44
42
42
41
40
38
37
37
36
36
35
35
35
35
33
33
30
29
26
26
26
60
60
60
60
60
60
60
60
60
60
60
60
60
60
60
60
60
60
60
60
60
60
60
60
60
60
60
60
60
60
60
60
60
60
60
60
60
60
60
60
20
20
20
20
20
20
20
20
20
20
20
20
20
20
20
20
20
20
20
20
20
20
20
20
20
20
20
20
20
20
20
20
20
20
20
20
20
20
20
20
4241

Disclaimer: Map of India on Cover page, and all maps of the states, in the report should not be used for navigation or legal purposes. It is intended as graphical element to the design layout and does not warrant the Maps or its features to be either spatially or temporally accurate or fit for a particular use. Greenpeace do not claim the correctness or authenticity of the same.
POCALYPSE II
AIR
ASSESSMENT OF AIR POLLUTION IN INDIAN CITIES
Greenpeace Environment TrustNo. 49/23, 2nd Cross StreetEllaiamman ColonyGopalapuramChennai - 600086
Main Office5th Floor, Shubharam Complex,Old No. 22/1, 22/2, New No. 144, 144/2,MG Road, Bengaluru - 560001
Regional OfficeT-95 A, 1st Floor,CL House, Gautam Nagar,New Delhi - 110049
Phone: 011 47665000
Greenpeace is a global organisation that uses non-violent direct action to tackle the most crucial threats to our planet’s biodiversity and environment. Greenpeace is a non-profit organisation, present in 40 countries across Europe, The Americas, Asia and the Pacific.
It speaks for 2.8 million supporters worldwide, and inspires many millions more to take action every day. To maintain its independence, Greenpeace does not accept donations from governments or corporations but relies on contributions from individual supporters and foundation grants.
Greenpeace has been campaigning against environmental degradation since 1971 when a small boat of volunteers and journalists sailed into Amchitka, an area north of Alaska, where the US Government was conducting underground nuclear tests.This tradition of ‘bearing witness’ in a non-violent manner continues today, and ships are an important part of all its campaign work.
Supporter Services: 1800 425 0374/ 080 22131899Toll Free No.: 1800 425 0374 Email: [email protected] www.greenpeace.org/india
Taj Mahal on a hazy winter morning.
© Saagnik Paul / Greenpeace