air quality analysis technical report dolfield aq analysis 10-7-14.pdf · air quality analysis ....
TRANSCRIPT

I-795 AT DOLFIELD BOULEVARD/PLEASANT
HILL ROAD INTERCHANGE STUDY
AIR QUALITY ANALYSIS TECHNICAL REPORT
October 2014
Baltimore County, Maryland
U.S. DEPARTMENT OF TRANSPORTATION MARYLAND DEPARTMENT OF TRANSPORTATION FEDERAL HIGHWAY ADMINISTRATION STATE HIGHWAY ADMINISTRATION

TABLE OF CONTENTS I. INTRODUCTION .......................................................................................................................... 1
II. AIR QUALITY BACKGROUND .................................................................................................... 2
III. ENVIRONMENTAL ANALYSIS ................................................................................................... 5
IV. ENVIRONMENTAL CONSEQUENCES ...................................................................................... 5
1. Carbon Monoxide (CO) Assessment ................................................................... 6
2. Particulate Matter (PM2.5) Assessment ................................................................ 8
3. MSAT Assessment .............................................................................................11
4. Greenhouse Gas Assessment ...........................................................................12
5. Construction Impacts..........................................................................................13
V. AGENCY COORDINATION / INTERAGENCY CONSULTATION .............................................13 APPENDICES
Appendix A: Preferred Alternative Appendix B: Monitored Ambient Air Quality Data 2011-2013 Appendix C: Traffic Data Appendix D: Interagency Consultation
LIST OF TABLES
TABLE 1: National Ambient Air Quality Standards (NAAQS) .................................................... 4 TABLE 2: Ambient Air Quality Monitoring Data 2011-2013 ....................................................... 7 TABLE 3: Traffic Data ................................................................................................................ 8
LIST OF FIGURES FIGURE 1: Project Location ....................................................................................................... 2 FIGURE 2: National MSAT Emission Trends 1999 – 2050 ......................................................12

I-795 AT DOLFIELD BOULEVARD/PLEASANT HILL ROAD INTERCHANGE STUDY 1
I. INTRODUCTION This report presents the results of a review of air quality impacts associated with a proposed interchange between I-795 (Northwest Expressway) and Dolfield Boulevard/Pleasant Hill Road (I-795/Dolfield interchange) and improvements to local intersections near the interchange in Owings Mills, Baltimore County, Maryland. This study is intended as an evaluation of the project level air quality impacts of the proposed interchange and associated improvements. This evaluation is provided to meet the requirements of the Clean Air Act (CAA) and the National Environmental Policy Act (NEPA).
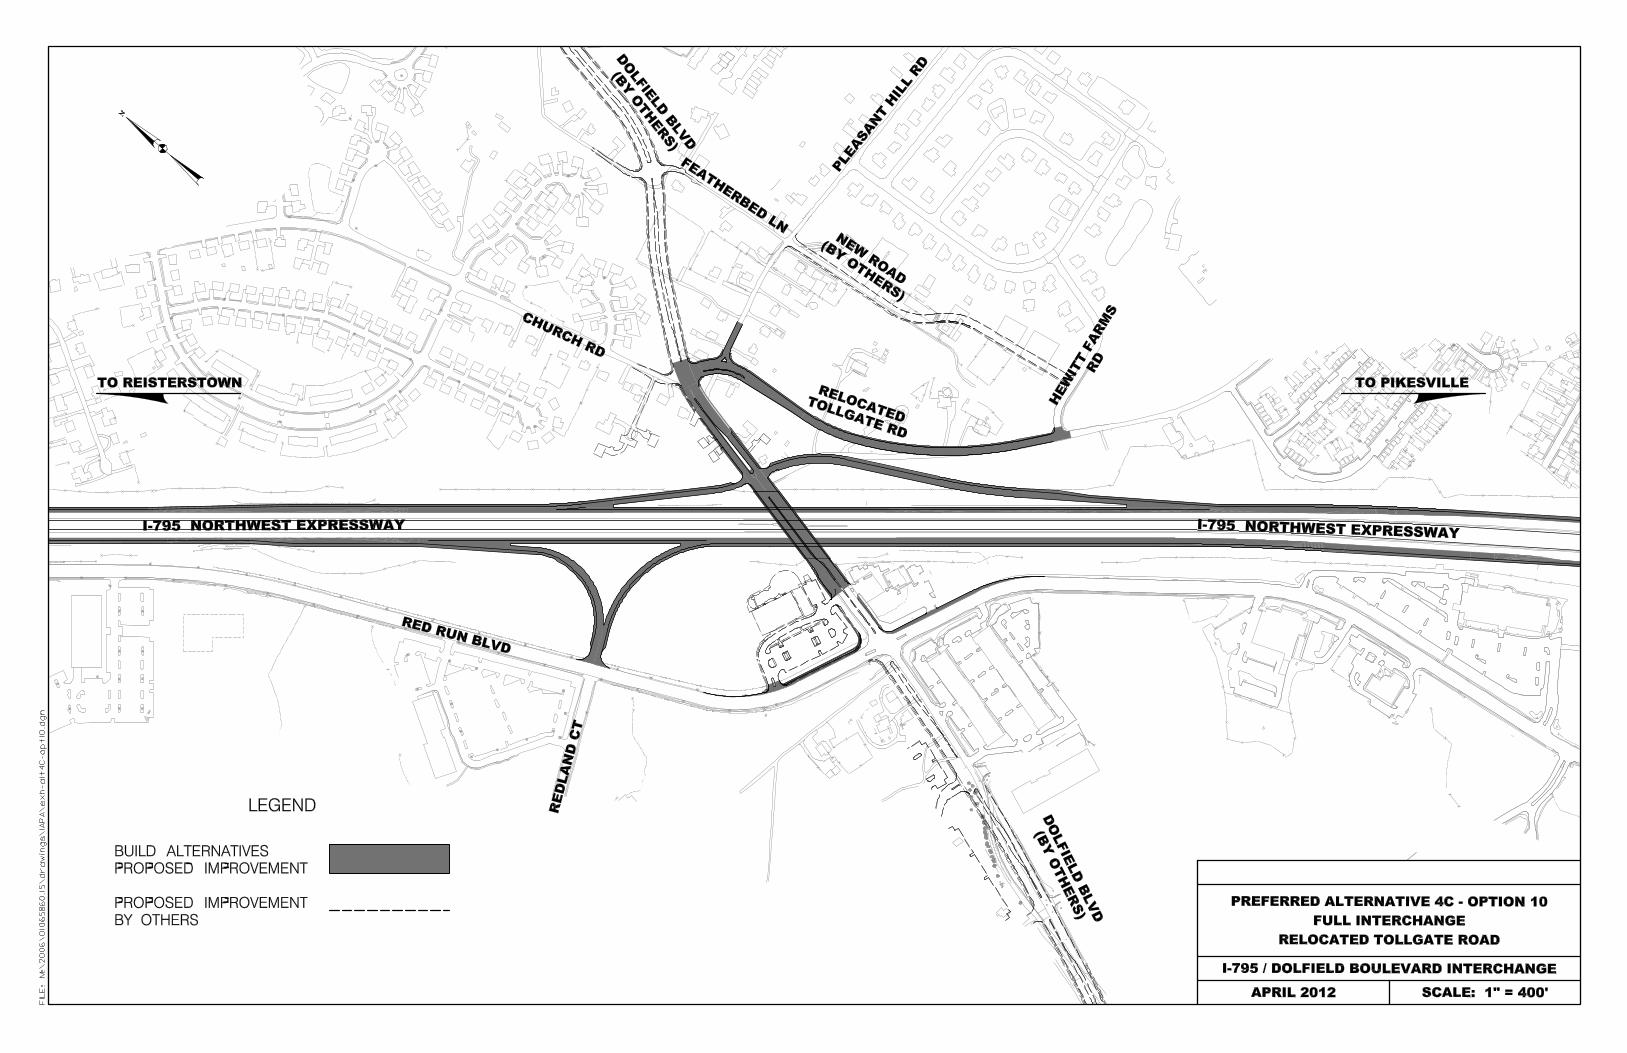
I-795 is a divided urban interstate running north to south that ranges from two to three lanes in both directions. It serves as a commuter route to Baltimore, connecting the Pikesville, Owings Mills, and Reisterstown areas. Land use in the vicinity of the I-795/Dolfield interchange is a mix of forest, residential, commercial, industrial, institutional, and agriculture. The overall study area extends from the Franklin Boulevard/I-795 interchange to the Owings Mills Boulevard/I-795 interchange, including portions of Franklin Boulevard, Pleasant Hill Road, Dolfield Boulevard, and Owings Mills Boulevard for a distance of approximately 1.4 miles (See Figure 1).
The purpose of the I-795/Dolfield interchange project is to improve access to the planned growth and employment corridor along Red Run Boulevard, improve vehicular, transit, pedestrian, and bicycle accessibility at selected intersections, and provide safety and operational improvements along I-795. This will be accomplished by reconstructing the Dolfield Boulevard/Pleasant Hill Road bridge over I-795 to connect the Dolfield Boulevard extension improvements to the east and west, adding a third lane on I-795 in both the northbound and southbound directions from Franklin Boulevard to Owings Mills Boulevard, coordinating with Maryland Transit Administration for improvements to and from the MTA Park and Ride facilities at the Owings Mills Metro Station and new and future Transit Oriented Development (TOD) sites, and intersection improvements of Owings Mills Boulevard at Red Run Boulevard. The Owings Mills Boulevard at Red Run Boulevard intersection improvements include updating pavement marking extension lines for all double left turns, addressing depressed curbs for unmarked pedestrian crossings, installing pedestrian crossing warning signs at the northbound right turn lane on Owings Mills Boulevard, increasing left turn capacity from eastbound Red Run Boulevard to northbound Owings Mills Boulevard, widening Owings Mills Boulevard from two to three through lanes at the intersection, reducing the two westbound thru lanes on Red Run Boulevard to one lane at the intersection of Owings Mills Boulevard, eliminating the yield condition for creation of a free flow right turn lane for southbound Owings Mills Boulevard vehicles, and striping out the second left turn lane on the northbound approach leg. Other work activities include grinding, resurfacing, signing, lighting, pavement marking, signal modification and landscaping. Refer to Appendix A for project design details.

I-795 AT DOLFIELD BOULEVARD/PLEASANT HILL ROAD INTERCHANGE STUDY 2
FIGURE 1 – PROJECT LOCATION
II. AIR QUALITY BACKGROUND The Clean Air Act (CAA) Amendments of 1990 and the Final Transportation Conformity Rule [40 CFR Parts 51 and 93] direct the U.S. Environmental Protection Agency (EPA) to implement environmental policies and regulations that will ensure acceptable levels of air quality. Both the Clean Air Act and the Final Transportation Conformity Rule affect the proposed transportation project.
I-795 AT DOLFIELD BOULEVARD/PLEASANT HILL ROAD INTERCHANGE STUDY 3
According to the CAA Title I, Section 176 (c) 2; “No federal agency may approve, accept, or fund any transportation plan, program, or project unless such plan, program, or project has been found to conform to any applicable State Implementation Plan (SIP) in effect under this act.” The Final Conformity Rule defines conformity as; “Conformity to an implementation plan's purpose of eliminating or reducing the severity and number of violations of the National Ambient Air Quality Standards (NAAQS) and achieving expeditious attainment of such standards; and that such activities will not:
• Cause or contribute to any new violation of any NAAQS in any area; • Increase the frequency or severity of any existing violation of any NAAQS in any
area; or • Delay timely attainment of any NAAQS or any required interim emission
reductions or other milestones in any area.”
To comply with the CAA, the Environmental Protection Agency (EPA) has issued Proposed Rules, Guidance Clarifications, and Final Rules concerning the Conformity Determination of fine and course particulates (PM2.5 and PM10), Draft and Final Rules concerning quantitative analysis of CO and PM2.5, and guidance on analysis of Mobile Source Air Toxics (MSATs). Following is a summary of recent rules and clarifications:
• Transportation Conformity Rule PM2.5 and PM10 Amendments, March 10, 2006; • Final PM Qualitative Guidance Clarification, June 12, 2009; • Final PM Conformity Rule, March 10, 2010; • Draft Transportation Conformity Guidance for Quantitative Hot-spot Analyses in PM2.5
and PM10 Nonattainment and Maintenance Areas, May 26, 2010; • Final Transportation Conformity Guidance for Quantitative Hot-spot Analyses in PM2.5
and PM10 Nonattainment and Maintenance Areas, December 20, 2010; • Final Transportation Conformity Guidance for Quantitative Hot-spot Analyses in CO
Nonattainment and Maintenance Areas, December 2010; • Transportation Conformity Rule Restructuring Amendments, March 2012; • Transportation Conformity Regulations, as of April 2012; • Interim Guidance Update on MSAT Analysis in NEPA, December 6, 2012; and • Revised Air Quality Standards for Particle Pollution, Annual PM2.5 NAAQS, December 14,
2012 • Update to the Transportation Conformity Guidance for Quantitative Hot-Spot Analyses in
PM2.5 and PM10 Nonattainment and Maintenance Areas, November 2013.
As required by the Clean Air Act, National Ambient Air Quality Standards (NAAQS) have been established for six major air pollutants. These pollutants, known as criteria pollutants, are carbon monoxide (CO), nitrogen dioxide (NO2), ozone (O3), particulate matter (PM10& PM2.5), sulfur dioxide (SO2), and lead (pb). These federal standards are summarized in Table 1. The "primary" standards have been established to protect the public health. The "secondary" standards are intended to protect the nation's welfare, accounting for air pollutant effects on soil, water, visibility, materials, vegetation, and other aspects of the general welfare.
Section 107 of the 1977 Clean Air Act Amendment requires that EPA publish a list of all geographic areas in compliance with the NAAQS, as well as those areas not in compliance with the NAAQS. The designation of an area is made on a pollutant-by-pollutant basis. EPA’s area designations consist of: Attainment, Unclassified, Maintenance, and Nonattainment. Ambient air quality is monitored through a network of stations to determine conditions throughout the country. EPA reviews the monitoring data, and areas where air pollution levels persistently exceed the NAAQS may be designated “nonattainment” for one or more pollutants. After a nonattainment area improves

I-795 AT DOLFIELD BOULEVARD/PLEASANT HILL ROAD INTERCHANGE STUDY 4
conditions to meet the standard for a pollutant, it is redesignated as a maintenance area. Typically these designations are applied to entire counties or groups of counties.
In addition to the criteria pollutants for which there are NAAQS, EPA also regulates air toxics. Toxic air pollutants are those pollutants known or suspected to cause cancer or other serious health effects. Most air toxics originate from human-made sources, including on-road mobile sources, non-road mobile sources (e.g., airplanes), area sources (e.g., dry cleaners), and stationary sources (e.g., factories or refineries). The Clean Air Act (CAA) identified 188 air toxics. In 2001 EPA identified a list of 21 Mobile Source Air Toxics (MSATs), and highlighted six of these MSATs as “priority” MSAT.
TABLE 1 NATIONAL AMBIENT AIR QUALITY STANDARDS (NAAQS)
Pollutant Primary/ Secondary
Primary Standards Form Level Averaging Time Carbon
Monoxide 76 FR 54294
Primary 9 ppm 8-hour Not to be exceeded more than
once per year 35 ppm 1-hour
Lead 73 FR 669964
Primary and Secondary
0.15 µg/m3
Rolling 3-Month
Average
Not to be exceeded
Nitrogen Dioxide
75 FR 6464
Primary 100 ppb 1-hour 98th percentile, averaged over 3 years
Primary and Secondary 53 ppb Annual Annual Mean
Particulate Matter (PM10) 71 FR 61144
Primary and Secondary 150 µg/m 24-hour
Not to be exceeded more than once per year on average over
3 years
Particulate Matter (PM2.5) 71 FR 61144
Primary 12 µg/m3 Annual Annual mean averaged over 3 years
Secondary 15 µg/m3 Annual Annual mean averaged over 3 years
Primary and Secondary 35 µg/m3 24-hour 98th percentile, averaged over
3 years
Ozone 73 FR 16436
Primary and Secondary
0.075 ppm
8-hour
Annual fourth highest daily maximum 8-hour
concentration, averaged over 3 years
Sulfur Dioxide
75 FR 35520
Primary 75 ppb 1-hour Not to be exceeded more than once per year Secondary 0.5 ppm 3-hour

I-795 AT DOLFIELD BOULEVARD/PLEASANT HILL ROAD INTERCHANGE STUDY 5
III. ENVIRONMENTAL ANALYSIS
The I-795/Dolfield interchange project is located in Baltimore County, Maryland, which is included as a part of the Baltimore Metropolitan Statistical Area (MSA). The region has been classified as serious nonattainment with respect to the 1997 eight-hour ozone standard and nonattainment of the 1997 fine particulate (PM2.5) standard. A portion of the MSA, the Baltimore Central Business District (CBD), had been non-attainment for carbon monoxide; however, this area has been re-designated as a CO Maintenance Area. This CO Maintenance Area is only the Baltimore CBD and does not extend to Baltimore County.
Transportation programs and plans must be evaluated for “conformity” to the applicable State Implementation Plan (SIP) provisions before projects can receive Federal funding. Metropolitan Planning Organizations (MPOs) are designated to evaluate projects and develop conforming transportation plans for the assigned MSAs, and to document project and plan conformity with SIP provisions. This is done through the development of Transportation Improvement Programs (TIP) and Long Range Plans (LRP). The TIP generally presents the SIP-conforming projects anticipated in an MSA over the next several years while a LRP covers a longer period. On a regional level, a project is considered to be conforming if it is a part of a conforming TIP and LRP.
For the Baltimore region, the Baltimore Regional Transportation Board (BRTB), which is part of the Baltimore Metropolitan Council (BMC), serves as the MPO. Baltimore County is a member of the BMC. As the MPO, BRTB develops the TIP and LRP for the region, including Baltimore County. Furthermore, it performs the related regional conformity analysis. The current LRP, referred to as the Long Range Metropolitan Transportation Plan: Plan It 2035, was adopted by BRTB on November 14, 2011. The latest TIP, covering the period 2014 to 2017, was adopted by BRTB on November 26, 2013.
The proposed project is included in the CLRP Plan It 2035 as a highway project, under ID 20 with the project name I-795. The CLRP describes the project with limits from Franklin Boulevard to south of Owings Mills Boulevard with widening from four to six lanes, including addition of auxiliary lanes to Owings Mills Boulevard and a new interchange at Dolfield Boulevard. The 2014-2017 TIP was amended by Resolution #15-2 on July 22, 2014, to include the current design project under TIP ID 63-0803-46 and accepted by FHWA on September 2, 2014.
IV. ENVIRONMENTAL CONSEQUENCES In addition to the regional conformity analysis, any Federally funded project within a nonattainment or maintenance area for carbon monoxide or particulate matter must be analyzed at the project-level. At the project level, the pollutants could possibly have localized (“hot-spot”) levels above the criteria. Although the I-795/Dolfield project is not in a CO nonattainment or maintenance area subject to the requirements of 40 CFR 93.116 concerning conformity determination, a qualitative CO assessment has been included. Since Baltimore County is a nonattainment area for PM2.5, a project-specific PM2.5 assessment has also been provided.
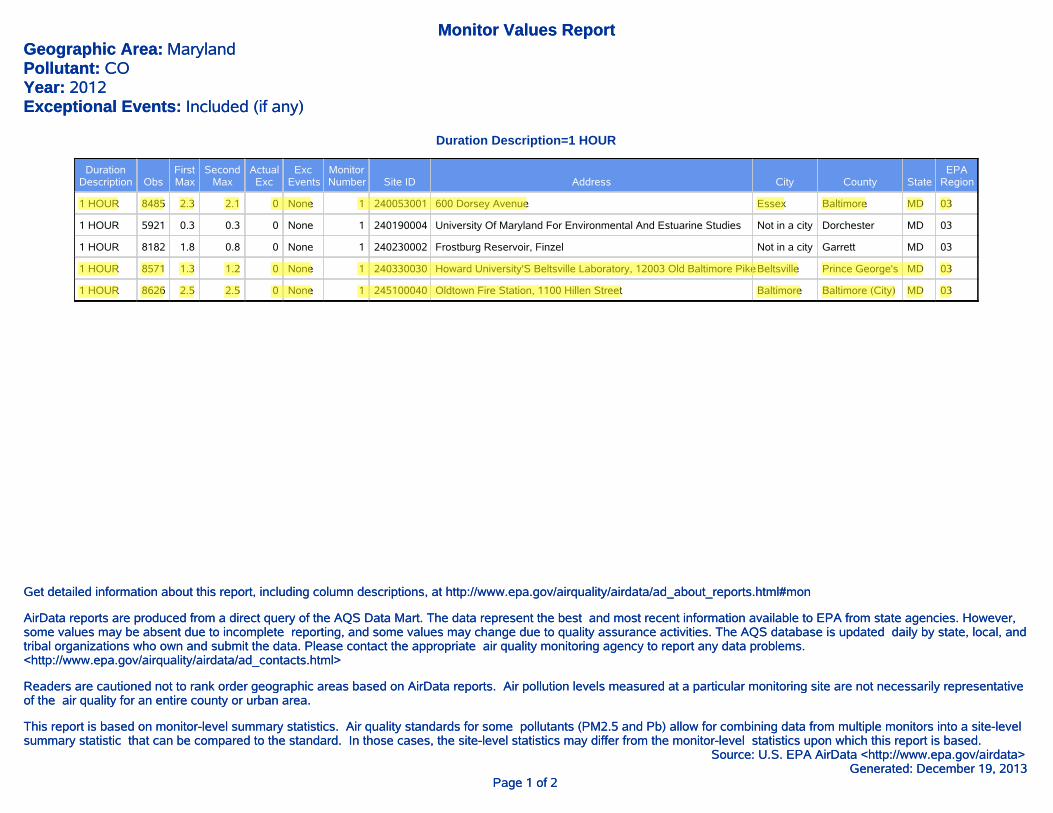
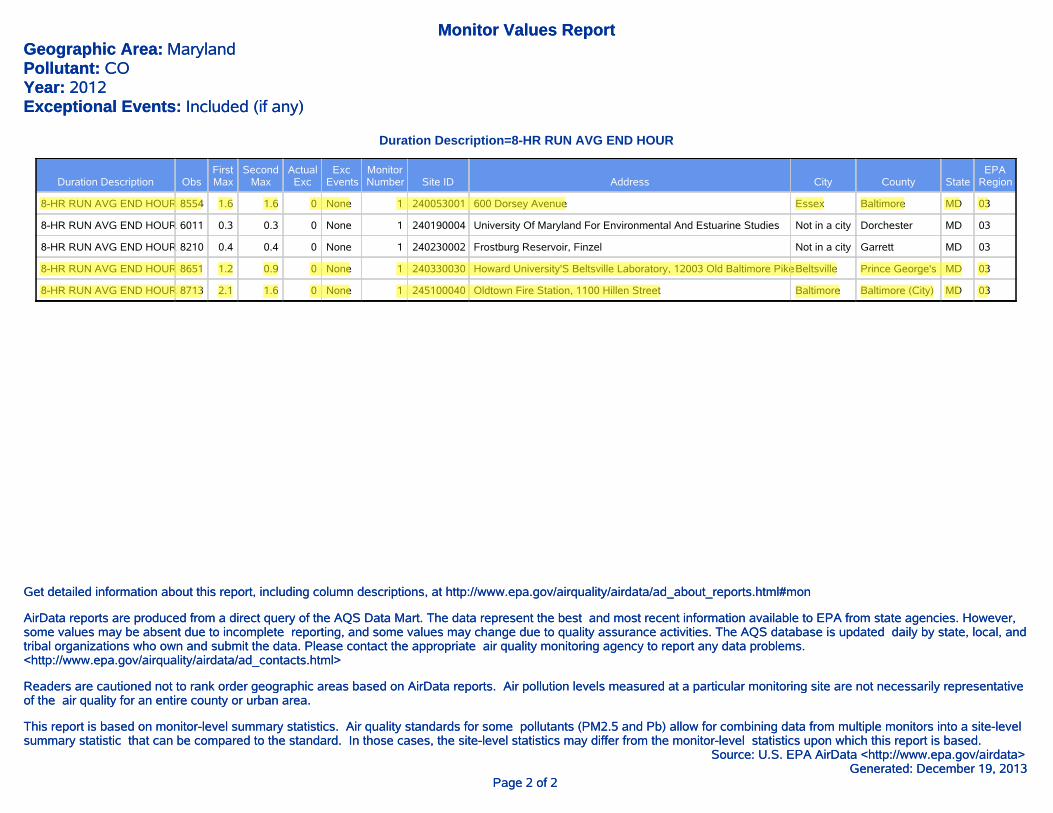
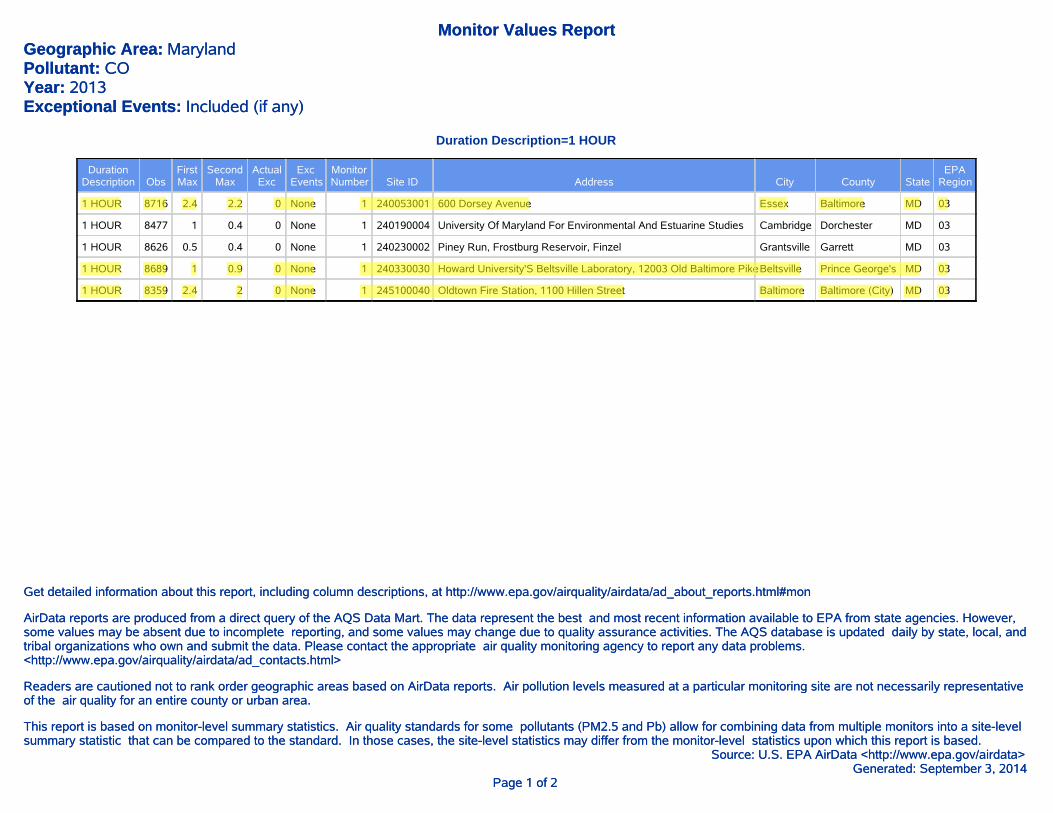
The closest MDE air monitoring station for the study area is located at the Northwest Police Station in Baltimore (City), Maryland. In addition, monitoring data is available at other Maryland monitoring stations including those located at Northwest Police Station in Baltimore City, Padonia Elementary School in Cockeysville, Oldtown Fire Station in Baltimore City, 600 Dorsey Avenue in Essex, and Howard University Lab in Beltsville. All sites are in EPA Region 3. Monitored air quality data within or near the study area for the years 2011-2013 is presented in Table 2. Monitoring information is located in Appendix B.

I-795 AT DOLFIELD BOULEVARD/PLEASANT HILL ROAD INTERCHANGE STUDY 6
1. Carbon Monoxide (CO) Assessment
A portion of the Baltimore Metropolitan Statistical Area (MSA) is considered to be a maintenance area in terms of carbon monoxide (CO). This maintenance area only encompasses the Central Business District of Baltimore City, which previously had been in nonattainment. Baltimore County is not included in this maintenance area, and therefore is not located within a CO nonattainment or a maintenance area. There has not been a local violation of the CO standard since 1988. Code of Federal Regulations Title 40, Part 93-Subpart A (40CFR93A) implements section 176(c) of the Clean Air Act (CAA), as amended (42 U.S.C. 7401 et seq.). Paragraph 40CFR93.102(b):Geographic Applicability states that the provisions of the subpart apply in all nonattainment and maintenance areas for transportation-related criteria pollutants for which the area is designated nonattainment or has a maintenance plan. Since the study area is not in a CO nonattainment or maintenance area, a hot-spot conformity determination in conformance with 40 CFR 93.116 is not required, and a qualitative assessment that considers local factors is provided hereinafter.
As shown in Table 2, the maximum 1-hour monitored CO concentration of 2.5 ppm occurred in 2012 at Site 245100040, located at the Oldtown Fire Station in Baltimore, Maryland. This concentration is only 7.1 percent of the 1-hour CO NAAQS of 35.0 ppm. The maximum 8-hour monitored CO concentration of 2.1 ppm occurred in the same year at the same site, which is only 23.3 percent of the 8-hour NAAQS of 9.0 ppm.
As shown in Table 3, significant changes to traffic volumes and/or vehicle mix are not predicted to occur because of this project (see Appendix C for details). The I-795/Dolfield interchange project does not result in significant traffic volumes, or changes in vehicle mix or other factors that would cause an increase in CO emissions relative to the No-Build conditions.
In conclusion, because the data presented in Table 2 demonstrates monitored CO concentrations in the project area are a small percentage of the CO NAAQS, and the data in Table 3 demonstrates the improvements will not result in significant increases in traffic volumes or changes in vehicle mix relative to the No-Build conditions, the construction of the I-795/Dolfield interchange will not cause or contribute to a new violation of the CO NAAQS.

I-795 AT DOLFIELD BOULEVARD/PLEASANT HILL ROAD INTERCHANGE STUDY 7
TABLE 2
Ambient Air Quality Data 2011-2013
Site 240053001 600 Dorsey Avenue
Essex MD
Site 240330030 Howard University Lab
Beltsville MD
Site 245100040 Oldtown Fire Station
Baltimore MD
2011 2012 2013 2011 2012 2013 2011 2012 2013
Carbon Monoxide
(CO) [ppm]
1-Hour
1st Maximum 2.3 2.3 2.4 1.7 1.3 1 2.3 2.5 2.4
2nd Maximum 2.3 2.1 2.2 1.3 1.2 0.9 2.2 2.5 2
Actual Exceedances 0 0 0 0 0 0 0 0 0
8-Hour
1st Maximum 1.7 1.6 1.6 1.1 1.2 0.9 1.8 2.1 1.6
2nd Maximum 1.6 1.6 1.4 0.8 0.9 0.9 1.5 1.6 1.3
Actual Exceedances 0 0 0 0 0 0 0 0 0
Site 245100007 Northwest Police Station
Baltimore MD
Site 240051007 Padonia Elementary School
Cockeysville MD
Site 245100040 Oldtown Fire Station
Baltimore MD
2011 2012 2013 2011 2012 2013 2011 2012 2013
Particulate Matter (PM2.5) [ug/m3]
24-Hour
98th Percentile 24 22 20 27 22 20 25 23 23
Weighted Annual Mean 10 9.3 8.6 10 9.1 8.5 10.8 10 9.1
I-795 AT DOLFIELD BOULEVARD/PLEASANT HILL ROAD INTERCHANGE STUDY 8
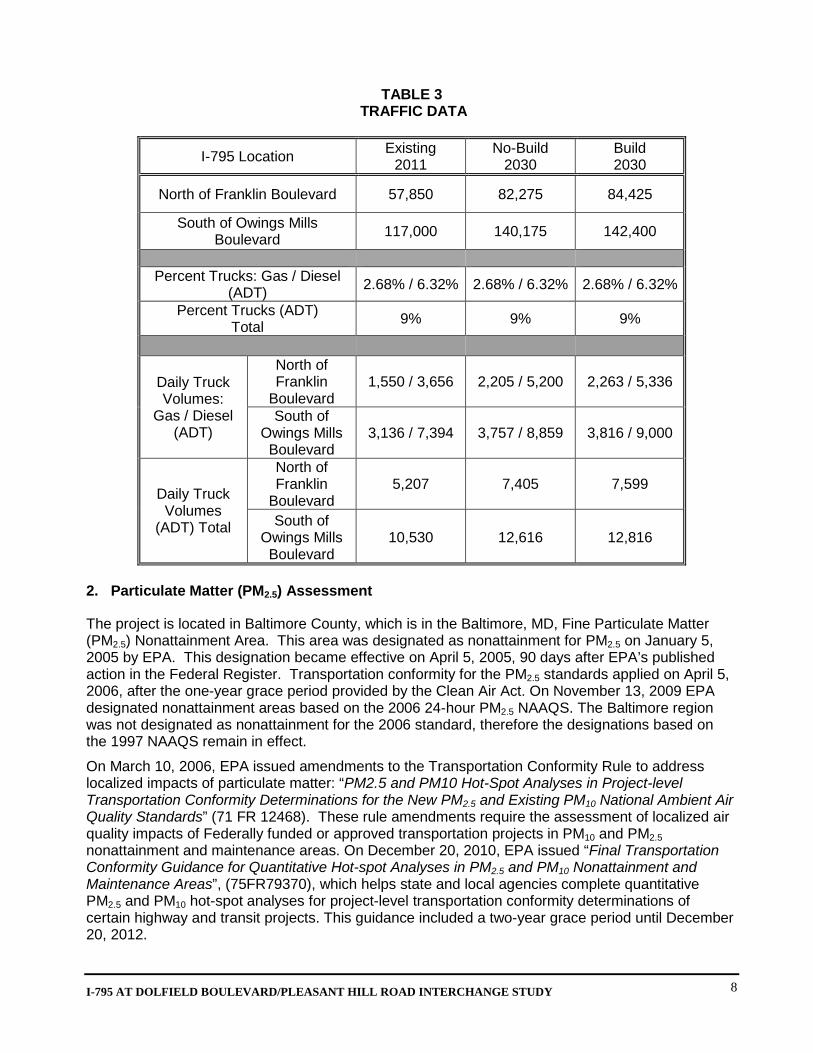
TABLE 3 TRAFFIC DATA
I-795 Location Existing 2011
No-Build 2030
Build 2030
North of Franklin Boulevard 57,850 82,275 84,425
South of Owings Mills Boulevard 117,000 140,175 142,400
Percent Trucks: Gas / Diesel
(ADT) 2.68% / 6.32% 2.68% / 6.32% 2.68% / 6.32%
Percent Trucks (ADT) Total 9% 9% 9%
Daily Truck Volumes:
Gas / Diesel (ADT)
North of Franklin
Boulevard 1,550 / 3,656 2,205 / 5,200 2,263 / 5,336
South of Owings Mills Boulevard
3,136 / 7,394 3,757 / 8,859 3,816 / 9,000
Daily Truck Volumes
(ADT) Total
North of Franklin
Boulevard 5,207 7,405 7,599
South of Owings Mills Boulevard
10,530 12,616 12,816
2. Particulate Matter (PM2.5) Assessment
The project is located in Baltimore County, which is in the Baltimore, MD, Fine Particulate Matter (PM2.5) Nonattainment Area. This area was designated as nonattainment for PM2.5 on January 5, 2005 by EPA. This designation became effective on April 5, 2005, 90 days after EPA’s published action in the Federal Register. Transportation conformity for the PM2.5 standards applied on April 5, 2006, after the one-year grace period provided by the Clean Air Act. On November 13, 2009 EPA designated nonattainment areas based on the 2006 24-hour PM2.5 NAAQS. The Baltimore region was not designated as nonattainment for the 2006 standard, therefore the designations based on the 1997 NAAQS remain in effect.
On March 10, 2006, EPA issued amendments to the Transportation Conformity Rule to address localized impacts of particulate matter: “PM2.5 and PM10 Hot-Spot Analyses in Project-level Transportation Conformity Determinations for the New PM2.5 and Existing PM10 National Ambient Air Quality Standards” (71 FR 12468). These rule amendments require the assessment of localized air quality impacts of Federally funded or approved transportation projects in PM10 and PM2.5 nonattainment and maintenance areas. On December 20, 2010, EPA issued “Final Transportation Conformity Guidance for Quantitative Hot-spot Analyses in PM2.5 and PM10 Nonattainment and Maintenance Areas”, (75FR79370), which helps state and local agencies complete quantitative PM2.5 and PM10 hot-spot analyses for project-level transportation conformity determinations of certain highway and transit projects. This guidance included a two-year grace period until December 20, 2012.

I-795 AT DOLFIELD BOULEVARD/PLEASANT HILL ROAD INTERCHANGE STUDY 9
Projects that require hotspot analysis for PM2.5 are those that are Projects of Air Quality Concern as enumerated in 40 CFR 93.123(b)(1):
(i) New highway projects that have a significant number of diesel vehicles, and expanded projects that have a significant increase in the number of diesel vehicles;
(ii) Projects affecting intersections that are at Level-of-Service D, E, or F with a significant number of diesel vehicles, or those that will change to Level-of-Service D, E, or F because of increased traffic volumes from a significant number of diesel vehicles related to the project;
(iii) New bus and rail terminals and transfer points that significantly increase the number of diesel vehicles congregating at a single location;
(iv) Expanded bus and rail terminals and transfer points that significantly increase the number of diesel vehicles congregating at a single location; and
(v) Projects in or affecting locations, areas, or categories of sites which are identified in the PM10 or PM2.5 applicable implementation plan or implementation plan submission, as appropriate, as sites of violation or possible violations.
As discussed in the examples of the preamble to the March 10, 2006 Final Rule for PM2.5 and PM10 Hot-Spot Analyses in Project-Level Transportation Conformity Determinations (71 FR 12491), for projects involving the expansion of an existing highway, 40 CFR 93.123(b)(1)(i) has been interpreted as applying only to projects that would involve a significant increase in the number of diesel transit buses and diesel trucks on the existing facility.
Determination as to whether the I-795/Dolfield interchange project is a Project of Air Quality Concern will be finalized by Interagency Consultation. To assist with the Interagency Consultation process, SHA has prepared the following assessment of the proposed improvements:
• The I-795/Dolfield interchange project is considered under the following paragraphs of 40 CFR 93:
o 40 CFR 92.123(b)(1)(i), as amended, which includes “New highway projects that have a significant number of diesel vehicles, and expanded projects that have a significant increase in the number of diesel vehicles.”
• The proposed improvements do not meet the criteria set forth in 40 CFR 93.123(b)(1)(i) to be considered a project of “air quality concern” based on the following considerations:
o The proposed project involves reconstructing the Dolfield Boulevard/Pleasant Hill
Road bridge over I-795 to connect Dolfield Boulevard extension improvements to the east and west, adding a third lane on I-795 in both the northbound and southbound directions from Franklin Boulevard to Owings Mills Boulevard, coordinating with Maryland Transit Administration for improvements to and from the MTA Park and Ride facilities at the Owings Mills Metro Station and new and future Transit Oriented Development (TOD) sites, and intersection improvements of Owings Mills Boulevard at Red Run Boulevard. The Owings Mills Boulevard at Red Run Boulevard intersection improvements include updating pavement marking extension lines for all double left turns, addressing depressed curbs for unmarked pedestrian crossings, installing pedestrian crossing warning signs at the northbound right turn lane on Owings Mills Boulevard, increasing left turn capacity from eastbound Red Run Boulevard to northbound Owings Mills Boulevard, widening Owings Mills Boulevard from two to three through lanes at the intersection, reducing westbound two thru lanes on Red Run Boulevard to one lane at the intersection of Owings Mills Boulevard, eliminating the yield condition for creation of a free flow right turn lane for southbound Owings Mills Boulevard vehicles, and striping out the second left turn lane on the northbound approach leg.

I-795 AT DOLFIELD BOULEVARD/PLEASANT HILL ROAD INTERCHANGE STUDY 10
o As shown in Table 3, I-795 does not carry a significant number of trucks; nor will there be a significant increase in trucks. For the 2030 No-Build conditions, the total I-795 ADT volume is 82,275 vehicles and the total average daily number of trucks is 7,405 north of Franklin Boulevard. For the 2030 Build conditions, the I-795 ADT volume is 84,425 vehicles and the average daily number of trucks is 7,599 north of Franklin Boulevard. South of Owings Mills Boulevard, for the 2030 No-Build conditions, the total I-795 ADT volume is 140,175 vehicles and the total average daily number of trucks is 12,616. South of Owings Mills Boulevard, for the 2030 Build conditions, the total I-795 ADT volume is 142,400 vehicles and the total average daily number of trucks is 12,816.
o Depicted truck percentages represent the amount of light, medium and heavy truck
activity along a given roadway segment. Unless predicated by significant land use changes (heavy truck generators), existing truck percentages are used as the primary factor in determining future percentages. The Build condition will improve operation of the roadway and intersections, relieving system congestion, but will not necessarily induce new truck traffic origin-destination patterns.
o A review of the traffic data demonstrates that there will not be a "significant” increase
in the number of trucks from the No-Build condition to the Build. The Build condition will improve safety and operation of the roadway, but will not necessarily induce new truck origin-destination patterns.
• Section 176(c) of the Clean Air Act and the Federal Conformity Rule require that
transportation plans and programs conform to the intent of the air quality state implementation plan (SIP) through a regional emissions analysis in PM2.5 nonattainment areas. The Baltimore Regional Transportation Board (BRTB) serves as the Metropolitan Planning Organization (MPO), and therefore it is responsible for the regional conformity determination.
o The currently approved BRTB Long Range Metropolitan Transportation Plan (LRP),
referred to as Plan It 2035, and the 2012-2015 Transportation Improvement Program (TIP) have been determined to conform to the requirements of the Clean Air Act Amendments of 1990. These represent the currently conforming LRP and TIP in accordance with 40 CFR 93.114. The I-795/Dolfield interchange project is included as TIP ID 63-0803-46 in the amended 2014-2017 TIP.
o The current conformity determination is consistent with the final conformity rule found
in 40 CFR Parts 51 and 93. Conformity to the requirements of the Clean Air Act Amendments of 1990 means that the transportation activity will not cause new air quality violations, worsen existing violations, or delay timely attainment of the relevant NAAQS.
Based on review and analysis as discussed above, it is determined that the proposed I-795/Dolfield interchange in Baltimore County will meet the Clean Air Act and 40 CFR 93.109 requirements for Fine Particulate Matter – PM2.5. These requirements are met without a hot-spot analysis because the project has not been found to be a project of air quality concern as defined under 40 CFR 93.123(b)(1). The project will not cause or contribute to a new violation of the PM2.5 NAAQS, or increase the frequency or severity of an existing violation.

I-795 AT DOLFIELD BOULEVARD/PLEASANT HILL ROAD INTERCHANGE STUDY 11
3. MSAT Assessment
The Federal Highway Administration (FHWA) Guidance Update on Mobile Source Air Toxic Analysis in NEPA requires an assessment of Mobile Source Air Toxics (MSATs) under specific conditions. The EPA identified seven compounds with significant contributions from mobile sources that are among the national and regional-scale cancer risk drivers. These seven MSATs are: acrolein; benzene; 1,3-butadiene; diesel exhaust (organic gases and diesel particulate matter); formaldehyde; naphthalene; and polycyclic organic matter. Since the projected No-Build and Build traffic are substantially the same, as reflected in Table 3, the project will have no meaningful impacts on traffic volumes or vehicle mixes. Therefore in accordance with the above referenced FHWA guidance, the project would be considered a Project with No Meaningful Potential MSAT Effects.
The purpose of the I-795/Dolfield interchange project is to improve access to the planned growth and employment corridor along Red Run Boulevard, improve vehicular, transit, pedestrian, and bicycle accessibility at selected intersections, and provide safety and operational improvements along I-795. This will be accomplished by reconstructing the Dolfield Boulevard/Pleasant Hill Road bridge over I-795 to connect Dolfield Boulevard extension improvements to the east and west, adding a third lane on I-795 in both the northbound and southbound directions from Franklin Boulevard to Owings Mills Boulevard, coordinating with Maryland Transit Administration for improvements to and from the MTA Park and Ride facilities at the Owings Mills Metro Station and new and future Transit Oriented Development (TOD) sites, and intersection improvements at Owings Mills Boulevard and Red Run Boulevard. The Owings Mills Boulevard and Red Run Boulevard intersection improvements include updating pavement marking extension lines for all double left turns, addressing depressed curbs for unmarked pedestrian crossings, installing pedestrian crossing warning signs at the northbound right turn lane on Owings Mills Boulevard, increasing left turn capacity from eastbound Red Run Boulevard to northbound Owings Mills Boulevard, widening Owings Mills Boulevard from two to three through lanes at the intersection, reducing westbound two thru lanes on Red Run Boulevard to one lane at the intersection of Owings Mills Boulevard, eliminating the yield condition for creation of a free flow right turn lane for southbound Owings Mills Boulevard vehicles, and striping out the second left turn lane on the northbound approach leg.
This project has been determined to generate minimal air quality impacts for CAA criteria pollutants and has not been linked with any special MSAT concerns. As such, this project will not result in substantial changes in traffic volumes, vehicle mix, basic project location, or any other factor that would cause an increase in MSAT impacts of the project from that of the No-Build alternative.
Moreover, EPA regulations for vehicle engines and fuels will cause overall MSAT emissions to decline significantly over the next several decades. Based on regulations now in effect, an analysis of national trends with EPA's MOVES model forecasts a combined reduction of over 80 percent in the total annual emission rate for the priority MSAT from 2010 to 2050 while vehicle-miles of travel are projected to increase by over 100 percent (see Figure 2). This will both reduce the background level of MSAT as well as the possibility of even minor MSAT emissions from this project.

I-795 AT DOLFIELD BOULEVARD/PLEASANT HILL ROAD INTERCHANGE STUDY 12
FIGURE 2: NATIONAL MSAT EMISSION TRENDS 1999 - 2050
FOR VEHICLES OPERATING ON ROADWAYS USING EPA's MOVES2010b MODEL
Note: Trends for specific locations may be different, depending on locally derived information representing vehicle-miles travelled, vehicle speeds, vehicle mix, fuels, emission control programs, meteorology, and other factors. Source: EPA MOVES2010b model runs conducted during May - June 2012 by FHWA.
4. Greenhouse Gas Assessment Maryland’s Greenhouse Gas Emission Reduction Act of 2009 (GGRA) requires the State to develop and implement a GGRA Plan (the Plan) to reduce greenhouse gas (GHG) emissions 25 percent from the 2006 baseline by 2020. The Plan was published October 2013 and puts the State on track to achieve the 25 percent GHG reduction required by the law. Initiatives outlined in the Plan also will help with restoration of the Chesapeake Bay, improving air quality and improving water quality throughout the State. Currently there are no Federal requirements for consideration of GHG impacts in transportation planning, however the Maryland Department of Transportation (MDOT), in response to the GGRA, is exploring and implementing transportation and land use strategies to reduce GHG emissions programmatically as described in the Plan.

I-795 AT DOLFIELD BOULEVARD/PLEASANT HILL ROAD INTERCHANGE STUDY 13
The general GHG reduction strategies presented for the transportation sector in the Plan include: Transportation Technologies such as vehicle emission and fuel standards, on-road technologies and low emission vehicle initiatives; Public Transportation Initiatives; Pricing Initiatives; GHG Emission Impact evaluation of Major New Transportation Projects; and Bike and Pedestrian Initiatives. Much like environmental habitats, Maryland’s transportation system is a network of interdependent elements and the interactions and synergy between each part impact the transportation system as a whole. GHG emissions from major transportation projects need to be considered as part of the planning process and recognition needs to be made that all projects may not reduce GHG emissions but as a whole the network needs to focus on reductions. Consequently project-level emissions analyses are less informative than analysis conducted at the regional, state, and national scale. EPA has not identified National Ambient Air Quality Standards for GHGs, but has finalized standards and adopted regulations to enable the production of a new generation of clean vehicles along with implementing cleaner fuel standard regulations to achieve significant reductions of GHG emissions. The State Highway Administration continues to strive for improved operations and system efficiency through improved operations which typically goes hand in hand with GHG reductions. System operations improvements such as improved signal timing, roundabouts, reduced vehicle idling, congestion pricing and reduction, smoothing traffic flow, eliminating bottlenecks and encouraging eco-driving are incorporated into many SHA projects. Environmental benefits and consequences are considered on all projects prior to implementation.
5. Construction Impacts
The construction phase of the proposed project has the potential to impact the local ambient air quality by generating fugitive dust through activities such as demolition and materials handling. The State Highway Administration has addressed this possibility by establishing "Specifications for Construction and Materials" which specifies procedures to be followed by contractors involved in site work. The Maryland Air and Radiation Management Administration was consulted to determine the adequacy of the "Specifications" in terms of satisfying the requirements of the "Regulations Governing the Control of Air Pollution in the State of Maryland." The Maryland Air and Radiation Management Administration found the specifications to be consistent with the requirements of these regulations. Therefore, during the construction period, all appropriate measures (Code of Maryland Regulations 26.11.06.03 D) would be incorporated to minimize the impact of the proposed transportation improvements on the air quality of the area. Mobile source emissions can also be minimized during construction by not permitting idling delivery trucks or other equipment during periods of unloading or other non-active use. The existing number of traffic lanes should be maintained during construction, to the maximum extent possible, and construction schedules should be planned in a manner that will not create traffic disruption and increase air pollutants. Application of these measures will ensure that construction impact of the project is insignificant.
V. AGENCY COORDINATION / INTERAGENCY CONSULTATION Copies of this air quality analysis were circulated to the Federal Highway Administration (FHWA), the Environmental Protection Agency (EPA), the Maryland Department of the Environment (MDE), and the Baltimore Regional Transportation Board (BRTB) on September 3, 2014 for a 15-day Interagency Consultation review and comment period. The agencies concurred the project did not require quantitative hot-spot analysis. This Air Quality Analysis will be placed on SHA’s website for a 15 day public review and comment period. Refer to Appendix D for results of Interagency Consultation.

APPENDIX
A: PREFERRED ALTERNATIVE
B: MONITORED AMBIENT AIR QUALITY DATA 2011-2013
C: TRAFFIC DATA
D: INTERAGENCY CONSULTATION EMAILS

APPENDIX A: PREFERRED ALTERNATIVE

APPENDIX B: MONITORED AMBIENT AIR QUALITY DATA 2011-2013

Page 1 of 2Generated: December 19, 2013
Source: U.S. EPA AirData <http://www.epa.gov/airdata>
This report is based on monitor-level summary statistics. Air quality standards for some pollutants (PM2.5 and Pb) allow for combining data from multiple monitors into a site-levelsummary statistic that can be compared to the standard. In those cases, the site-level statistics may differ from the monitor-level statistics upon which this report is based.
Readers are cautioned not to rank order geographic areas based on AirData reports. Air pollution levels measured at a particular monitoring site are not necessarily representativeof the air quality for an entire county or urban area.
AirData reports are produced from a direct query of the AQS Data Mart. The data represent the best and most recent information available to EPA from state agencies. However,some values may be absent due to incomplete reporting, and some values may change due to quality assurance activities. The AQS database is updated daily by state, local, andtribal organizations who own and submit the data. Please contact the appropriate air quality monitoring agency to report any data problems.<http://www.epa.gov/airquality/airdata/ad_contacts.html>
Get detailed information about this report, including column descriptions, at http://www.epa.gov/airquality/airdata/ad_about_reports.html#mon
Monitor Values ReportGeographic Area: MarylandPollutant: COYear: 2011Exceptional Events: Included (if any)
Duration Description=1 HOUR
DurationDescription Obs
FirstMax
SecondMax
ActualExc
ExcEvents
MonitorNumber Site ID Address City County State
EPARegion
1 HOUR 8230 2.3 2.3 0 None 1 240053001 600 Dorsey Avenue Essex Baltimore MD 03
1 HOUR 8343 0.4 0.4 0 None 1 240230002 Frostburg Reservoir, Finzel Not in a city Garrett MD 03
1 HOUR 8183 1.7 1.3 0 None 1 240330030 Howard University'S Beltsville Laboratory, 12003 Old Baltimore PikeBeltsville Prince George's MD 03
1 HOUR 8533 2.3 2.2 0 None 1 245100040 Oldtown Fire Station, 1100 Hillen Street Baltimore Baltimore (City) MD 03

Page 2 of 2Generated: December 19, 2013
Source: U.S. EPA AirData <http://www.epa.gov/airdata>
This report is based on monitor-level summary statistics. Air quality standards for some pollutants (PM2.5 and Pb) allow for combining data from multiple monitors into a site-levelsummary statistic that can be compared to the standard. In those cases, the site-level statistics may differ from the monitor-level statistics upon which this report is based.
Readers are cautioned not to rank order geographic areas based on AirData reports. Air pollution levels measured at a particular monitoring site are not necessarily representativeof the air quality for an entire county or urban area.
AirData reports are produced from a direct query of the AQS Data Mart. The data represent the best and most recent information available to EPA from state agencies. However,some values may be absent due to incomplete reporting, and some values may change due to quality assurance activities. The AQS database is updated daily by state, local, andtribal organizations who own and submit the data. Please contact the appropriate air quality monitoring agency to report any data problems.<http://www.epa.gov/airquality/airdata/ad_contacts.html>
Get detailed information about this report, including column descriptions, at http://www.epa.gov/airquality/airdata/ad_about_reports.html#mon
Monitor Values ReportGeographic Area: MarylandPollutant: COYear: 2011Exceptional Events: Included (if any)
Duration Description=8-HR RUN AVG END HOUR
Duration Description ObsFirstMax
SecondMax
ActualExc
ExcEvents
MonitorNumber Site ID Address City County State
EPARegion
8-HR RUN AVG END HOUR 8224 1.7 1.6 0 None 1 240053001 600 Dorsey Avenue Essex Baltimore MD 03
8-HR RUN AVG END HOUR 8430 0.4 0.3 0 None 1 240230002 Frostburg Reservoir, Finzel Not in a city Garrett MD 03
8-HR RUN AVG END HOUR 8145 1.1 0.8 0 None 1 240330030 Howard University'S Beltsville Laboratory, 12003 Old Baltimore PikeBeltsville Prince George's MD 03
8-HR RUN AVG END HOUR 8548 1.8 1.5 0 None 1 245100040 Oldtown Fire Station, 1100 Hillen Street Baltimore Baltimore (City) MD 03
Page 1 of 2Generated: December 19, 2013
Source: U.S. EPA AirData <http://www.epa.gov/airdata>
This report is based on monitor-level summary statistics. Air quality standards for some pollutants (PM2.5 and Pb) allow for combining data from multiple monitors into a site-levelsummary statistic that can be compared to the standard. In those cases, the site-level statistics may differ from the monitor-level statistics upon which this report is based.
Readers are cautioned not to rank order geographic areas based on AirData reports. Air pollution levels measured at a particular monitoring site are not necessarily representativeof the air quality for an entire county or urban area.
AirData reports are produced from a direct query of the AQS Data Mart. The data represent the best and most recent information available to EPA from state agencies. However,some values may be absent due to incomplete reporting, and some values may change due to quality assurance activities. The AQS database is updated daily by state, local, andtribal organizations who own and submit the data. Please contact the appropriate air quality monitoring agency to report any data problems.<http://www.epa.gov/airquality/airdata/ad_contacts.html>
Get detailed information about this report, including column descriptions, at http://www.epa.gov/airquality/airdata/ad_about_reports.html#mon
Monitor Values ReportGeographic Area: MarylandPollutant: COYear: 2012Exceptional Events: Included (if any)
Duration Description=1 HOUR
DurationDescription Obs
FirstMax
SecondMax
ActualExc
ExcEvents
MonitorNumber Site ID Address City County State
EPARegion
1 HOUR 8485 2.3 2.1 0 None 1 240053001 600 Dorsey Avenue Essex Baltimore MD 03
1 HOUR 5921 0.3 0.3 0 None 1 240190004 University Of Maryland For Environmental And Estuarine Studies Not in a city Dorchester MD 03
1 HOUR 8182 1.8 0.8 0 None 1 240230002 Frostburg Reservoir, Finzel Not in a city Garrett MD 03
1 HOUR 8571 1.3 1.2 0 None 1 240330030 Howard University'S Beltsville Laboratory, 12003 Old Baltimore PikeBeltsville Prince George's MD 03
1 HOUR 8626 2.5 2.5 0 None 1 245100040 Oldtown Fire Station, 1100 Hillen Street Baltimore Baltimore (City) MD 03
Page 2 of 2Generated: December 19, 2013
Source: U.S. EPA AirData <http://www.epa.gov/airdata>
This report is based on monitor-level summary statistics. Air quality standards for some pollutants (PM2.5 and Pb) allow for combining data from multiple monitors into a site-levelsummary statistic that can be compared to the standard. In those cases, the site-level statistics may differ from the monitor-level statistics upon which this report is based.
Readers are cautioned not to rank order geographic areas based on AirData reports. Air pollution levels measured at a particular monitoring site are not necessarily representativeof the air quality for an entire county or urban area.
AirData reports are produced from a direct query of the AQS Data Mart. The data represent the best and most recent information available to EPA from state agencies. However,some values may be absent due to incomplete reporting, and some values may change due to quality assurance activities. The AQS database is updated daily by state, local, andtribal organizations who own and submit the data. Please contact the appropriate air quality monitoring agency to report any data problems.<http://www.epa.gov/airquality/airdata/ad_contacts.html>
Get detailed information about this report, including column descriptions, at http://www.epa.gov/airquality/airdata/ad_about_reports.html#mon
Monitor Values ReportGeographic Area: MarylandPollutant: COYear: 2012Exceptional Events: Included (if any)
Duration Description=8-HR RUN AVG END HOUR
Duration Description ObsFirstMax
SecondMax
ActualExc
ExcEvents
MonitorNumber Site ID Address City County State
EPARegion
8-HR RUN AVG END HOUR 8554 1.6 1.6 0 None 1 240053001 600 Dorsey Avenue Essex Baltimore MD 03
8-HR RUN AVG END HOUR 6011 0.3 0.3 0 None 1 240190004 University Of Maryland For Environmental And Estuarine Studies Not in a city Dorchester MD 03
8-HR RUN AVG END HOUR 8210 0.4 0.4 0 None 1 240230002 Frostburg Reservoir, Finzel Not in a city Garrett MD 03
8-HR RUN AVG END HOUR 8651 1.2 0.9 0 None 1 240330030 Howard University'S Beltsville Laboratory, 12003 Old Baltimore PikeBeltsville Prince George's MD 03
8-HR RUN AVG END HOUR 8713 2.1 1.6 0 None 1 245100040 Oldtown Fire Station, 1100 Hillen Street Baltimore Baltimore (City) MD 03
Page 1 of 2Generated: September 3, 2014
Source: U.S. EPA AirData <http://www.epa.gov/airdata>
This report is based on monitor-level summary statistics. Air quality standards for some pollutants (PM2.5 and Pb) allow for combining data from multiple monitors into a site-levelsummary statistic that can be compared to the standard. In those cases, the site-level statistics may differ from the monitor-level statistics upon which this report is based.
Readers are cautioned not to rank order geographic areas based on AirData reports. Air pollution levels measured at a particular monitoring site are not necessarily representativeof the air quality for an entire county or urban area.
AirData reports are produced from a direct query of the AQS Data Mart. The data represent the best and most recent information available to EPA from state agencies. However,some values may be absent due to incomplete reporting, and some values may change due to quality assurance activities. The AQS database is updated daily by state, local, andtribal organizations who own and submit the data. Please contact the appropriate air quality monitoring agency to report any data problems.<http://www.epa.gov/airquality/airdata/ad_contacts.html>
Get detailed information about this report, including column descriptions, at http://www.epa.gov/airquality/airdata/ad_about_reports.html#mon
Monitor Values ReportGeographic Area: MarylandPollutant: COYear: 2013Exceptional Events: Included (if any)
Duration Description=1 HOUR
DurationDescription Obs
FirstMax
SecondMax
ActualExc
ExcEvents
MonitorNumber Site ID Address City County State
EPARegion
1 HOUR 8716 2.4 2.2 0 None 1 240053001 600 Dorsey Avenue Essex Baltimore MD 03
1 HOUR 8477 1 0.4 0 None 1 240190004 University Of Maryland For Environmental And Estuarine Studies Cambridge Dorchester MD 03
1 HOUR 8626 0.5 0.4 0 None 1 240230002 Piney Run, Frostburg Reservoir, Finzel Grantsville Garrett MD 03
1 HOUR 8689 1 0.9 0 None 1 240330030 Howard University'S Beltsville Laboratory, 12003 Old Baltimore PikeBeltsville Prince George's MD 03
1 HOUR 8359 2.4 2 0 None 1 245100040 Oldtown Fire Station, 1100 Hillen Street Baltimore Baltimore (City) MD 03

Page 2 of 2Generated: September 3, 2014
Source: U.S. EPA AirData <http://www.epa.gov/airdata>
This report is based on monitor-level summary statistics. Air quality standards for some pollutants (PM2.5 and Pb) allow for combining data from multiple monitors into a site-levelsummary statistic that can be compared to the standard. In those cases, the site-level statistics may differ from the monitor-level statistics upon which this report is based.
Readers are cautioned not to rank order geographic areas based on AirData reports. Air pollution levels measured at a particular monitoring site are not necessarily representativeof the air quality for an entire county or urban area.
AirData reports are produced from a direct query of the AQS Data Mart. The data represent the best and most recent information available to EPA from state agencies. However,some values may be absent due to incomplete reporting, and some values may change due to quality assurance activities. The AQS database is updated daily by state, local, andtribal organizations who own and submit the data. Please contact the appropriate air quality monitoring agency to report any data problems.<http://www.epa.gov/airquality/airdata/ad_contacts.html>
Get detailed information about this report, including column descriptions, at http://www.epa.gov/airquality/airdata/ad_about_reports.html#mon
Monitor Values ReportGeographic Area: MarylandPollutant: COYear: 2013Exceptional Events: Included (if any)
Duration Description=8-HR RUN AVG END HOUR
Duration Description ObsFirstMax
SecondMax
ActualExc
ExcEvents
MonitorNumber Site ID Address City County State
EPARegion
8-HR RUN AVG END HOUR 8755 1.6 1.4 0 None 1 240053001 600 Dorsey Avenue Essex Baltimore MD 03
8-HR RUN AVG END HOUR 8526 0.3 0.3 0 None 1 240190004 University Of Maryland For Environmental And Estuarine Studies Cambridge Dorchester MD 03
8-HR RUN AVG END HOUR 8701 0.3 0.3 0 None 1 240230002 Piney Run, Frostburg Reservoir, Finzel Grantsville Garrett MD 03
8-HR RUN AVG END HOUR 8698 0.9 0.9 0 None 1 240330030 Howard University'S Beltsville Laboratory, 12003 Old Baltimore PikeBeltsville Prince George's MD 03
8-HR RUN AVG END HOUR 8373 1.6 1.3 0 None 1 245100040 Oldtown Fire Station, 1100 Hillen Street Baltimore Baltimore (City) MD 03

Page 1 of 3Generated: April 7, 2014
Source: U.S. EPA AirData <http://www.epa.gov/airdata>
This report is based on monitor-level summary statistics. Air quality standards for some pollutants (PM2.5 and Pb) allow for combining data from multiple monitors into a site-levelsummary statistic that can be compared to the standard. In those cases, the site-level statistics may differ from the monitor-level statistics upon which this report is based.
Readers are cautioned not to rank order geographic areas based on AirData reports. Air pollution levels measured at a particular monitoring site are not necessarily representativeof the air quality for an entire county or urban area.
AirData reports are produced from a direct query of the AQS Data Mart. The data represent the best and most recent information available to EPA from state agencies. However,some values may be absent due to incomplete reporting, and some values may change due to quality assurance activities. The AQS database is updated daily by state, local, andtribal organizations who own and submit the data. Please contact the appropriate air quality monitoring agency to report any data problems.<http://www.epa.gov/airquality/airdata/ad_contacts.html>
Get detailed information about this report, including column descriptions, at http://www.epa.gov/airquality/airdata/ad_about_reports.html#mon
Monitor Values ReportGeographic Area: MarylandPollutant: PM2.5Year: 2011Exceptional Events: Included (if any)
Duration Description=24 HOUR
DurationDescription Obs
FirstMax
SecondMax
ThirdMax
FourthMax
98thPercentile
WeightedAnnualMean
ExcEvents
MonitorNumber Site ID Address City County State
EPARegion
24 HOUR 112 26.4 24.7 24.4 22.7 24 10.7 None 1 240031003 Anne Arundel Co. Public Works Bldg. 7409Baltimore Annapolis Blvd.
Glen Burnie Anne Arundel MD 03
24 HOUR 110 28.6 27.2 22.8 20.9 23 9.7 None 1 240051007 Padonia Elementary School, 9834 Greenside Drive Cockeysville Baltimore MD 03
24 HOUR 28 26.8 21.2 20.2 17.5 27 10 None 2 240051007 Padonia Elementary School, 9834 Greenside Drive Cockeysville Baltimore MD 03
24 HOUR 116 26.7 26.6 26.3 26.3 26 10.7 None 1 240053001 600 Dorsey Avenue Essex Baltimore MD 03
24 HOUR 72 25 24.5 20.6 20.5 25 10.3 None 1 240251001 Edgewood Chemical Biological Center (Apg),Waehli Road
Edgewood Harford MD 03
24 HOUR 108 27 25.4 22.6 21.6 23 10.1 None 1 240330025 Bladensburg Volunteer Fire Department, 4213Edmondson Road
Bladensburg PrinceGeorge's
MD 03
24 HOUR 123 24.7 22 21.8 21 22 8.7 None 1 240330030 Howard University'S Beltsville Laboratory, 12003 OldBaltimore Pike
Beltsville PrinceGeorge's
MD 03
24 HOUR 37 24.3 15.1 12.7 12.7 24 8.2 None 2 240330030 Howard University'S Beltsville Laboratory, 12003 OldBaltimore Pike
Beltsville PrinceGeorge's
MD 03
24 HOUR 118 28.8 25.8 21.1 20.4 21 8.9 None 1 240338003 Pg County Equestrian Center, 14900 Pennsylvania Ave.
Greater UpperMarlboro
PrinceGeorge's
MD 03
24 HOUR 28 15 13.9 12.7 11.9 15 7.8 None 2 240338003 Pg County Equestrian Center, 14900 Pennsylvania Ave.
Greater UpperMarlboro
PrinceGeorge's
MD 03
24 HOUR 115 26.4 25.2 23.2 21.7 23 9.9 None 1 245100006 Northeast Police Station, 1900 Argonne Drive Baltimore Baltimore(City)
MD 03

Page 2 of 3Generated: April 7, 2014
Source: U.S. EPA AirData <http://www.epa.gov/airdata>
This report is based on monitor-level summary statistics. Air quality standards for some pollutants (PM2.5 and Pb) allow for combining data from multiple monitors into a site-levelsummary statistic that can be compared to the standard. In those cases, the site-level statistics may differ from the monitor-level statistics upon which this report is based.
Readers are cautioned not to rank order geographic areas based on AirData reports. Air pollution levels measured at a particular monitoring site are not necessarily representativeof the air quality for an entire county or urban area.
AirData reports are produced from a direct query of the AQS Data Mart. The data represent the best and most recent information available to EPA from state agencies. However,some values may be absent due to incomplete reporting, and some values may change due to quality assurance activities. The AQS database is updated daily by state, local, andtribal organizations who own and submit the data. Please contact the appropriate air quality monitoring agency to report any data problems.<http://www.epa.gov/airquality/airdata/ad_contacts.html>
Get detailed information about this report, including column descriptions, at http://www.epa.gov/airquality/airdata/ad_about_reports.html#mon
Monitor Values ReportGeographic Area: MarylandPollutant: PM2.5Year: 2011Exceptional Events: Included (if any)
Duration Description=24 HOUR
DurationDescription Obs
FirstMax
SecondMax
ThirdMax
FourthMax
98thPercentile
WeightedAnnualMean
ExcEvents
MonitorNumber Site ID Address City County State
EPARegion
24 HOUR 118 51.7 28.1 24.2 22.7 24 10 None 1 245100007 Northwest Police Station, 5271 Reistertown Road Baltimore Baltimore(City)
MD 03
24 HOUR 110 28.2 27.4 24.5 23.4 25 10.6 None 1 245100008 Baltimore City Fire Dept.-Truck Company 20; 5714Eastern Avenue
Baltimore Baltimore(City)
MD 03
24 HOUR 251 36 31.9 28.6 28 25 10.8 None 1 245100040 Oldtown Fire Station, 1100 Hillen Street Baltimore Baltimore(City)
MD 03

Page 1 of 2Generated: April 7, 2014
Source: U.S. EPA AirData <http://www.epa.gov/airdata>
This report is based on monitor-level summary statistics. Air quality standards for some pollutants (PM2.5 and Pb) allow for combining data from multiple monitors into a site-levelsummary statistic that can be compared to the standard. In those cases, the site-level statistics may differ from the monitor-level statistics upon which this report is based.
Readers are cautioned not to rank order geographic areas based on AirData reports. Air pollution levels measured at a particular monitoring site are not necessarily representativeof the air quality for an entire county or urban area.
AirData reports are produced from a direct query of the AQS Data Mart. The data represent the best and most recent information available to EPA from state agencies. However,some values may be absent due to incomplete reporting, and some values may change due to quality assurance activities. The AQS database is updated daily by state, local, andtribal organizations who own and submit the data. Please contact the appropriate air quality monitoring agency to report any data problems.<http://www.epa.gov/airquality/airdata/ad_contacts.html>
Get detailed information about this report, including column descriptions, at http://www.epa.gov/airquality/airdata/ad_about_reports.html#mon
Monitor Values ReportGeographic Area: MarylandPollutant: PM2.5Year: 2012Exceptional Events: Included (if any)
Duration Description=24 HOUR
DurationDescription Obs
FirstMax
SecondMax
ThirdMax
FourthMax
98thPercentile
WeightedAnnualMean
ExcEvents
MonitorNumber Site ID Address City County State
EPARegion
24 HOUR 119 30.1 23.4 23 21.7 23 10.2 None 1 240031003 Anne Arundel Co. Public Works Bldg. 7409Baltimore Annapolis Blvd.
Glen Burnie Anne Arundel MD 03
24 HOUR 112 29.5 22.6 21.5 18.3 22 8.9 None 1 240051007 Padonia Elementary School, 9834 Greenside Drive Cockeysville Baltimore MD 03
24 HOUR 41 21 18 16.8 13.7 21 9.1 None 2 240051007 Padonia Elementary School, 9834 Greenside Drive Cockeysville Baltimore MD 03
24 HOUR 116 28.2 25.5 24.7 23.6 25 10.7 None 1 240053001 600 Dorsey Avenue Essex Baltimore MD 03
24 HOUR 121 25 22.3 21.7 20.8 22 8.5 None 1 240330030 Howard University'S Beltsville Laboratory, 12003 OldBaltimore Pike
Beltsville PrinceGeorge's
MD 03
24 HOUR 43 25 22.1 15.4 13.9 25 8.3 None 2 240330030 Howard University'S Beltsville Laboratory, 12003 OldBaltimore Pike
Beltsville PrinceGeorge's
MD 03
24 HOUR 97 24.7 23.8 15 14.7 24 7.8 None 1 240338003 Pg County Equestrian Center, 14900 Pennsylvania Ave.
Greater UpperMarlboro
PrinceGeorge's
MD 03
24 HOUR 35 14.8 14.7 14.2 12.6 15 7.8 None 2 240338003 Pg County Equestrian Center, 14900 Pennsylvania Ave.
Greater UpperMarlboro
PrinceGeorge's
MD 03
24 HOUR 121 23.8 22.5 22.1 21.8 22 9.3 None 1 245100007 Northwest Police Station, 5271 Reistertown Road Baltimore Baltimore(City)
MD 03
24 HOUR 111 23.7 22.6 22.5 20 23 9.6 None 1 245100008 Baltimore City Fire Dept.-Truck Company 20; 5714Eastern Avenue
Baltimore Baltimore(City)
MD 03
24 HOUR 304 26.3 25.5 24.4 23.7 23 10 None 1 245100040 Oldtown Fire Station, 1100 Hillen Street Baltimore Baltimore(City)
MD 03

Page 1 of 2Generated: September 3, 2014
Source: U.S. EPA AirData <http://www.epa.gov/airdata>
This report is based on monitor-level summary statistics. Air quality standards for some pollutants (PM2.5 and Pb) allow for combining data from multiple monitors into a site-levelsummary statistic that can be compared to the standard. In those cases, the site-level statistics may differ from the monitor-level statistics upon which this report is based.
Readers are cautioned not to rank order geographic areas based on AirData reports. Air pollution levels measured at a particular monitoring site are not necessarily representativeof the air quality for an entire county or urban area.
AirData reports are produced from a direct query of the AQS Data Mart. The data represent the best and most recent information available to EPA from state agencies. However,some values may be absent due to incomplete reporting, and some values may change due to quality assurance activities. The AQS database is updated daily by state, local, andtribal organizations who own and submit the data. Please contact the appropriate air quality monitoring agency to report any data problems.<http://www.epa.gov/airquality/airdata/ad_contacts.html>
Get detailed information about this report, including column descriptions, at http://www.epa.gov/airquality/airdata/ad_about_reports.html#mon
Monitor Values ReportGeographic Area: MarylandPollutant: PM2.5Year: 2013Exceptional Events: Included (if any)
Duration Description=24 HOUR
DurationDescription Obs
FirstMax
SecondMax
ThirdMax
FourthMax
98thPercentile
WeightedAnnualMean
ExcEvents
MonitorNumber Site ID Address City County State
EPARegion
24 HOUR 116 30.4 26.3 22.1 20.2 22 9.1 None 1 240031003 Anne Arundel Co. Public Works Bldg. 7409Baltimore Annapolis Blvd.
Glen Burnie Anne Arundel MD 03
24 HOUR 111 26.5 24.7 19.9 19.7 20 8.5 None 1 240051007 Padonia Elementary School, 9834 Greenside Drive Cockeysville Baltimore MD 03
24 HOUR 53 26.9 20 17.9 17.8 20 8.5 None 2 240051007 Padonia Elementary School, 9834 Greenside Drive Cockeysville Baltimore MD 03
24 HOUR 113 35.2 29.4 26.8 23.4 27 9.5 None 1 240053001 600 Dorsey Avenue Essex Baltimore MD 03
24 HOUR 121 22.2 20.1 18.6 17.5 19 7.8 None 1 240330030 Howard University'S Beltsville Laboratory, 12003 OldBaltimore Pike
Beltsville PrinceGeorge's
MD 03
24 HOUR 32 21.7 18.5 16.4 12.7 22 8.2 None 2 240330030 Howard University'S Beltsville Laboratory, 12003 OldBaltimore Pike
Beltsville PrinceGeorge's
MD 03
24 HOUR 106 23.5 20.4 17.2 15.5 17 7.5 None 1 240338003 Pg County Equestrian Center, 14900 Pennsylvania Ave.
Greater UpperMarlboro
PrinceGeorge's
MD 03
24 HOUR 50 16.6 15 15 14.7 17 7.9 None 2 240338003 Pg County Equestrian Center, 14900 Pennsylvania Ave.
Greater UpperMarlboro
PrinceGeorge's
MD 03
24 HOUR 116 28.6 27 20.4 18.8 20 8.6 None 1 245100007 Northwest Police Station, 5271 Reistertown Road Baltimore Baltimore(City)
MD 03
24 HOUR 114 32 28.7 24.3 22.8 24 9.4 None 1 245100008 Baltimore City Fire Dept.-Truck Company 20; 5714Eastern Avenue
Baltimore Baltimore(City)
MD 03
24 HOUR 303 34.6 29.8 29.7 27.7 23 9.1 None 1 245100040 Oldtown Fire Station, 1100 Hillen Street Baltimore Baltimore(City)
MD 03

Page 2 of 2Generated: September 3, 2014
Source: U.S. EPA AirData <http://www.epa.gov/airdata>
This report is based on monitor-level summary statistics. Air quality standards for some pollutants (PM2.5 and Pb) allow for combining data from multiple monitors into a site-levelsummary statistic that can be compared to the standard. In those cases, the site-level statistics may differ from the monitor-level statistics upon which this report is based.
Readers are cautioned not to rank order geographic areas based on AirData reports. Air pollution levels measured at a particular monitoring site are not necessarily representativeof the air quality for an entire county or urban area.
AirData reports are produced from a direct query of the AQS Data Mart. The data represent the best and most recent information available to EPA from state agencies. However,some values may be absent due to incomplete reporting, and some values may change due to quality assurance activities. The AQS database is updated daily by state, local, andtribal organizations who own and submit the data. Please contact the appropriate air quality monitoring agency to report any data problems.<http://www.epa.gov/airquality/airdata/ad_contacts.html>
Get detailed information about this report, including column descriptions, at http://www.epa.gov/airquality/airdata/ad_about_reports.html#mon
Monitor Values ReportGeographic Area: MarylandPollutant: PM2.5Year: 2013Exceptional Events: Included (if any)
Duration Description=24-HR BLK AVG
DurationDescription Obs
FirstMax
SecondMax
ThirdMax
FourthMax
98thPercentile
WeightedAnnualMean
ExcEvents
MonitorNumber Site ID Address City County State
EPARegion
24-HR BLKAVG
344 39 32.3 29.2 28.6 25 9.9 None 3 240150003 Fair Hill Natural Resource Mgmt Area, 4600 TelegraphRoad
Rising Sun Cecil MD 03
24-HR BLKAVG
341 25 23.1 21.9 20.8 18 7.2 None 3 240190004 University Of Maryland For Environmental And EstuarineStudies
Cambridge Dorchester MD 03
24-HR BLKAVG
257 25 23 19.2 18.5 18 8.3 None 3 240230002 Piney Run, Frostburg Reservoir, Finzel Grantsville Garrett MD 03
24-HR BLKAVG
344 32.3 30.7 29.3 27.8 27 9.7 None 3 240251001 Edgewood Chemical Biological Center (Apg), WaehliRoad
Edgewood Harford MD 03
24-HR BLKAVG
322 29.4 26.8 25.5 24 22 8.9 None 3 240290002 Millington Wildlife Management Area, Massey - MarylandLine Road (Route 330)
Millington Kent MD 03
24-HR BLKAVG
346 27.4 27.1 25.7 25.2 21 8.1 None 3 240313001 Lathrop E. Smith Environmental Education Center, 5110Meadowside Lane
Rockville Montgomery MD 03
24-HR BLKAVG
323 27.9 26.8 25.6 24.5 21 9.5 None 3 240330030 Howard University'S Beltsville Laboratory, 12003 OldBaltimore Pike
Beltsville PrinceGeorge's
MD 03
24-HR BLKAVG
351 45.7 43.3 39.2 31 25 9.2 None 3 240430009 Md Correctional Institution 18530 Roxbury Road Hagerstown Washington MD 03
24-HR BLKAVG
343 38.5 35.4 33.3 32.2 30 11.3 None 3 245100040 Oldtown Fire Station, 1100 Hillen Street Baltimore Baltimore(City)
MD 03

APPENDIX C: TRAFFIC DATA


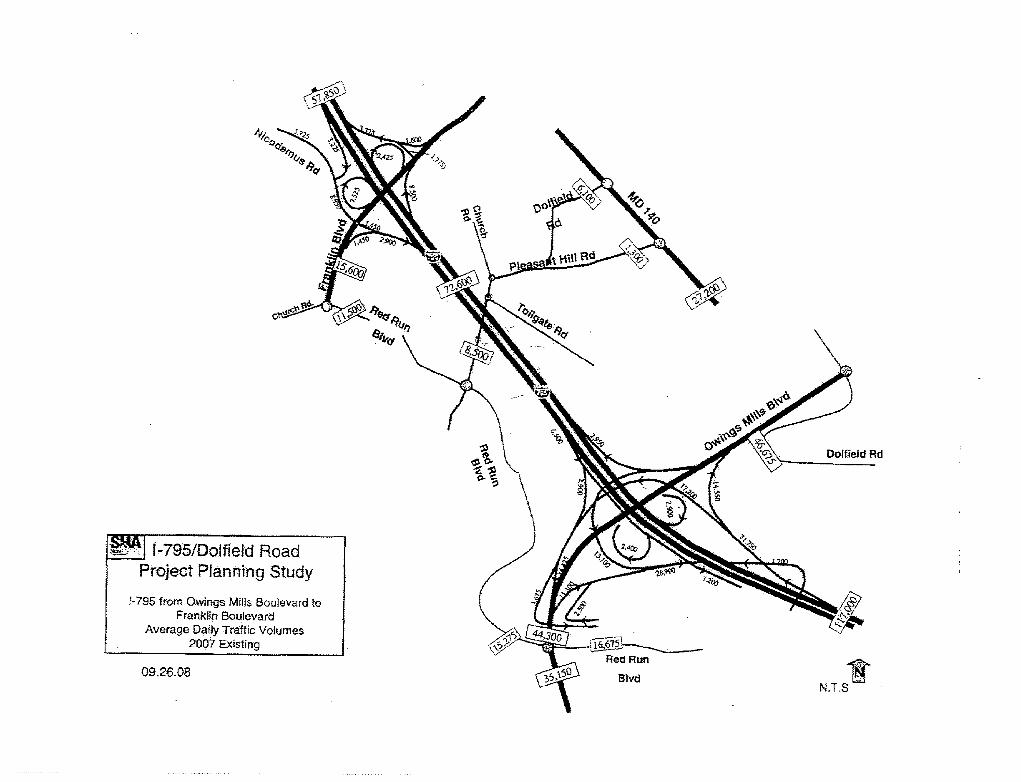


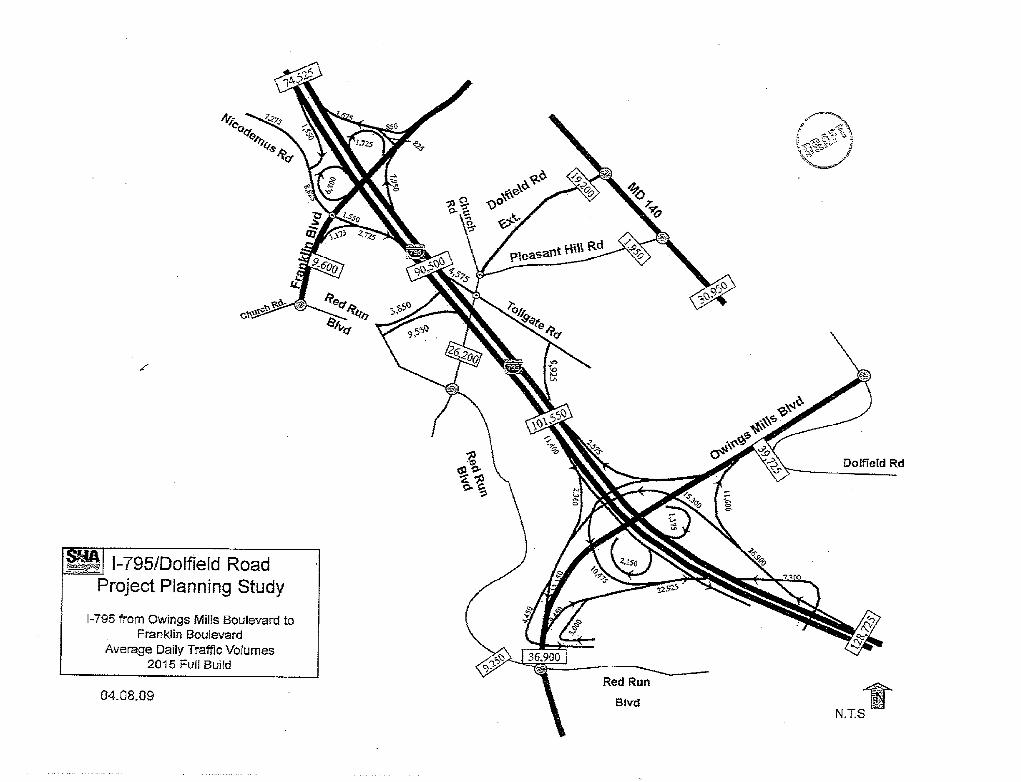

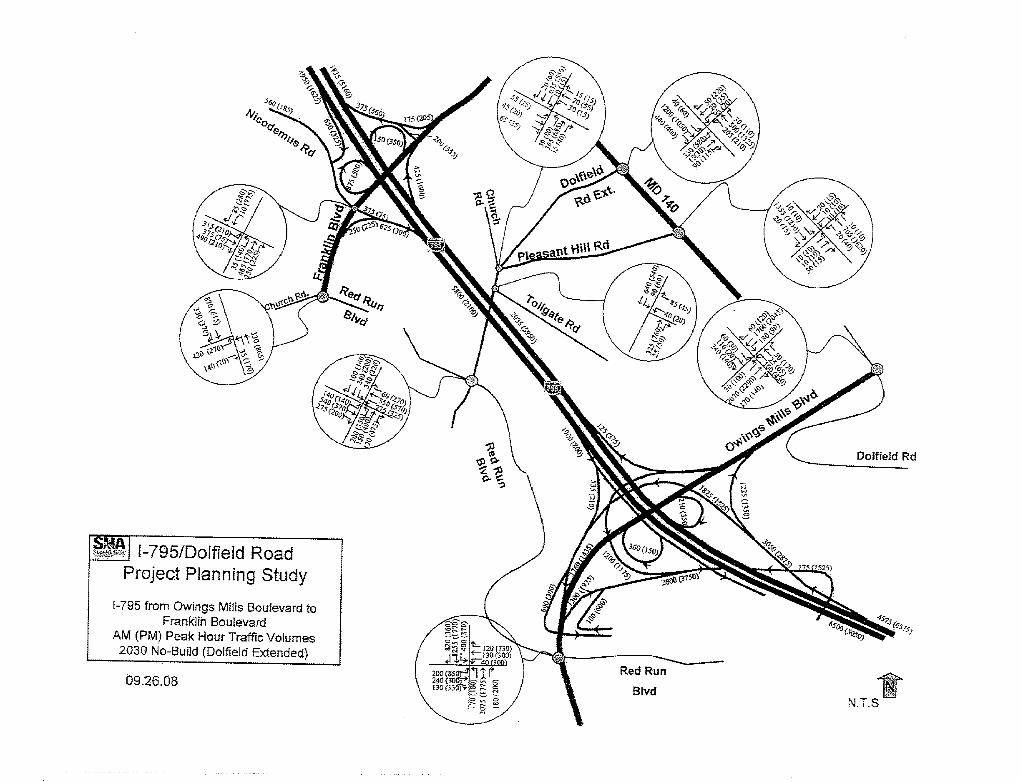

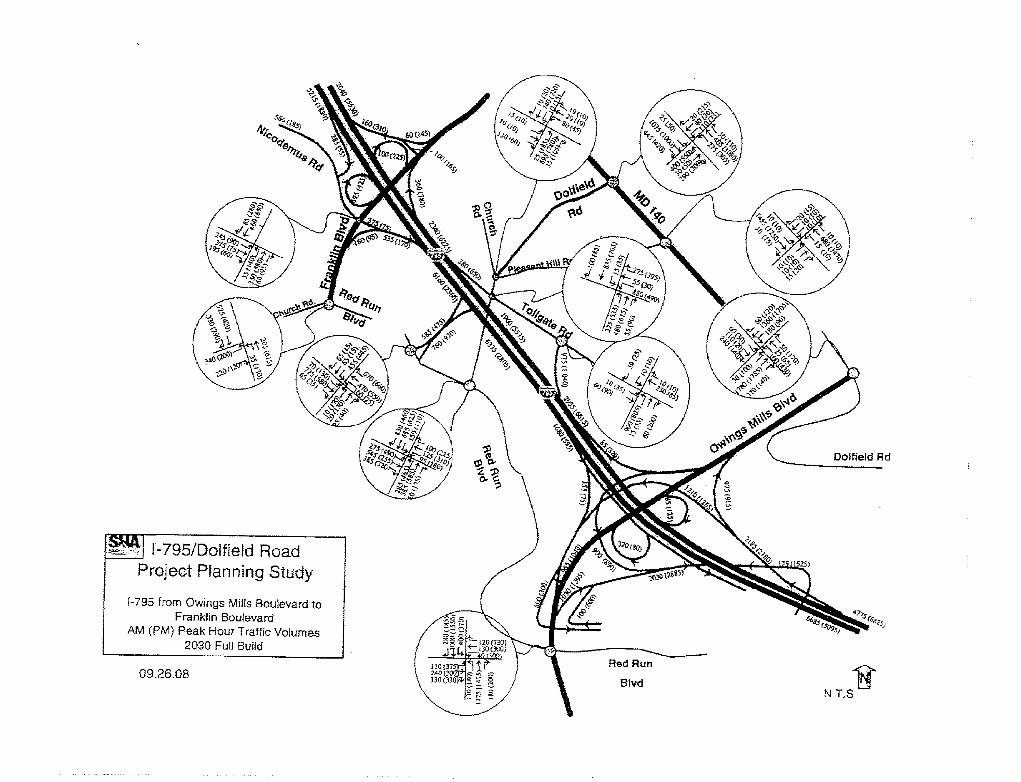

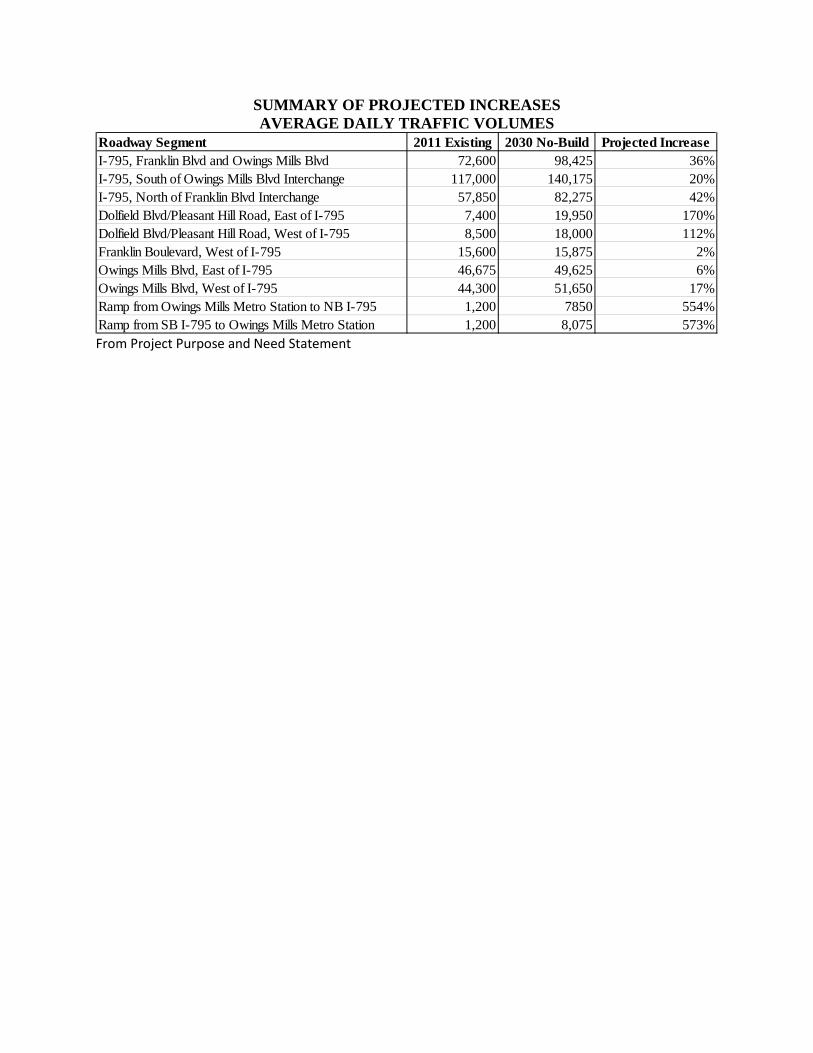
SUMMARY OF PROJECTED INCREASES AVERAGE DAILY TRAFFIC VOLUMES
From Project Purpose and Need Statement
Roadway Segment 2011 Existing 2030 No-Build Projected IncreaseI-795, Franklin Blvd and Owings Mills Blvd 72,600 98,425 36%I-795, South of Owings Mills Blvd Interchange 117,000 140,175 20%I-795, North of Franklin Blvd Interchange 57,850 82,275 42%Dolfield Blvd/Pleasant Hill Road, East of I-795 7,400 19,950 170%Dolfield Blvd/Pleasant Hill Road, West of I-795 8,500 18,000 112%Franklin Boulevard, West of I-795 15,600 15,875 2%Owings Mills Blvd, East of I-795 46,675 49,625 6%Owings Mills Blvd, West of I-795 44,300 51,650 17%Ramp from Owings Mills Metro Station to NB I-795 1,200 7850 554%Ramp from SB I-795 to Owings Mills Metro Station 1,200 8,075 573%

APPENDIX D: INTERAGENCY CONSULTATION

1
Shawn Burnett
From: Khadr, Asrah <[email protected]>Sent: Thursday, September 18, 2014 2:16 PMTo: Shawn BurnettCc: Becoat, gregory; McCurdy, Alaina; Rudnick, BarbaraSubject: RE: I-795 Dolfield Boulevard - Air Quality INteragency Consultation
EPA concurs with SHA’s recommendation that this project does not require a quantitative hot‐spot analysis. Asrah Khadr, Environmental Engineer, EIT U.S. Environmental Protection Agency, Region III Air Protection Division Office of Air Program Planning 1650 Arch Street Philadelphia, PA 19103 Phone: 215‐814‐2071
From: Shawn Burnett [mailto:[email protected]] Sent: Wednesday, September 03, 2014 2:44 PM To: [email protected]; [email protected]; McCurdy, Alaina; Rudnick, Barbara; Becoat, gregory; Khadr, Asrah; [email protected]; Sara Tomlinson Cc: Nicole M. Hebert; [email protected]; [email protected]; [email protected] Subject: I‐795 Dolfield Boulevard ‐ Air Quality INteragency Consultation Good Morning,
Attached is the Air Quality analysis for the I-795/Dolfield Boulevard project located in Baltimore County, Maryland.
On behalf of SHA we are requesting concurrence that this project meets the requirements of the Clean Air Act and 40 CFR 93 without an additional quantitative hot-spot analysis.
The project is included in the approved 2012-2015 TIP and amended 2014-2017 TIP, as TIP ID# 63-0803-46.
Please review and provide concurrence/comments prior to September 19, 2014.
Thank you,
Shawn Burnett, P.E., P.T.O.E. Senior Associate The Wilson T. Ballard Company 410‐363‐0150
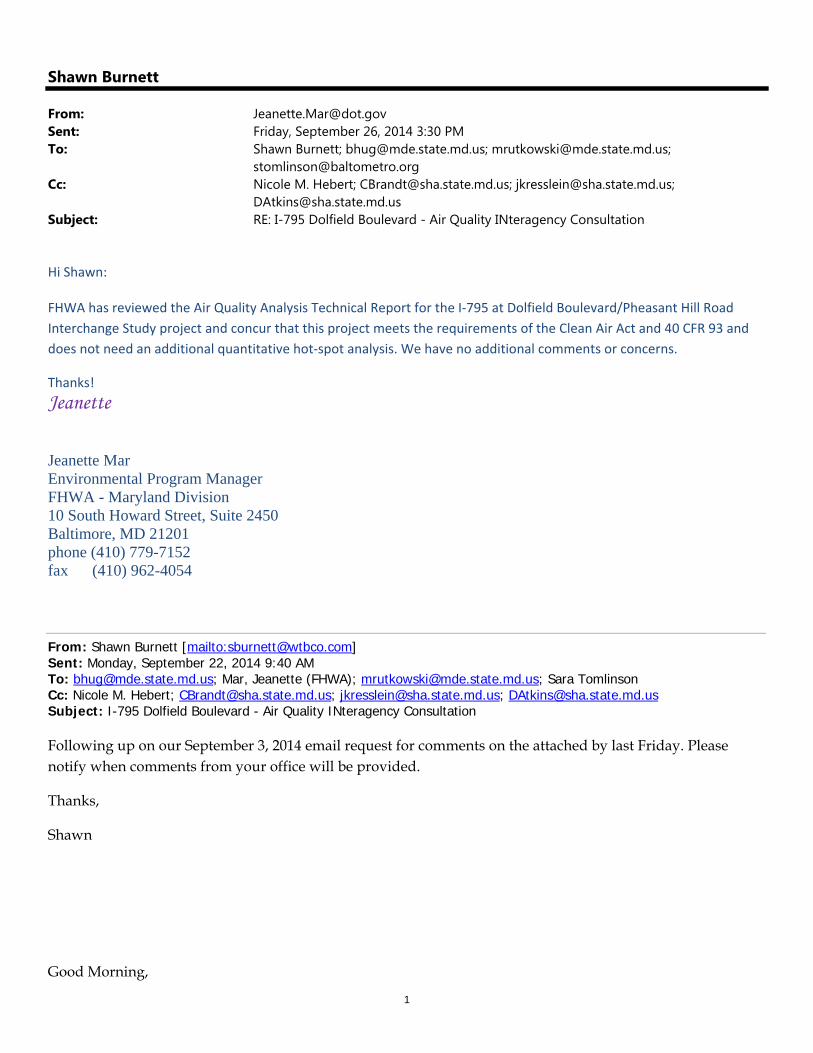
1
Shawn Burnett
From: [email protected]: Friday, September 26, 2014 3:30 PMTo: Shawn Burnett; [email protected]; [email protected];
[email protected]: Nicole M. Hebert; [email protected]; [email protected];
[email protected]: RE: I-795 Dolfield Boulevard - Air Quality INteragency Consultation
Hi Shawn: FHWA has reviewed the Air Quality Analysis Technical Report for the I‐795 at Dolfield Boulevard/Pheasant Hill Road
Interchange Study project and concur that this project meets the requirements of the Clean Air Act and 40 CFR 93 and
does not need an additional quantitative hot‐spot analysis. We have no additional comments or concerns.
Thanks!
Jeanette
Jeanette Mar Environmental Program Manager FHWA - Maryland Division 10 South Howard Street, Suite 2450 Baltimore, MD 21201 phone (410) 779-7152 fax (410) 962-4054
From: Shawn Burnett [mailto:[email protected]] Sent: Monday, September 22, 2014 9:40 AM To: [email protected]; Mar, Jeanette (FHWA); [email protected]; Sara Tomlinson Cc: Nicole M. Hebert; [email protected]; [email protected]; [email protected] Subject: I-795 Dolfield Boulevard - Air Quality INteragency Consultation Following up on our September 3, 2014 email request for comments on the attached by last Friday. Please notify when comments from your office will be provided.
Thanks,
Shawn
Good Morning,

1
Shawn Burnett
From: Brian Hug -MDE- <[email protected]>Sent: Thursday, October 02, 2014 12:13 PMTo: Shawn BurnettCc: Mary Jane Rutkowski -MDE-; Brian Hug; Nicole M. Hebert; Joseph Kresslein; Dennis
Atkins; [email protected]: Re: I-795 Dolfield Boulevard - Air Quality INteragency Consultation
I thought I emailed my ok last week if I didnt...this is our OK On Thu, Oct 2, 2014 at 12:08 PM, Shawn Burnett <[email protected]> wrote:
Brian/Mary Jane,
Any update on the status of your review of this project?
Thanks
Shawn
From: Sara Tomlinson [mailto:[email protected]] Sent: Thursday, October 02, 2014 11:54 AM To: Shawn Burnett Cc: Regina Aris; Todd Lang; Mary Jane Rutkowski -MDE-; Howard Simons; Anthony McClune Subject: Re: I-795 Dolfield Boulevard - Air Quality INteragency Consultation
The Interagency Consultation Group of the Baltimore Regional Transportation Board concurs that the I-795/Dolfield Boulevard project is not a project of air quality concern. Thank you, Sara Tomlinson
On Wed, Sep 3, 2014 at 2:44 PM, Shawn Burnett <[email protected]> wrote:
1
Shawn Burnett
From: Sara Tomlinson <[email protected]>Sent: Thursday, October 02, 2014 11:54 AMTo: Shawn BurnettCc: Regina Aris; Todd Lang; Mary Jane Rutkowski -MDE-; Howard Simons; Anthony
McCluneSubject: Re: I-795 Dolfield Boulevard - Air Quality INteragency Consultation
The Interagency Consultation Group of the Baltimore Regional Transportation Board concurs that the I-795/Dolfield Boulevard project is not a project of air quality concern. Thank you, Sara Tomlinson On Wed, Sep 3, 2014 at 2:44 PM, Shawn Burnett <[email protected]> wrote:
Good Morning,
Attached is the Air Quality analysis for the I-795/Dolfield Boulevard project located in Baltimore County, Maryland.
On behalf of SHA we are requesting concurrence that this project meets the requirements of the Clean Air Act and 40 CFR 93 without an additional quantitative hot-spot analysis.
The project is included in the approved 2012-2015 TIP and amended 2014-2017 TIP, as TIP ID# 63-0803-46.
Please review and provide concurrence/comments prior to September 19, 2014.
Thank you,
Shawn Burnett, P.E., P.T.O.E.
Senior Associate
The Wilson T. Ballard Company
410-363-0150