air quality and deposition analysis for the upper … · air quality and deposition analysis for...
TRANSCRIPT
Final Report
Air Quality and Deposition Analysis for the Upper Columbia River Basin
Model-Based Assessment of the Impact of Emissions from the Teck-Cominco Facility on Regional Air Quality and Deposition
April 2011
Submitted to: Environment International Ltd. Attn: Valerie Lee 5505 34th Avenue, NE Seattle, WA 98105 206.525.3362
Prepared by ICF International 101 Lucas Valley Road, Suite 260 San Rafael, CA 94903 415.507.7164
11-018

blankpage

Table of Contents 1. Introduction ........................................................................................................................... 1
1.1. Background and Objectives .......................................................................................... 1 1.2. Description of the Topography, Meteorology, and Emissions of the Region ................ 2
Topography ............................................................................................................................................................ 2 Meteorology ............................................................................................................................................................ 2 Emissions ................................................................................................................................................................ 3
1.3. Overview of the Analysis and Modeling Methods ......................................................... 3
2. Evaluation of Historical Data and Analyses ....................................................................... 5 3. Regional Modeling Application .......................................................................................... 13
3.1. Overview of the CMAQ Model with PPTM .................................................................. 13 3.2. CMAQ Application Procedures ................................................................................... 13
Simulation Periods ............................................................................................................................................. 13 CMAQ Modeling Domain ................................................................................................................................. 14 Input Preparation ................................................................................................................................................ 15
3.3. SO2 Contribution Analysis .......................................................................................... 16 1990 Baseline ...................................................................................................................................................... 16 1930 Retrospective ............................................................................................................................................ 21
3.4. Deposition Contribution Analysis for Mercury ............................................................. 22 1990 Baseline ...................................................................................................................................................... 22 1930 Retrospective ............................................................................................................................................ 24 Cumulative Analysis .......................................................................................................................................... 25
3.5. Deposition Contribution Analysis for Other Metals ..................................................... 26 1990 Baseline ...................................................................................................................................................... 26 Cumulative Analysis .......................................................................................................................................... 29
4. Summary of Findings ......................................................................................................... 31 5. References ........................................................................................................................... 35
List of Figures Figure 2-1a. Annual Average Upper-level Winds at Northport, WA for the Period June 1929 through
May 1930 – 5 AM. ................................................................................................................................. 7 Figure 2-1b. Annual Average Upper-level Winds at Northport, WA for the Period June 1929 through
May 1930 – 12 Noon. ............................................................................................................................ 8 Figure 2-1c. Annual Average Upper-level Winds at Northport, WA for the Period June 1929 through
May 1930 – 5 PM. ................................................................................................................................. 8 Figure 2-2a. Area of Smelter Fumes Injury in Stevens County, WA from the USDA Survey for 1929. ........................ 10 Figure 2-2b. Area of Smelter Fumes Injury in Stevens County, WA from the USDA Survey for 1930. ........................ 11 Figure 2-2c. Area of Smelter Fumes Injury in Stevens County, WA from the USDA Survey for 1931. ......................... 12 Figure 3-1. Modeling Domain for the Application of CMAQ to the Upper Columbia River Basin.
State and County Boundaries and Selected Locations are Highlighted in the Insets Below. Horizontal Resolution is 12 km. ............................................................................................... 14
Figure 3-2. CMAQ Simulated Annual Average SO2 Concentration (ppb). .................................................................... 17 Figure 3-3. CMAQ/PPTM Simulated Contribution to Annual Average SO2 Concentration (ppb)
from Emissions from Teck-Cominco. .................................................................................................. 17 Figure 3-4. CMAQ/PPTM Simulated Contribution to Annual Average SO2 Concentration (ppb) from
Emissions from All Other Sources. ...................................................................................................... 18 Figure 3-5. CMAQ/PPTM Simulated Contribution to Annual Average SO2 Concentration (ppb) from
IC/BCs. ................................................................................................................................................ 18 Figure 3-6. CMAQ Simulated Maximum 24-Hour Average SO2 Concentration (ppb). ................................................. 19 Figure 3-7. CMAQ/PPTM Simulated Contribution to Maximum 24-Hour Average SO2 Concentration
(ppb) from Emission from Teck-Cominco. ........................................................................................... 19
ICF International i Environment International Ltd. 11-018 April 2011

Air Quality and Deposition Analysis for the Upper Columbia River Basin Table of Contents
ICF International ii Environment International Ltd. 11-018 April 2011
Figure 3-8. CMAQ/PPTM Simulated Contribution to Maximum 24-Hour Average SO2 Concentration (ppb) from Emissions from All Other Sources ..................................................................................... 20
Figure 3-9. CMAQ/PPTM Simulated Contribution to Maximum 24-Hour Average SO2 Concentration (ppb) from IC/BCs. .............................................................................................................................. 20
Figure 3-10. Retrospective CMAQ/PPTM Simulated Contribution to Annual Average SO2 Concentration (ppb) for 1930 from Emissions from Teck-Cominco. .................................................... 21
Figure 3-11. Retrospective CMAQ/PPTM Simulated Contribution to Maximum 24-Hour Average SO2 Concentration (ppb) for 1930 from Emissions from Teck-Cominco. ............................................ 21
Figure 3-12. CMAQ Simulated Total Annual Mercury Deposition (g/km2). ................................................................... 22 Figure 3-13. CMAQ/PPTM Simulated Contribution to Total Annual Mercury Deposition (g/km2)
from Emissions from Teck-Cominco. .................................................................................................. 23 Figure 3-14. CMAQ/PPTM Simulated Contribution to Total Annual Mercury Deposition (g/km2)
from Emissions from All Other Sources. ............................................................................................. 23 Figure 3-15. CMAQ/PPTM Simulated Contribution to Total Annual Mercury Deposition (g/km2) from
IC/BCs. ................................................................................................................................................ 24 Figure 3-16. CMAQ/PPTM Simulated Contribution to Total Annual Mercury Deposition (g/km2)
from Emissions from Teck-Cominco. .................................................................................................. 25 Figure 3-17. CMAQ/PPTM Simulated Contribution to 80-Year Cumulative Total Mercury Deposition
(g/km2) from Emissions from Teck-Cominco. ...................................................................................... 26 Figure 3-18. CMAQ-Derived Contribution to Total Annual Lead Deposition (kg/km2) from Teck-
Cominco. ............................................................................................................................................. 27 Figure 3-19. CMAQ-Derived Contribution to Total Annual Zinc Deposition (kg/km2) from Teck-
Cominco. ............................................................................................................................................. 27 Figure 3-20. CMAQ-Derived Contribution to Total Annual Cadmium Deposition (kg/km2) from Teck-
Cominco. ............................................................................................................................................. 28 Figure 3-21. CMAQ-Derived Contribution to Simulated Total Annual Arsenic Deposition (kg/km2)
from Teck-Cominco. ............................................................................................................................ 28 Figure 3-22. CMAQ-Derived 85-Year Cumulative Total Lead Deposition (kg/km2) from Teck-
Cominco. ............................................................................................................................................. 29 Figure 3-23. CMAQ-Derived 85-Year Cumulative Total Zinc Deposition (kg/km2) from Teck-
Cominco. ............................................................................................................................................. 29 Figure 3-24. CMAQ-Derived 85-Year Cumulative Total Cadmium Deposition (kg/km2) from Teck-
Cominco. ............................................................................................................................................. 30 Figure 3-25. CMAQ-Derived 85-Year Cumulative Total Arsenic Deposition (kg/km2) from Teck-
Cominco. ............................................................................................................................................. 30 Figure 4-1. Distribution of Wind Direction and Wind Speed for Kettle Falls and Gold Mountain. ................................. 32 Figure 4-2. . Distribution of Wind Direction and Wind Speed for Kettle Falls and Gold Mountain. ............................... 34
List of Tables Table 2-1. Annual Average Wind Speed and Direction Data
for the Period June 1929 through May 1930 at Northport, WA. ............................................................ 6 Table 3-1. Summary of Annual Emissions Totals for 1990 for the Teck-Cominco Facility,
as Used in the CMAQ Application. ...................................................................................................... 15

1. Introduction This report summarizes the results of a preliminary assessment of emissions of SO2, mercury, and other metals from the Teck-Cominco smelter, located in Trail, British Columbia and air quality and atmospheric deposition within the upper Columbia River Basin. This assessment included an examination of historical literature, an analysis of local meteorological data, and a preliminary air quality modeling exercise using existing and available modeling databases. Air quality modeling tools were used to examine the impacts of airborne SO2 emissions on air concentrations of SO2 and the deposition of airborne emissions of mercury and other metals to land and water surfaces. From these analysis components, a preliminary conceptual model was developed.
1.1. Background and Objectives A smelting facility has been in continuous operation in Trail since 1896, processing raw ore from local mines to refine various metals. The facility is located in the upper Columbia River Valley within 10 miles of the U.S. border. Originally built as a copper smelter, in the early 1900’s the facility was modified to process lead and zinc ore and expanded to become one of the largest smelting facilities in North America. At the Trail facility, the smelting of ore involves a multi-step process of heating the raw material to high temperatures in various refinement stages, resulting in a release of gaseous and particulate pollutants to the atmosphere, including sulfur dioxide (SO2), mercury, other metals such as lead, zinc, cadmium and arsenic, as well as coarse and fine particulate matter (PM10 and PM2.5). Located in a steep valley along the upper Columbia River, local winds in the Trail area are greatly influenced by the local topography to the point where emissions from the Trail smelter are often trapped within the confines of the steep valley, limiting dispersion, and resulting in material flowing up the valley northward towards Castlegar, B.C. and down the valley southward into the State of Washington.
There is a long history of adverse air pollution impacts from the Trail facility, originally operated in the early years by the Consolidated Mining and Smelting Company of Canada, Ltd. (CM&S). Since the beginning of operations, local farmers and landowners in the upper Columbia River valley near Trail and in Washington complained and filed various lawsuits contending damage to crops and livestock from smoke and other emissions. In 1924, local farmers in the Trail area won a settlement from the facility for damaged crops. At the time, the company managed to obtain “smoke-damage easements” for lands in the local vicinity of the facility, limiting potential future property damage claims. In 1925, local farmers in Stevens County, Washington also complained of environmental damage from smoke and SO2 emissions from the Trail facility, and an International Joint Commission (IJC) was established to evaluate the situation. At the time, field studies were conducted in the area by various investigators, including those from the U.S. Department of Agriculture (USDA) and other specialists hired by CM&S to assess damage to livestock, crops, forests, and soils. The studies were used to support an initial damage settlement in 1931 to local farmers, loggers, and land owners, followed in 1941 by a final settlement.
In 1925, a Cottrell electrostatic precipitator was installed at the facility to capture and reduce the emissions of primary particulates. In 1930, a sulfur recovery facility was added to the Trail complex to utilize the excess sulfur from the smelting process to prepare fertilizers and sulfuric acid, resulting in a significant reduction in SO2 emissions. However, because of its relatively
ICF International 1 Environment International Ltd. 11-018 April 2011

Air Quality and Deposition Analysis for the Upper Columbia River Basin Introduction
high vapor pressure, mercury continued to be emitted in relatively high quantities until 1997 when the old blast furnace and sintering facilities were replaced by the Kivcet flash smelter, resulting in significant reductions in smoke and metals emitted to the atmosphere.
Given the century-long operation of the Trail smelter facility, the air flow patterns in the area, and the findings of the original SO2 damage assessments from the 1920 and 1930’s, it is estimated that emissions of mercury and other metals from the facility have also contributed to deposition and potential damage downwind of the facility in the State of Washington. Therefore, the objective of this assessment was to conduct a preliminary analysis of potential long-term air quality impacts of the Trail facility on the upper Columbia River basin/watershed, including the lands of the Colville Reservation. The primary focus of this analysis was on the impacts of SO2,
mercury, lead, zinc, cadmium, and arsenic emissions and included an examination of historical data and literature, an analysis of local wind patterns using data from local monitors, and a preliminary air quality modeling analysis with existing modeling databases to simulate emissions, transport, and deposition. From these analyses, a preliminary conceptual model was developed. Further, this work was conducted to investigate whether there is enough potential evidence revealed by this preliminary assessment to warrant additional analyses to support claims by the Colville Tribe of long-term environmental damage to the upper Columbia River basin, including the Colville Reservation.
1.2. Description of the Topography, Meteorology, and Emissions of the Region
Topography Located between the Monashee Mountains to the west and the Selkirk Mountains to the east, the City of Trail is situated 1440 feet (ft) above sea level (asl) on the banks of the Columbia River, which runs north-south at this location. The local topography in the vicinity of Trail is dominated by the terrain features of the river valley, the sides of which rise steeply to over 3000 ft asl. Just south of Trail, the river turns eastward and then southward near the U.S. border and flows into the northeastern part of the State of Washington, and eventually into Lake Roosevelt, formed in 1939 with the building of the Grand Coulee Dam. The valley is between one and two miles wide from Trail to the Grand Coulee Dam with multiple elevated benches on either side of the river in many locations.
Meteorology The local weather in Trail is influenced by continental air masses dropping down from northern Canada as well as systems moving eastward across southern Canada from the northern Pacific Ocean. The summers in Trail reflect average high temperatures in the upper 80’s (degrees Fahrenheit) with average low temperatures in the low 50’s. The winters exhibit average high temperatures in the 30’s and 40’s and average low temperatures in the 20’s. Located on the lee side of the Canadian Cascade Range, precipitation in the Trail area is relatively low, with average annual totals of just over 20 inches. Slightly more precipitation falls in the winter months than the summer months.
ICF International 2 Environment International Ltd. 11-018 April 2011

Air Quality and Deposition Analysis for the Upper Columbia River Basin Introduction
Local winds in the Trail area are greatly influenced by the terrain features of the deep Columbia River Valley. Consistent throughout the year, daytime winds reflect up-valley (southerly) flow at the surface while nighttime winds reflect down-valley (northerly) flow induced by radiative cooling and sinking of air on the steep slopes of the river valley and a general “drainage” of this air down the valley until flow reversal commences the next morning, sometime after sunrise. The strength and depth of these local wind/flow features and the timing of the flow reversal are influenced by the overlying synoptic and mesoscale weather systems. The river valley also induces temperature inversions, which stabilize the air in the valley, causing fog and limited mixing and dispersion conditions, especially in the winter.
Emissions The emissions in the Trail area are dominated by the Teck-Cominco smelting complex. The recently installed Kivcet smelter includes a lead furnace baghouse stack, two slag furnace baghouse stacks, and a zinc stack. The emissions from the smelter consist mainly of SO2, heavy metals, and particulate matter, with minor amounts of nitrogen oxides (NOx) and other emissions. This analysis used annual emission estimates for 1990 as reported by Teck-Cominco (2009) and Queneau (2010). Specifically, the following annual emission amounts for 1990 from the Teck-Cominco report were used:
SO2: 14,600 metric tons
Mercury: 2,555 kg
PM10: 766.5 metric tons
PM2.5: 328.5 metric tons
NOx: 40 metric tons.
In addition, the following annual emission amounts for 1990 from the Queneau report were used:
Lead: 109 tons
Zinc: 64 tons
Cadmium: 4.4 tons
Arsenic: 15.7
With a population of less than 8,000 in the Trail area, emissions from mobile and other anthropogenic sources are small compared to the emissions from the Teck-Cominco complex. Emissions of volatile organic compounds (VOC) from trees and other local vegetation may also influence local air quality.
1.3. Overview of the Analysis and Modeling Methods This assessment included an examination of some of the historical data and literature from the late 1920’s and 1930’s related to the complaints by Washington farmers regarding crop damage from CM&S facility emissions. A number of memos and letters prepared by investigators from the USDA and those hired by CM&S were examined to better understand the origins of the
ICF International 3 Environment International Ltd. 11-018 April 2011

Air Quality and Deposition Analysis for the Upper Columbia River Basin Introduction
ICF International 4 Environment International Ltd. 11-018 April 2011
damage complaints and the findings of the various field investigations related to the study of air transport patterns, ambient concentrations of SO2, and resulting damage to crops, forests, and other vegetation in the upper Columbia River and adjacent tributary creek valleys.
In addition, more recent local and regional meteorological data were obtained and examined. Recent meteorological measurement data consisting of hourly surface wind measurements were obtained for several monitoring sites including Kettle Falls and Gold Mountain. Upper-air wind measurements were obtained from the National Weather Service (NWS) monitoring site in Spokane. These data were examined to analyze long-term wind flow climatology and to support the development of the conceptual model of dispersion characteristics in the region.
To complete this assessment, regional-scale air quality modeling was conducted in order to obtain a preliminary assessment of the potential impacts of emissions from the Teck-Cominco facility on air quality and deposition within the upper Columbia River Basin. The modeling analysis focused on both a recent year (1990), a historical year (1930), and an estimate of cumulative deposition for an 85-year period (1921-2005).
Version 4.6 of EPA’s Community Multiscale Air Quality (CMAQ) modeling system was applied to simulate SO2, mercury (Hg), and other metals. The CMAQ Particle and Precursor Tagging Methodology (PPTM) was used in this study to provide information about the contribution of emissions from the Teck-Cominco facility and other selected sources to simulated concentrations and deposition amounts. Simulations were performed using emission estimates for 1990 (pre-Kivcet). The emissions were also “backcasted” to 1930 levels for a retrospective analysis, prior to the installation of the fertilizer plant.
CMAQ was applied for a five-month simulation period with meteorological conditions corresponding to May through September 2002 and also for a full annual simulation period corresponding to 2005. The application of CMAQ used a horizontal grid resolution of 12 kilometers (km), which may be too coarse to adequately resolve the local transport and dispersion features induced by complex terrain in the vicinity of the Trail facility, but which is expected to provide some perspective regarding the impact of emissions from the facility on air quality and deposition throughout the region of interest.
The modeling work was conducted to support the further development of a conceptual model of air pollution transport and deposition and to estimate long-term cumulative deposition of mercury and other metals within the upper Columbia River Basin, including the Colville Reservation.
The assessment summarized herein was conducted to provide a preliminary analysis of whether mercury and other metals emitted to the atmosphere from the Trail facility have resulted in changes in air quality (changes in SO2 concentrations) and long-term deposition of metals in the upper Columbia River watershed, including important tributary creeks that flow into the Columbia and lakes located throughout the Colville Reservation and eastern Washington.

2. Evaluation of Historical Data and Analyses For this assessment, historical literature in the form of various letters, memos, and reports were briefly reviewed to evaluate the data that were collected and the analyses that were conducted to assess the effects of emissions from the Trail facility on livestock, crops, forests, and other vegetation in the upper Columbia River Valley. The majority of this literature was obtained from historical archives from the late 1920’s and early 1930’s of litigation between farmers in northern Washington and CM&S, predecessor of Teck-Cominco.
Since 1896, a metals smelting facility has been in near-continuous operation in Trail, B.C., and during the first 35 years of operation, large quantities of SO2, smoke (PM10 and PM2.5), mercury, and other heavy metals were emitted directly into the atmosphere from the facility complex. (A smaller smelter, located down the river from Trail at Northport, WA known as the Le Roi smelter, was also operated off and on by the Northport Smelting and Refining Company, from 1898 until 1921). A description of the original smelting process at the Trail facility is provided in the following:
“Purging the sulphur from the ore, the first step in the process, was carried out in the open using the heap method of roasting. The ore was merely piled up with cordwood and limestone intermixed and set alight, leaving choking yellow clouds of sulphur di-oxide and smoke to roll down off Smelter Hill and drain away the best it could via the River channel.” (Wilson, 2002).
The negative impacts on local air quality from the Trail facility emissions were well known from the beginning, as summarized by Wilson (2002).
“Included in G.W. Taylor’s The Railway Contractors (Morriss Publishing Ltd., Victoria, 1988) is a photograph of Trail Creek Landing taken from across the River, circa 1892. Behind Topping and Hanna’s Trail Creek House, what is now Smelter Hill rises well treed with what looks to be Grand fir and Western White pine, the valley of the Creek and the foot of Lookout Mountain are thick with growth. By the end of W.W.I, the whole region was a barren moonscape. Granted, the mature timber had all been cut down in the 1890s to built Trail and feed the Smelter, but only the ugliest and stunted of growth regenerated. For years Trailites had shrugged off the fumes soaking their city as a sign of prosperity; the Smelter was working. People muttered that their kids and livestock got sick, that their garden vegetables tasted odd, and that fruit trees refused to grow. The mulberry trees that had been carefully nurtured for decades on plots in the Gulch were faltering, nipping Trail’s unique silk industry in the bud. Philosophically, however, the citizens of Trail accepted the pollution as the price to be paid for prosperity.”
In addition to the complaints and lawsuit brought against CM&S in 1924 by farmers in Trail, in 1925 local farmers and other land owners in the northern areas of Stevens County, Washington also complained that smoke and SO2 emissions from the Trail facility were damaging livestock, crops, and other vegetation. On behalf of the farmers & landowners, a lawsuit was filed against CM&S. As part of this litigation, an International Joint Commission (IJC) was established and a number of studies were funded by the U.S. and Canadian governments and by CM&S to
ICF International 5 Environment International Ltd. 11-018 April 2011

Air Quality and Deposition Analysis for the Upper Columbia River Basin Evaluation of Historical Data and Analyses
evaluate the extent of the damage to vegetation and to investigate the potential causes of the damage. For example, investigators hired by CM&S conducted damage assessments throughout the Columbia River Valley and its tributaries to assess foliar damage by SO2 in Stevens County in 1927 and 1928 (CM&S Report, 1927). A number of surveys were conducted on what were referred to as “smoke visitation days” to assess damage. Annual surveys for the period 1927 to 1931 were also conducted by the investigators of the USDA.
In addition to conducting the damage surveys, the USDA’s Weather Bureau set up a weather station at Northport and collected daily surface maximum and minimum temperature, prevailing wind direction, and precipitation data for the period 1927 to 1930 to evaluate local meteorological conditions (CM&S Report, 1928). For the period June 1929 through May 1930, the Weather Bureau also conducted thrice-daily upper-air wind measurements at Northport to investigate local wind flow patterns aloft. Pilot balloons were released at 5 am, 12 noon, and 4 pm local time to sample wind speed and direction for the surface and six levels above Northport (280, 1100, 1920, 3560, and 5200 ft. agl). Table 2-1 presents the Weather Bureau’s summary of average wind speed and direction data for these levels for the June 1929 through May 1930 period (Keyser, 1937). Wind direction is defined as the direction from which the wind is blowing.
Table 2-1. Annual Average Wind Speed and Direction Data for the Period June 1929 through May 1930 at Northport, WA.
Elevation (ft agl)
5 AM 12 Noon 4 PM
Direction Speed (mph) Direction Speed
(mph) Direction Speed (mph)
Surface NE 2.2 SW 0.4 SW 0.6
280 NE 3.0 SSW 1.0 SW 1.4
1100 NE 4.2 SW 1.6 SW 2.8
1920 NE 4.1 SW 2.6 SW 3.7
3560 SSW 1.7 SW 4.7 SW 5.0
5200 WSW 6.3 WSW 6.7 WSW 6.3
These data are graphically depicted in Figure 2-1 for each measurement time. The data clearly reflect airflow during the nighttime and early morning hours from the northeast in a nearly 2000 ft thick layer, as it “drains” southward down the river valley. By noon, the winds reverse direction and flow up the river valley during the remainder of the afternoon. At some point in the evening, after sunset, the air cools along the slopes of the river valley and the nighttime drainage regime commences again and persists until sometime after 5:00 am. As evident in the data collected during this one-year period, there are day-to-day differences in this typical pattern, but on average, it is persistent and occurs during all months of the year. This phenomenon is also reported on by R. E. Neidig (CM&S, 1927) in the following:
ICF International 6 Environment International Ltd. 11-018 April 2011

Air Quality and Deposition Analysis for the Upper Columbia River Basin Evaluation of Historical Data and Analyses
“Observations to date indicate that smoke visitations in the Columbia River Valley are dependent on atmospheric conditions. Winds blowing down stream for a sufficient length of time or long periods of calm associated with a low barometric pressure for a sufficient length of time to cause the valley to fill with smoke and gradually drift down stream will result in smoke in the Northport area. My observations thus far, indicate a general tendency of winds down stream at night and up stream during the day. The drift at night is usually down stream. This results in seeing smoke up stream from Northport or vicinity because of the up stream air current developing usually between seven and nine A.M. If, however, the wind or slight breeze is down stream all day, and continues during the night, smoke may be seen in the valley at Northport and below.”
These first-hand observations support the historical data collected at Northport which definitively show a persistent nighttime river valley “drainage” flow regime, a mechanism capable of transporting emissions from the Trail facility down and through the Columbia River valley well into Stevens County and beyond.
Figure 2-1a. Annual Average Upper-level Winds at Northport, WA for the Period June 1929 through May 1930 – 5 AM.
1100 ft
1920 ft
4 mph
3560 ft
5200 ft
2 mph
280 ft
ICF International 7 Environment International Ltd. 11-018 April 2011

Air Quality and Deposition Analysis for the Upper Columbia River Basin Evaluation of Historical Data and Analyses
Figure 2-1b. Annual Average Upper-level Winds at Northport, WA for the Period June 1929 through May 1930 – 12 Noon.
5200 ft
3560 ft
1920 ft
1100 ft
2 mph
4 mph
280 ft
Figure 2-1c. Annual Average Upper-level Winds at Northport, WA for the Period June 1929 through May 1930 – 5 PM.
5200 ft
3560 ft
1920 ft
1100 ft
280 ft
4 mph
2 mph
ICF International 8 Environment International Ltd. 11-018 April 2011

Air Quality and Deposition Analysis for the Upper Columbia River Basin Evaluation of Historical Data and Analyses
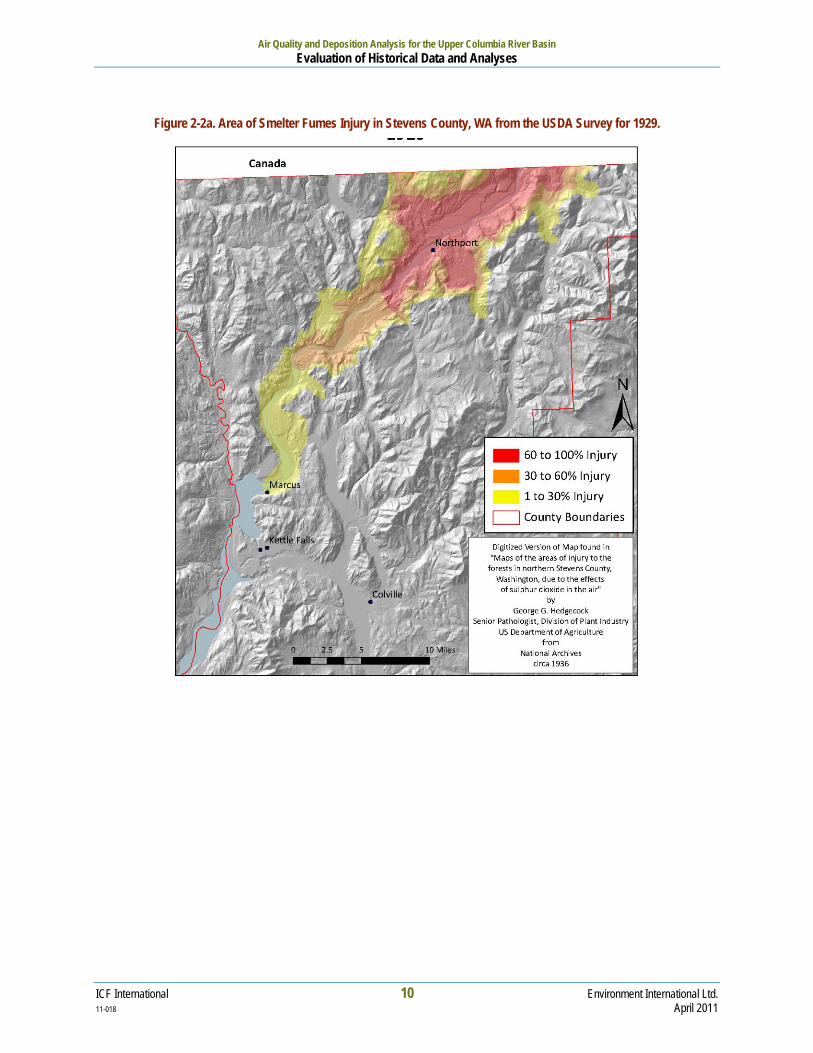
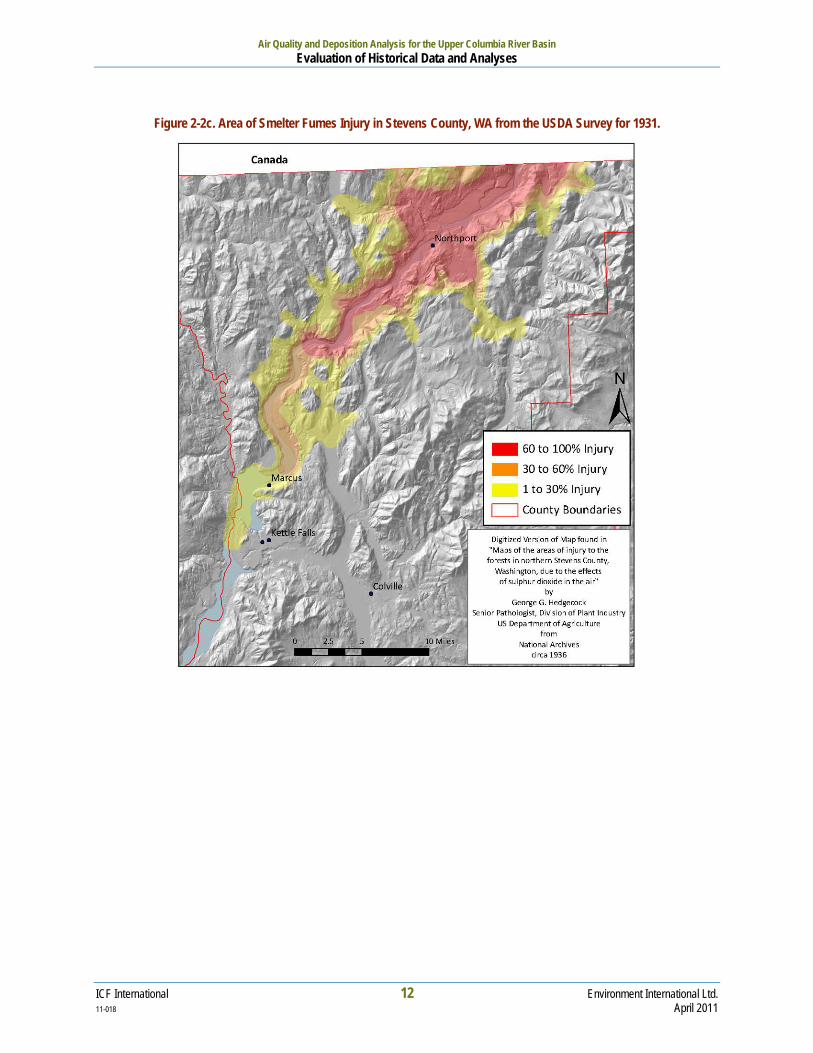
From the USDA damage surveys conducted in 1929 - 1931, maps depicting “Areas of Smelter Fumes Injury” were produced for each year depicting injury areas to forests along the main Columbia River Valley in Washington, with other injury areas occurring in the numerous tributary side valleys. Figure 2-2 presents the maps for these three years (USDA, 1936), showing major damage (60 to 100 percent injury) from the Canadian border well past Northport, with minor damage occurring in the vicinity of Kettle Falls. Although consistent injury patterns are shown from year to year, the maps indicate more extensive injury in 1930 and 1931 compared to 1929. The major areas of injury occurred closest to the Columbia River, with injury also occurring in the various tributary creek valleys.
It is evident from these maps that the majority of the vegetation damage identified during the three-year survey program in the upper Columbia River Valley was the result of direct exposure to emissions of SO2 and other constituents from the CM&S facility. Given the levels of mercury also contained in the plumes emanating from the facility during this period, it is quite likely that high levels of mercury deposition also occurred in these areas and further down river during these and all other years of operation of the facility.
ICF International 9 Environment International Ltd. 11-018 April 2011
Air Quality and Deposition Analysis for the Upper Columbia River Basin Evaluation of Historical Data and Analyses
Figure 2-2a. Area of Smelter Fumes Injury in Stevens County, WA from the USDA Survey for 1929.
ICF International 10 Environment International Ltd. 11-018 April 2011

Air Quality and Deposition Analysis for the Upper Columbia River Basin Evaluation of Historical Data and Analyses
Figure 2-2b. Area of Smelter Fumes Injury in Stevens County, WA from the USDA Survey for 1930.
ICF International 11 Environment International Ltd. 11-018 April 2011
Air Quality and Deposition Analysis for the Upper Columbia River Basin Evaluation of Historical Data and Analyses
Figure 2-2c. Area of Smelter Fumes Injury in Stevens County, WA from the USDA Survey for 1931.
ICF International 12 Environment International Ltd. 11-018 April 2011

3. Regional Modeling Application The CMAQ model was used to simulate SO2 concentrations and deposition of mercury and other metals within the upper Columbia River Basin. This section of the report describes the methods and results of the CMAQ model applications.
3.1. Overview of the CMAQ Model with PPTM The CMAQ model (Byun and Ching, 1999) is a state-of-the-science, regional air quality modeling system that is designed to simulate the physical and chemical processes that govern the formation, transport, and deposition of gaseous and particulate species in the atmosphere. CMAQ is a “one atmosphere” model which refers to the ability of the model to dynamically simulate ozone, particulate matter, and other species (such as mercury) in a single simulation. In addition to addressing a variety of pollutants, CMAQ can be applied to a variety of regions (with varying geographical, land-use and emissions characteristics) and for a range of different space and time scales. Numerous recent applications of the model, for both research and regulatory air quality planning purposes, have focused on the simulation of ozone, PM2.5, and mercury.
The Particle and Precursor Tagging Methodology (PPTM) feature of CMAQ (Douglas et al., 2007) is designed to provide detailed, quantitative information about the contribution of selected sources, source categories, and/or source regions to simulated air pollutant concentrations and (wet and dry) deposition. Emissions of precursor pollutants from selected sources, source categories, or source regions are (numerically) tagged and then tracked throughout a simulation. The contribution from each tag to the resulting simulated concentration or deposition of any species for any given location within the CMAQ modeling domain can be quantified. By tracking the emissions from selected sources or source locations, the methodology provides information on the fate of the emissions from these sources.
3.2. CMAQ Application Procedures This exploratory application of CMAQ for the upper Columbia River Basin used, as much as possible, input files from prior applications of the model. The simulation periods, modeling domain, and input files are briefly described in this section of the memorandum.
Simulation Periods The CMAQ model was applied for two simulation periods. The base-year meteorological inputs for the first simulation represent May through September 2002. The base-year meteorological inputs for the second simulation represent the entire year 2005. The simulation periods were selected to make use of available databases. In both cases, the inputs were obtained from EPA and were originally developed for other studies. The 2002 period was limited to May through September, since12-km resolution meteorological input fields are only available for these months. The results were extrapolated to approximate annual average concentrations and total annual deposition. For 2005, 12-km resolution meteorological fields are available for all months.
ICF International 13 Environment International Ltd. 11-018 April 2011
Air Quality and Deposition Analysis for the Upper Columbia River Basin Regional Modeling Application
For both applications, the base year for the emissions is 1990. The emissions and modeling results were also backcasted to 1930s levels in order to examine possible historical air quality and contribution levels. The modeling results for 1930 and 1990 were interpolated to the intervening years 1940, 1950, 1960, 1970, and 1980.
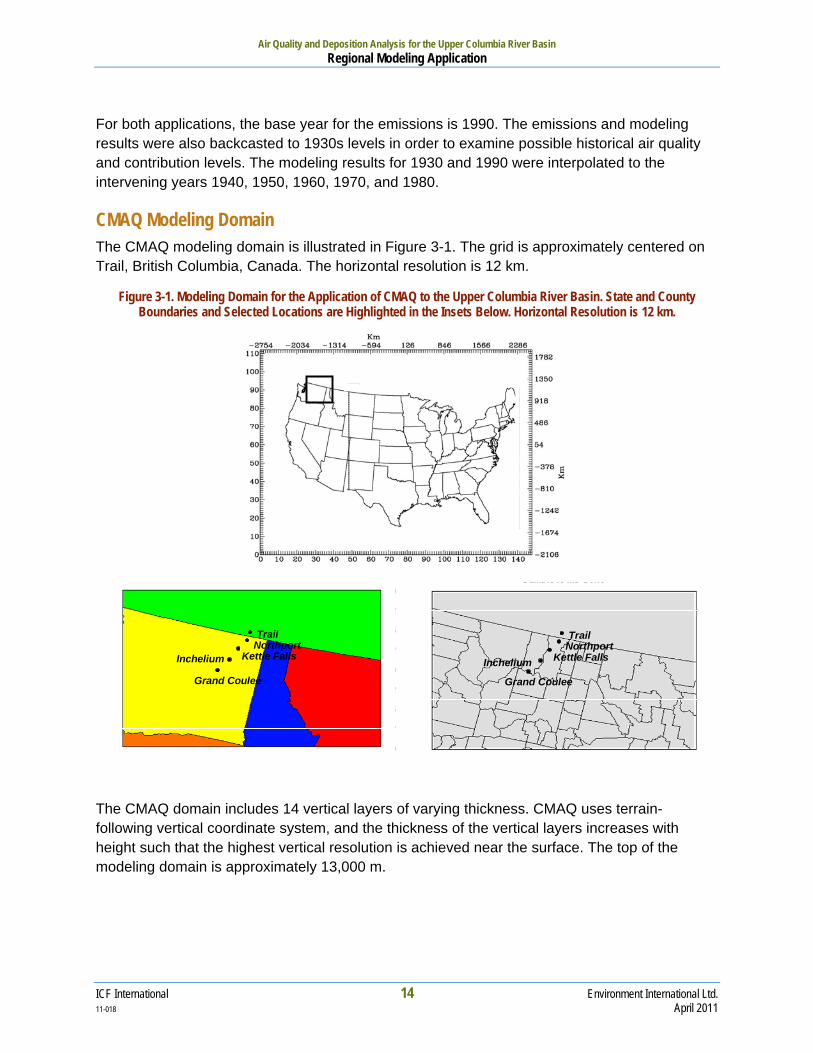
CMAQ Modeling Domain The CMAQ modeling domain is illustrated in Figure 3-1. The grid is approximately centered on Trail, British Columbia, Canada. The horizontal resolution is 12 km.
Figure 3-1. Modeling Domain for the Application of CMAQ to the Upper Columbia River Basin. State and County Boundaries and Selected Locations are Highlighted in the Insets Below. Horizontal Resolution is 12 km.
TrailNorthport
Kettle FallsInchelium
Grand Coulee
TrailNorthport
Kettle FallsInchelium
Grand Coulee
TrailNorthport
Kettle FallsInchelium
Grand Coulee
TrailNorthport
Kettle FallsInchelium
Grand Coulee
The CMAQ domain includes 14 vertical layers of varying thickness. CMAQ uses terrain-following vertical coordinate system, and the thickness of the vertical layers increases with height such that the highest vertical resolution is achieved near the surface. The top of the modeling domain is approximately 13,000 m.
ICF International 14 Environment International Ltd. 11-018 April 2011

Air Quality and Deposition Analysis for the Upper Columbia River Basin Regional Modeling Application
Input Preparation Emission inventories CMAQ requires hourly, gridded emissions for a number of different species, including criteria pollutants, related precursor species, and mercury. The criteria pollutant portion of the inventory includes emissions for nitrogen oxides (NOx), volatile organic compounds (VOC), sulfur dioxide (SO2), ammonia (NH3), primary particulates, and numerous other precursor species. These emissions are primarily used to simulate ozone and particulate matter, and certain species are also involved in reactions concerning mercury. The mercury portion of the emission inventory includes emissions for the three forms of mercury including elemental (HG0), reactive gaseous or divalent (HG2), and particle bound (HGP). A CMAQ model-ready criteria pollutant emission inventory for 1990 from a recent EPA-sponsored study of the cost and benefits of the Clean Air Act (CAA) (Douglas et al., 2008a) was used as the basis for this study. The emissions for the modeling domain were extracted from a larger 12-km horizontal resolution domain used for the EPA study. Mercury emissions for point sources located within the modeling domain (Myers et al., 2007) were added to the inventory. Emissions for all species for the Teck-Cominco facility in Trail, British Columbia (Teck-Cominco, 2009; Queneau, 2010) were also added to the inventory. These are summarized in Table 3-1.
Table 3-1. Summary of Annual Emissions Totals for 1990 for the Teck-Cominco Facility, as Used in the CMAQ Application.
Emissions Species Units Emissions Amount
Sulfur dioxide (SO2) metric tons/year 14,600
Volatile organic compounds (VOC) metric tons/year 0
Nitrogen oxides (NOx) metric tons/year 40
Ammonia (NH3) metric tons/year 68
Particulate matter <= 10 microns (PM10) metric tons/year 328.5
Particulate matter <= 2.5 microns (PM2.5) metric tons/year 766.5
Mercury (Hg) kg/year 2,555
Lead (Pb) tons/yr 109
Zinc (Zn) tons/yr 64
Cadmium (Cd) tons/yr 4.4
Arsenic (As) tons/yr 15.7
Particulate matter emissions were assumed to be 30 percent PM10 and 70 percent PM2.5, based on Teck-Cominco emission inventory data for 2002. The mercury emissions were apportioned into elemental, divalent, and particle-bound mercury using an 80/15/5 percent split. The Sparse-Matrix Operator Kernel Emissions (SMOKE) processing system was used, as needed, to process the emissions and merge emission inventory components into a model-ready emissions inventory for CMAQ.
ICF International 15 Environment International Ltd. 11-018 April 2011

Air Quality and Deposition Analysis for the Upper Columbia River Basin Regional Modeling Application
Meteorological Inputs As noted earlier, meteorological input files obtained from EPA were used for this study. For both the 2002 and 2005 simulation periods, these were prepared by EPA for use in CMAQ modeling using the Pennsylvania State University/National Center for Atmospheric Research (PSU/NCAR) Fifth Generation Mesoscale Model (MM5) (Dolwick et al., 2007). The MM5 outputs were postprocessed by EPA for input to CMAQ using the Meteorology-Chemistry Interface Processor (MCIP) program. The 12-km meteorological fields for this application were extracted from a larger 12-km domain used by EPA.
Initial and Boundary Conditions and Other Geophysical Data For this study, existing initial condition, boundary condition, land-use and photolysis rate input files prepared by EPA for use in CMAQ modeling for the selected modeling domain and simulation periods (EPA, 2005) were used. For mercury, the boundary conditions were extracted from the output of a global model—the Chemical Transport Model (CTM) (Shia et al., 1999; Seigneur et al., 2001).
3.3. SO2 Contribution Analysis
1990 Baseline CMAQ/PPTM simulations were conducted using the baseline 1990 emissions inventory to assess the contributions of emissions from Teck-Cominco and other selected sources to simulated concentrations. The PPTM methodology was used to tag and track the contributions to simulated SO2 concentrations from:
Teck-Cominco emissions
Emissions from all others sources in the modeling domain
IC/BCs (initial and boundary conditions).
Plots of simulated annual average SO2 concentration and PPTM results are shown in Figure 3-2 through Figure 3-5. In each figure, the first plot (left) shows the results using the 2002 meteorological inputs and the second plot (right) shows the results using the 2005 meteorological inputs. Note that the 2002 period consists of only five months, and the five-month average was used to represent the annual average. Figure 3-2 presents the overall model-based annual average SO2 concentrations. Figure 3-3 shows the contribution from Teck-Cominco. Figure 3-4 shows the contribution from all other sources within the modeling domain, and Figure 3-5 shows the contribution from the IC/BCs. The units are parts per billion (ppb).
ICF International 16 Environment International Ltd. 11-018 April 2011
Air Quality and Deposition Analysis for the Upper Columbia River Basin Regional Modeling Application
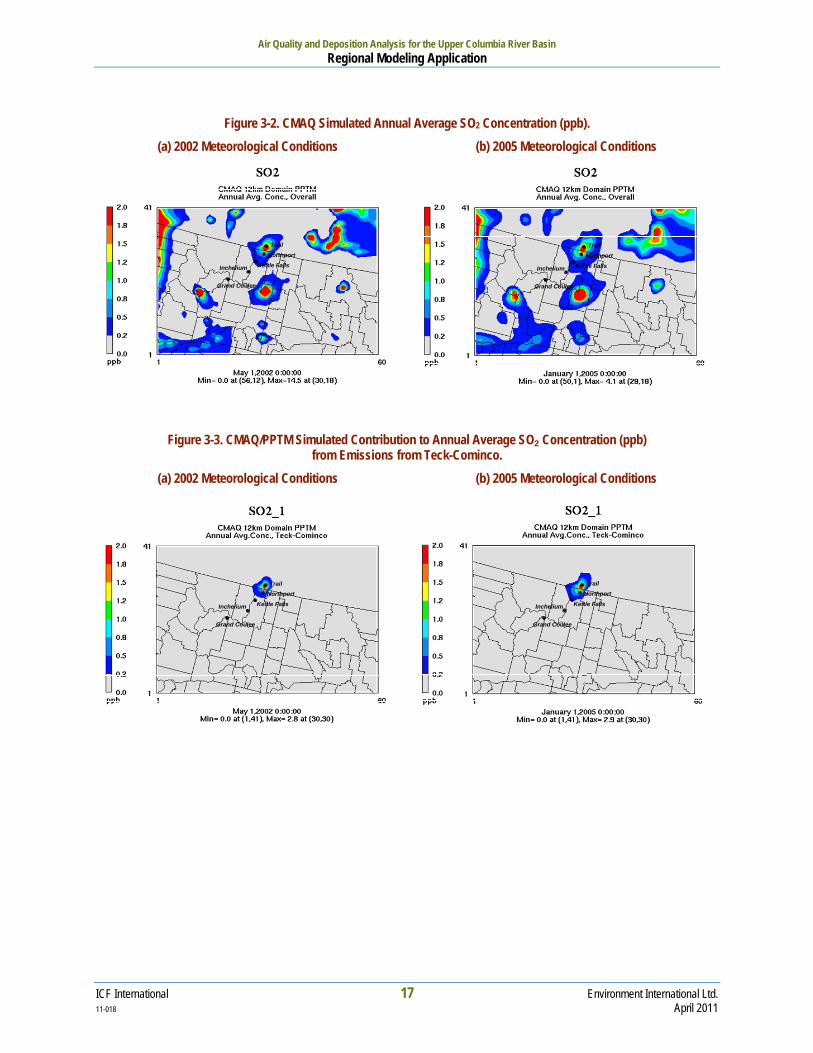
Figure 3-2. CMAQ Simulated Annual Average SO2 Concentration (ppb). (a) 2002 Meteorological Conditions (b) 2005 Meteorological Conditions
TrailNorthport
Kettle FallsInchelium
Grand Coulee
TrailNorthport
Kettle FallsInchelium
Grand Coulee
Figure 3-3. CMAQ/PPTM Simulated Contribution to Annual Average SO2 Concentration (ppb) from Emissions from Teck-Cominco.
(a) 2002 Meteorological Conditions (b) 2005 Meteorological Conditions
TrailNorthport
Kettle FallsInchelium
Grand Coulee
TrailNorthport
Kettle FallsInchelium
Grand Coulee
ICF International 17 Environment International Ltd. 11-018 April 2011
Air Quality and Deposition Analysis for the Upper Columbia River Basin Regional Modeling Application
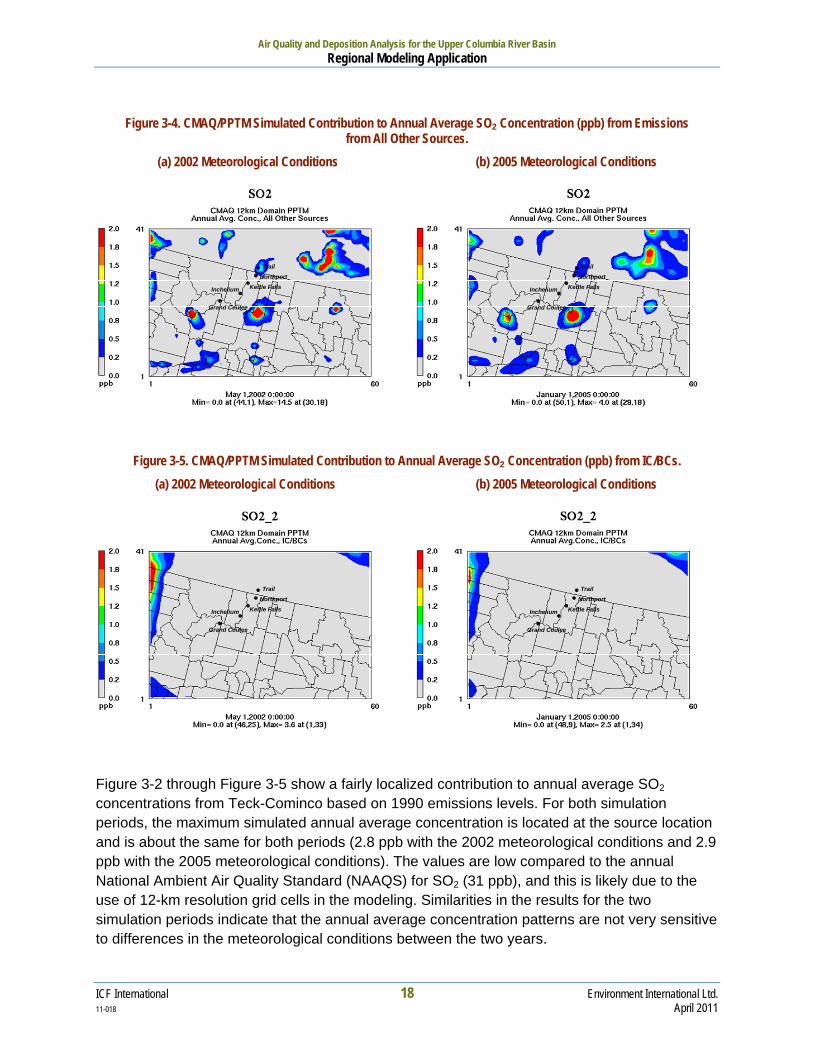
Figure 3-4. CMAQ/PPTM Simulated Contribution to Annual Average SO2 Concentration (ppb) from Emissions from All Other Sources.
(a) 2002 Meteorological Conditions (b) 2005 Meteorological Conditions
TrailNorthport
Kettle FallsInchelium
Grand Coulee
TrailNorthport
Kettle FallsInchelium
Grand Coulee
Figure 3-5. CMAQ/PPTM Simulated Contribution to Annual Average SO2 Concentration (ppb) from IC/BCs. (a) 2002 Meteorological Conditions (b) 2005 Meteorological Conditions
TrailNorthport
Kettle FallsInchelium
Grand Coulee
TrailNorthport
Kettle FallsInchelium
Grand Coulee
Figure 3-2 through Figure 3-5 show a fairly localized contribution to annual average SO2 concentrations from Teck-Cominco based on 1990 emissions levels. For both simulation periods, the maximum simulated annual average concentration is located at the source location and is about the same for both periods (2.8 ppb with the 2002 meteorological conditions and 2.9 ppb with the 2005 meteorological conditions). The values are low compared to the annual National Ambient Air Quality Standard (NAAQS) for SO2 (31 ppb), and this is likely due to the use of 12-km resolution grid cells in the modeling. Similarities in the results for the two simulation periods indicate that the annual average concentration patterns are not very sensitive to differences in the meteorological conditions between the two years.
ICF International 18 Environment International Ltd. 11-018 April 2011

Air Quality and Deposition Analysis for the Upper Columbia River Basin Regional Modeling Application
Plots of simulated 24-hour average SO2 concentration and PPTM results (for the day with the maximum contribution from Teck-Cominco in the area of interest) are shown in Figure 3-6 through Figure 3-7. Figure 3-6 presents the overall simulated 24-hour average SO2
concentration. Figure 3-7 shows the contribution from Teck-Cominco. Figure 3-8 shows the contribution from all other sources and Figure 3-9 shows the contribution from the IC/BCs. For 2002, the simulation day with the maximum contribution is May 19th, and for 2005 it is October 19th. Note the change in scale compared to the plots of annual average concentration.
Figure 3-6. CMAQ Simulated Maximum 24-Hour Average SO2 Concentration (ppb). (a) 2002 Meteorological Conditions (b) 2005 Meteorological Conditions
TrailNorthport
Kettle FallsInchelium
Grand Coulee
TrailNorthport
Kettle FallsInchelium
Grand Coulee
Figure 3-7. CMAQ/PPTM Simulated Contribution to Maximum 24-Hour Average SO2 Concentration (ppb) from Emission from Teck-Cominco.
(a) 2002 Meteorological Conditions (b) 2005 Meteorological Conditions
TrailNorthport
Kettle FallsInchelium
Grand Coulee
TrailNorthport
Kettle FallsInchelium
Grand Coulee
ICF International 19 Environment International Ltd. 11-018 April 2011

Air Quality and Deposition Analysis for the Upper Columbia River Basin Regional Modeling Application
Figure 3-8. CMAQ/PPTM Simulated Contribution to Maximum 24-Hour Average SO2 Concentration (ppb) from Emissions from All Other Sources
(a) 2002 Meteorological Conditions (b) 2005 Meteorological Conditions
TrailNorthport
Kettle FallsInchelium
Grand Coulee
TrailNorthport
Kettle FallsInchelium
Grand Coulee
Figure 3-9. CMAQ/PPTM Simulated Contribution to Maximum 24-Hour Average SO2 Concentration (ppb) from IC/BCs. (a) 2002 Meteorological Conditions (b) 2005 Meteorological Conditions
TrailNorthport
Kettle FallsInchelium
Grand Coulee
TrailNorthport
Kettle FallsInchelium
Grand Coulee
Figure 3-6 and Figure 3-7 indicate that the contribution patterns for both years follow the Columbia River. For May 19th, emissions from the Teck-Cominco facility contribute to simulated SO2 levels in Kettle Falls and Inchelium. For October 19th, the contours do not extend as far south as for May 19th, but the concentrations are higher near Northport and Kettle Falls. The effects of meteorology are more pronounced on a day to day basis, compared to an annual average basis.
ICF International 20 Environment International Ltd. 11-018 April 2011

Air Quality and Deposition Analysis for the Upper Columbia River Basin Regional Modeling Application
1930 Retrospective The PPTM results can also be used to examine the contributions for different emissions levels. Historical data indicates that SO2 emissions from the Teck-Cominco facility were substantially higher in prior years, dating back to the establishment of the facility in the late 1890’s. Based on historical emissions estimates, the SO2 emissions for Teck-Cominco were backcasted to 1930s levels. To reflect 1930s levels the SO2 emissions were increased by a factor of 15 (Cominco, Ltd. 1997). The estimated retrospective SO2 contributions from Teck-Cominco are displayed in Figure 3-10 and Figure 3-11. Figure 3-10 shows the contribution from Teck-Cominco to annual average SO2 and Figure 3-11 shows the maximum contribution to 24-hour average SO2 concentration, assuming 1930 emissions levels.
Figure 3-10. Retrospective CMAQ/PPTM Simulated Contribution to Annual Average SO2 Concentration (ppb) for 1930 from Emissions from Teck-Cominco.
(a) 2002 Meteorological Conditions (b) 2005 Meteorological Conditions
TrailNorthport
Kettle FallsInchelium
Grand Coulee
TrailNorthport
Kettle FallsInchelium
Grand Coulee
Figure 3-11. Retrospective CMAQ/PPTM Simulated Contribution to Maximum 24-Hour Average SO2 Concentration (ppb) for 1930 from Emissions from Teck-Cominco.
(a) 2002 Meteorological Conditions (b) 2005 Meteorological Conditions
TrailNorthport
Kettle FallsInchelium
Grand Coulee
TrailNorthport
Kettle FallsInchelium
Grand Coulee
ICF International 21 Environment International Ltd. 11-018 April 2011

Air Quality and Deposition Analysis for the Upper Columbia River Basin Regional Modeling Application
From a historical perspective, Figure 3-10 and Figure 3-11 indicate a much greater influence of the SO2 emissions from Teck-Cominco in 1930 compared to 1990. This is consistent with vegetative damage assessments done in the 1920s and 1930s (as depicted in Figure 2-2). These results clearly illustrate the potential for SO2 emissions from the Teck-Cominco facility to have influenced air quality and resulting deposition within the Colville Indian Reservation on specific days, as well as on an annual basis since the beginning of operation.
3.4. Deposition Contribution Analysis for Mercury CMAQ/PPTM was also used to quantify the contribution of emissions from Teck-Cominco and other selected sources to simulated mercury deposition. The PPTM methodology was used to tag and track the contributions to simulated mercury deposition from:
Teck-Cominco emissions
Emissions from all other sources in the modeling domain
IC/BCs (initial and boundary conditions).
Plots of the simulated mercury deposition amounts are shown in Figure 3-12 through Figure 3-15. In each figure, the first plot (left) shows the results using the 2002 meteorological inputs and the second plot (right) shows the results using the 2005 meteorological inputs. Note that the 2002 period consists of only five months, and the results were scaled to represent annual deposition. Figure 3-12 presents the overall simulated annual total mercury deposition. Total deposition is a combination of wet and dry deposition. Figure 3-13 shows the contribution from Teck-Cominco to annual mercury deposition. Figure 3-14 shows the contribution from all other sources and Figure 3-15 shows the contribution from the IC/BCs. The units are grams per square kilometer (g/km2).
1990 Baseline Figure 3-12. CMAQ Simulated Total Annual Mercury Deposition (g/km2).
(a) 2002 Meteorological Conditions (b) 2005 Meteorological Conditions
TrailNorthport
Kettle FallsInchelium
Grand Coulee
TrailNorthport
Kettle FallsInchelium
Grand Coulee
ICF International 22 Environment International Ltd. 11-018 April 2011
Air Quality and Deposition Analysis for the Upper Columbia River Basin Regional Modeling Application
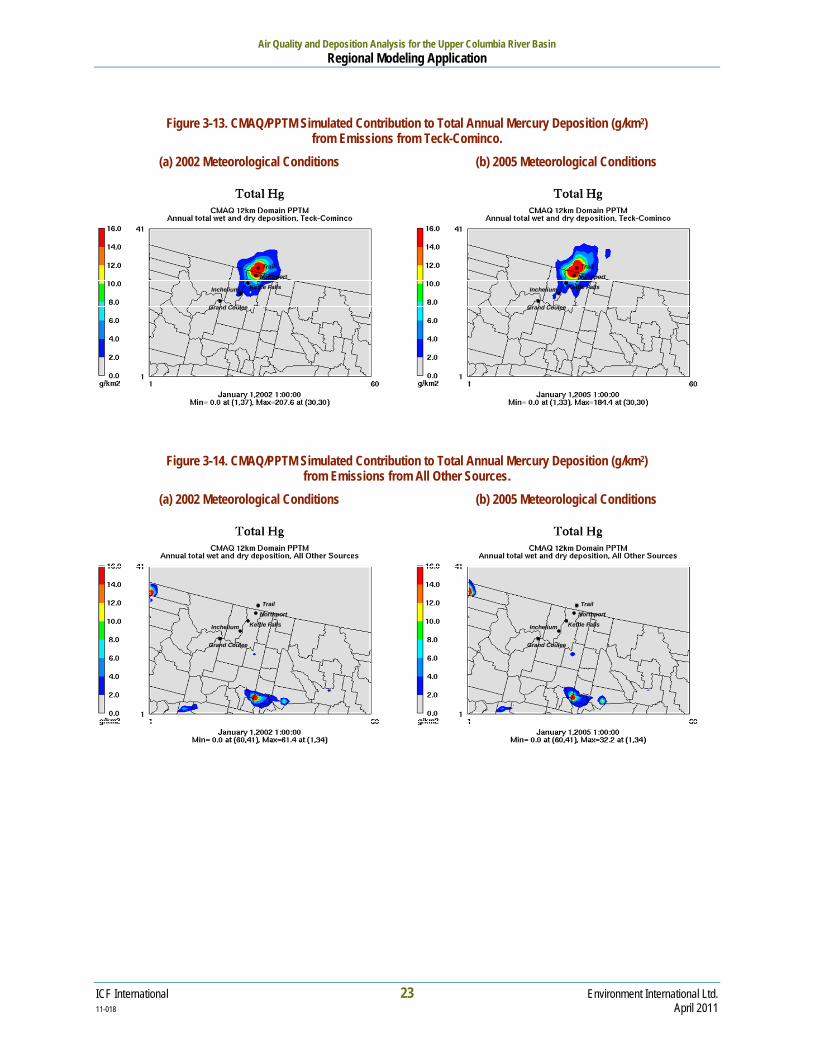
Figure 3-13. CMAQ/PPTM Simulated Contribution to Total Annual Mercury Deposition (g/km2) from Emissions from Teck-Cominco.
(a) 2002 Meteorological Conditions (b) 2005 Meteorological Conditions
TrailNorthport
Kettle FallsInchelium
Grand Coulee
TrailNorthport
Kettle FallsInchelium
Grand Coulee
Figure 3-14. CMAQ/PPTM Simulated Contribution to Total Annual Mercury Deposition (g/km2) from Emissions from All Other Sources.
(a) 2002 Meteorological Conditions (b) 2005 Meteorological Conditions
TrailNorthport
Kettle FallsInchelium
Grand Coulee
TrailNorthport
Kettle FallsInchelium
Grand Coulee
ICF International 23 Environment International Ltd. 11-018 April 2011

Air Quality and Deposition Analysis for the Upper Columbia River Basin Regional Modeling Application
Figure 3-15. CMAQ/PPTM Simulated Contribution to Total Annual Mercury Deposition (g/km2) from IC/BCs. (a) 2002 Meteorological Conditions (b) 2005 Meteorological Conditions
TrailNorthport
Kettle FallsInchelium
Grand Coulee
TrailNorthport
Kettle FallsInchelium
Grand Coulee
The simulated deposition patterns indicate that emissions from Teck-Cominco (based on 1990 emissions levels) contribute to mercury deposition over a broad area including the upper Columbia River Basin and parts of the Colville Indian Reservation. Deposition amounts are greatest near the Teck-Cominco facility, with a maximum contribution from the facility of 208 g km-2 with the 2002 meteorological conditions and 184 g km-2 with the 2005 meteorological conditions. For perspective, a recent mercury deposition modeling analysis for the Virginia Department of Environmental Quality (Douglas et al., 2008b) found that simulated mercury deposition amounts on the order of 10 to 30 g km-2 were expected to contribute to contamination of the Chesapeake Bay and river basins within the state.
1930 Retrospective The PPTM results can also be used to examine the contributions for different emissions levels. Historical data indicates that mercury air emissions from the Teck-Cominco facility were substantially higher in prior years. Based on calculated historical emissions, the mercury air emissions for Teck-Cominco were backcasted to 1930s levels. To reflect 1930s levels the emissions were increased by a factor of 2.2 (Queneau, 2010). The estimated retrospective mercury deposition contributions from Teck-Cominco are displayed in Figure 3-16, assuming 1930 emissions levels.
ICF International 24 Environment International Ltd. 11-018 April 2011

Air Quality and Deposition Analysis for the Upper Columbia River Basin Regional Modeling Application
Figure 3-16. CMAQ/PPTM Simulated Contribution to Total Annual Mercury Deposition (g/km2) from Emissions from Teck-Cominco.
(a) 2002 Meteorological Conditions (b) 2005 Meteorological Conditions
TrailNorthport
Kettle FallsInchelium
Grand Coulee
TrailNorthport
Kettle FallsInchelium
Grand Coulee
From a historical perspective, Figure 3-15 indicates a much greater influence of the airborne mercury emissions from Teck-Cominco in 1930 compared to 1990.
Cumulative Analysis Based on historical emissions estimates, cumulative, long-term deposition was also examined. Queneau (2010) provides estimates of mercury emissions from Teck-Cominco for every year beginning in 1921 through 2000. Total emissions for all 80 years combined are 227.5 tons. For this analysis, we scaled the 1990 simulated deposition amounts by the ratio of the total emissions for 1921-2000 (227.5 tons) over the total emissions for 1990 (2.84 tons). This ratio is 80.1. The estimated cumulative mercury deposition contributions from Teck-Cominco for 1921-2000 are displayed in Figure 3-17.
ICF International 25 Environment International Ltd. 11-018 April 2011

Air Quality and Deposition Analysis for the Upper Columbia River Basin Regional Modeling Application
Figure 3-17. CMAQ/PPTM Simulated Contribution to 80-Year Cumulative Total Mercury Deposition (g/km2) from Emissions from Teck-Cominco.
(a) 2002 Meteorological Conditions (b) 2005 Meteorological Conditions
TrailNorthport
Kettle FallsInchelium
Grand Coulee
TrailNorthport
Kettle FallsInchelium
Grand Coulee
These results clearly illustrate the potential for mercury emissions from the Teck-Cominco facility to have deposited on the Columbia River and Colville Indian Reservation since the beginning of operation.
3.5. Deposition Contribution Analysis for Other Metals CMAQ was also used to quantify the contribution of emissions from Teck-Cominco to the simulated deposition of other metals, including lead (Pb), zinc (Zn), cadmium (Cd), and arsenic (As). These constituents are emitted into the atmosphere from various components of the smelting facility in the form of coarse (PM10) and fine (PM2.5) particulates. For this analysis, the metals were simulated by tracking the 1990 emissions of PM10 and PM2.5 from the facility and assuming a similar coarse/fine emissions split of 30 percent PM10 and 70 percent PM2.5, based on Teck-Cominco emission inventory data for 2002. The resulting deposition values for each of the metals were then scaled based on the actual emissions of lead, zinc, cadmium, and arsenic from Teck-Cominco for 1990 (Queneau, 2010) relative to the emissions of coarse and fine PM. For example, from Table 3-1, the factor for 1990 for arsenic would be 15.7 / 1095 = 0.0144.
1990 Baseline Plots of the estimated annual deposition amounts for lead, zinc, cadmium, and arsenic are shown in Figure 3-18 through Figure 3-21, respectively. In each figure, the first plot (left) shows the results using the 2002 meteorological inputs and the second plot (right) shows the results using the 2005 meteorological inputs. Note that the 2002 period consists of only five months, and the results were scaled to represent annual deposition. The units are kilograms per square kilometer (kg/km2). Note that the scales used to display lead and zinc deposition are different from those used for cadmium and arsenic deposition, due to differences in the overall deposition amounts.
ICF International 26 Environment International Ltd. 11-018 April 2011
Air Quality and Deposition Analysis for the Upper Columbia River Basin Regional Modeling Application
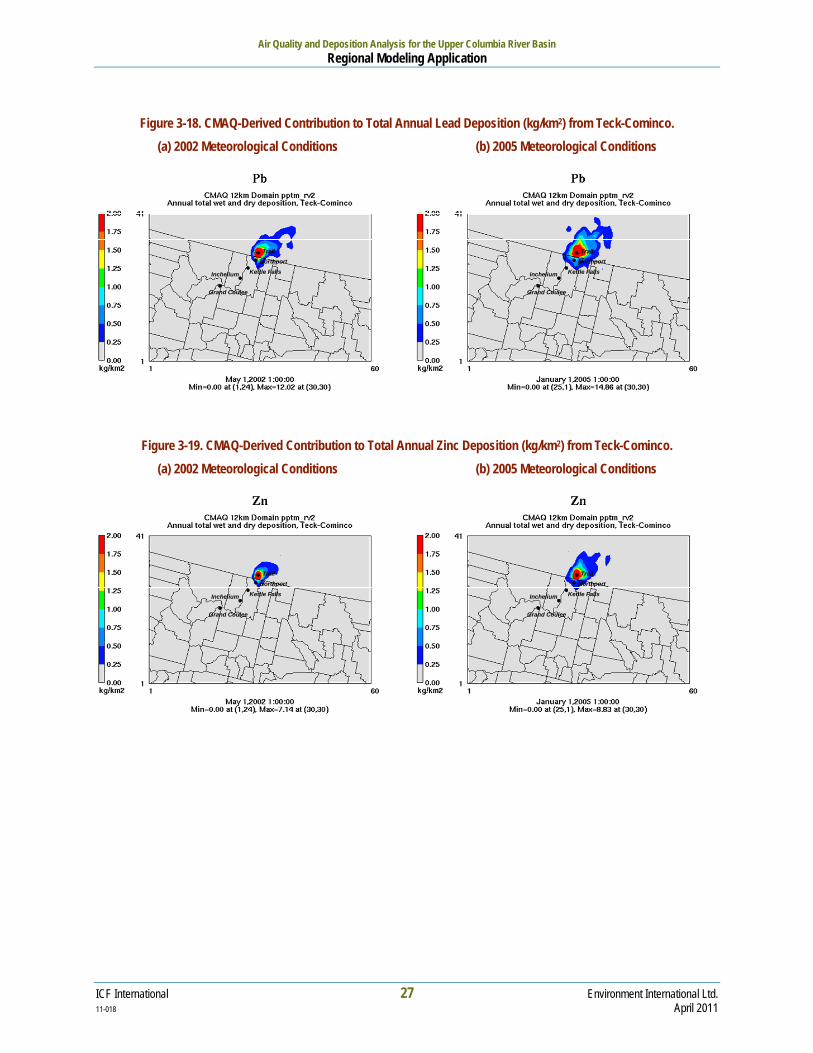
Figure 3-18. CMAQ-Derived Contribution to Total Annual Lead Deposition (kg/km2) from Teck-Cominco. (a) 2002 Meteorological Conditions (b) 2005 Meteorological Conditions
TrailNorthport
Kettle FallsInchelium
Grand Coulee
TrailNorthport
Kettle FallsInchelium
Grand Coulee
Figure 3-19. CMAQ-Derived Contribution to Total Annual Zinc Deposition (kg/km2) from Teck-Cominco. (a) 2002 Meteorological Conditions (b) 2005 Meteorological Conditions
TrailNorthport
Kettle FallsInchelium
Grand Coulee
TrailNorthport
Kettle FallsInchelium
Grand Coulee
ICF International 27 Environment International Ltd. 11-018 April 2011

Air Quality and Deposition Analysis for the Upper Columbia River Basin Regional Modeling Application
Figure 3-20. CMAQ-Derived Contribution to Total Annual Cadmium Deposition (kg/km2) from Teck-Cominco. (a) 2002 Meteorological Conditions (b) 2005 Meteorological Conditions
TrailNorthport
Kettle FallsInchelium
Grand Coulee
TrailNorthport
Kettle FallsInchelium
Grand Coulee
Figure 3-21. CMAQ-Derived Contribution to Simulated Total Annual Arsenic Deposition (kg/km2) from Teck-Cominco. (a) 2002 Meteorological Conditions (b) 2005 Meteorological Conditions
TrailNorthport
Kettle FallsInchelium
Grand Coulee
TrailNorthport
Kettle FallsInchelium
Grand Coulee
The estimated deposition patterns for the other metals indicate that deposition amounts are greatest near the facility and have the potential to affect the watershed area.
ICF International 28 Environment International Ltd. 11-018 April 2011
Air Quality and Deposition Analysis for the Upper Columbia River Basin Regional Modeling Application
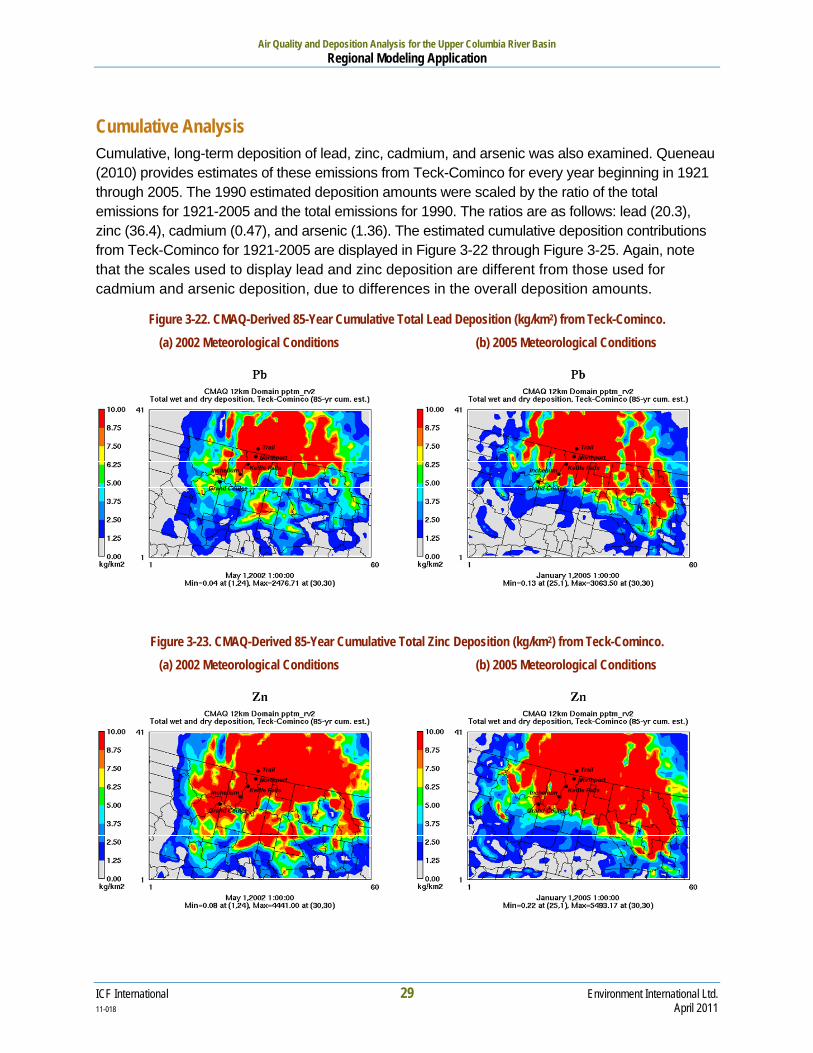
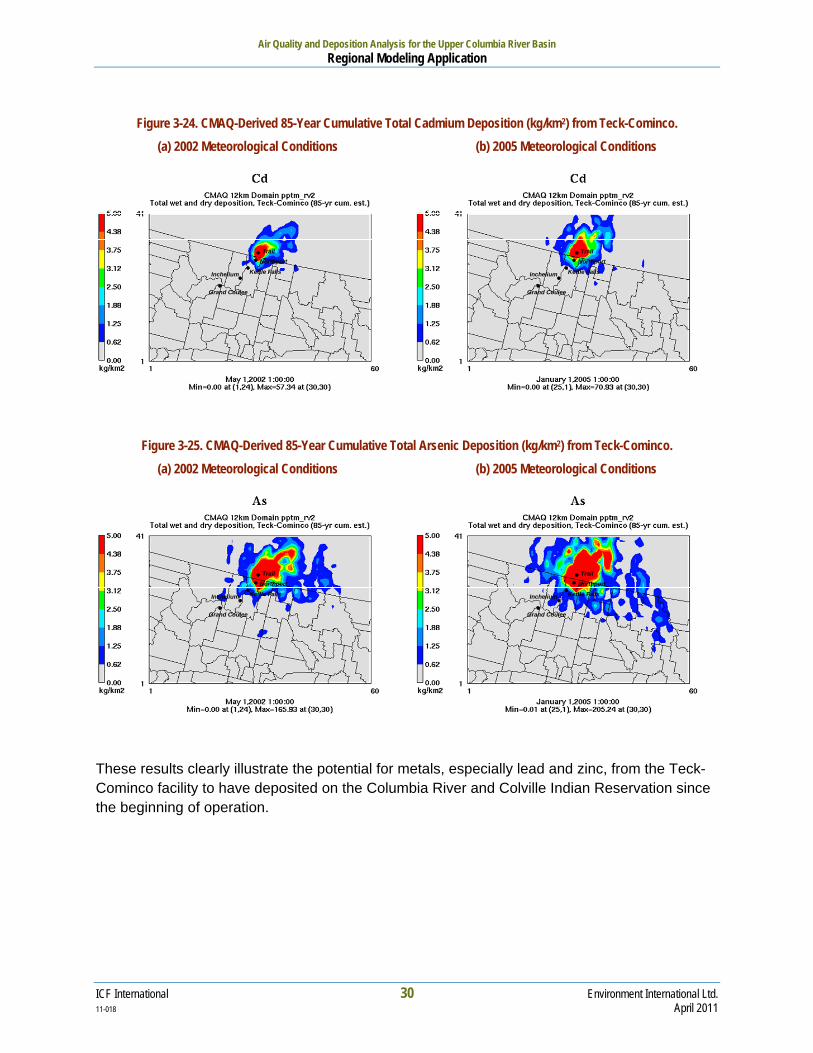
Cumulative Analysis Cumulative, long-term deposition of lead, zinc, cadmium, and arsenic was also examined. Queneau (2010) provides estimates of these emissions from Teck-Cominco for every year beginning in 1921 through 2005. The 1990 estimated deposition amounts were scaled by the ratio of the total emissions for 1921-2005 and the total emissions for 1990. The ratios are as follows: lead (20.3), zinc (36.4), cadmium (0.47), and arsenic (1.36). The estimated cumulative deposition contributions from Teck-Cominco for 1921-2005 are displayed in Figure 3-22 through Figure 3-25. Again, note that the scales used to display lead and zinc deposition are different from those used for cadmium and arsenic deposition, due to differences in the overall deposition amounts.
Figure 3-22. CMAQ-Derived 85-Year Cumulative Total Lead Deposition (kg/km2) from Teck-Cominco. (a) 2002 Meteorological Conditions (b) 2005 Meteorological Conditions
TrailNorthport
Kettle FallsInchelium
Grand Coulee
TrailNorthport
Kettle FallsInchelium
Grand Coulee
Figure 3-23. CMAQ-Derived 85-Year Cumulative Total Zinc Deposition (kg/km2) from Teck-Cominco. (a) 2002 Meteorological Conditions (b) 2005 Meteorological Conditions
TrailNorthport
Kettle FallsInchelium
Grand Coulee
TrailNorthport
Kettle FallsInchelium
Grand Coulee
ICF International 29 Environment International Ltd. 11-018 April 2011
Air Quality and Deposition Analysis for the Upper Columbia River Basin Regional Modeling Application
Figure 3-24. CMAQ-Derived 85-Year Cumulative Total Cadmium Deposition (kg/km2) from Teck-Cominco. (a) 2002 Meteorological Conditions (b) 2005 Meteorological Conditions
TrailNorthport
Kettle FallsInchelium
Grand Coulee
TrailNorthport
Kettle FallsInchelium
Grand Coulee
Figure 3-25. CMAQ-Derived 85-Year Cumulative Total Arsenic Deposition (kg/km2) from Teck-Cominco. (a) 2002 Meteorological Conditions (b) 2005 Meteorological Conditions
TrailNorthport
Kettle FallsInchelium
Grand Coulee
TrailNorthport
Kettle FallsInchelium
Grand Coulee
These results clearly illustrate the potential for metals, especially lead and zinc, from the Teck-Cominco facility to have deposited on the Columbia River and Colville Indian Reservation since the beginning of operation.
ICF International 30 Environment International Ltd. 11-018 April 2011

4. Summary of Findings Available historical data and a number of documents related to studies of potential environmental impacts from the Teck-Cominco facility in Trail were examined as part of this exploratory analysis. Meteorological data collected at the surface and aloft at Northport, WA for the period of one year (1929-1930) show a consistent pattern of nighttime down-valley and daytime up-valley wind flow occurring all months of the year. The nighttime regime is characterized by a clearly defined 2000 ft thick southward flowing drainage layer, which forms after the sun goes down in the evening and persists until morning. This southward flowing stable drainage layer is quite capable of trapping emissions from the Trail facility and transporting them along the Columbia River Valley into Stevens County and beyond. Because of its persistence throughout the year, this mechanism has the potential of causing pollutants to be transported from the Trail facility and likely has resulted in large quantities of mercury and other constituents being deposited in the Columbia River basin, Lake Roosevelt, and the Colville Reservation.
Surveys conducted by the USDA in 1929-1931 of damage to vegetation by SO2 also clearly show injury patterns that are quite similar from year to year during this period and are consistent with the mechanism (revealed by the Northport meteorological data) of transport of emissions of SO2 and other constituents from the Trail facility in the southward flowing drainage layer.
The preliminary regional-scale (CMAQ) modeling results indicate that:
SO2 emissions from Teck-Cominco contribute to the SO2 concentrations for areas located in the Upper Columbia River Basin, including Kettle Falls and Inchelium. For 1990 emission levels, the contributions are relatively small on an annual average basis but can be much larger on a daily basis (under certain meteorological conditions).
The extent and magnitude of the contribution to annual-average and 24-hour SO2 concentrations are much greater when 1930 emission levels are assumed. These results are consistent with vegetative damage assessments done in the 1920s and 1930s.
Emissions from Teck-Cominco (based on 1990 emissions levels) contribute to deposition of mercury and other metals (especially lead and zinc) over a broad area including the Upper Columbia River Basin and parts of the Colville Indian Reservation.
The extent and magnitude of the contribution to annual deposition of mercury and other metals are much greater when 1930 emission levels are assumed.
Estimated cumulative total deposition for both mercury (80-year total) and other metals (85-year totals) indicate that large amounts of mercury and other metals (especially lead and zinc) were deposited throughout the region since 1921.
The regional-scale modeling results clearly illustrate the potential for SO2 and mercury emissions from the Teck-Cominco facility to have influenced air quality within the upper Columbia River Basin and deposited on the Columbia River and Colville Indian Reservation since the beginning of operation.
ICF International 31 Environment International Ltd. 11-018 April 2011
Air Quality and Deposition Analysis for the Upper Columbia River Basin Summary of Findings
CMAQ is well suited for regional-scale application and can accommodate complex terrain and meteorology. However, the grid spacing and layer structure used for this application (12-km horizontal resolution and 14 vertical layers) is not expected to resolve certain complex terrain and meteorological features that may influence the transport, dispersion, and deposition of the simulated air pollutants.
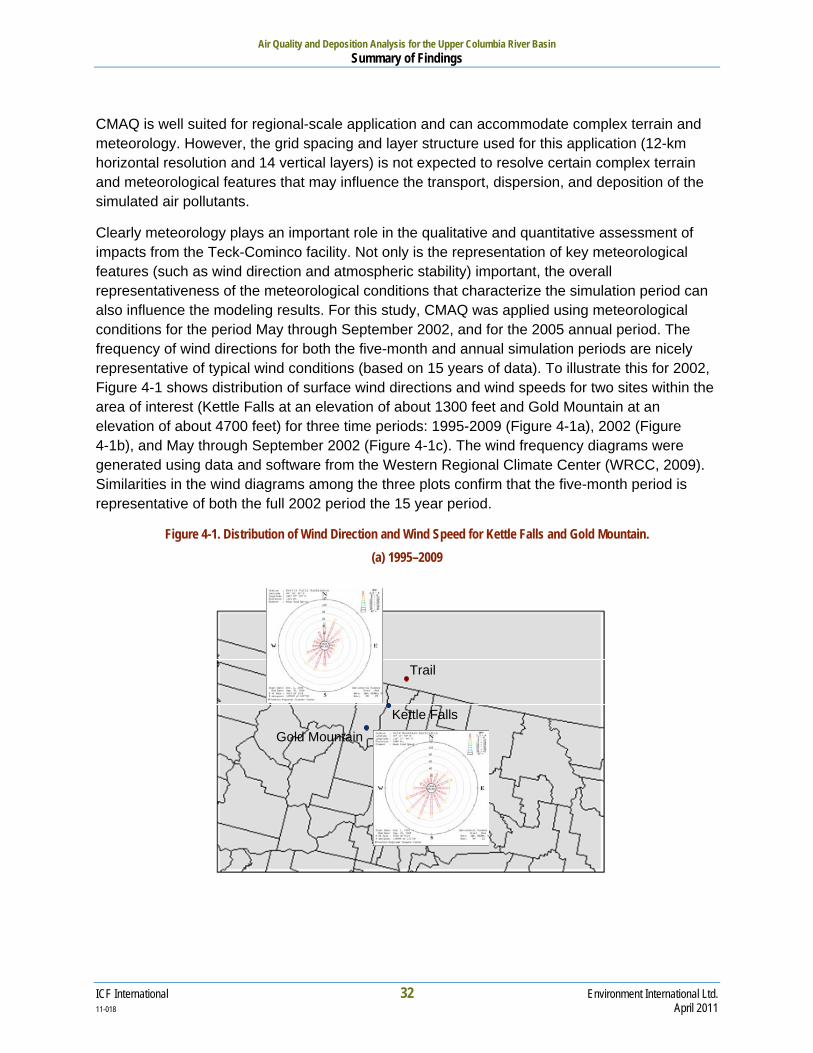
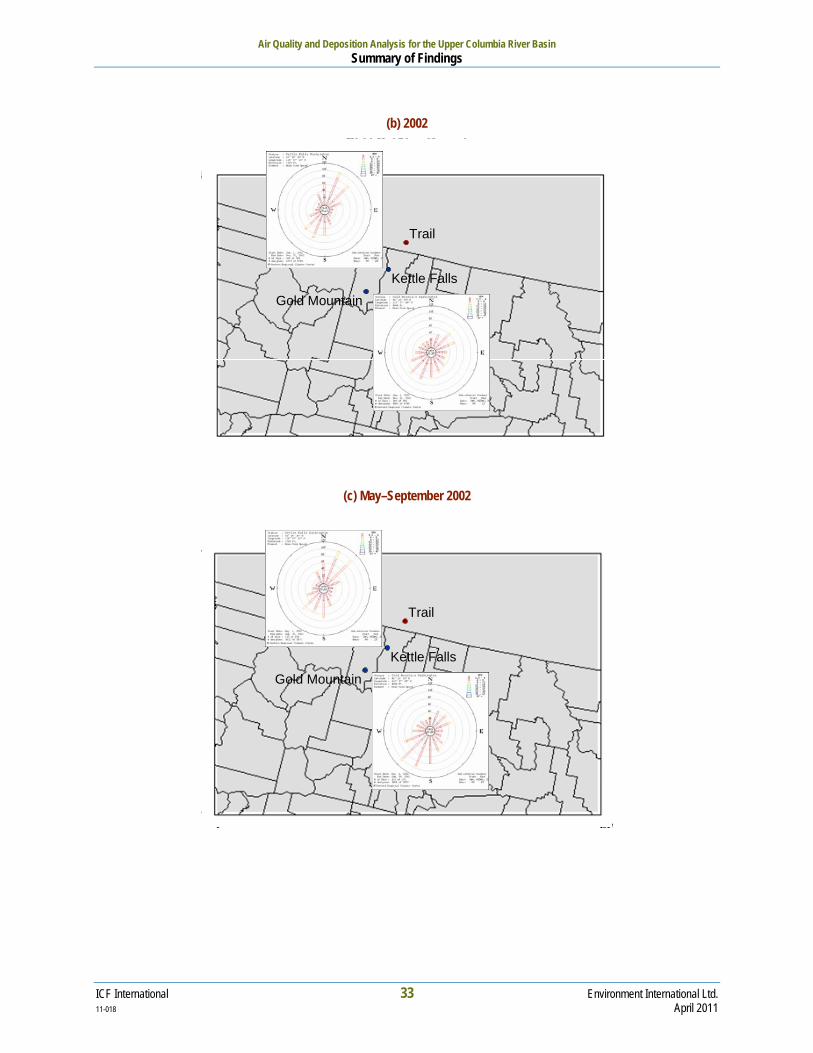
Clearly meteorology plays an important role in the qualitative and quantitative assessment of impacts from the Teck-Cominco facility. Not only is the representation of key meteorological features (such as wind direction and atmospheric stability) important, the overall representativeness of the meteorological conditions that characterize the simulation period can also influence the modeling results. For this study, CMAQ was applied using meteorological conditions for the period May through September 2002, and for the 2005 annual period. The frequency of wind directions for both the five-month and annual simulation periods are nicely representative of typical wind conditions (based on 15 years of data). To illustrate this for 2002, Figure 4-1 shows distribution of surface wind directions and wind speeds for two sites within the area of interest (Kettle Falls at an elevation of about 1300 feet and Gold Mountain at an elevation of about 4700 feet) for three time periods: 1995-2009 (Figure 4-1a), 2002 (Figure 4-1b), and May through September 2002 (Figure 4-1c). The wind frequency diagrams were generated using data and software from the Western Regional Climate Center (WRCC, 2009). Similarities in the wind diagrams among the three plots confirm that the five-month period is representative of both the full 2002 period the 15 year period.
Figure 4-1. Distribution of Wind Direction and Wind Speed for Kettle Falls and Gold Mountain. (a) 1995–2009
Kettle Falls
Gold Mountain
Trail
ICF International 32 Environment International Ltd. 11-018 April 2011
Air Quality and Deposition Analysis for the Upper Columbia River Basin Summary of Findings
(b) 2002
Kettle Falls
Gold Mountain
Trail
(c) May–September 2002
Kettle Falls
Gold Mountain
Trail
ICF International 33 Environment International Ltd. 11-018 April 2011

Air Quality and Deposition Analysis for the Upper Columbia River Basin Summary of Findings
Figure 4-2 provides this same information for 2005.
Figure 4-2. . Distribution of Wind Direction and Wind Speed for Kettle Falls and Gold Mountain. 2005
Kettle Falls
Gold Mountain
Trail
Similarities in the wind diagrams for 2005 and 1995-2009 confirm that 2005 is representative of the 15 year period. Thus, both simulation periods are characterized by fairly typical wind directions and wind speeds.
This information also illustrates the overall potential for transport of pollutants from the Teck-Cominco facility to the Colville Indian Reservation over a multi-year period. Wind directions for Kettle Falls, for example, are from the northeast (northeast quadrant on the wind distribution diagram, representing down valley drainage flow) greater than 16 percent of the time (during the 15 year period) with an average wind speed of 4 miles per hour.
ICF International 34 Environment International Ltd. 11-018 April 2011
5. References Byun, D. W., and J. K. S. Ching. 1999. “Science Algorithms of the EPA Models-3 Community
Multiscale Air Quality (CMAQ) Modeling System.” U.S. EPA Office of Research and Development, Washington, D.C. (EPA/600/R-99/030).
Cominco, Ltd. 1997. “Annual Report for Trail Facility for 1996: Air Permits PA-02690, 02691 & 02692; Effluent Permits PE-5309, PE-2753, and PS-08310; Summary of Monitoring Results – Ambient SO2 Concentrations, Sulphur Emissions, Production Curtailments”, Cominco, Ltd. (May 15, 1997) – (TECK 0062362).
Consolidated Mining and Smelting Company. 1927. “Summarized Report of Smelter Smoke Investigation” (by R. E. Neidig) included in Reports of Experts for Consolidated Mining and Smelting Company. (RG 97-Entry 86 – Box No. 9)
Consolidated Mining and Smelting Company. 1928. “Weather Reports Submitted by H. W. Sterrett, U.S. Co-operative Weather Observer,” Northport, Washington included in Reports of Experts for Consolidated Mining and Smelting Company.
Dolwick, P., R. Gilliam, L. Reynolds, and A. Huffman. 2007. Regional and local-scale evaluation of the 2002 MM5 meteorological fields for various air quality modeling applications. Extended abstract for the 6th Annual CMAS Conference, Chapel Hill, North Carolina (1-3 October).
Douglas, S. G., T. C. Myers, and Y. Wei. 2007. “Implementation of Ozone and Particle Precursor Tagging Methodologies in the Community Multiscale Air Quality (CMAQ) Model, Technical Description and User’s Guide.” Prepared for the EPA Office of Air Quality Planning and Standards (OAQPS). ICF International, San Rafael, California (Report #07-067).
Douglas, S. G., J. L. Haney, A. B. Hudischewskyj, T. C. Myers, and Y. Wei. 2008a. “Second Prospective Analysis of Air Quality in the U.S.: Air Quality Modeling.” Prepared for the EPA Office of Policy Analysis and Review (OPAR). ICF International, San Rafael, California (Report #08-099).
Douglas, S. G., J. L. Haney, Y. Wei, T. Myers, and B. Hudischewskyj. 2008b. “Mercury Deposition Modeling for the Virginia Mercury Study.” Prepared for the Virginia Department of Environmental Quality. ICF International, San Rafael, California (Report #08-007).
EPA. 2005. Technical Support Document for the Final Clean Air Mercury Rule: Air Quality Modeling, EPA Office of Air Quality Planning and Standards, Research Triangle Park, North Carolina, March 2005. (http://www.epa.gov/ttn/atw/utility/aqm_oar-2002-0056-6130.pdf)
EPA. 2006. “Addendum User’s Guide for the AMS/EPA Regulatory Model—AERMOD.” EPA Office of Air Quality Planning and Standards, Research Triangle Park, North Carolina.
Keyser, E. M. 1937. Letter to S. W. Griffin, U.S. Department of Agriculture Chemist, Summary of Northport Winds, 1929-1930, U.S. Department of Agriculture, Weather Bureau (June 8, 1937). (NC135-149a Box 3)
Myers, T., Wei, B. Hudischewskyj, J. Haney, and S. Douglas. 2008. “Model-Based Analysis and Tracking of Airborne Mercury Emissions to Assist in Watershed Planning.” Prepared for the U.S. Environmental Protection Agency, Office of Water, Washington, D.C. ICF International, San Rafael, California (08-034).
ICF International 35 Environment International Ltd. 11-018 April 2011

Air Quality and Deposition Analysis for the Upper Columbia River Basin References
ICF International 36 Environment International Ltd. 11-018 April 2011
Queneau, P.B. 2010. Expert Opinion of Paul B. Queneau, Pakootas et al. vs. Teck Cominco et al.
Seigneur, C., P. Karamchandani, K. Lohman, K. Vijayaraghavan, and R. Shia. 2001. Multiscale modeling of the atmospheric fate and transport of mercury. J. Geophys. Res., 106, 27,795-27,809.
Shia, R., C. Seigneur, P. Pai, M. Ko, and N. D. Sze. 1999. Global simulation of atmospheric mercury concentrations and deposition fluxes. J. Geophys. Res., 99, 23,747–23,760.
Teck-Cominco, 2009. Graphs of emissions – Mercury, SO2, and Particulates – 1980 – 1998.
U.S. Department of Agriculture. 1936. “Maps of the areas of injury to the forests in northern Stevens County, Washington, due to the effects of sulphur dioxide in the air”, Prepared by George C. Hedgecock, Senior Pathologist, Division of Plant Industry, U.S. Department of Agriculture.
Wesely, M. L., P. V. Doskey, and J. D. Shannon. 2002. “Deposition Parameterizations for the Industrial Source Complex (ISC3) Model.” Environmental Research Division, Argonne National Laboratory, Argonne, Illinois (ANL/ER/TR-01/003).
Wilson, D.M. 2002. “Trail, B.C.: History”, The Virtual Crowsnest Highway (http://www.crowsnest-highway.ca/cgi-bin/citypage.pl?city=TRAIL)
WRCC. 2009. Western Regional Climate Center, Desert Research Institute web site at http://www.raws.dri.edu/.