air quality and health - ucr cssd · thanks: marci aguirre, mph, ches. andrea rodriguez, ms. noelle...
TRANSCRIPT
Air Quality and Health
Eric Frykman, MD, MPHPublic Health Officer
Riverside County

Thanks:Marci Aguirre, MPH, CHES
Andrea Rodriguez, MS
Noelle Hartwick, BSN
Marshare Penny, MPH
Wayne Harris, BS

California Health Interview Survey San Bernardino County
Estimated 228,000 persons have asthma
Of these, approximately 76,000 are under the age of 18 years
(underestimated ?)
2001 CHIS
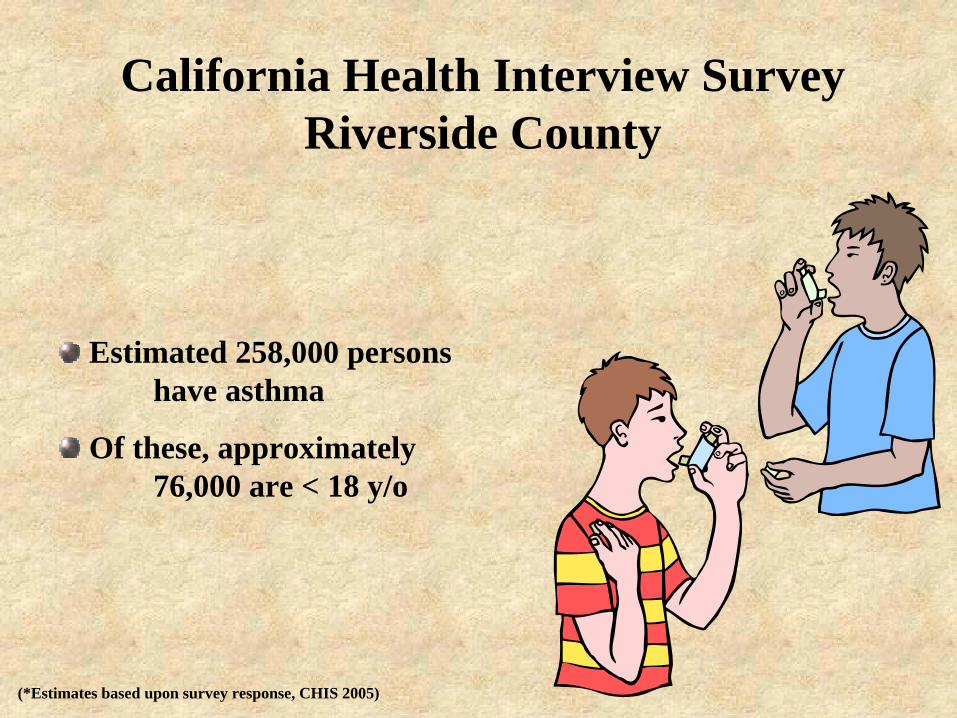
California Health Interview Survey Riverside County
Estimated 258,000 persons have asthma
Of these, approximately 76,000 are < 18 y/o
(*Estimates based upon survey response, CHIS 2005)
Asthma Hospitalizations in Riverside County
38% of those hospitalized were under the age of 18
Blacks had hospitalization rates more than twice that of Hispanics and whites.
*OSHPD, 2005

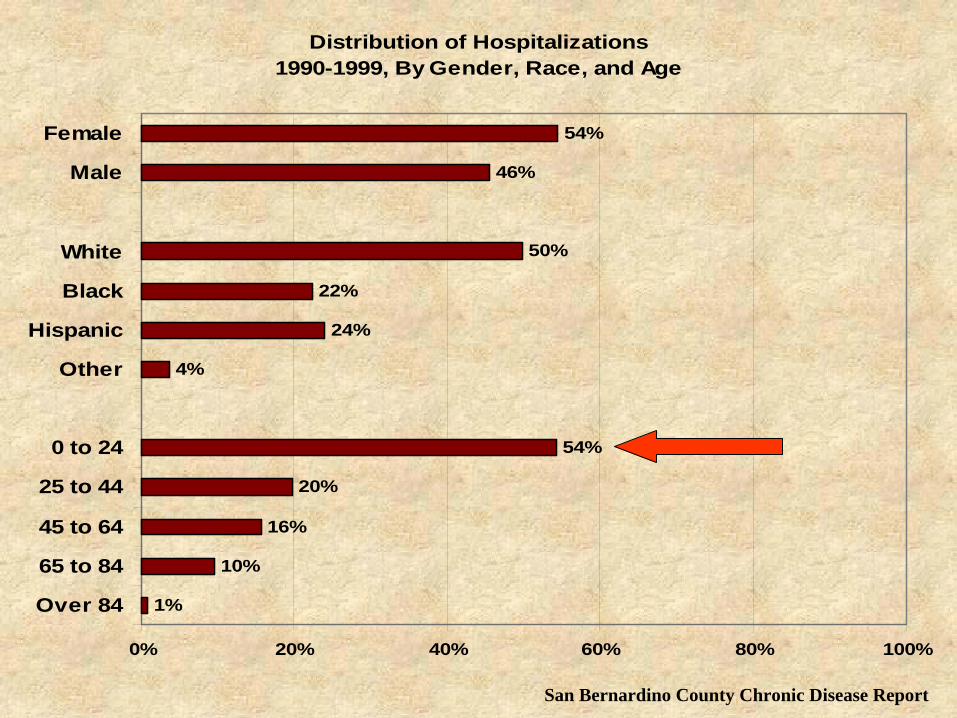
Distribution of Hospitalizations1990-1999, By Gender, Race, and Age
1%
10%
16%
20%
54%
4%
24%
22%
50%
46%
54%
0% 20% 40% 60% 80% 100%
Over 84
65 to 84
45 to 64
25 to 44
0 to 24
Other
Hispanic
Black
White
Male
Female
San Bernardino County Chronic Disease Report
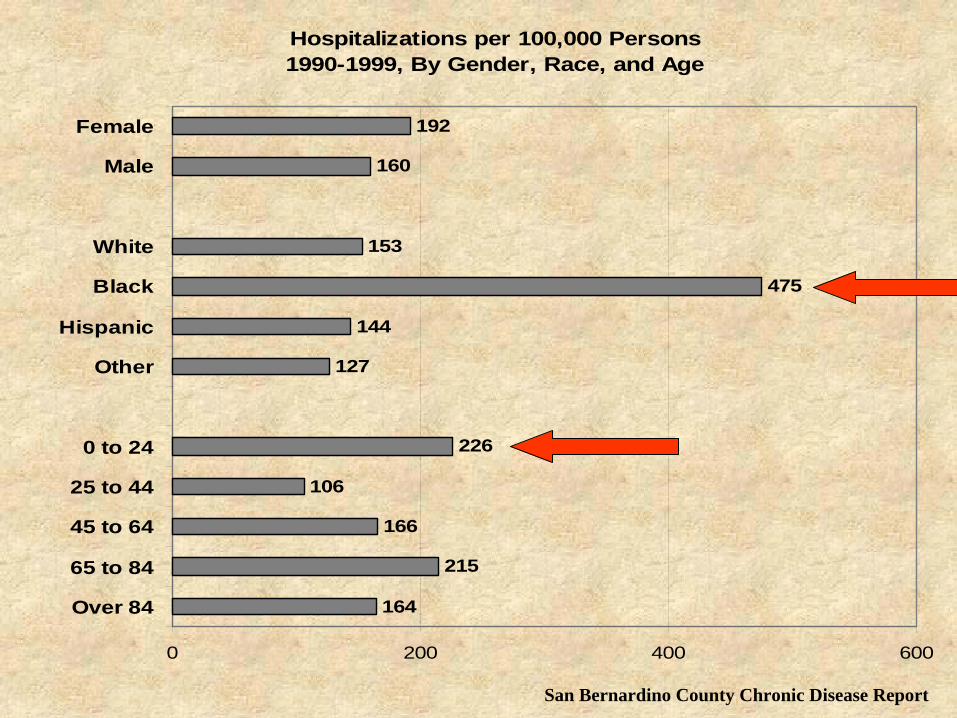
Hospitalizations per 100,000 Persons1990-1999, By Gender, Race, and Age
164
215
166
106
226
127
144
475
153
160
192
0 200 400 600
Over 84
65 to 84
45 to 64
25 to 44
0 to 24
Other
Hispanic
Black
White
Male
Female
San Bernardino County Chronic Disease Report
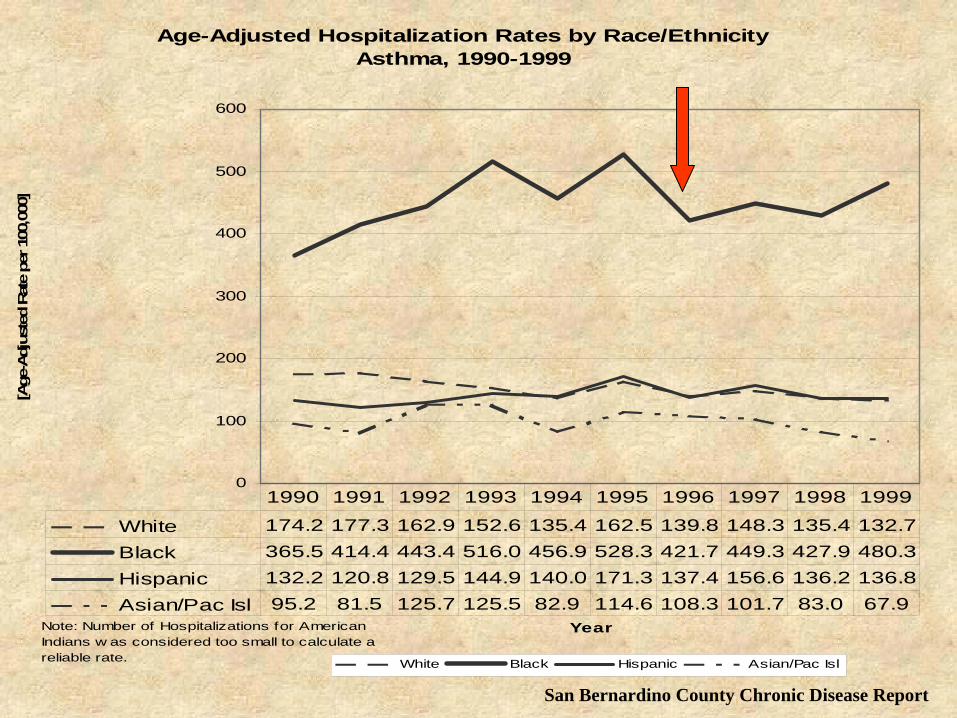
Age-Adjusted Hospitalization Rates by Race/EthnicityAsthma, 1990-1999
0
100
200
300
400
500
600
Year
[Age
-Adj
uste
d Ra
te p
er 1
00,0
00]
White Black Hispanic Asian/Pac Isl
White 174.2 177.3 162.9 152.6 135.4 162.5 139.8 148.3 135.4 132.7Black 365.5 414.4 443.4 516.0 456.9 528.3 421.7 449.3 427.9 480.3Hispanic 132.2 120.8 129.5 144.9 140.0 171.3 137.4 156.6 136.2 136.8Asian/Pac Isl 95.2 81.5 125.7 125.5 82.9 114.6 108.3 101.7 83.0 67.9
1990 1991 1992 1993 1994 1995 1996 1997 1998 1999
Note: Number of Hospitalizations for American Indians w as considered too small to calculate a reliable rate.
San Bernardino County Chronic Disease Report
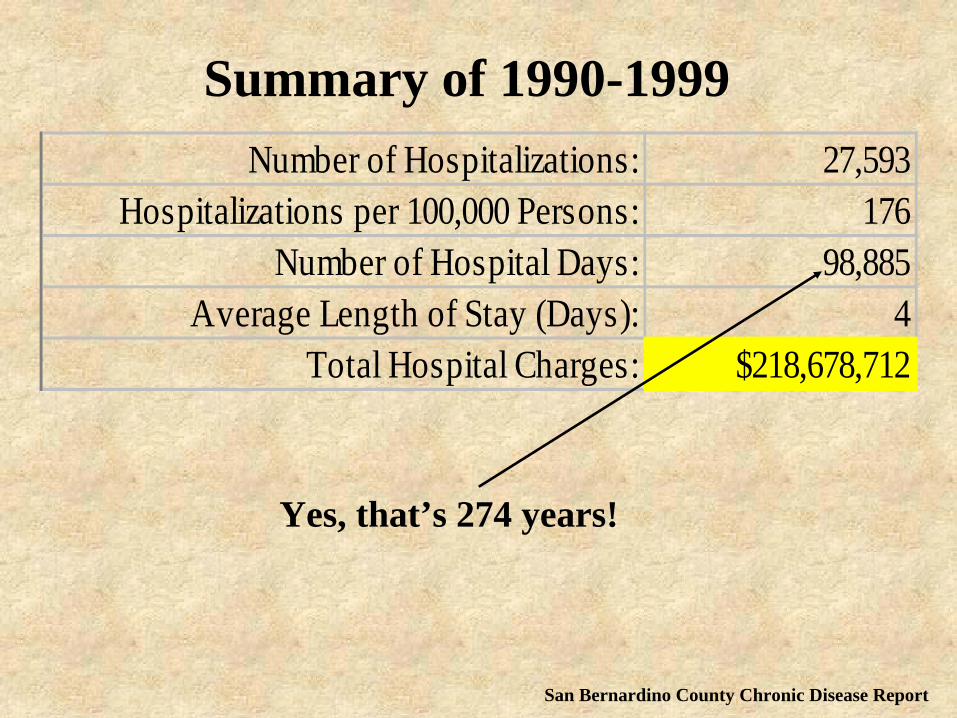
Summary of 1990-1999Number of Hospitalizations: 27,593
Hospitalizations per 100,000 Persons: 176Number of Hospital Days: 98,885
Average Length of Stay (Days): 4Total Hospital Charges: $218,678,712
San Bernardino County Chronic Disease Report
Yes, that’s 274 years!

Distribution of Deaths1990-1999, By Gender, Race, and Age
6%
34%
28%
21%
10%
3%
14%
14%
69%
35%
65%
0% 20% 40% 60% 80% 100%
Over 84
65 to 84
45 to 64
25 to 44
0 to 24
Other
Hispanic
Black
White
Male
Female
San Bernardino County Chronic Disease Report
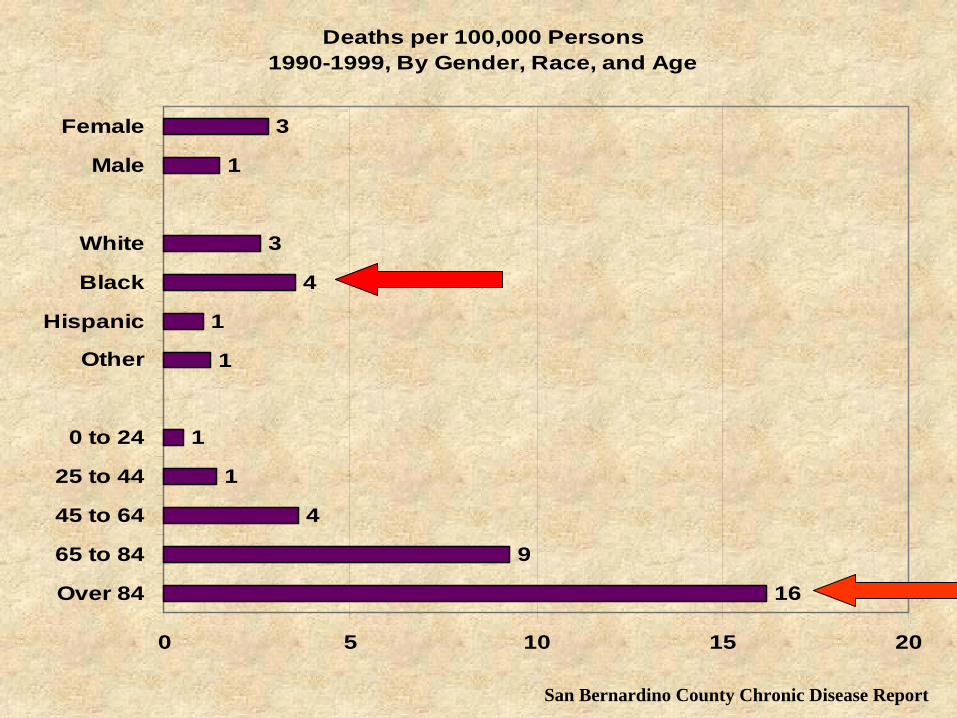
Deaths per 100,000 Persons1990-1999, By Gender, Race, and Age
16
9
4
1
1
1
1
4
3
1
3
0 5 10 15 20
Over 84
65 to 84
45 to 64
25 to 44
0 to 24
Other
Hispanic
Black
White
Male
Female
San Bernardino County Chronic Disease Report
Some Good News for the Inland Empire
• 70% of asthmatic children state that their physical activity is rarely or never limited by asthma.
• 74% of adults has symptoms less than twice per month
• Nearly 1/3 are limited at least sometimes…
But…the bad news…

Ozone Days
So how does the air affect asthma?
• Dust– Allergens
• Smog– Allergens– NOx, SO2 , CO, Ozone– PM2.5
– PM10

Further Lung Effects…
• Triggers or enhances inflammatory responses– Acute and subacute increase in hospitalizations
and death– Heart effects
Heart Disease
Approximately 136,000 persons in Riverside County state that they have been diagnosed with heart disease
Another 416,000 have been diagnosed with high blood pressure
If the level of PM2.5 was sustained at 20μg/m3 above desired/baseline: long-term increased CPD death rate increases by 12%
(*Estimates based upon survey response, CHIS 2005)
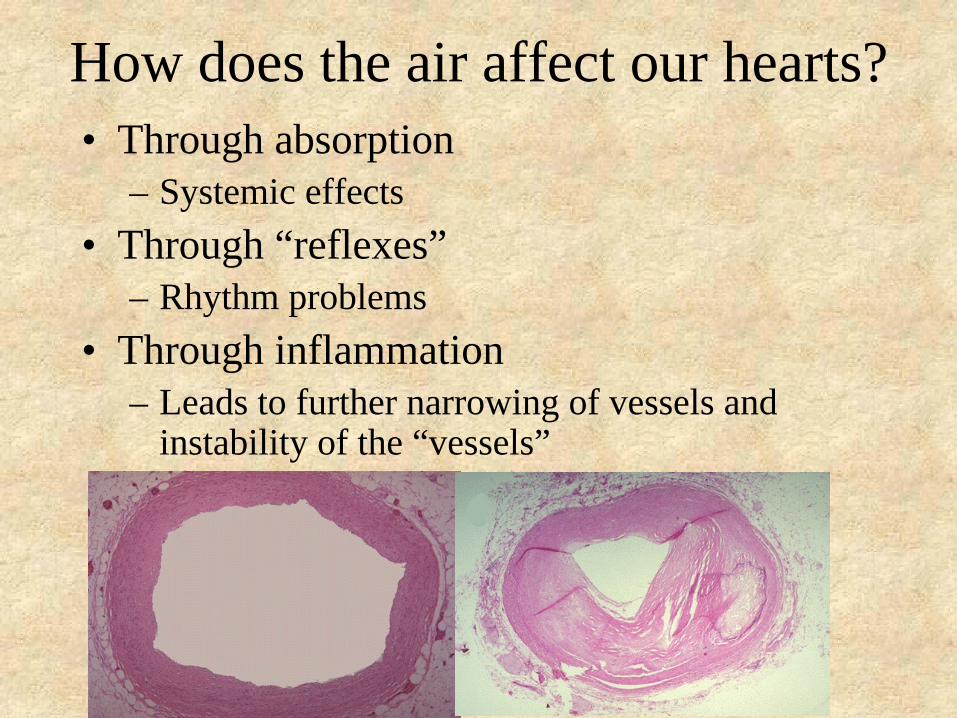
How does the air affect our hearts?• Through absorption
– Systemic effects• Through “reflexes”
– Rhythm problems• Through inflammation
– Leads to further narrowing of vessels and instability of the “vessels”
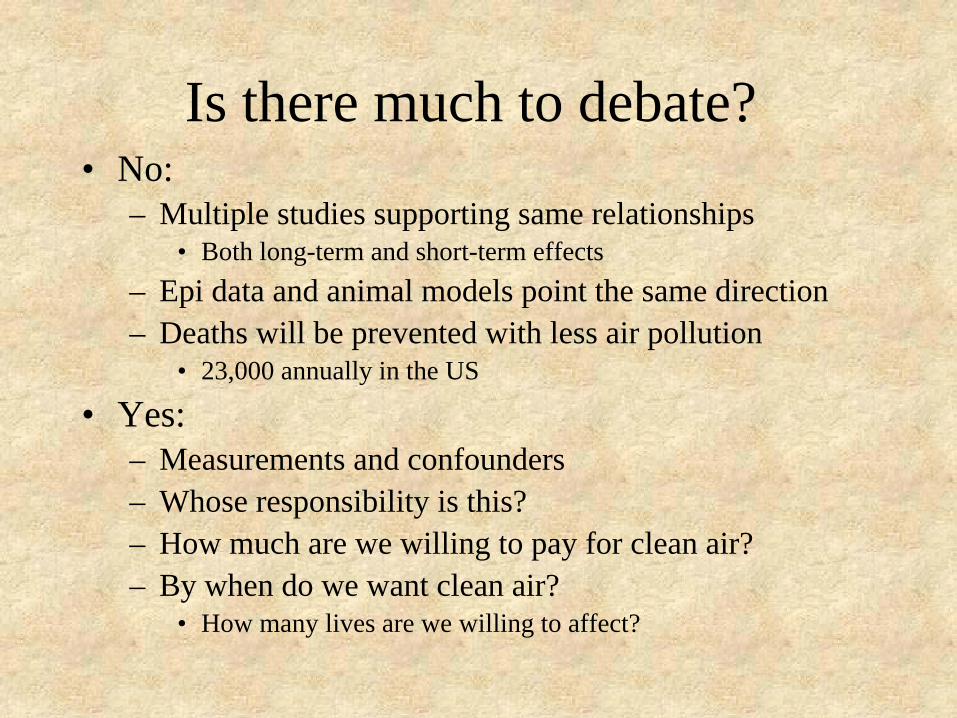
Is there much to debate?• No:
– Multiple studies supporting same relationships• Both long-term and short-term effects
– Epi data and animal models point the same direction– Deaths will be prevented with less air pollution
• 23,000 annually in the US
• Yes:– Measurements and confounders– Whose responsibility is this?– How much are we willing to pay for clean air?– By when do we want clean air?
• How many lives are we willing to affect?

Bright Spots
• Pollution levels are improving• Heart disease death rates decreasing
– But asthma rates moving upward• A larger portion of society seems to care• The Global warming/Greening movement

How much choice do we really have?
• Individualism– Freedom to create ones path without outside
interference• Transportation Options:
• Walk• Bike• Train• Bus• Plane
• Other• Combination• Car

Thank YouCall me for further questions…
(951) 358-5058