air quality assessment batchelor magnesium project
TRANSCRIPT
Report
Air Quality AssessmentBatchelor Magnesium Project
Prepared forMt Grace Resources Limited
19 February 2002
URS Australia Pty LtdACN 000-691-690
Level 3, 116 Miller StreetNorth Sydney NSW 2060, Australia
Tel: +61 (2) 8925 5500 • Fax: +61 (2) 8925 5555

Contents
Air Quality Modelling.doc 25-FEB-02
i
1 Introduction ----------------------------------------------------------------------------------------------- 1-1
2 Pollutants Under Review ------------------------------------------------------------------------------ 2-1
2.1 Particulate 2-12.2 Products of Combustion 2-22.3 Magnesium Oxide 2-32.4 Ammonia 2-4
3 Assessment Criteria ------------------------------------------------------------------------------------ 3-1
3.1 Discharge Emission Limits 3-13.2 Impact Assessment Criteria 3-23.3 Ambient Air Quality Criteria 3-3
4 Assessment Methodology ---------------------------------------------------------------------------- 4-1
4.1 Emissions Inventory 4-14.2 Dispersion Modelling 4-2
5 Existing Environment ---------------------------------------------------------------------------------- 5-1
5.1 Climate and Meteorology 5-15.1.1 Wind Direction and Wind Speed 5-1
5.2 Existing Air Quality 5-1
6 Impact Assessment ------------------------------------------------------------------------------------- 6-1
6.1 Stage One 6-16.1.1 Emissions 6-16.1.2 Dispersion Modelling 6-4
6.2 Stage Three 6-76.2.1 Emissions 6-76.2.2 Dispersion Modelling 6-11
7 Mitigation Measures ------------------------------------------------------------------------------------ 7-1
7.1 Environmental Safeguards 7-1
8 Conclusions----------------------------------------------------------------------------------------------- 8-1
List of Tables, Figures & Appendices
Air Quality Modelling.doc 25-FEB-02
ii
Tables
TABLE 3-1 REGULATORY AND PROPOSED STACK EMISSION LIMITS ..........................3-1
TABLE 3-2 NSW EPA IMPACT ASSESSMENT CRITERIA .....................................................3-2
TABLE 3-3 NEPC AMBIENT AIR QUALITY CRITERIA .........................................................3-3
TABLE 6-1 STAGE ONE EMISSIONS INVENTORY: STACK SOURCES ..............................6-2
TABLE 6-2 STAGE ONE EMISSIONS INVENTORY: ALL SITE VEHICLES.........................6-2
TABLE 6-3 STAGE ONE EMISSIONS INVENTORY: FUGITIVE SOURCES.........................6-3
TABLE 6-4 STAGE ONE DISPERSION MODELLING RESULTS ...........................................6-5
TABLE 6-5 STAGE THREE EMISSIONS INVENTORY: STACK SOURCES .........................6-8
TABLE 6-6 STAGE THREE EMISSIONS INVENTORY: ALL SITE VEHICLES ....................6-9
TABLE 6-7 STAGE THREE EMISSIONS INVENTORY: FUGITIVE SOURCES ....................6-9
TABLE 6-8 STAGE THREE DISPERSION MODELLING RESULTS.....................................6-11
Figures
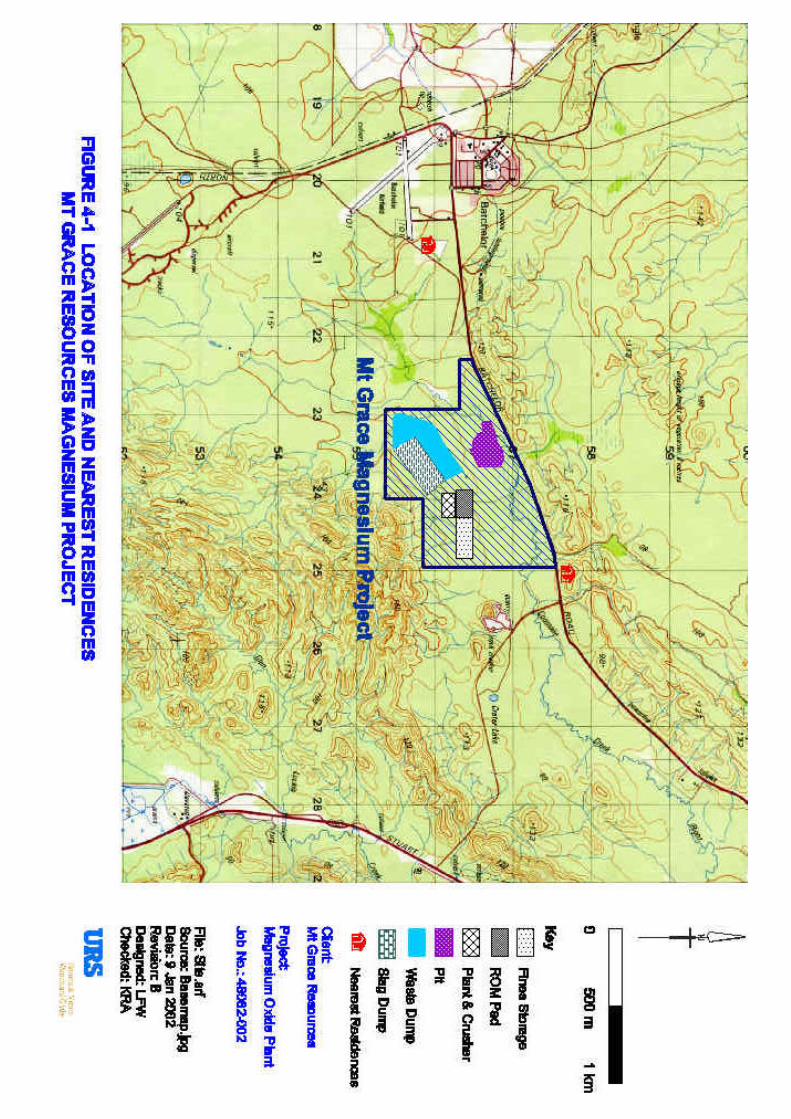
FIGURE 4-1 LOCATION OF SITE AND NEAREST RESIDENCES
FIGURE 6-1 STAGE ONE ANNUAL PM10 EMISSIONS BY SOURCE
FIGURE 6-2 STAGE 1: MAXIMUM PREDICTED DOWNWIND CONCENTRATIONS PM10
(ANNUAL AVERAGE)
FIGURE 6-3 STAGE 1: MAXIMUM PREDICTED DOWNWIND CONCENTRATIONS PM10
(24-HOUR AVERAGE)
FIGURE 6-4 STAGE 1: MAXIMUM PREDICTED DOWNWIND CONCENTRATIONS TSP(ANNUAL AVERAGE)
FIGURE 6-5 STAGE 1: MAXIMUM PREDICTED DOWNWIND CONCENTRATIONS MgO(3-MINUTE AVERAGE)
FIGURE 6-6 STAGE 1: MAXIMUM PREDICTED DOWNWIND CONCENTRATIONS NH3
(3-MINUTE AVERAGE)
FIGURE 6-7 STAGE 1: MAXIMUM PREDICTED DOWNWIND CONCENTRATIONS SO2
(10-MINUTE AVERAGE)
FIGURE 6-8 STAGE 1: MAXIMUM PREDICTED DOWNWIND CONCENTRATIONS NOx
(1-HOUR AVERAGE)
FIGURE 6-9 STAGE 1: MAXIMUM PREDICTED DOWNWIND CONCENTRATIONS CO(8-HOUR AVERAGE)
FIGURE 6-10 STAGE THREE ANNUAL PM10 EMISSIONS BY SOURCE
FIGURE 6-11 STAGE 3: MAXIMUM PREDICTED DOWNWIND CONCENTRATIONS PM10
(ANNUAL AVERAGE)

List of Tables, Figures & Appendices
Air Quality Modelling.doc 25-FEB-02
iii
FIGURE 6-12 STAGE 3: MAXIMUM PREDICTED DOWNWIND CONCENTRATIONS PM10
(24-HOUR AVERAGE)
FIGURE 6-13 STAGE 3: MAXIMUM PREDICTED DOWNWIND CONCENTRATIONS TSP(ANNUAL AVERAGE)
FIGURE 6-14 STAGE 3: MAXIMUM PREDICTED DOWNWIND CONCENTRATIONS MgO(3-MINUTE AVERAGE)
FIGURE 6-15 STAGE 3: MAXIMUM PREDICTED DOWNWIND CONCENTRATIONS NH3
(3-MINUTE AVERAGE)
FIGURE 6-16 STAGE 3: MAXIMUM PREDICTED DOWNWIND CONCENTRATIONS SO2
(10-MINUTE AVERAGE)
FIGURE 6-17 STAGE 3: MAXIMUM PREDICTED DOWNWIND CONCENTRATIONS NOx
(1-HOUR AVERAGE)
FIGURE 6-18 STAGE 3: MAXIMUM PREDICTED DOWNWIND CONCENTRATIONS CO(8-HOUR AVERAGE)
Appendices
APPENDIX A EMISSION SPREADSHEET CALCULATIONS
APPENDIX B VALIDATION OF METEOROLOGICAL DATA
APPENDIX C WIND ROSES & FREQUENCY DISTRIBUTION
SECTION 1Introduction
Air Quality Modelling.doc 25-FEB-02
1-1
1 Introduction
This report is an air quality assessment prepared by URS Australia Pty Ltd (URS) for Mt GraceResources Limited (Mt Grace) for a proposed magnesium mine and refining plant in Batchelor, NT. Thisreport is to form part of an Environmental Impact Statement (EIS) for the development. A full processdescription is contained within the EIS and shall not be reproduced here except where directly relevant tothe air quality assessment. This report contains significant technical detail and non-technical readers areadvised to refer to the summary chapter contained within the EIS.
Air pollution is not a single entity, but comprises a number of pollutants, which may have separatesources and effects. In the case of the Batchelor Project, the main emission with potential for off-siteeffects is particulate, primarily from large open sources associated with mining activities. Other potentialdischarges to air include products of combustion from the calcining and refining process.
These emissions and their potential impacts on the air environment are addressed in this report. Thestructure of the report is as follows;
Section 2. Pollutants Under Review
This section describes each pollutant individually, discusses their chemistry and their potential impactupon human health or amenity.
Section 3. Assessment Criteria
This section details the relevant assessment criteria to be applied to stack emission discharges andambient concentrations.
Section 4. Assessment Methodology
This section outlines the methods used in undertaking the assessment, including atmospheric dispersionmodelling techniques and the calculation of pollutant emission data for inventory purposes.
Section 5. Existing Environment
This section considers the local winds and topographical effects that may impact on dispersion ofemissions from the development in the vicinity of the proposed site.
Section 6. Impact Assessment
Ground level pollutant concentrations predicted by the modelling study are presented and discussed.
Section 7. Mitigation Measures
This section considers the environmental safeguards currently in place and includes recommendations toeliminate or minimise any adverse impacts.
Section 8. Conclusions
This section sums up the findings of the impact assessment.

SECTION 2Pollutants Under Review
Air Quality Modelling.doc 25-FEB-02
2-1
2 Pollutants Under Review
Emissions of potential concern from the proposal include the following:
• Particulate: from drilling and blasting, process plant and equipment including the Magnesite Kiln &crusher, stockpiles, exposed areas and loading & unloading activities;
• Products of combustion: from the Magnesite Kiln which burns natural gas;
• Sulphur dioxide: from the acid scrubber;
• Magnesium oxide: from the Magnesite Kiln and fugitive sources such as exposed areas containingwaste; and
• Ammonia: from the ammonia scrubber.
Emissions of particulate matter may give rise to both suspended particulate and deposited particulate.Products of natural gas combustion include carbon dioxide and carbon monoxide, oxides of nitrogen (ofwhich nitrogen dioxide is of most concern) and small quantities of sulphur dioxide. Magnesium oxide isthe oxidised version of the magnesium metal. This is formed only after combustion, i.e. in the calciningprocess. Prior to this magnesium is present as magnesite, the naturally occuring magnesium carbamatemineral which constitutes the ore. Ammonia is generated during the process and extracted by a scrubberto produce ammonium sulphate liquor.
Full details of each pollutant and their potential impacts on human health or amenity are given below.
2.1 Particulate
Suspended Particulate
Suspended particulate matter is dust or aerosol that stays suspended in the atmosphere for significantperiods. The current nomenclature is to describe fractions of suspended particulate as:
• PM10: all particulate effectively less than 10 microns (µm) in diameter;
• PM2.5: all particulate effectively less than 2.5 µm in diameter; and
• TSP: total suspended particulate, generally less than 50 µm in diameter.
Within the range of suspended particulate, the group of particles which are sized 10 µm or less (PM10)have been associated with health effects including increases in mortality, aggravation of existingrespiratory and cardiovascular disease, increased hospital admissions and increased asthma incidents.More recent research however, indicates that it may be the PM2.5 fraction that has the greatest impact onhuman health. Particulate that are larger than 10 µm, tend not to be able to penetrate the respiratory tractand do not appear to be significant with respect to potential health effects.
SECTION 2Pollutants Under Review
Air Quality Modelling.doc 25-FEB-02
2-2
Major natural sources of background particulate levels include forest fires, pollen and wind-blown dustfrom exposed areas. Anthropogenic sources include stationary and mobile combustion sources, road dust,agriculture, mining, major fires and emissions from industrial processes. Background levels vary widelydepending on location, meteorology and proximity of major point or area sources.
Deposited Particulate Matter
Deposited particulate matter is dust that, because of its aerodynamic diameter and density, rapidly fallsfrom the air. In general terms, deposited particulate has a diameter of greater than about 20 µm. Howeverthere is no sharp dividing line between these particles and the smaller particles of suspended matter thatfall more slowly out of the air. Because of the size of the particulate matter, most of this material will notenter the body. Hence the effects of deposited particulate are primarily nuisance, and may only affecthealth via annoyance reactions and the like.
The dust deposition rate is measured as the amount of dust deposited on a horizontal surface as a result ofgravitational settling over a specified time period. The units for this parameter are grams per square metreper month (g/m2/month).
2.2 Products of Combustion
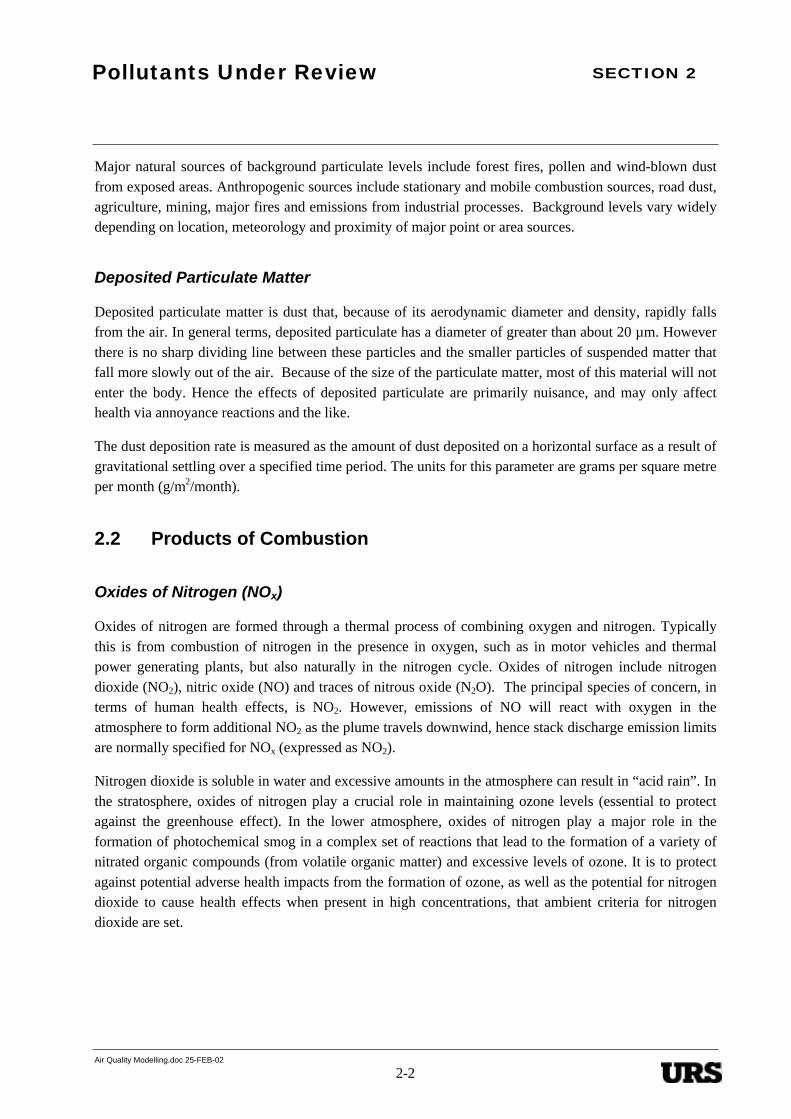
Oxides of Nitrogen (NOx)
Oxides of nitrogen are formed through a thermal process of combining oxygen and nitrogen. Typicallythis is from combustion of nitrogen in the presence in oxygen, such as in motor vehicles and thermalpower generating plants, but also naturally in the nitrogen cycle. Oxides of nitrogen include nitrogendioxide (NO2), nitric oxide (NO) and traces of nitrous oxide (N2O). The principal species of concern, interms of human health effects, is NO2. However, emissions of NO will react with oxygen in theatmosphere to form additional NO2 as the plume travels downwind, hence stack discharge emission limitsare normally specified for NOx (expressed as NO2).
Nitrogen dioxide is soluble in water and excessive amounts in the atmosphere can result in “acid rain”. Inthe stratosphere, oxides of nitrogen play a crucial role in maintaining ozone levels (essential to protectagainst the greenhouse effect). In the lower atmosphere, oxides of nitrogen play a major role in theformation of photochemical smog in a complex set of reactions that lead to the formation of a variety ofnitrated organic compounds (from volatile organic matter) and excessive levels of ozone. It is to protectagainst potential adverse health impacts from the formation of ozone, as well as the potential for nitrogendioxide to cause health effects when present in high concentrations, that ambient criteria for nitrogendioxide are set.
SECTION 2Pollutants Under Review
Air Quality Modelling.doc 25-FEB-02
2-3
Carbon Monoxide (CO)
Carbon monoxide occurs naturally in forest fires, volcanic ash and marsh gases. It is also sourced fromincomplete combustion of fuels (particularly in motor vehicles), smoking cigarettes, burning wood andindustrial plant exhaust.
Sulphur Dioxide
Sulfur dioxide (SO2) is a colourless, pungent, irritating and reactive gas, which is soluble in water. SO2
and its reaction products (sulfurous and sulfuric acids and sulfate particles) are generally removed fromthe atmosphere by rain, and by direct uptake at plant, soil and water surfaces.
Natural sources of SO2 are volcanic and geothermal activity. Bacterial and algal processes can produceorganic sulfur compounds that are readily converted to SO2. The main human activities that are sources ofSO2 include power generation from the burning of coal, oil or gas containing significant amounts ofsulfur, the roasting or smelting of mineral ores containing sulfur, oil refining, and industrial plants thatburn large quantities of fuels with a high sulfur content. In urban areas motor vehicles contribute about10% to ambient SO2 levels.
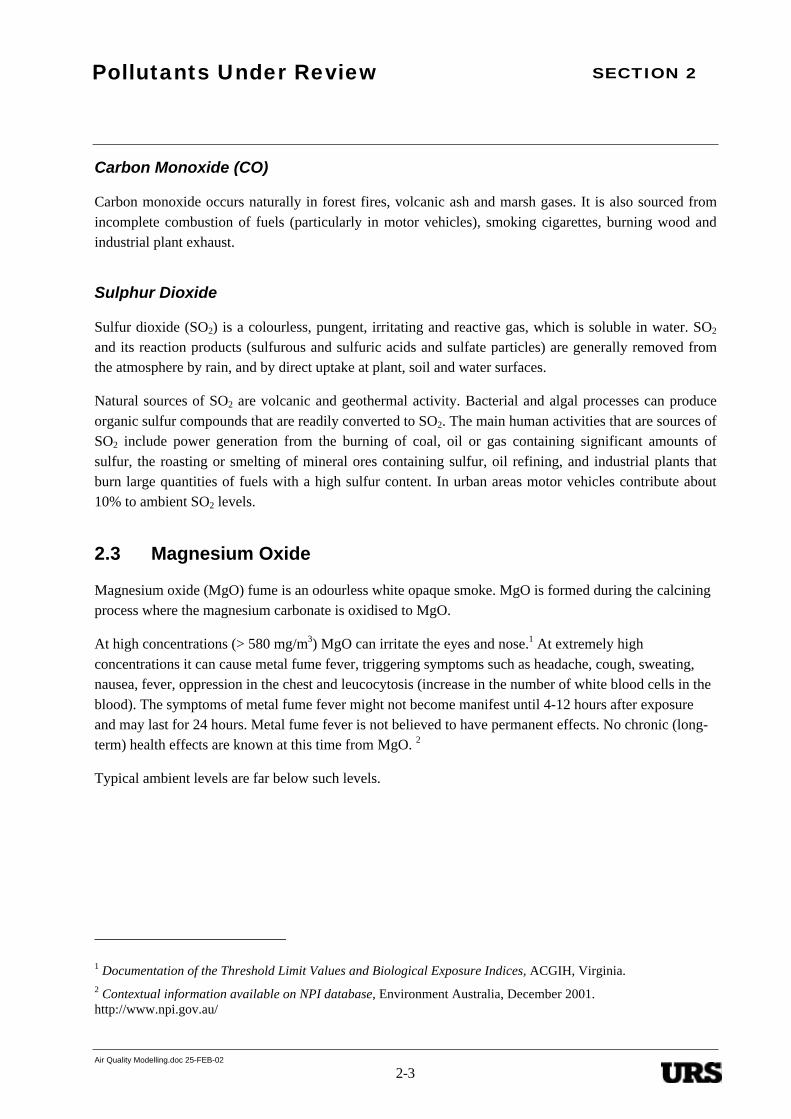
2.3 Magnesium Oxide
Magnesium oxide (MgO) fume is an odourless white opaque smoke. MgO is formed during the calciningprocess where the magnesium carbonate is oxidised to MgO.
At high concentrations (> 580 mg/m3) MgO can irritate the eyes and nose.1 At extremely highconcentrations it can cause metal fume fever, triggering symptoms such as headache, cough, sweating,nausea, fever, oppression in the chest and leucocytosis (increase in the number of white blood cells in theblood). The symptoms of metal fume fever might not become manifest until 4-12 hours after exposureand may last for 24 hours. Metal fume fever is not believed to have permanent effects. No chronic (long-term) health effects are known at this time from MgO. 2
Typical ambient levels are far below such levels.
1 Documentation of the Threshold Limit Values and Biological Exposure Indices, ACGIH, Virginia.2 Contextual information available on NPI database, Environment Australia, December 2001.http://www.npi.gov.au/
SECTION 2Pollutants Under Review
Air Quality Modelling.doc 25-FEB-02
2-4
2.4 Ammonia
Ammonia is a colourless gas with a sharp, irritating odour that is first detectable between 0.04 – 53 ppm. 3
Ammonia is used as a refrigerant, a cleaning and bleaching agent, and a household cleaner. It is used toproduce fertilisers, plastics, explosives, and pharmaceuticals, and to control fungal growth on grapefruit,lemons, and oranges. In this proposal, ammonia is scrubbed and sold as a liquor.
3 Odor Thresholds for Chemicals with Established Occupational Health Standards, American Industrial HygieneAssociation, Akron, USA.
SECTION 3Assessment Criteria
Air Quality Modelling.doc 25-FEB-02
3-1
3 Assessment Criteria
There are three types of criteria that apply to atmospheric pollutants. These are:
• Discharge Emission Limits – These are concentration or mass emission limits applied at the pointof discharge (typically a stack).
• Impact Assessment Criteria – These are ground level concentration limits designed to be used inconjunction with dispersion modelling. If maximum predicted downwind concentrations are lessthan the impact assessment criteria, then there should be no adverse impacts on the environment.
• Ambient Air Quality Criteria – These are concentrations set to protect public health and amenityand are designed as criteria for ambient monitoring programs.
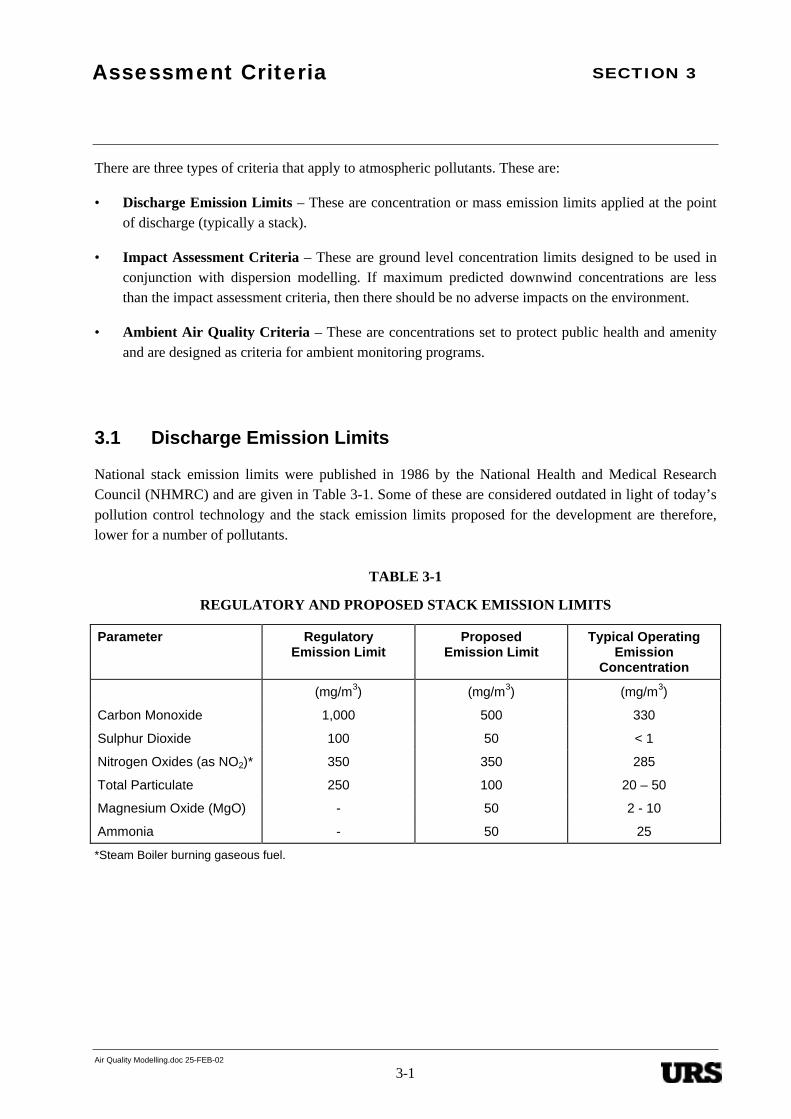
3.1 Discharge Emission Limits
National stack emission limits were published in 1986 by the National Health and Medical ResearchCouncil (NHMRC) and are given in Table 3-1. Some of these are considered outdated in light of today’spollution control technology and the stack emission limits proposed for the development are therefore,lower for a number of pollutants.
TABLE 3-1
REGULATORY AND PROPOSED STACK EMISSION LIMITS
Parameter RegulatoryEmission Limit
ProposedEmission Limit
Typical OperatingEmission
Concentration
(mg/m3) (mg/m3) (mg/m3)
Carbon Monoxide 1,000 500 330
Sulphur Dioxide 100 50 < 1
Nitrogen Oxides (as NO2)* 350 350 285
Total Particulate 250 100 20 – 50
Magnesium Oxide (MgO) - 50 2 - 10
Ammonia - 50 25
*Steam Boiler burning gaseous fuel.
SECTION 3Assessment Criteria
Air Quality Modelling.doc 25-FEB-02
3-2
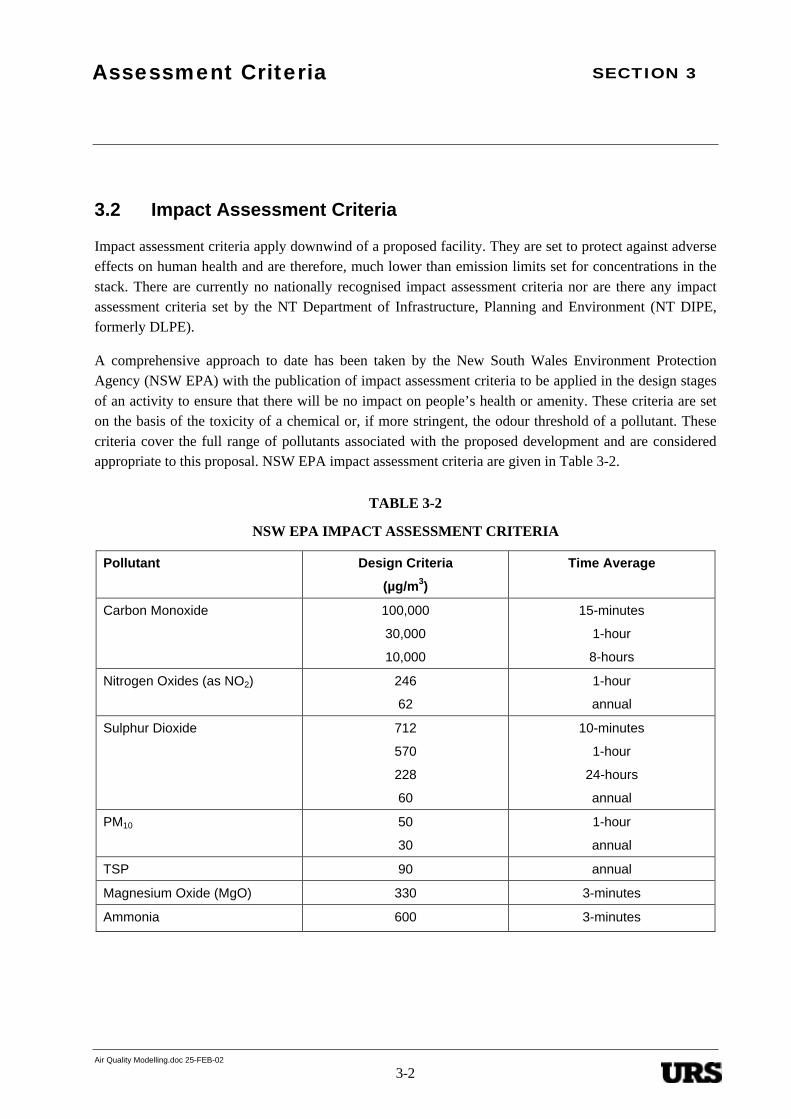
3.2 Impact Assessment Criteria
Impact assessment criteria apply downwind of a proposed facility. They are set to protect against adverseeffects on human health and are therefore, much lower than emission limits set for concentrations in thestack. There are currently no nationally recognised impact assessment criteria nor are there any impactassessment criteria set by the NT Department of Infrastructure, Planning and Environment (NT DIPE,formerly DLPE).
A comprehensive approach to date has been taken by the New South Wales Environment ProtectionAgency (NSW EPA) with the publication of impact assessment criteria to be applied in the design stagesof an activity to ensure that there will be no impact on people’s health or amenity. These criteria are seton the basis of the toxicity of a chemical or, if more stringent, the odour threshold of a pollutant. Thesecriteria cover the full range of pollutants associated with the proposed development and are consideredappropriate to this proposal. NSW EPA impact assessment criteria are given in Table 3-2.
TABLE 3-2
NSW EPA IMPACT ASSESSMENT CRITERIA
Pollutant Design Criteria
(µg/m3)
Time Average
Carbon Monoxide 100,000
30,000
10,000
15-minutes
1-hour
8-hours
Nitrogen Oxides (as NO2) 246
62
1-hour
annual
Sulphur Dioxide 712
570
228
60
10-minutes
1-hour
24-hours
annual
PM10 50
30
1-hour
annual
TSP 90 annual
Magnesium Oxide (MgO) 330 3-minutes
Ammonia 600 3-minutes
SECTION 3Assessment Criteria
Air Quality Modelling.doc 25-FEB-02
3-3
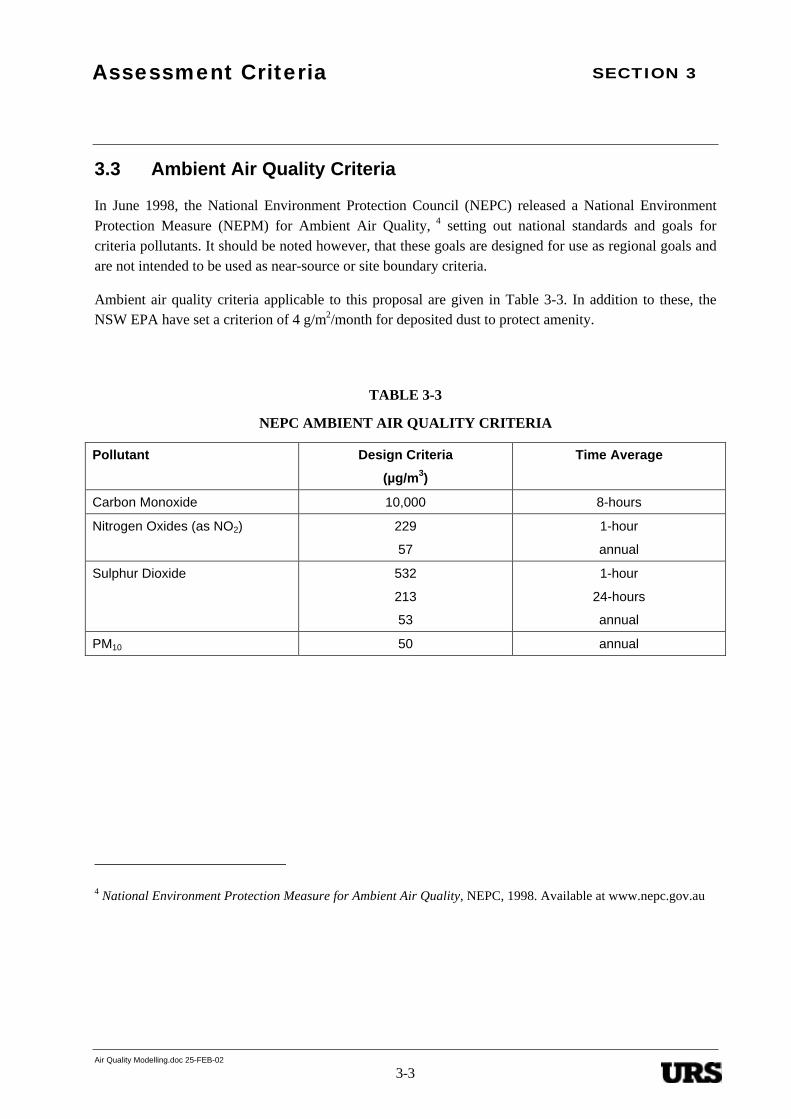
3.3 Ambient Air Quality Criteria
In June 1998, the National Environment Protection Council (NEPC) released a National EnvironmentProtection Measure (NEPM) for Ambient Air Quality, 4 setting out national standards and goals forcriteria pollutants. It should be noted however, that these goals are designed for use as regional goals andare not intended to be used as near-source or site boundary criteria.
Ambient air quality criteria applicable to this proposal are given in Table 3-3. In addition to these, theNSW EPA have set a criterion of 4 g/m2/month for deposited dust to protect amenity.
TABLE 3-3
NEPC AMBIENT AIR QUALITY CRITERIA
Pollutant Design Criteria
(µg/m3)
Time Average
Carbon Monoxide 10,000 8-hours
Nitrogen Oxides (as NO2) 229
57
1-hour
annual
Sulphur Dioxide 532
213
53
1-hour
24-hours
annual
PM10 50 annual
4 National Environment Protection Measure for Ambient Air Quality, NEPC, 1998. Available at www.nepc.gov.au

SECTION 4Assessment Methodology
Air Quality Modelling.doc 25-FEB-02
4-1
4 Assessment Methodology
4.1 Emissions Inventory
An emissions inventory for each stage of the project was prepared in accordance with the NationalPollutant Inventory (NPI) Emission Estimation Technique (EET) Manual for Mining 5 and process datasupplied by Mt Grace. Full calculations are given in Appendix A. Annual emissions are summarised anddiscussed in Section 6.
The inventory comprises a large number of fugitive sources such as truck loading, wind erosion ofexposed areas, etc. Emission estimates from these types of sources relies heavily upon calculations usingemission factors. A full discussion of the limitations and appropriateness of the emissions factorspromulgated by Environment Australia is given in the NPI EET Manual for Mining.
Process data was supplied by Mt Grace following the preparation of mass and energy balances by AlphaOmega Engineering, Inc. Calculation of gas exhausting the magnesite kiln was corrected for carbondioxide production from oxidation of carbonates within the ore. All flows were corrected for temperatureand water when calculating emission rates based upon proposed concentration limits. Full details aregiven in the spreadsheet calculations supplied in Appendix A.
Assumptions used for the preparation of process data and emissions estimation are given below:
Stage One
• Year 1 – 2.
• 1.925 million tonnes of overburden, ore and waste removed from the pit.
• 17 blasts per year.
• Mining carried out 9 hours per day (7 am – 4 pm), 92 days per year.
• Plant producing 12,500 tonnes magnesium per year, operating 24 hours per day, 365 days per year(conservative or ‘worst case’ scenario). One magnesite kiln exhausting through ST01.
• Areas subject to wind blown erosion were set at 50% of the full area specified for full production.*This is conservative bearing in mind that production will only be 25% of Stage Three.
• It was assumed that fines would be stockpiled separately (Mt Grace are considering mixing with slagto form a more stable waste for disposal).
* The exception to this is exposed Plant area for which a factor of 0.3 is specified in the NPI EET Manualfor Mining to allow for area covered by plant and equipment.
5 Environment Australia, Version 2.1, October 2000.
SECTION 4Assessment Methodology
Air Quality Modelling.doc 25-FEB-02
4-2
Stage Two
• Years 3 - 4
As above with the following exceptions:
• 0.87 million tonnes of overburden, ore and waste removed from the pit.
• Mining carried out 9 hours per day (7 am – 4 pm), 83 days per year.
• Plant producing 25,000 tonnes magnesium per year, operating 24 hours per day, 365 days per year(conservative or ‘worst case’ scenario). Two magnesite kilns exhausting through ST01.
Stage Three
• Year 5 and subsequent years.
As above with the following exceptions:
• 1.925 million tonnes of overburden, ore and waste removed from the pit.
• Mining carried out 9 hours per day (7 am – 4 pm), 92 days per year.
• Plant producing 50,000 tonnes magnesium per year, operating 24 hours per day, 365 days per year(conservative or ‘worst case’ scenario). Three magnesite kilns exhausting through ST01 and ST06.
4.2 Dispersion Modelling
The atmospheric dispersion model AUSPLUME (version 5.3) was used to predict downwindconcentrations from the proposed site. AUSPLUME was developed for use in air quality impactassessments by the Victoria Environmental Protection Agency (EPAV) and has recently been upgraded toimprove its ability to simulate the dispersion of particulate matter from mining type sources.
Meteorological data was obtained by Katestone Scientific and formatted for use in AUSPLUME. Fulldetails of data preparation and validation for the Batchelor area are given in Appendix B.
Modelling was carried out for all stages of the proposed operation as follows:
• Stage 1: 12,500 tonnes/annum production of Magnesium; and
• Stage 3: 50,000 tonnes/annum production of Magnesium.

SECTION 4Assessment Methodology
Air Quality Modelling.doc 25-FEB-02
4-3
Modelling was also carried out for the following time averages to enable direct comparison with therelevant guidelines for different pollutants:
• 3-minute 99.9 percentile (MgO, NH3);
• 10-minute 99.9 percentile (SO2);
• 1-hour 99.9 percentile (NO2);
• 8-hour average (CO);
• 24-hour average (PM10, SO2); and
• Annual averages (PM10, TSP, SO2).
99.9 percentile concentrations were used for the 3-minute, 10-minute and 1-hour averaging times inaccordance with the NSW EPA and EPAV approved modelling protocols. Removing the extreme peakshort-term predictions is done to eliminate freak meteorological conditions and to provide realistic worstcase predictions.
A receptor grid using Australian map grid co-ordinates was created to extend 3,000 m east and west, and4,000 m north and south of the site. When identifying maximum predicted ground level concentrations,values predicted for receptors within the site boundary were removed from the assessment. Gridded filesused for preparation of contour plots however, included all concentrations predicted at all receptors. Thereceptor grid is shown in Figure 4-1.
In addition to these gridded receptors, discrete receptors were located to calculate concentrations at thenearest residences to the site. These residences are located to the north east and west of the site as shownin Figure 4-1.
Terrain effects were taken into consideration using the Egan half-height method and data obtainedmanually from a topographical map.6
Building dimensions were entered into the model using the Building Profile Input Programme utility ofthe AUSPLUME model. Building downwash was simulated using the PRIME algorithm option.
The average canopy height of the terrain surrounding the site is approximately 8 m due to the presence ofwoodlands. A roughness factor of 0.6 m was therefore designated for land use.
All particulate emissions were assigned to either ‘area’ or ‘volume’ sources and included in the dispersionmodelling as follows:
• Volume sources (such as truck un/loading) were located in the middle of the activity area andassumed to be 1 m above ground with an initial vertical and horizontal spread of 1 m.
6 Batchelor, Northern Territory, Series R722, Sheet 5171 4, Edition 2-AAS. Commonwealth of Australia, 1985.

SECTION 4Assessment Methodology
Air Quality Modelling.doc 25-FEB-02
4-4
• The area sources were all approximated to rectangular shapes and were set at ground level. Theywere located based upon the south western corner of the area and aligned upon north within the gridco-ordinates and terrain already specified in AUSPLUME.
• Terrain heights for all sources at each location (typically 80 m ADL across the site) were alsoincluded.
The only exception to the above were sources located within the pit which were assumed to be at60 m ADL in Stage One, and 20 m ADL in Stage Three (initially 80 m ADL prior to open cut).

SECTION 5Existing Environment
Air Quality Modelling.doc 25-FEB-02
5-1
5 Existing Environment
5.1 Climate and Meteorology
5.1.1 Wind Direction and Wind Speed
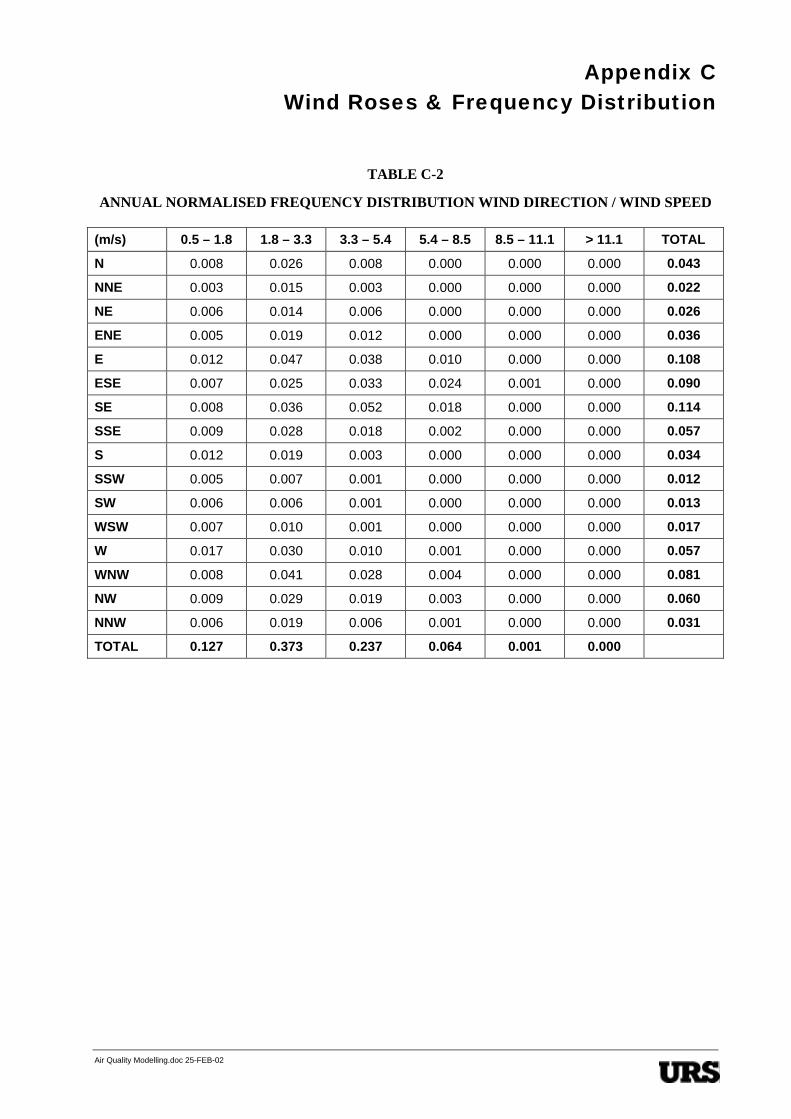
Wind roses for the area are presented in Appendix C. Wind speed and direction data were collected half-hourly from the Batchelor automatic weather station, which is located approximately 7 km west southwest of the site. The data covers the period from 1 January 2000 to 31 December 2000, withapproximately 17 days of data missing from late February to early March.
The Batchelor region experiences a tropical climate with two seasons – the dry season (May – October)and the wet season (November – April). The wind roses show the predominant wind patterns for thisperiod were as follows:
• Annual: Winds are typically fresh to moderate and predominantly from the south east and east. Thepercentage of calm winds was 20%.
• Dry Season (May – Oct): The predominant winds during the dry season were light to strong andfrom the west to north west. The percentage of calm winds was 17%. Winds were stronger during thedaytime than through the night, although the predominant wind directions were similar.
• Wet Season (Nov – Apr): Winds were light to strong with a high frequency of winds from the southeast quadrant. The percentage of calm winds was 19%.
Frequency distribution tables are provided in Appendix C.
5.2 Existing Air Quality
There is no ambient air quality data available for the region. Given the rural nature of the area and thelack of either urban population or industry, existing air quality is expected to be good. On occasionsuspended and deposited particulate levels may be elevated due to windblown dust, agricultural activitiesor bush fires. Despite the likelihood of existing background levels of particulates in the region beingelevated on a seasonal basis, the modelling undertaken for this air quality assessment assumed zerobackground concentrations to represent a conservative estimate of the atmospheric impacts associatedwith the proposal.
SECTION 6Impact Assessment
Air Quality Modelling.doc 25-FEB-02
6-1
6 Impact Assessment
The first year of operation (Stage One) will see the largest potential impact from fugitive particulateemissions as topsoil and overburden are removed to expose the ore. Stage Three, which has the maximumprocessing capacity (50,000 tpa Mg) gives maximum annual stack discharges. As a first step in theanalysis, only Stages One and Three were therefore considered. Should emissions from neither of theseStages result in any adverse effects then Stage Two, which has lesser emissions, should also not result inany adverse impacts.
The following assessment therefore, addresses emissions from Stage One and Stage Three.
6.1 Stage One
6.1.1 Emissions
Mt Grace estimates approximately 1.925 million tonnes will be moved in the first year. Mining activitiesthat have the potential to result in dust emissions include the following:
• topsoil removal and excavation;
• dumping, stockpiling & transfer of ore, overburden, fines, wastes & slag;
• machinery and vehicle movements on site; and
• dust pick-up from exposed areas.
These emissions are typically referred to as ‘fugitive’ emissions. That is, they arise from open ‘area’ or‘volume’ sources (e.g unloading of trucks) and are often intermittent.
For the purposes of a worst-case conservative assessment, the plant was assumed to be fully operational at12,500 T/yr in conjunction with the above removal of 1.925 million tonnes of overburden, ore and wastefrom the pit.
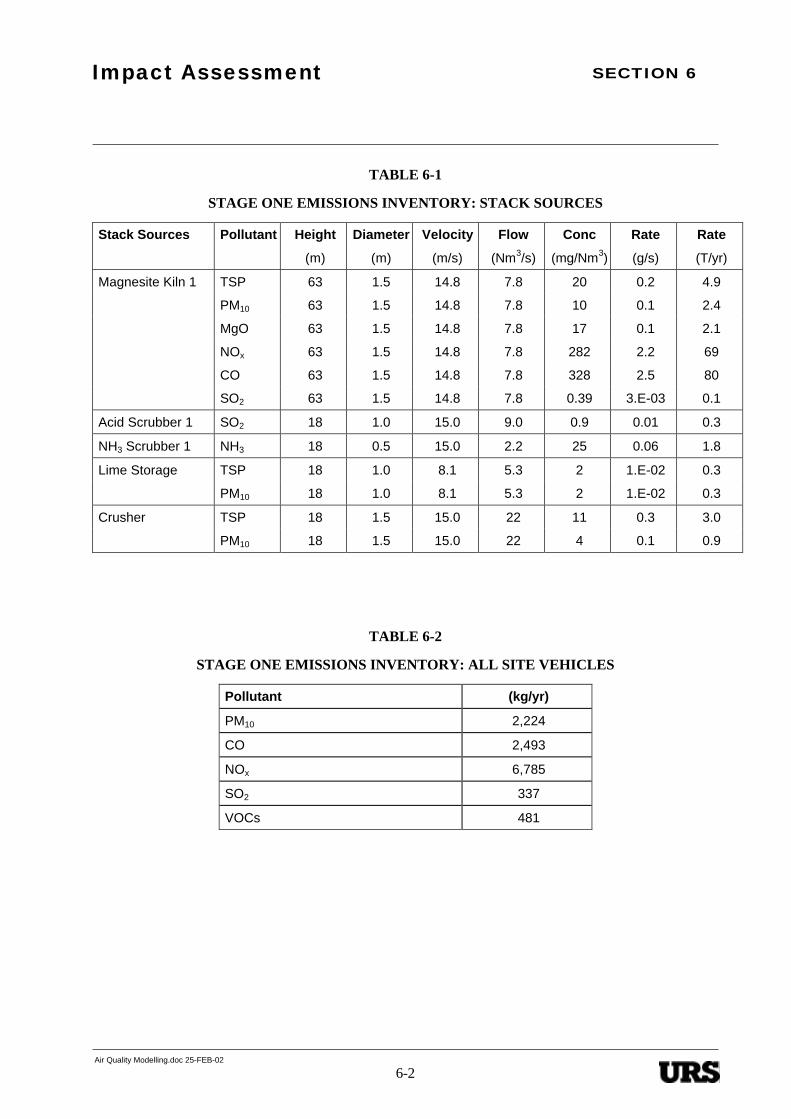
Emission sources have been grouped according to exhaust configuration as either point sources (i.e.stacks) or fugitive sources (such as exposed wind blown areas). The emission estimates for Stage One areshown in Table 6-1 (stack sources), Table 6-2 (vehicles) and Table 6-3 (fugitive sources). Annualemissions of PM10 are further presented graphically, by source type, in Figure 6-1.
SECTION 6Impact Assessment
Air Quality Modelling.doc 25-FEB-02
6-2
TABLE 6-1
STAGE ONE EMISSIONS INVENTORY: STACK SOURCES
Stack Sources Pollutant Height Diameter Velocity Flow Conc Rate Rate
(m) (m) (m/s) (Nm3/s) (mg/Nm3) (g/s) (T/yr)
Magnesite Kiln 1 TSP 63 1.5 14.8 7.8 20 0.2 4.9
PM10 63 1.5 14.8 7.8 10 0.1 2.4
MgO 63 1.5 14.8 7.8 17 0.1 2.1
NOx 63 1.5 14.8 7.8 282 2.2 69
CO 63 1.5 14.8 7.8 328 2.5 80
SO2 63 1.5 14.8 7.8 0.39 3.E-03 0.1
Acid Scrubber 1 SO2 18 1.0 15.0 9.0 0.9 0.01 0.3
NH3 Scrubber 1 NH3 18 0.5 15.0 2.2 25 0.06 1.8
Lime Storage TSP 18 1.0 8.1 5.3 2 1.E-02 0.3
PM10 18 1.0 8.1 5.3 2 1.E-02 0.3
Crusher TSP 18 1.5 15.0 22 11 0.3 3.0
PM10 18 1.5 15.0 22 4 0.1 0.9
TABLE 6-2
STAGE ONE EMISSIONS INVENTORY: ALL SITE VEHICLES
Pollutant (kg/yr)
PM10 2,224
CO 2,493
NOx 6,785
SO2 337
VOCs 481

SECTION 6Impact Assessment
Air Quality Modelling.doc 25-FEB-02
6-3
TABLE 6-3
STAGE ONE EMISSIONS INVENTORY: FUGITIVE SOURCES
Fugitive Sources Annual EmissionTSP
Annual EmissionPM10
Annual EmissionMgO
(kg/yr) (kg/yr) (kg/yr)
Open Cut 2,066 668
Pit – Wind erosion 842 421
Plant – Wind erosion 534 267 278
ROM – Wind erosion 925 463
Fines – Wind erosion 2,638 1,319
Slag – Wind erosion 999 500 520
Waste – Wind erosion 3,748 1,874
Drilling & Blasting 43,671 22,709
Pit – Loading 2,888 1,348
ROM Pad – Unloading 300 140
ROM Pad – Loading 300 140
Waste – Unloading 2,588 1,208 1,346
Fines – Loading 1 0.6
Fines – Unloading 60 28
Slag – Unloading 132 62
Crusher 2,966 947
ROM - Stockpile loading 640 272
ROM - Stockpile unloading 4,800 2,080
Lime storage - unloading 5 2
Conveyor 2,880 1,440
TOTAL (kg/yr) 72,984 35,887 2,144

SECTION 6Impact Assessment
Air Quality Modelling.doc 25-FEB-02
6-4
Stage 1: Annual PM10 Emissions - All Sources
Truck Un/loading7%
Crushing2%
Stockpiles, Plant9%
Stack Sources9%
Vehicles5%
Drilling & Blasting56%
Wind Erosion12%
Figure 6-1. Stage One Annual PM10 Emissions by Source
Figure 6-1 shows that, on an annual basis, the greatest contributor to dust emissions is blasting. This onlyoccurs however, on an intermittent basis. Mt Grace estimates that blasting will be carried out on 17 daysin the first year. Due to the short, intense nature of such emissions it is not technically feasible to includethem in the dispersion modelling study. It is likely that during events such as blasting, short-term levels ofTSP and PM10 would be elevated downwind of the blast area beyond the site boundary. If appropriatedust minimisation practices are adopted during drilling and blasting (discussed in Section 7) it is unlikely,however that significantly elevated levels would be experienced as far afield as the Batchelor township orat either of the neighbouring residences, .
The next most significant source group is the stacks associated with the processing plant. These emissionshave been included in the atmospheric dispersion study which is discussed below.
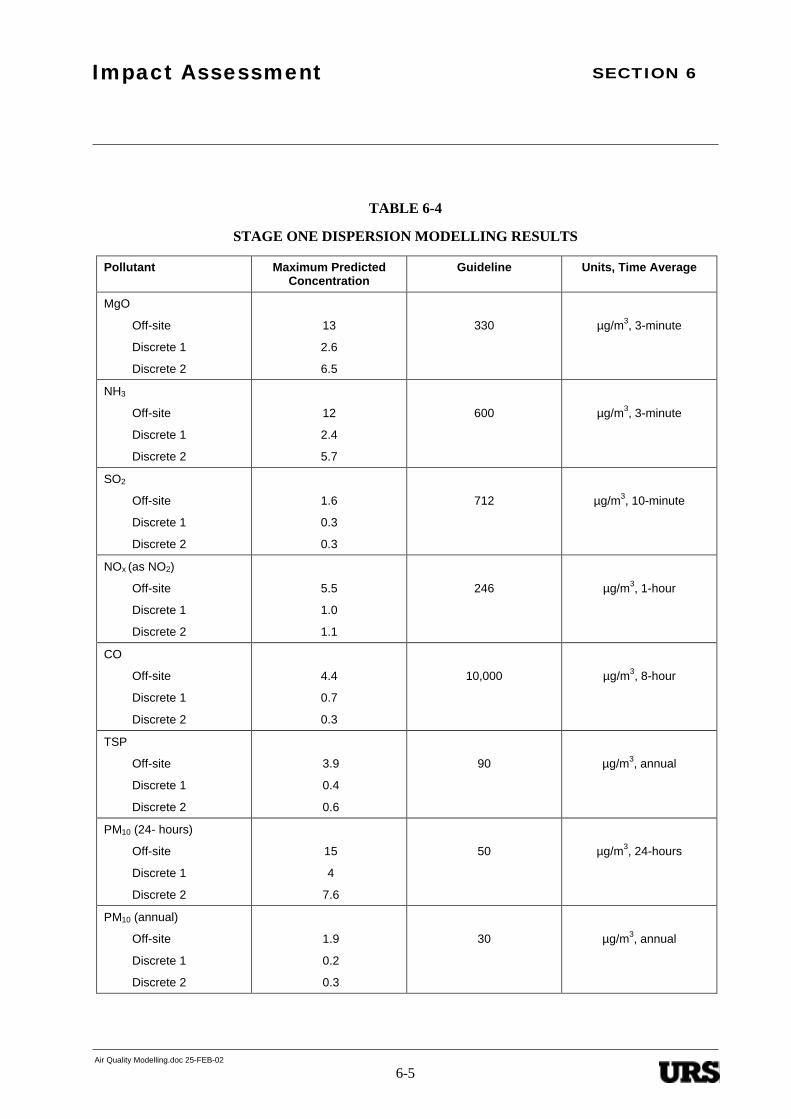
6.1.2 Dispersion Modelling
Stage 1 pollutants were modelled to predict maximum downwind concentrations as outlined in Section 4(the exception to this being blasting). Table 6-4 presents a summary of the maximum predictedconcentrations at all offsite receptor locations and at the discrete receptors (nearest residences) forcomparison with the respective guidelines.
SECTION 6Impact Assessment
Air Quality Modelling.doc 25-FEB-02
6-5
TABLE 6-4
STAGE ONE DISPERSION MODELLING RESULTS
Pollutant Maximum PredictedConcentration
Guideline Units, Time Average
MgO
Off-site
Discrete 1
Discrete 2
13
2.6
6.5
330 µg/m3, 3-minute
NH3
Off-site
Discrete 1
Discrete 2
12
2.4
5.7
600 µg/m3, 3-minute
SO2
Off-site
Discrete 1
Discrete 2
1.6
0.3
0.3
712 µg/m3, 10-minute
NOx (as NO2)
Off-site
Discrete 1
Discrete 2
5.5
1.0
1.1
246 µg/m3, 1-hour
CO
Off-site
Discrete 1
Discrete 2
4.4
0.7
0.3
10,000 µg/m3, 8-hour
TSP
Off-site
Discrete 1
Discrete 2
3.9
0.4
0.6
90 µg/m3, annual
PM10 (24- hours)
Off-site
Discrete 1
Discrete 2
15
4
7.6
50 µg/m3, 24-hours
PM10 (annual)
Off-site
Discrete 1
Discrete 2
1.9
0.2
0.3
30 µg/m3, annual

SECTION 6Impact Assessment
Air Quality Modelling.doc 25-FEB-02
6-6
The resulting contour plots of maximum predicted concentrations anticipated during Stage 1 productionare shown in Figures 6-2 to 6-9 inclusive. The model results showed maximum off-site concentrations ofall pollutants to be well below respective guideline limits. The discrete receptors, representing the nearestresidential premises to the proposed Batchelor project, typically experienced concentrations in the rangeof only 0.05 – 2.0 % of the guideline values for most pollutants (MgO, NH3, SO2, NOX, and CO).Predicted TSP and PM10 ground level concentrations, although still well below acceptable limit values,were shown to be closest to their guidelines, reaching a maximum of 8 to 15 % of the 50 µg/m3 limit forPM10 (24-hour average), at discrete receptors 1 and 2 respectively (Table 6-4).
The results for TSP and PM10 are discussed further below.
TSP & PM10
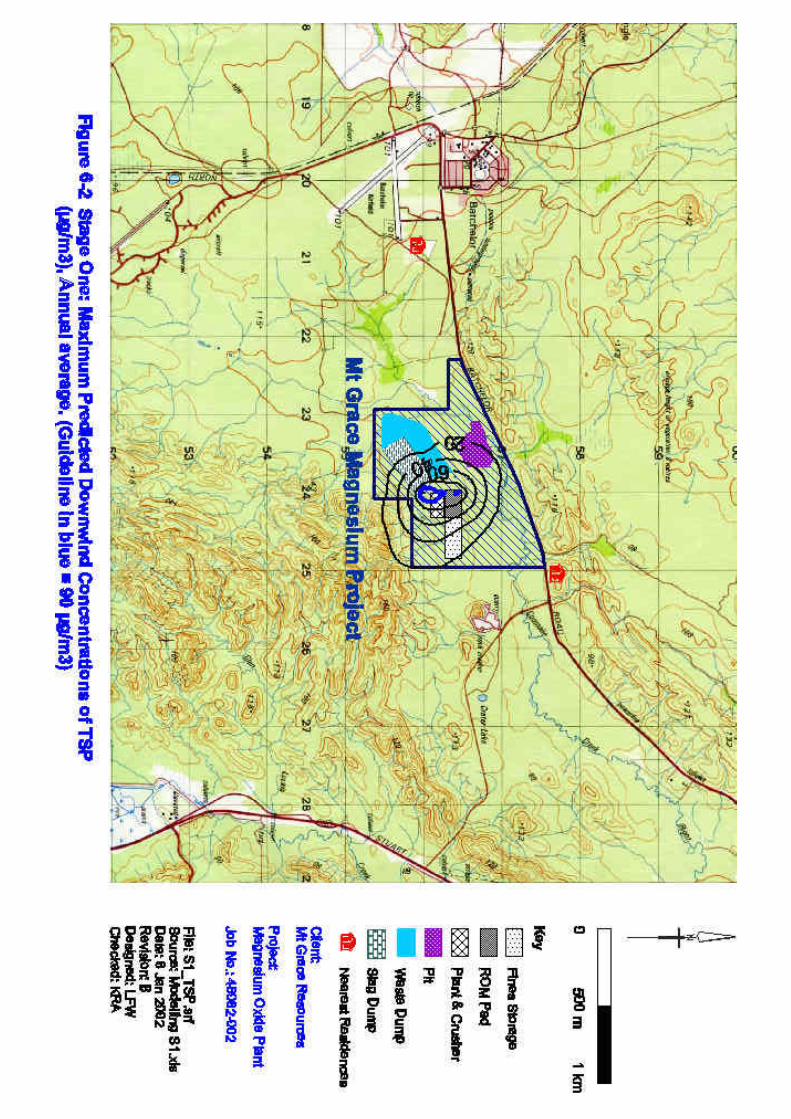
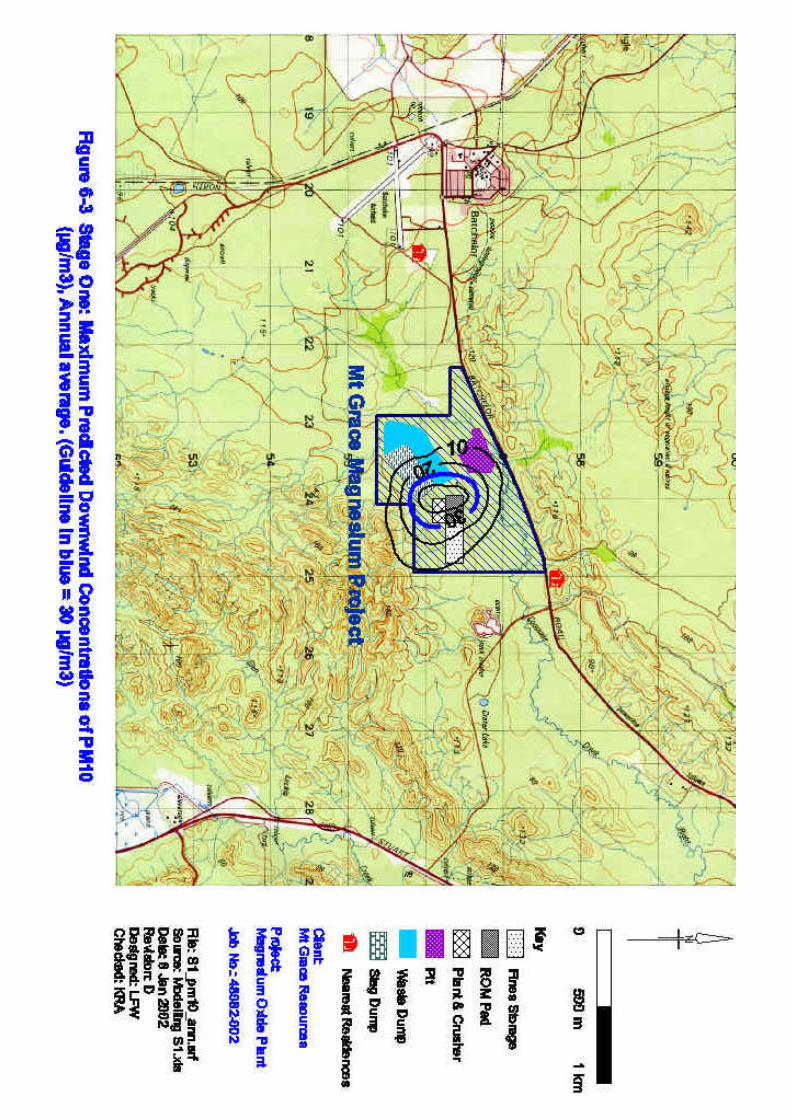
TSP and PM10 emissions from both stack and fugitive sources, excluding blasting, were modelled topredict maximum downwind concentrations of TSP and PM10. The results are shown in Figure 6-2 (PM10,annual average), Figure 6-3 (PM10, 24-hour average) and Figure 6-4 (TSP, annual average).
As shown in Table 6-4, the maximum predicted concentrations of TSP are well below the impactassessment criterion beyond the site boundary and at both neighbouring residences. This is clearly shownin Figure 6-4. The impact assessment criterion for TSP is amenity based and protects against nuisance dueto deposited dust impacts. There should be no adverse impacts to amenity from TSP emissions undernormal operations.
The maximum predicted concentration of PM10 offsite was 15 µg/m3 as a 24-hour average. Thisrepresents 30 % of the impact assessment criterion of 50 µg/m3 as a 24-hour average. Similarly, long-term concentrations of PM10 were predicted to be below impact assessment criteria as shown in Figure 6-2. It should be noted that slightly higher maximum downwind concentrations were observed beyond theplant boundary to the immediate south to south east of the Mt Grace lease, which were not detected at thegrid receptors specified for the model. However, as this area represents rocky terrain which is uninhabitedand in the opposite direction to the nearest residences to the north and west, these slightly elevatedconcentrations do not influence the conclusions in assessing human health- or amenity- based air qualityimpacts from the project.
An analysis of the contribution of each source for predicted PM10 concentrations reveals that the maincontributors are fugitive sources of particulate. This is despite the stack emissions being the second mostsignificant source group in terms of annual emissions. Bearing in mind that PM10 and TSP ground levelconcentrations are likely to be elevated during intermittent blasting events, control measures should focuson fugitive sources.
SECTION 6Impact Assessment
Air Quality Modelling.doc 25-FEB-02
6-7
6.2 Stage Three
6.2.1 Emissions
Emissions from Stage 3 of operation (ie. year 5 and subsequent years) of the proposed BatchelorMagnesium project were estimated using the conservative assumption of a maximum production rate of50,000 tpa Mg, and 1.925 million tonnes of overburden, ore and waste removed from the pit.
The inventory took into account the increased capacity and plant configuration proposed for Stage 3production, whereby three magnesite rotary kilns, two acid scrubbers, two ammonia scrubbers and twocrushers will be in operation.
As per Stage 1, Stage 3 emission sources were grouped according to point (stack) sources or fugitive(area and volume) sources. The resulting estimates are summarised in Table 6-5 (stack sources), Table 6-6 (vehicles) and Table 6-7 (fugitive sources).

SECTION 6Impact Assessment
Air Quality Modelling.doc 25-FEB-02
6-8
TABLE 6-5
STAGE THREE EMISSIONS INVENTORY: STACK SOURCES
Stack Sources Pollutant Height Diameter Velocity Flow Conc Rate Rate
(m) (m) (m/s) (Nm3/s) (mg/Nm3) (g/s) (T/yr)
Magnesite Kiln TSP 63 2 16.7 15.5 20 0.3 9.8
(1& 2) PM10 63 2 16.7 15.5 10 0.2 4.9
MgO 63 2 16.7 15.5 9 0.1 4.2
NOx 63 2 16.7 15.5 282 4.4 138
CO 63 2 16.7 15.5 328 5.1 160
SO2 63 2 16.7 15.5 0.39 6.3E-03 0.2
Acid Scrubber 1 SO2 18 1.0 15.0 9.0 1.8 0.02 0.5
NH3 Scrubber 1 NH3 18 1.0 15.0 9.0 12 0.11 3.5
Lime Storage TSP 18 1.0 8.1 5.3 2 1.E-02 0.3
PM10 18 1.0 8.1 5.3 2 1.E-02 0.3
Crusher 1 TSP 18 1.5 15.0 22 23 0.5 6
PM10 18 1.5 15.0 22 7 0.2 2
Magnesite Kiln 3 TSP 63 3 16.0 33.1 20 0.3 9.8
PM10 63 3 16.0 33.1 10 0.2 4.9
MgO 63 3 16.0 33.1 9 0.1 4.2
NOx 63 3 16.0 33.1 141 4.4 138
CO 63 3 16.0 33.1 176 5.1 160
SO2 63 3 16.0 33.1 0.21 0.01 0.2
Acid Scrubber 2 SO2 18 1.0 15.0 9.0 2 0.02 1
NH3 Scrubber 2 NH3 18 1.0 15.0 9.0 12 0.1 4
Crusher 2 TSP 18 1.5 15.0 22 23 0.5 6
PM10 18 1.5 15.0 22 7 0.2 2

SECTION 6Impact Assessment
Air Quality Modelling.doc 25-FEB-02
6-9
TABLE 6-6
STAGE THREE EMISSIONS INVENTORY: ALL SITE VEHICLES
Pollutant (kg/yr)
PM10 2,204
CO 2,429
NOx 6,590
SO2 327
VOCs 466
TABLE 6-7
STAGE THREE EMISSIONS INVENTORY: FUGITIVE SOURCES
Fugitive Sources Annual EmissionTSP
Annual EmissionPM10
Annual EmissionMgO
(kg/yr) (kg/yr) (kg/yr)
Pit – Wind erosion 3,702 1,851
Plant – Wind erosion 534 267 278
ROM – Wind erosion 7,404 3,702
Fines – Wind erosion 4,720 2,360
Slag – Wind erosion 2,887 1,444 1,501
Waste – Wind erosion 18,972 9,486
Drilling & Blasting 43,671 22,709
Pit – Loading 2,888 1,348
ROM Pad – Unloading 1,200 560
ROM Pad – Loading 1,200 560
Waste – Unloading 1,200 560 624
Fines – Loading 2.4 1.1 2
Fines – Unloading 120 56
Slag – Unloading 551 257
Crusher 1 5,932 1,894
Crusher 2 5,932 1,894
ROM - Stockpile loading 1,600 680
ROM - Stockpile unloading 12,000 5,200
Lime storage - unloading 19 8
SECTION 6Impact Assessment
Air Quality Modelling.doc 25-FEB-02
6-10
Fugitive Sources Annual EmissionTSP
Annual EmissionPM10
Annual EmissionMgO
(kg/yr) (kg/yr) (kg/yr)
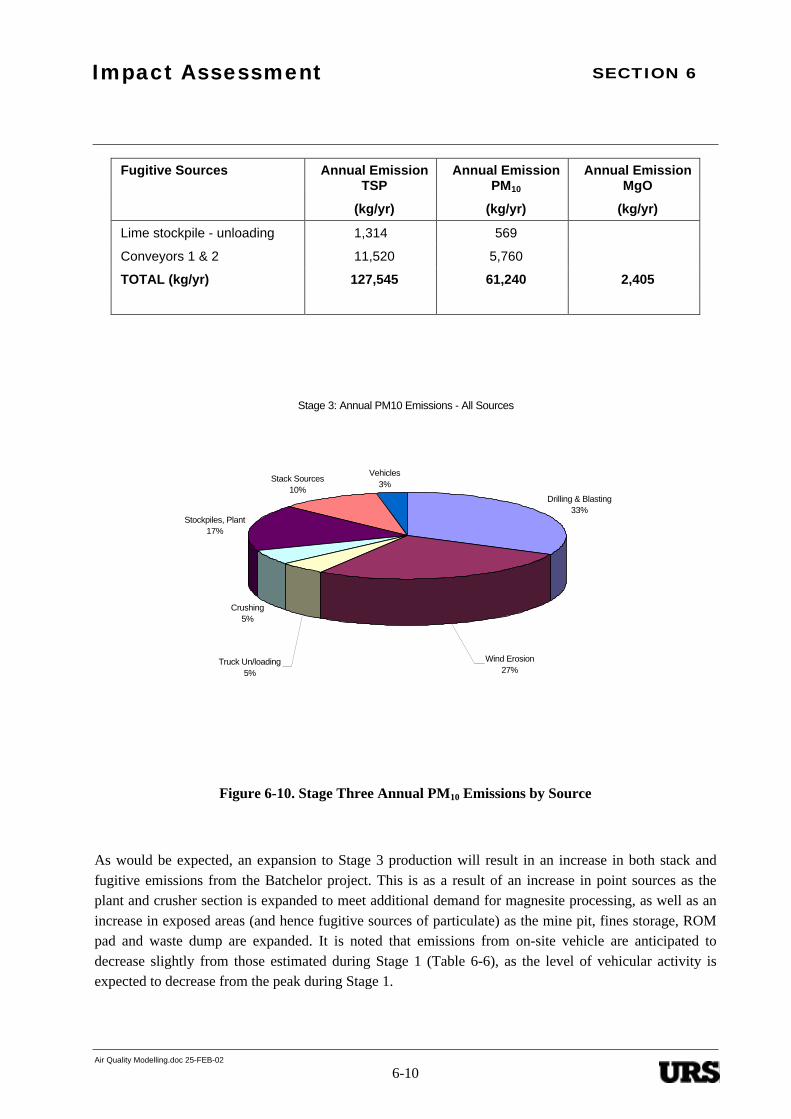
Lime stockpile - unloading 1,314 569
Conveyors 1 & 2 11,520 5,760
TOTAL (kg/yr) 127,545 61,240 2,405
Figure 6-10. Stage Three Annual PM10 Emissions by Source
As would be expected, an expansion to Stage 3 production will result in an increase in both stack andfugitive emissions from the Batchelor project. This is as a result of an increase in point sources as theplant and crusher section is expanded to meet additional demand for magnesite processing, as well as anincrease in exposed areas (and hence fugitive sources of particulate) as the mine pit, fines storage, ROMpad and waste dump are expanded. It is noted that emissions from on-site vehicle are anticipated todecrease slightly from those estimated during Stage 1 (Table 6-6), as the level of vehicular activity isexpected to decrease from the peak during Stage 1.
Stage 3: Annual PM10 Emissions - All Sources
Drilling & Blasting33%
Crushing5%
Stockpiles, Plant17%
Stack Sources10%
Vehicles3%
Truck Un/loading5%
Wind Erosion27%
SECTION 6Impact Assessment
Air Quality Modelling.doc 25-FEB-02
6-11
The trends observed for the Stage 1 inventory are again apparent for Stage 3, in that drilling and blastingactivity is the largest contributor to dust emissions on an annual basis (Figure 6-10). However, thiscontribution decreases (from 56% in Stage 1 to 33% in Stage 3) as wind erosion from increased exposedareas are anticipated to become a more important contributor to particulates from the project (from 12%in Stage 1 to 27% in Stage 3). The dust management practices identified in Section 7 focus on minimisingfugitive dust from such sources.
The potential air quality impacts from expansion to Stage 3 production are discussed in the followingsection.
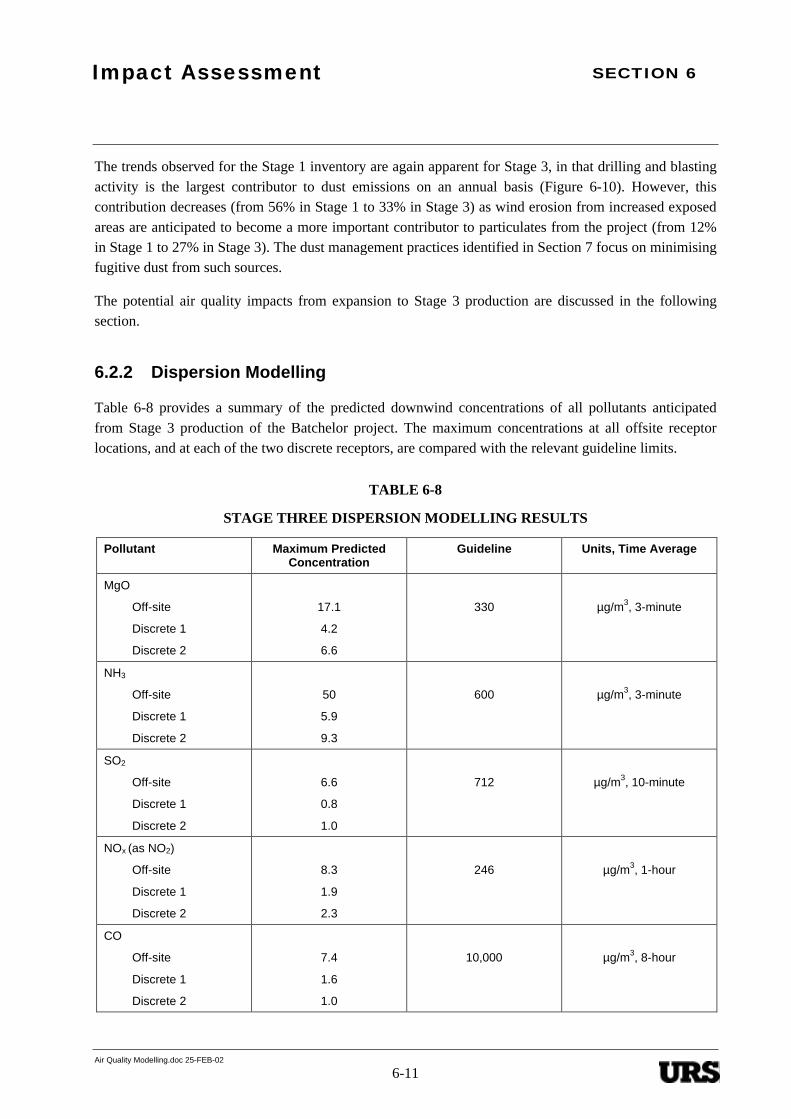
6.2.2 Dispersion Modelling
Table 6-8 provides a summary of the predicted downwind concentrations of all pollutants anticipatedfrom Stage 3 production of the Batchelor project. The maximum concentrations at all offsite receptorlocations, and at each of the two discrete receptors, are compared with the relevant guideline limits.
TABLE 6-8
STAGE THREE DISPERSION MODELLING RESULTS
Pollutant Maximum PredictedConcentration
Guideline Units, Time Average
MgO
Off-site
Discrete 1
Discrete 2
17.1
4.2
6.6
330 µg/m3, 3-minute
NH3
Off-site
Discrete 1
Discrete 2
50
5.9
9.3
600 µg/m3, 3-minute
SO2
Off-site
Discrete 1
Discrete 2
6.6
0.8
1.0
712 µg/m3, 10-minute
NOx (as NO2)
Off-site
Discrete 1
Discrete 2
8.3
1.9
2.3
246 µg/m3, 1-hour
CO
Off-site
Discrete 1
Discrete 2
7.4
1.6
1.0
10,000 µg/m3, 8-hour

SECTION 6Impact Assessment
Air Quality Modelling.doc 25-FEB-02
6-12
Pollutant Maximum PredictedConcentration
Guideline Units, Time Average
TSP
Off-site
Discrete 1
Discrete 2
6.5
1.0
1.2
90 µg/m3, annual
PM10 (24- hours)
Off-site
Discrete 1
Discrete 2
30
6.8
12
50 µg/m3, 24-hours
PM10 (annual)
Off-site
Discrete 1
Discrete 2
3.2
0.5
0.6
30 µg/m3, 24-hours
Figures 6-11 to 6-18 show the resulting contour plots of maximum predicted concentrations anticipatedduring Stage 3 production for MgO, NH3, SO2, NOX (as NO2), CO, TSP and PM10. The model resultsshow maximum off-site concentrations of all pollutants to be higher than those anticipated during Stage 1,yet all are below their respective guideline limits. The addition of the second ammonia scrubber stack isanticipated to elevate downwind NH3 concentrations to a maximum of 50 µg/m3 to the south east of theproject area (Figure 6-15), although this is still well below the 600 µg/m3 assessment criterion (3-minuteaverage).
Of all the pollutants considered in the modelling study, predicted maximum TSP and PM10 ground levelconcentrations are the most significant. Short-term PM10 concentrations, calculated over a 24-houraverage, are predicted to reach maximum ‘worst-case’ concentrations of 30 µg/m3, or 60 % of the 24-hourPM10 impact assessment criterion of 50 µg/m3. Further, the contour plot suggests there is the potential forthe standard to be exceeded just beyond the southern boundary (although this is not reflected at thenearest receptors within the model domain). However, it should be noted that PM10 levels at either of thenearest residences are still predicted to remain low (6.8 µg/m3 and 12 µg/m3 respectively). On an annualbasis, particulate concentrations are expected to be less than 5 µg/m3 this is less than 15 % of the annualcriterion (Table 6-8).
A source contribution analysis reveals that fugitive sources are likely to remain the main contributors topredicted PM10 concentrations during Stage Three. Area-based sources, and in particular wind erosionfrom increased exposed areas across the mine site, are integral in defining the extent to which the projectmay increase background dust levels in the region.
SECTION 7Mitigation Measures
Air Quality Modelling.doc 25-FEB-02
7-1
7 Mitigation Measures
7.1 Environmental Safeguards
The following best practice environmental safeguards which would be implemented during mining andprocessing are listed below.
• An Environmental Monitoring and Management Plan will be prepared which addresses airmonitoring and management issues (refer to Sections 4.10 and 5.2.10 of the main EIS).
• Water sprays will be used (as required) across work zones and unsealed areas to suppress dust. Thewater will be applied by water cart across ground surfaces whenever the surface has the potential togenerate excessive levels of dust. Areas of excavation or works would not exceed the capacity of thewater spray units.
• Ensure exposed surfaces and stockpiles are watered or sprayed where required.
• Schedule blasting or particularly dusty works under favourable meteorological conditions only.Terminate earth moving activity where wind speeds exceed 30 km/hr.
• Stabilise any long-term stockpiles using fast-seeding grass or synthetic cover spray. Minimiseexposed areas through rehabilitation as soon as practicably possible.
• All major access roads would be sealed and vehicle speeds on unsealed areas will be strictlycontrolled to minimise dust.
• Vehicles would not be loaded above the height of the side and tailboards.
• Provide baghouses on all major plant and equipment generating significant point sources of dust(especially the crushing plants). Similarly, baghouses would be provided for drillers used in thepit.The conveyor belts will be covered to minimise dust emissions.
• Fines to be mixed with slag before disposal to minimise windborne emissions.
• Windbreak for limestone stockpile in Stage 3.
SECTION 8Conclusions
Air Quality Modelling.doc 25-FEB-02
8-1
8 Conclusions
Emissions from the proposed Mt Grace Batchelor Magnesium project have been quantified for initialmine production (Stage 1, 12,500 tpa Mg) and at full production capacity (Stage 3, 50,000 tpa Mg). Thepotential impact of these emissions on air quality in the region of Batchelor has been assessed utilising theAUSPLUME Gaussian atmospheric dispersion model.
The air quality assessment showed that maximum ground level concentrations of pollutants areanticipated to be well below ambient air quality guideline limits in most instances. The primary exceptionis in relation to short-term concentrations of particulates, as PM10, where there may be the potential forelevated levels especially during intermittent mining activity such as drilling and blasting. However,maximum ground level concentrations of particulate at either of the nearest residences, or the Batchelortownship, are expected to be well below respective guideline limits
TSP and PM10 are recognised as the primary pollutants of concern for the project, in particular, thosearising from fugitive sources. As such, appropriate dust mitigation measures have been recommended tominimise off-site impacts during the life of the project. Similar dust management practices should also beadopted during construction of the mine and processing plant prior to commissioning.
Appendix AEmission Spreadsheet Calculations
Air Quality Modelling.doc 25-FEB-02
Appendix BMet Data Preparation & Validation
Air Quality Modelling.doc 25-FEB-02
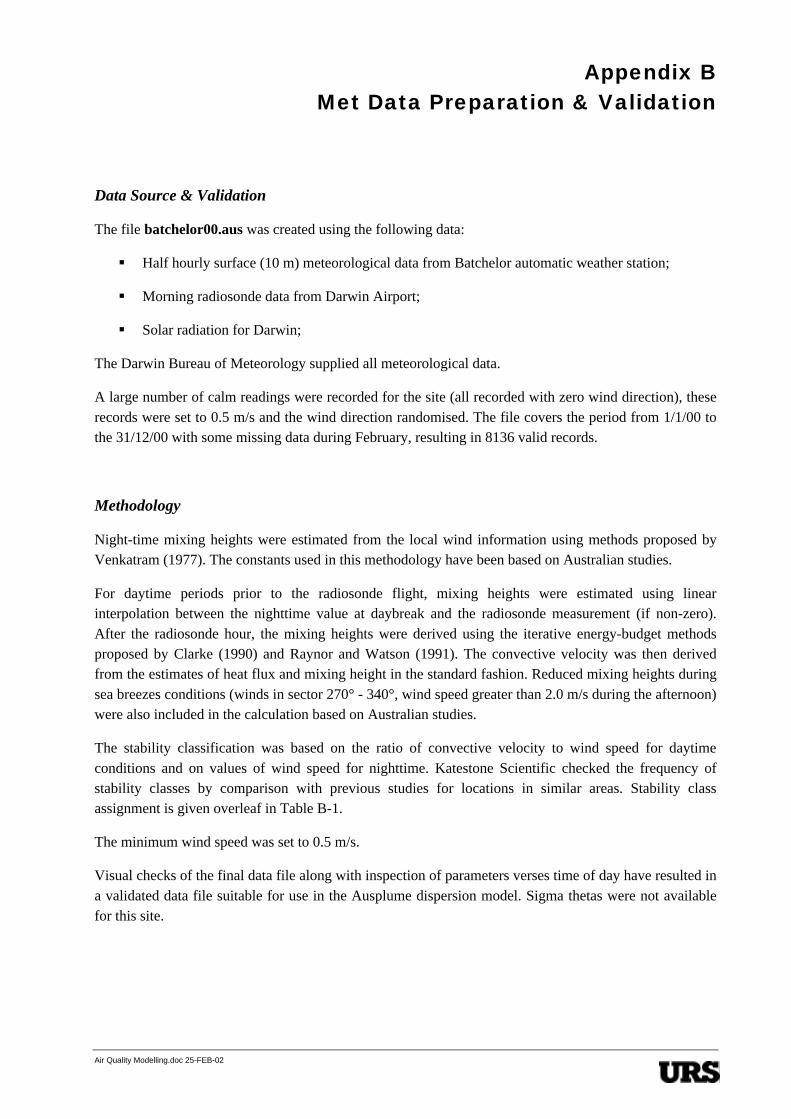
Data Source & Validation
The file batchelor00.aus was created using the following data:
§ Half hourly surface (10 m) meteorological data from Batchelor automatic weather station;
§ Morning radiosonde data from Darwin Airport;
§ Solar radiation for Darwin;
The Darwin Bureau of Meteorology supplied all meteorological data.
A large number of calm readings were recorded for the site (all recorded with zero wind direction), theserecords were set to 0.5 m/s and the wind direction randomised. The file covers the period from 1/1/00 tothe 31/12/00 with some missing data during February, resulting in 8136 valid records.
Methodology
Night-time mixing heights were estimated from the local wind information using methods proposed byVenkatram (1977). The constants used in this methodology have been based on Australian studies.
For daytime periods prior to the radiosonde flight, mixing heights were estimated using linearinterpolation between the nighttime value at daybreak and the radiosonde measurement (if non-zero).After the radiosonde hour, the mixing heights were derived using the iterative energy-budget methodsproposed by Clarke (1990) and Raynor and Watson (1991). The convective velocity was then derivedfrom the estimates of heat flux and mixing height in the standard fashion. Reduced mixing heights duringsea breezes conditions (winds in sector 270° - 340°, wind speed greater than 2.0 m/s during the afternoon)were also included in the calculation based on Australian studies.
The stability classification was based on the ratio of convective velocity to wind speed for daytimeconditions and on values of wind speed for nighttime. Katestone Scientific checked the frequency ofstability classes by comparison with previous studies for locations in similar areas. Stability classassignment is given overleaf in Table B-1.
The minimum wind speed was set to 0.5 m/s.
Visual checks of the final data file along with inspection of parameters verses time of day have resulted ina validated data file suitable for use in the Ausplume dispersion model. Sigma thetas were not availablefor this site.

Appendix BMet Data Preparation & Validation
Air Quality Modelling.doc 25-FEB-02
TABLE B-1
STABILITY CLASSES ASSIGNMENT
Stability Class %
A 20.0
B 19.4
C 10.1
D 14.0
E 14.0
F 22.6

Appendix CWind Roses & Frequency Distribution
Air Quality Modelling.doc 25-FEB-02

Appendix CWind Roses & Frequency Distribution
Air Quality Modelling.doc 25-FEB-02
TABLE C-1
ANNUAL FREQUENCY DISTRIBUTION OF WIND DIRECTION / WIND SPEED (COUNT)
(m/s) 0.5 – 1.8 1.8 – 3.3 3.3 – 5.4 5.4 – 8.5 8.5 – 11.1 > 11.1 TOTAL
N 62 214 67 3 0 0 346
NNE 27 124 27 1 0 0 179
NE 45 115 47 2 0 0 209
ENE 39 158 94 2 0 0 293
E 101 385 309 82 1 0 878
ESE 58 200 269 199 6 0 732
SE 65 295 424 145 2 0 931
SSE 75 228 143 17 0 0 463
S 101 156 21 1 0 0 279
SSW 39 55 5 1 0 0 100
SW 48 50 5 0 0 0 103
WSW 54 80 8 0 0 0 142
W 137 244 80 5 0 0 466
WNW 62 337 226 32 0 0 657
NW 70 239 153 23 0 0 485
NNW 47 152 50 7 0 0 256
TOTAL 1030 3032 1928 520 9 0
Appendix CWind Roses & Frequency Distribution
Air Quality Modelling.doc 25-FEB-02
TABLE C-2
ANNUAL NORMALISED FREQUENCY DISTRIBUTION WIND DIRECTION / WIND SPEED
(m/s) 0.5 – 1.8 1.8 – 3.3 3.3 – 5.4 5.4 – 8.5 8.5 – 11.1 > 11.1 TOTAL
N 0.008 0.026 0.008 0.000 0.000 0.000 0.043
NNE 0.003 0.015 0.003 0.000 0.000 0.000 0.022
NE 0.006 0.014 0.006 0.000 0.000 0.000 0.026
ENE 0.005 0.019 0.012 0.000 0.000 0.000 0.036
E 0.012 0.047 0.038 0.010 0.000 0.000 0.108
ESE 0.007 0.025 0.033 0.024 0.001 0.000 0.090
SE 0.008 0.036 0.052 0.018 0.000 0.000 0.114
SSE 0.009 0.028 0.018 0.002 0.000 0.000 0.057
S 0.012 0.019 0.003 0.000 0.000 0.000 0.034
SSW 0.005 0.007 0.001 0.000 0.000 0.000 0.012
SW 0.006 0.006 0.001 0.000 0.000 0.000 0.013
WSW 0.007 0.010 0.001 0.000 0.000 0.000 0.017
W 0.017 0.030 0.010 0.001 0.000 0.000 0.057
WNW 0.008 0.041 0.028 0.004 0.000 0.000 0.081
NW 0.009 0.029 0.019 0.003 0.000 0.000 0.060
NNW 0.006 0.019 0.006 0.001 0.000 0.000 0.031
TOTAL 0.127 0.373 0.237 0.064 0.001 0.000

Mt Grace Emissions Inventory: Processing Plant, Stage One
Stack ID Pollutant X co-ord Y co-ord Height Diam Velocity Flow H2O Temp Flow Emission Emission Emission Abatement / Commentm m m m m/s Am3/s % °C Nm3/s g/s mg/Nm3 T/yr
Cyclone, Electrostactic PrecipitatorEx Magnesite Kiln, Casting Plant 1, DCF & condenser off-gases
ST01 TSP 724130 8556255 63 1.5 14.8 26.2 16.4 500 7.8 0.16 20 4.9 Proposed Emission Limit ConcentrationST01 PM10 724130 8556255 63 1.5 14.8 26.2 16.4 500 7.8 0.08 10 2.4 Proposed Emission Limit ConcentrationST01 MgO 724130 8556255 63 1.5 14.8 26.2 16.4 500 7.8 0.07 8.7 2.1 Assumed to be 86.6% of particulateST01 NOx as NO2 724130 8556255 63 1.5 14.8 26.2 16.4 500 7.8 2.2 282 69ST01 CO 724130 8556255 63 1.5 14.8 26.2 16.4 500 7.8 2.5 328 80ST01 SO2 724130 8556255 63 1.5 14.8 26.2 16.4 500 7.8 0.003 0.4 0.1
Ex Refining & CastingST02 SO2 724295 8556250 18 1.0 15.0 11.8 10 50 8.96 0.01 0.9 0.3 Scrubber, 99% efficiency
Flow estimated based upon expected emissions
Ex Sludge Processing & Condenser Residue TreatmentST03 NH3 724295 8556240 18 0.5 15.0 2.9 10 50 2.24 0.06 25 1.8 Scrubber, 99% efficiency
Flow estimated based upon expected emissionsBaghouse
ST04 TSP 724110 8556270 18 1 8.1 6.4 10 25 5.3 0.01 2 0.3 Sized on Stage 3ST04 PM10 724110 8556270 18 1 8.1 6.4 10 25 5.3 0.01 2 0.3
Loading of fines, loading crusher, primary & secondary crushing BaghouseST05 TSP 724050 8556280 18 1.5 15.0 26.5 10 25 22 0.3 11 3.0 Diameter (& flow) sized on emissions from calcsST05 PM10 724050 8556280 18 1.5 15.0 26.5 10 25 22 0.1 4 0.9 to give realistic emission concentration in Stage 2
Lime Storage Baghouse
Crusher Baghouse 1
Magnesite Kiln
Acid Scrubber 1
Ammonia Scrubber 1

Dust S1
Mt Grace Emissions Inventory: Fugitive Dust Sources, Stage One
1. TOPSOIL REMOVAL INITIAL ACCESS TO OPEN CUT CommentsX co-ord (m) 723,040Y co-ord (m) 8,556,650X-Area (m2) 72,800
Emission of TSP = 1.64 kg/VKT Mining EET Handbook, pg 39 for silt content 10%Emission of PM10 = 0.53 kg/VKT
Assume scraper moves 10 km/hr 1260 VKTAssume scraper operates 9 hrs/dayAssume scraper works for 2 weeks to clear area
TSP Emission (kg/annum) = 2,066TSP Emission (g/s) = 0.2
PM10 Emission (kg/annum) = 668 Fraction of TSPPM10 Emission (g/s) = 0.1PM10 Emission (mg/s/m2) = 0.001
2. WIND EROSION - EXPOSED AREAS
Emission of TSP = 1.9 * (s/1.5) * 365 *(365-p)/235 * (f/15) * CWhere: s = silt content (%) (Fraction less than 75 µm)
p = days rainfall > 0.25 mmf = % time wind speed > 0.54 m/sC = % control
Emission of PM10 = Assume = 0.5 * TSP emissions
Area = PIT PLANT ROM PAD FINES SLAG DUMP WASTE DUMPX co-ord (m) 723,040 724,000 724,050 724,340 723,870 723,700Y co-ord (m) 8,556,650 8,556,130 8,556,350 8,556,350 8,555,700 8,555,980Z (m) 60 80 80 80 80 80X dist (m) 560 350 100 190 270 270Y dist (m) 130 220 200 200 320 300Angle (deg) from North 0 90 90 90 -30 -30Exposed Area/total area 0.5 0.3 0.5 0.5 0.5 0.5Exposed Area (ha) 3.64 2.3 1.0 1.9 4.3 4.1Silt Content (%) 4 2 4 6 1 4Days rainfall >0.25 mm 12 12 12 12 12 12%Time wind speed >5.4 m/s 5 5 5 5 5 5Control (%) 75 50 0 0 0 0
TSP Emission (kg/annum) = 842 534 925 2,638 999 3,748TSP Emission (g/s) = 0.03 0.02 0.03 0.08 0.03 0.12TSP Emission (g/s/m2) = 7.3E-07 7.3E-07 2.9E-06 4.4E-06 7.3E-07 2.9E-06
PM10 Emission (kg/annum) = 421 267 463 1,319 500 1,874PM10 Emission (g/s) = 0.01 0.01 0.01 0.04 0.02 0.06PM10 Emission (mg/s/m2) = 3.7E-04 3.7E-04 1.5E-03 2.2E-03 3.7E-04 1.5E-03
MgO Emission (kg/annum) = 278 520MgO Emission (g/s) = 0.01 0.02MgO Emission (g/s/m2) = 3.8E-07 3.8E-07
48082-002\AIR\Appendix A - S1.xls\Dust S1 STAGE ONE ONLY 1

Dust S1
3. DRILLING & BLASTING Comments3.1 DRILLINGX co-ord (m) 723,340 Volume Source, middle reference pointY co-ord (m) 8,556,780
Emission of TSP = 0.59 kg dust/hole Mining EET HandbookEmission of PM10 = 0.31 kg dust/hole
Control Efficiency 0.99 % Baghouses on DrillersNumber of drill holes = 60 holes/dayMining days / yr 92 daysHours / day 9 hrs
TSP Emission (kg/annum) = 33TSP Emission (g/s) = 0.1
PM10 Emission (kg/annum) = 17 Fraction of TSPPM10 Emission (mg/s) = 74 Approximate as Volume Source
3.2 BLASTINGX co-ord (m) 723,340Y co-ord (m) 8,556,780
Emission of TSP = 344 * A0.8 * M-1.9 * D-1.8
Where: A = area blastedM = moisture contentD = depth of blast holes
Emission of PM10 = Assume 0.52 * TSP Emisssions
Area Blasted = 3600 m2
Moisture Content = 2.0 %Depth of Blast Holes = 6.0 mNo. Blasts / yr 17
TSP Emission (kg/annum) = 43,638
PM10 Emission (kg/annum) = 22,692 Fraction of TSP
48082-002\AIR\Appendix A - S1.xls\Dust S1 STAGE ONE ONLY 2
Dust S1
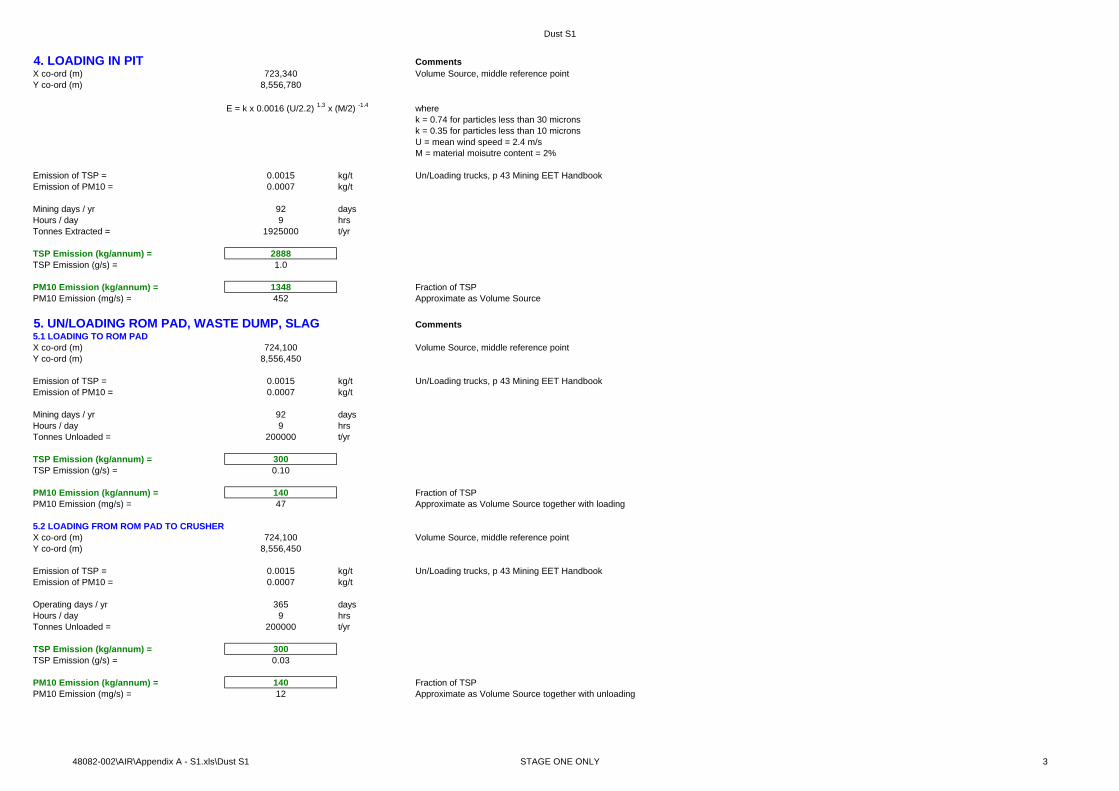
4. LOADING IN PIT CommentsX co-ord (m) 723,340 Volume Source, middle reference pointY co-ord (m) 8,556,780
E = k x 0.0016 (U/2.2) 1.3 x (M/2) -1.4 wherek = 0.74 for particles less than 30 micronsk = 0.35 for particles less than 10 micronsU = mean wind speed = 2.4 m/sM = material moisutre content = 2%
Emission of TSP = 0.0015 kg/t Un/Loading trucks, p 43 Mining EET HandbookEmission of PM10 = 0.0007 kg/t
Mining days / yr 92 daysHours / day 9 hrsTonnes Extracted = 1925000 t/yr
TSP Emission (kg/annum) = 2888TSP Emission (g/s) = 1.0
PM10 Emission (kg/annum) = 1348 Fraction of TSPPM10 Emission (mg/s) = 452 Approximate as Volume Source
5. UN/LOADING ROM PAD, WASTE DUMP, SLAG Comments5.1 LOADING TO ROM PADX co-ord (m) 724,100 Volume Source, middle reference pointY co-ord (m) 8,556,450
Emission of TSP = 0.0015 kg/t Un/Loading trucks, p 43 Mining EET HandbookEmission of PM10 = 0.0007 kg/t
Mining days / yr 92 daysHours / day 9 hrsTonnes Unloaded = 200000 t/yr
TSP Emission (kg/annum) = 300TSP Emission (g/s) = 0.10
PM10 Emission (kg/annum) = 140 Fraction of TSPPM10 Emission (mg/s) = 47 Approximate as Volume Source together with loading
5.2 LOADING FROM ROM PAD TO CRUSHERX co-ord (m) 724,100 Volume Source, middle reference pointY co-ord (m) 8,556,450
Emission of TSP = 0.0015 kg/t Un/Loading trucks, p 43 Mining EET HandbookEmission of PM10 = 0.0007 kg/t
Operating days / yr 365 daysHours / day 9 hrsTonnes Unloaded = 200000 t/yr
TSP Emission (kg/annum) = 300TSP Emission (g/s) = 0.03
PM10 Emission (kg/annum) = 140 Fraction of TSPPM10 Emission (mg/s) = 12 Approximate as Volume Source together with unloading
48082-002\AIR\Appendix A - S1.xls\Dust S1 STAGE ONE ONLY 3
Dust S1
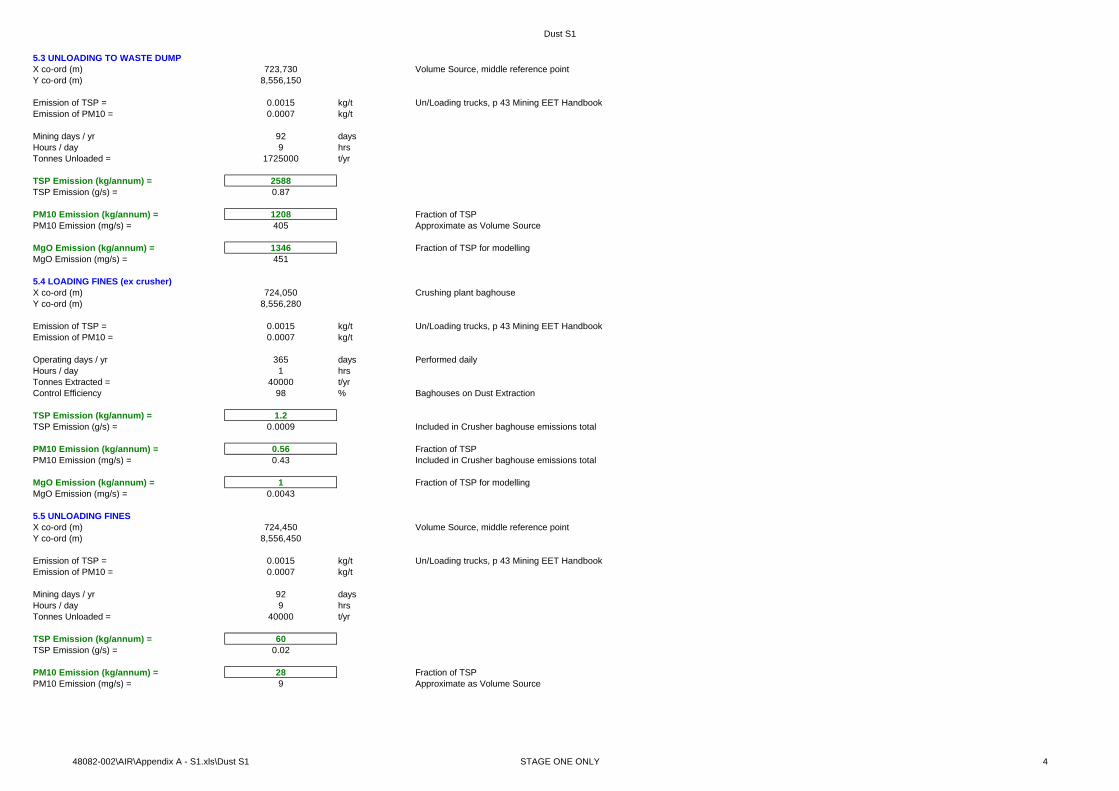
5.3 UNLOADING TO WASTE DUMPX co-ord (m) 723,730 Volume Source, middle reference pointY co-ord (m) 8,556,150
Emission of TSP = 0.0015 kg/t Un/Loading trucks, p 43 Mining EET HandbookEmission of PM10 = 0.0007 kg/t
Mining days / yr 92 daysHours / day 9 hrsTonnes Unloaded = 1725000 t/yr
TSP Emission (kg/annum) = 2588TSP Emission (g/s) = 0.87
PM10 Emission (kg/annum) = 1208 Fraction of TSPPM10 Emission (mg/s) = 405 Approximate as Volume Source
MgO Emission (kg/annum) = 1346 Fraction of TSP for modelling MgO Emission (mg/s) = 451
5.4 LOADING FINES (ex crusher)X co-ord (m) 724,050 Crushing plant baghouseY co-ord (m) 8,556,280
Emission of TSP = 0.0015 kg/t Un/Loading trucks, p 43 Mining EET HandbookEmission of PM10 = 0.0007 kg/t
Operating days / yr 365 days Performed dailyHours / day 1 hrsTonnes Extracted = 40000 t/yrControl Efficiency 98 % Baghouses on Dust Extraction
TSP Emission (kg/annum) = 1.2TSP Emission (g/s) = 0.0009 Included in Crusher baghouse emissions total
PM10 Emission (kg/annum) = 0.56 Fraction of TSPPM10 Emission (mg/s) = 0.43 Included in Crusher baghouse emissions total
MgO Emission (kg/annum) = 1 Fraction of TSP for modelling MgO Emission (mg/s) = 0.0043
5.5 UNLOADING FINESX co-ord (m) 724,450 Volume Source, middle reference pointY co-ord (m) 8,556,450
Emission of TSP = 0.0015 kg/t Un/Loading trucks, p 43 Mining EET HandbookEmission of PM10 = 0.0007 kg/t
Mining days / yr 92 daysHours / day 9 hrsTonnes Unloaded = 40000 t/yr
TSP Emission (kg/annum) = 60TSP Emission (g/s) = 0.02
PM10 Emission (kg/annum) = 28 Fraction of TSPPM10 Emission (mg/s) = 9 Approximate as Volume Source
48082-002\AIR\Appendix A - S1.xls\Dust S1 STAGE ONE ONLY 4

Dust S1
5.6 UNLOADING TO SLAG DUMPAssume loading in enclosed environment with minimum emissionsX co-ord (m) 723,910 Volume Source, middle reference pointY co-ord (m) 8,555,920
Emission of TSP = 0.0015 kg/t Un/Loading trucks, p 43 Mining EET HandbookEmission of PM10 = 0.0007 kg/t
Operating days / yr 365 daysHours / day 9 hrsSlag ex DCF 80638 t/yr Slag mixed with baghouse finesSlag ex Sludge Treatment 4750 t/yrex Kiln Baghouse 2252 t/yr Assume 99% efficiency in baghouseex Lime Kiln Baghouse 0 t/yr Lime Kiln in Stage 3ex Casting 100 t/yrex Crusher 1 297 t/yr Assume 99% efficiency in baghouseex Crusher 2 0 t/yr Crusher 2 in Stage 3Tonnes Unloaded = 88036 t/yr
TSP Emission (kg/annum) = 132TSP Emission (g/s) = 0.01
PM10 Emission (kg/annum) = 62 Fraction of TSPPM10 Emission (mg/s) = 5 Approximate as Volume Source
48082-002\AIR\Appendix A - S1.xls\Dust S1 STAGE ONE ONLY 5
Dust S1
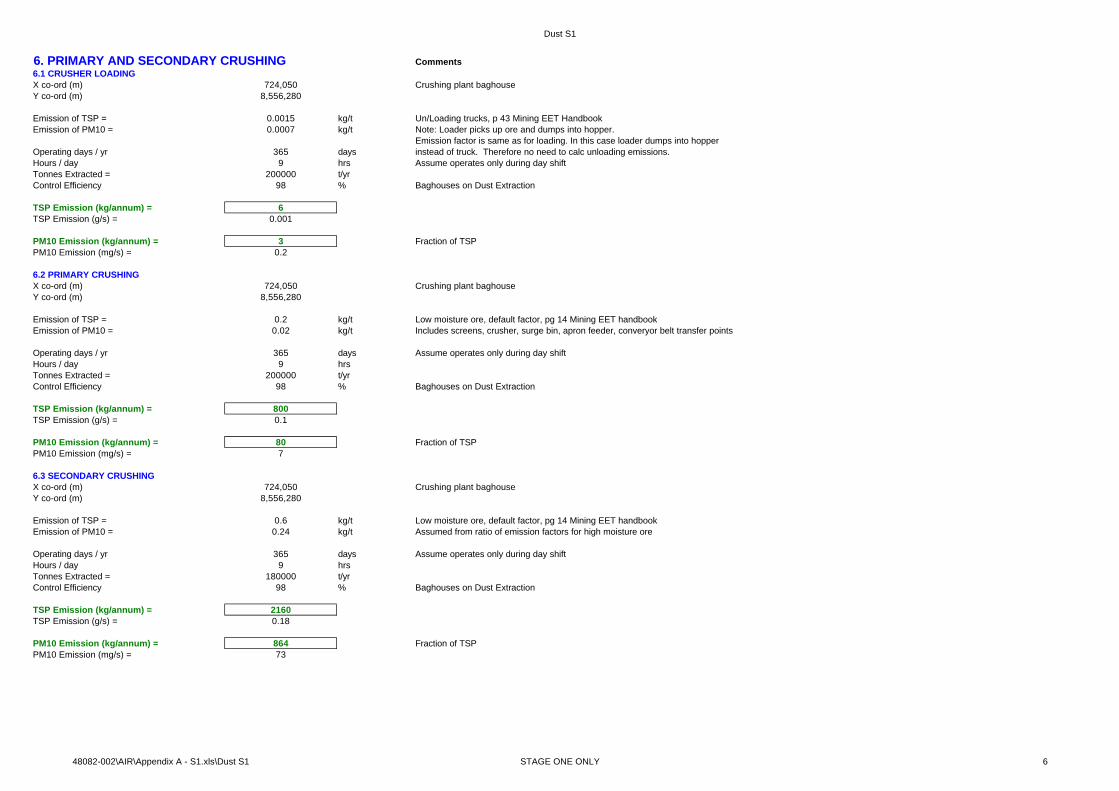
6. PRIMARY AND SECONDARY CRUSHING Comments6.1 CRUSHER LOADINGX co-ord (m) 724,050 Crushing plant baghouseY co-ord (m) 8,556,280
Emission of TSP = 0.0015 kg/t Un/Loading trucks, p 43 Mining EET HandbookEmission of PM10 = 0.0007 kg/t Note: Loader picks up ore and dumps into hopper.
Emission factor is same as for loading. In this case loader dumps into hopper Operating days / yr 365 days instead of truck. Therefore no need to calc unloading emissions.Hours / day 9 hrs Assume operates only during day shiftTonnes Extracted = 200000 t/yrControl Efficiency 98 % Baghouses on Dust Extraction
TSP Emission (kg/annum) = 6TSP Emission (g/s) = 0.001
PM10 Emission (kg/annum) = 3 Fraction of TSPPM10 Emission (mg/s) = 0.2
6.2 PRIMARY CRUSHINGX co-ord (m) 724,050 Crushing plant baghouseY co-ord (m) 8,556,280
Emission of TSP = 0.2 kg/t Low moisture ore, default factor, pg 14 Mining EET handbookEmission of PM10 = 0.02 kg/t Includes screens, crusher, surge bin, apron feeder, converyor belt transfer points
Operating days / yr 365 days Assume operates only during day shiftHours / day 9 hrsTonnes Extracted = 200000 t/yrControl Efficiency 98 % Baghouses on Dust Extraction
TSP Emission (kg/annum) = 800TSP Emission (g/s) = 0.1
PM10 Emission (kg/annum) = 80 Fraction of TSPPM10 Emission (mg/s) = 7
6.3 SECONDARY CRUSHINGX co-ord (m) 724,050 Crushing plant baghouseY co-ord (m) 8,556,280
Emission of TSP = 0.6 kg/t Low moisture ore, default factor, pg 14 Mining EET handbookEmission of PM10 = 0.24 kg/t Assumed from ratio of emission factors for high moisture ore
Operating days / yr 365 days Assume operates only during day shiftHours / day 9 hrsTonnes Extracted = 180000 t/yrControl Efficiency 98 % Baghouses on Dust Extraction
TSP Emission (kg/annum) = 2160TSP Emission (g/s) = 0.18
PM10 Emission (kg/annum) = 864 Fraction of TSPPM10 Emission (mg/s) = 73
48082-002\AIR\Appendix A - S1.xls\Dust S1 STAGE ONE ONLY 6
Dust S1
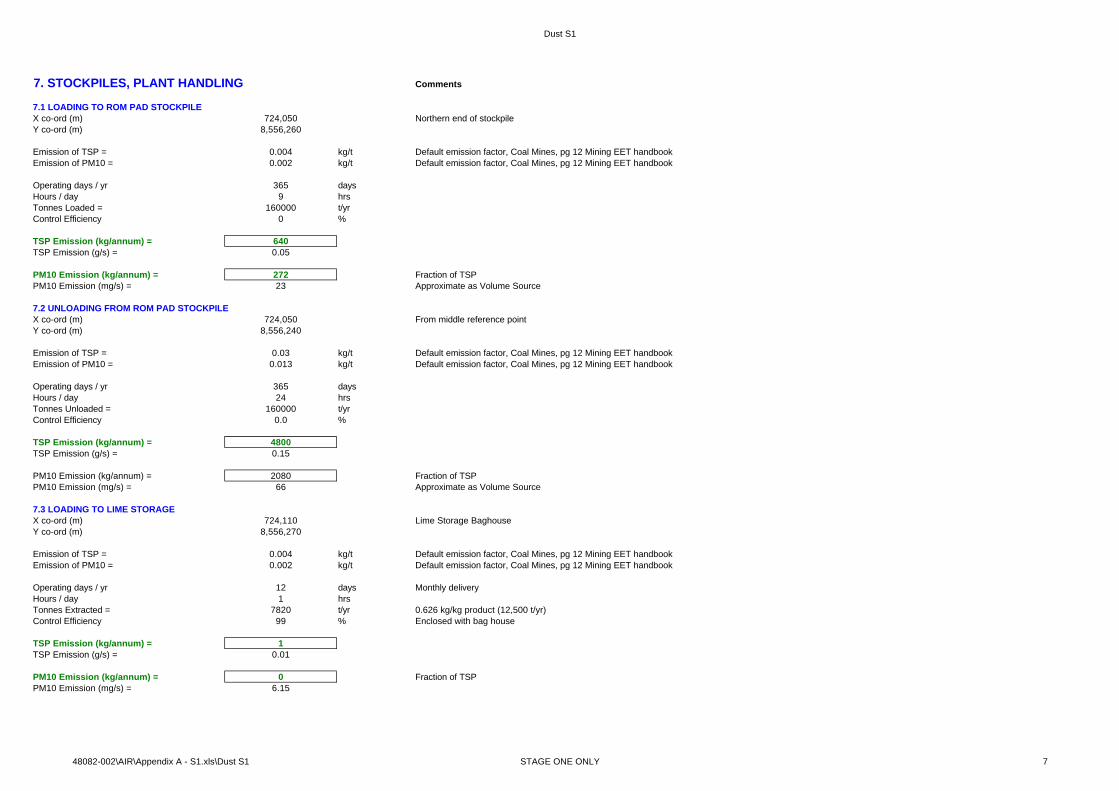
7. STOCKPILES, PLANT HANDLING Comments
7.1 LOADING TO ROM PAD STOCKPILEX co-ord (m) 724,050 Northern end of stockpileY co-ord (m) 8,556,260
Emission of TSP = 0.004 kg/t Default emission factor, Coal Mines, pg 12 Mining EET handbookEmission of PM10 = 0.002 kg/t Default emission factor, Coal Mines, pg 12 Mining EET handbook
Operating days / yr 365 daysHours / day 9 hrsTonnes Loaded = 160000 t/yrControl Efficiency 0 %
TSP Emission (kg/annum) = 640TSP Emission (g/s) = 0.05
PM10 Emission (kg/annum) = 272 Fraction of TSPPM10 Emission (mg/s) = 23 Approximate as Volume Source
7.2 UNLOADING FROM ROM PAD STOCKPILEX co-ord (m) 724,050 From middle reference pointY co-ord (m) 8,556,240
Emission of TSP = 0.03 kg/t Default emission factor, Coal Mines, pg 12 Mining EET handbookEmission of PM10 = 0.013 kg/t Default emission factor, Coal Mines, pg 12 Mining EET handbook
Operating days / yr 365 daysHours / day 24 hrsTonnes Unloaded = 160000 t/yrControl Efficiency 0.0 %
TSP Emission (kg/annum) = 4800TSP Emission (g/s) = 0.15
PM10 Emission (kg/annum) = 2080 Fraction of TSPPM10 Emission (mg/s) = 66 Approximate as Volume Source
7.3 LOADING TO LIME STORAGEX co-ord (m) 724,110 Lime Storage BaghouseY co-ord (m) 8,556,270
Emission of TSP = 0.004 kg/t Default emission factor, Coal Mines, pg 12 Mining EET handbookEmission of PM10 = 0.002 kg/t Default emission factor, Coal Mines, pg 12 Mining EET handbook
Operating days / yr 12 days Monthly deliveryHours / day 1 hrsTonnes Extracted = 7820 t/yr 0.626 kg/kg product (12,500 t/yr)Control Efficiency 99 % Enclosed with bag house
TSP Emission (kg/annum) = 1TSP Emission (g/s) = 0.01
PM10 Emission (kg/annum) = 0 Fraction of TSPPM10 Emission (mg/s) = 6.15
48082-002\AIR\Appendix A - S1.xls\Dust S1 STAGE ONE ONLY 7

Dust S1
7.4 UNLOADING FROM LIME STORAGEX co-ord (m) 724,110 Lime Storage BaghouseY co-ord (m) 8,556,270
Emission of TSP = 0.030 kg/t Default emission factor, Coal Mines, pg 12 Mining EET handbookEmission of PM10 = 0.013 kg/t Default emission factor, Coal Mines, pg 12 Mining EET handbook
Operating days / yr 365 days Daily loading to kilnHours / day 1 hrsTonnes Extracted = 7820 t/yr 0.626 kg/kg product (12,500 t/yr)Control Efficiency 99 % Enclosed with bag house
TSP Emission (kg/annum) = 5TSP Emission (g/s) = 0.004
PM10 Emission (kg/annum) = 2 Fraction of TSPPM10 Emission (mg/s) = 1.55
7.5 CONVEYOR TO ROTARY KILNX co-ord (m) 724,071 SW corner (line source)Y co-ord (m) 8,556,240
Emission of TSP = 0.06 kg/t Low moisture ore, default factor, pg 14 Mining EET handbookEmission of PM10 = 0.03 kg/t Low moisture ore, default factor, pg 14 Mining EET handbook
Assume X = 1.5 mAssume Y = 64 mOperating days / yr 365 daysHours / day 24 hrsTonnes Extracted = 160000 t/yrControl 0.7 % Enclosed
TSP Emission (kg/annum) = 2880TSP Emission (g/s) = 0.09TSP Emission (g/m2/s) = 0.00
PM10 Emission (kg/annum) = 1440 Fraction of TSPPM10 Emission (mg/s) = 46 Approximate as Line SourcePM10 Emission (mg/m2/s) = 0.5
SUMMARY (kg/annum) TSP PM10 MgOInitial Open Cut 2,066 668Wind Erosion Exposed Areas 9,687 4,844 798Drilling & Blasting 43,671 22,709Un/Loading Pit, ROM, Waste Dump, Fines, Slag 6,268 2,925 1,346Primary & Secondary Crushing 2,966 947Stockpiles, Plant Handling 8,325 3,794TOTAL 72,984 35,887 2,143
48082-002\AIR\Appendix A - S1.xls\Dust S1 STAGE ONE ONLY 8
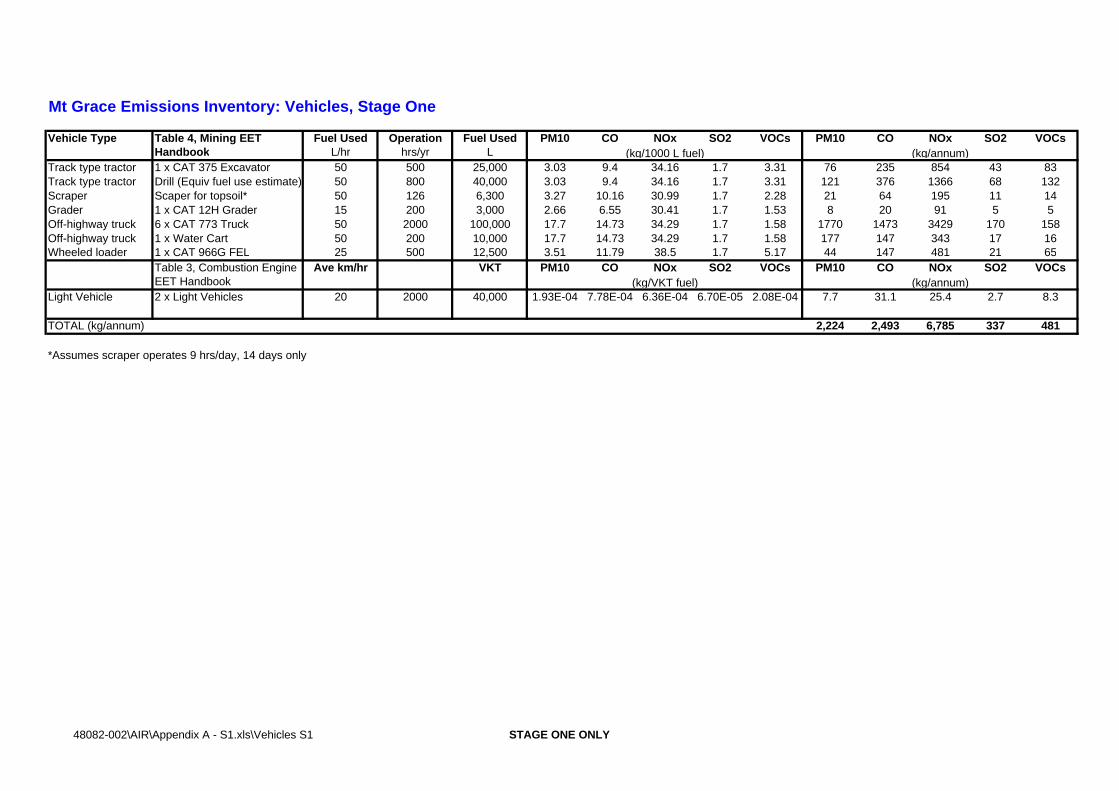
Mt Grace Emissions Inventory: Vehicles, Stage One
Vehicle Type Table 4, Mining EET Fuel Used Operation Fuel Used PM10 CO NOx SO2 VOCs PM10 CO NOx SO2 VOCsHandbook L/hr hrs/yr L
Track type tractor 1 x CAT 375 Excavator 50 500 25,000 3.03 9.4 34.16 1.7 3.31 76 235 854 43 83Track type tractor Drill (Equiv fuel use estimate) 50 800 40,000 3.03 9.4 34.16 1.7 3.31 121 376 1366 68 132Scraper Scaper for topsoil* 50 126 6,300 3.27 10.16 30.99 1.7 2.28 21 64 195 11 14Grader 1 x CAT 12H Grader 15 200 3,000 2.66 6.55 30.41 1.7 1.53 8 20 91 5 5Off-highway truck 6 x CAT 773 Truck 50 2000 100,000 17.7 14.73 34.29 1.7 1.58 1770 1473 3429 170 158Off-highway truck 1 x Water Cart 50 200 10,000 17.7 14.73 34.29 1.7 1.58 177 147 343 17 16Wheeled loader 1 x CAT 966G FEL 25 500 12,500 3.51 11.79 38.5 1.7 5.17 44 147 481 21 65
Table 3, Combustion Engine Ave km/hr VKT PM10 CO NOx SO2 VOCs PM10 CO NOx SO2 VOCsEET Handbook
Light Vehicle 2 x Light Vehicles 20 2000 40,000 1.93E-04 7.78E-04 6.36E-04 6.70E-05 2.08E-04 7.7 31.1 25.4 2.7 8.3
TOTAL (kg/annum) 2,224 2,493 6,785 337 481
*Assumes scraper operates 9 hrs/day, 14 days only
(kg/annum)(kg/1000 L fuel)
(kg/VKT fuel) (kg/annum)
48082-002\AIR\Appendix A - S1.xls\Vehicles S1 STAGE ONE ONLY

Mt Grace Emissions Inventory: Vehicles, Stage Two
Vehicle Type Table 4, Mining EET Fuel Used Operation Fuel Used PM10 CO NOx SO2 VOCs PM10 CO NOx SO2 VOCsHandbook L/hr hrs/yr L
Track type tractor 1 x CAT 375 Excavator 50 500 25,000 3.03 9.4 34.16 1.7 3.31 76 235 854 43 83Track type tractor Drill (Equiv fuel use estimate) 50 800 40,000 3.03 9.4 34.16 1.7 3.31 121 376 1366 68 132Scraper Scaper for topsoil 50 0 0 3.27 10.16 30.99 1.7 2.28 0 0 0 0 0Grader 1 x CAT 12H Grader 15 200 3,000 2.66 6.55 30.41 1.7 1.53 8 20 91 5 5Off-highway truck 3 x CAT 773 Truck 50 1000 50,000 17.7 14.73 34.29 1.7 1.58 885 737 1715 85 79Off-highway truck 1 x Water Cart 50 200 10,000 17.7 14.73 34.29 1.7 1.58 177 147 343 17 16Wheeled loader 1 x CAT 966G FEL 25 400 10,000 3.51 11.79 38.5 1.7 5.17 35 118 385 17 52
Table 3, Combustion Engine Ave km/hr VKT PM10 CO NOx SO2 VOCs PM10 CO NOx SO2 VOCsEET Handbook
Light Vehicle 2 x Light Vehicles 20 2000 40,000 1.93E-04 7.78E-04 6.36E-04 6.70E-05 2.08E-04 7.7 31.1 25.4 2.7 8.3
TOTAL (kg/annum) 1,310 1,663 4,779 237 375
*Non operational after Stage One
(kg/annum)(kg/1000 L fuel)
(kg/VKT fuel) (kg/annum)
48082-002\AIR\Appendix A - S2.xls\Vehicles S2 STAGE TWO

Mt Grace Emissions Inventory: Processing Plant, Stage Three
Stack ID Pollutant X co-ord Y co-ord Height Diam Velocity Flow H2O Temp Flow Emission Emission Emission Abatement / Commentm m m m m/s Am3/s % °C Nm3/s g/s mg/Nm3 T/yr
Cyclone, Electrostactic PrecipitatorEx Magnesite Kilns 1 & 2, Casting, DCF & condenser off-gases
ST01 TSP 724130 8556255 63 2.0 16.7 52.3 16.4 500 15.5 0.3 20.0 9.8 Equivalent to Stage 2 EmissionsST01 PM10 724130 8556255 63 2.0 16.7 52.3 16.4 500 15.5 0.2 10.0 4.9ST01 MgO 724130 8556255 63 2.0 16.7 52.3 16.4 500 15.5 0.1 8.7 4.2ST01 NOx as NO2 724130 8556255 63 2.0 16.7 52.3 16.4 500 15.5 4.4 282 138ST01 CO 724130 8556255 63 2.0 16.7 52.3 16.4 500 15.5 5.1 328 160ST01 SO2 724130 8556255 63 2.0 16.7 52.3 16.4 500 15.5 0.01 0.4 0.2
Ex Refining & CastingST02 SO2 724295 8556250 18 1.0 15.0 11.8 10 50 9.0 0.02 1.8 0.5 Scrubber, 99% efficiency
Equivalent to Stage 2 emissions
Ex Sludge Processing & Condenser Residue Treatment Scrubber, 99% efficiencyST03 NH3 724295 8556240 18 1.0 15.0 11.8 10 50 9.0 0.1 12 3.5 Equivalent to Stage 2 emissions
ST04 TSP 724110 8556270 18 1.0 8.1 6.4 10 25 5.3 0.01 2.0 0.3 Assume 1/2 full, 5 room changes per hour, 50 x 20 x 10 mST04 PM10 724110 8556270 18 1.0 8.1 6.4 10 25 5.3 0.01 2.0 0.3
Baghouse x 2Loading of fines, loading crusher, primary & secondary crushing
ST05 TSP 724050 8556280 18 1.5 15.0 27 10 25 22 0.5 23 5.9 Equivalent to Stage 2 emissionsST05 PM10 724050 8556280 18 1.5 15.0 27 10 25 22 0.2 7 1.9
Cyclone, Electrostactic PrecipitatorEx Magnesite Kiln 3, Casting Plant 2, DCF 2 & Condenser 2 off-gases. Also includes Lime Kiln Emissions Stack diameter increased from Stage 2 to accommodate increased flow
ST06 TSP 724110 8556210 63 3.0 16.0 113.0 17.1 500 33.1 0.7 20 21 Includes emissions from Lime KilnST06 PM10 724110 8556210 63 3.0 16.0 113.0 17.1 500 33.1 0.3 10 10ST06 MgO 724110 8556210 63 3.0 16.0 113.0 17.1 500 33.1 0.3 8.7 9ST06 NOx as NO2 724110 8556210 63 3.0 16.0 113.0 17.1 500 33.1 4.7 141 147ST06 CO 724110 8556210 63 3.0 16.0 113.0 17.1 500 33.1 5.8 176 184ST06 SO2 724110 8556210 63 3.0 16.0 113.0 17.1 500 33.1 0.01 0.2 0.2
Ex Refining & Casting Plant 2 Scrubber, 99% efficiencyST07 SO2 724295 8556175 18 1 15 11.8 10 50 9.0 0.02 1.8 0.5 Assumed equivalent to Acid Scrubber 1
Ex Sludge Processing & Condenser Residue Treatment 2 Scrubber, 99% efficiencyST08 NH3 724295 8556165 18 1 15 11.8 10 50 9.0 0.11 12 3.5 Assumed equivalent to Ammonia Scrubber 1
BaghouseLoading of fines, loading crusher, primary & secondary crushing
ST09 TSP 724050 8556200 18 1.5 15.0 27 10 25 22 1 23 5.9 Equivalent to Crusher 1ST09 PM10 724050 8556200 18 1.5 15.0 27 10 25 22 0 7 1.9
Ammonia Scrubber 2
Crusher Baghouse 2
Magnesite Kilns 1 & 2
Acid Scrubber 1
Ammonia Scrubber 1
Acid Scrubber 2
Magnesite Kiln 3
Lime Storage Baghouse
Crusher Baghouse 1