air quality assessment energy from waste plant …
TRANSCRIPT

Prepared for: Calder Valley Skip Hire Ltd
Date:
July 2017
Project Issue Number: SOL1707CV01 AQMS
AIR QUALITY ASSESSMENT
Energy From Waste Plant
Mearclough Rd, Sowerby Bridge
Sol Environment Ltd | Malvern | Bristol | Edinburgh
[email protected] | t. +44(0)1684 572727 (Switchboard) | +44(0)117 9372811 (Bristol)

This report has been prepared by Sol Environment Ltd (Sol) with all reasonable skill, care and diligence, and taking account of
the Services and the Terms agreed between Sol and the Client. This report is confidential to the client, and Sol accepts no
responsibility whatsoever to third parties to whom this report, or any part thereof, is made known, unless formally agreed by
Sol beforehand. Any such party relies upon the report at their own risk.
Sol Environment Ltd disclaims any responsibility to the Client and others in respect of any matters outside the agreed scope of
the Services.
Calder Valley Skip Hire – Mearclough Rd
Air Quality Impact Assessment
VERSION CONTROL RECORD
Contract/Proposal Number: SOL1701CV01
Authors Name: Sarah Davison
Reviewers Signature:
Issue Description of Status Date Reviewer Initials
1 First Issue 15/07/17 SMB

Calder Valley Skip Hire - Mearclough Road
Air Quality Impact Assessment
P a g e | i
Contents
1. INTRODUCTION 3
2. LEGISLATION AND POLICY 5
2.1 The European Directive on Ambient Air and Cleaner Air for Europe 5
2.2 Air Quality Strategy for England, Scotland, Wales and Northern Ireland 5
2.3 Air Quality (England) Regulations 6
2.4 Local Air Quality Management (LAQM) 6
2.5 Calderdale Borough Council Review and Assessment of Air Quality 7
2.6 Industrial Emissions Directive 7
3. METHODOLOGY 9
3.1 Scope of the Assessment 9
3.2 Dispersion Model Parameters 9
3.3 Sensitive Receptors (Human Health) 11
3.4 Habitat Assessment 14
3.5 Significance Criteria 16
4. BASELINE CONDITIONS 18
4.1 Nitrogen Dioxide 18
4.2 Carbon Monoxide, Particulate Matter, Sulphur Dioxide and Total Organic Carbon) 20
4.3 Hydrogen Chloride 21
4.4 Hydrogen Fluoride 21
4.5 Trace Metals 22
4.6 Dioxins and Furans 23
4.7 Polycyclic Aromatic Hydrocarbons (as benzo[a]pyrene) 23
4.8 Polychlorinated Biphenyls 24
4.9 Summary of Background Concentrations 24

Calder Valley Skip Hire - Mearclough Road
Air Quality Impact Assessment
P a g e | ii
5. ASSESSMENT OF IMPACT, MITIGATION & RESIDUAL EFFECTS 26
5.1 Human Health Impact 26
5.2 Habitat Impact 42
5.3 Mitigation and Residual Effects 44
6. CONCLUSIONS 45
Appendix A – Air Quality Terminology 47
Appendix B – Air Quality Standards and Objectives 49
Appendix C –Dispersion Model Input Parameters 51
Appendix D – Wind Roses by year, Bingley 53
Appendix E – EAL Assessment Levels for the Protection of Vegetation and Ecosystems 56

Calder Valley Skip Hire - Mearclough Road
Air Quality Impact Assessment
P a g e | 1
EXECUTIVE SUMMARY
Sol Environment Ltd was commissioned to undertake an air quality assessment for a proposed energy from
waste (EFW) plant at Mearclough Road, Sowerby Bridge.
The proposed facility would utilise heat generated from the incineration of refuse-derived fuel (RDF) to
produce supersaturated steam. The steam would be directed to turbines, producing electricity for supply
to the national grid. Emissions to air would be via a single 15 m stack.
The Site lies approximately 100m south of the Calderdale Metropolitan Borough Council’s Sowerby Bridge
Air Quality Management Area (AQMA) for NO2. The primary source of NO2 in the area is road traffic.
Detailed dispersion modelling has been undertaken to determine potential impacts arising from the
proposed development. Maximum predicted concentrations are compared with the relevant Air Quality
Objectives (AQO) and Environmental Assessment Levels (EALs) for the protection of health.
The maximum impact of pollutant emissions from the site is considered insignificant on the basis of the
EPUK/ IAQM planning guidance and professional judgement.
The impact of emissions from the proposed development on local habitat sites was also assessed and
found to be negligible compared with relevant critical levels and loads.
Based on the above information, it is considered that air quality does not pose a constraint to the
development of the site as proposed.

Calder Valley Skip Hire - Mearclough Road
Air Quality Impact Assessment
P a g e | 2
(This page is intentionally left blank)

Calder Valley Skip Hire - Mearclough Road
Air Quality Impact Assessment
P a g e | 3
1. INTRODUCTION
Sol Environment Ltd was commissioned to undertake an air quality assessment for a proposed Small Waste
Incineration Process (SWIP) from waste (EFW) plant at Mearclough Road, Sowerby Bridge.
The Site lies approximately 100m south of the Calderdale Metropolitan Borough Council’s Sowerby Bridge
Air Quality Management Area (AQMA) for NO2. The primary source of NO2 in the area is road traffic.
The proposed facility would utilise heat generated from the incineration of refuse-derived fuel (RDF) to
produce steam. The steam would be directed to a heat recovery unit and used for thermal drying of
aggregates, soils and biomass fuels. It is anticipated that the facility would operate 24 hours a day, 5 days
a week. Emissions to air would be via a single 15m stack.
The site location is presented in Figure 1. The area immediately surrounding the site is predominantly
agricultural and light industrial. The nearest residential properties are approximately to 140m to the north
of the site on Walker Lane and Wakefield Road.
Emissions to air from the facility will be governed by the Industrial Emissions Directive (IED)1, which
requires adherence to emission limits for the following pollutants:
• nitrogen oxides (NOx as NO2)
• carbon monoxide
• total dust (as PM10 and PM2.5)
• gaseous and vaporous organic substances, expressed as total organic carbon;
• sulphur dioxide;
• hydrogen chloride;
• hydrogen fluoride;
• twelve trace metals; and
• dioxins and furans.
The assessment has also considered emissions of Polycyclic aromatic hydrocarbons (PAH, as
Benzo[a]pyrene) and polychlorinated biphenyls (PCBs).
This report presents the findings of a dispersion modelling assessment to determine the impact of the
installation on air quality at sensitive human and habitat receptors in the surrounding area.
1 The Industrial Emissions Directive, 2010/75/EU

Calder Valley Skip Hire - Mearclough Road
Air Quality Impact Assessment
P a g e | 4
A glossary of common air quality terminology is provided in Appendix A.
Figure 1: Site Location (Contains Ordnance Survey data © Crown copyright and database right 2016)

Calder Valley Skip Hire - Mearclough Road
Air Quality Impact Assessment
P a g e | 5
2. LEGISLATION AND POLICY
2.1 The European Directive on Ambient Air and Cleaner Air for Europe European Directive 2008/50/EC of the European Parliament and of the Council of 21st May 2008, sets
legally-binding Europe-wide limit values for the protection of public health and sensitive habitats. The
Directive streamlines the European Union’s air quality legislation by replacing four of the five existing Air
Quality Directives within a single, integrated instrument.
The pollutants included are sulphur dioxide (SO2), nitrogen dioxide (NO2), particulate matter of less than
10 micrometres (µm) in aerodynamic diameter (PM10), particulate matter of less than 2.5 m in
aerodynamic diameter lead (PM2.5), lead (Pb), carbon monoxide (CO), benzene (C6H6), ozone (O3),
polycyclic aromatic hydrocarbons (PAHs), cadmium (Cd), arsenic (As), nickel (Ni) and mercury (Hg).
2.2 Air Quality Strategy for England, Scotland, Wales and Northern Ireland The Government's policy on air quality within the UK is set out in the Air Quality Strategy (AQS) for England,
Scotland, Wales and Northern Ireland (AQS) published in July 20072, pursuant to the requirements of Part
IV of the Environment Act 1995. The AQS sets out a framework for reducing hazards to health from air
pollution and ensuring that international commitments are met in the UK. The AQS is designed to be an
evolving process that is monitored and regularly reviewed.
The AQS sets standards and objectives for ten main air pollutants to protect health, vegetation and
ecosystems. These are benzene (C6H6), 1,3-butadiene (C4H6), carbon monoxide (CO), lead (Pb), nitrogen
dioxide (NO2), particulate matter (PM10, PM2.5), sulphur dioxide (SO2), ozone (O3) and polycyclic aromatic
hydrocarbons (PAHs).
The air quality standards are long-term benchmarks for ambient pollutant concentrations which represent
negligible or zero risk to health, based on medical and scientific evidence reviewed by the Expert Panel on
Air Quality Standards (EPAQS) and the World Health Organisation (WHO). These are general concentration
limits, above which sensitive members of the public (e.g. children, the elderly and the unwell) might
experience adverse health effects.
The air quality objectives are medium-term policy based targets set by the Government which take into
account economic efficiency, practicability, technical feasibility and timescale. Some objectives are equal
to the EPAQS recommended standards or WHO guideline limits, whereas others involve a margin of
tolerance, i.e. a limited number of permitted exceedances of the standard over a given period.
2 The Air Quality Strategy for England, Scotland, Wales and Northern Ireland – July 2007

Calder Valley Skip Hire - Mearclough Road
Air Quality Impact Assessment
P a g e | 6
For some pollutants there is both a long-term (annual mean) standard and a short-term standard. In the
case of nitrogen dioxide (NO2), the short-term standard is for a 1-hour averaging period, whereas for fine
particulates (PM10) it is for a 24-hour averaging period. These periods reflect the varying impacts on health
of differing exposures to pollutants (e.g. temporary exposure on the pavement adjacent to a busy road,
compared with the exposure of residential properties adjacent to a road).
2.3 Air Quality (England) Regulations Many of the objectives in the AQS were made statutory in England with the Air Quality (England)
Regulations 20003 and the Air Quality (England) (Amendment) Regulations 20024 (the Regulations) for the
purpose of Local Air Quality Management (LAQM).
The Air Quality Standards Regulations 20105 have adopted into UK law the limit values required by EU
Directive 2008/50/EC6 and came into force on the 10th June 2010. These regulations prescribe the
‘relevant period’ (referred to in Part I2V of the Environment Act 1995) that local authorities must consider
in their review of the future quality of air within their area. The regulations also set out the air quality
objectives to be achieved by the end of the ‘relevant period’.
Ozone is not included in the Regulations as, due to its transboundary nature, mitigation measures must
be implemented at a national level rather than at a local authority level.
The EALs, air quality standards and objectives for the pollutants considered in the assessment are
presented in Appendix B.
2.4 Local Air Quality Management (LAQM) Part IV of the Environment Act 1995 also requires local authorities to periodically review and assess the
quality of air within their administrative area. The Reviews have to consider the present and future air
quality and whether any air quality objectives prescribed in Regulations are being achieved or are likely to
be achieved in the future.
Where any of the prescribed air quality objectives are not likely to be achieved the authority concerned
must designate that part an Air Quality Management Area (AQMA).
For each AQMA, the local authority has a duty to draw up an Air Quality Action Plan (AQAP) setting out
the measures the authority intends to introduce to deliver improvements in local air quality in pursuit of
3 The Air Quality (England) Regulations 2000 - Statutory Instrument 2000 No.928
4 The Air Quality (England) (Amendment) Regulations 2002 - Statutory Instrument 2002 No.3043
5 The Air Quality Standards Regulations 2010 – Statutory Instrument 2010 No. 1001
6 Directive 2008/50/EC of the European Parliament and of the Council of 21st May 2008, on ambient air quality and cleaner air for Europe

Calder Valley Skip Hire - Mearclough Road
Air Quality Impact Assessment
P a g e | 7
the air quality objectives. Local authorities are not statutorily obliged to meet the objectives, but they
must show that they are working towards them.
The Department of Environment, Food and Rural Affairs (DEFRA) has published technical guidance for use
by local authorities in their Review and Assessment work7. This guidance, referred to in this chapter as
TG16, has been used where appropriate in the assessment.
2.5 Calderdale Borough Council Review and Assessment of Air Quality Calderdale Borough Council (CBC) carries out frequent review and assessments of air quality within the
area and produces Updating and Screening Assessments and Progress Reports in accordance with the
requirements of DEFRA.
In 2006 CDC declared an AQMA in Sowerby Bridge due to high concentrations NO2 concentrations from
road traffic in the town centre. Tall buildings on either side of Town Hall Street and Wharf Street form a
street canyon resulting in poor dispersion and a build-up of pollutants at ground-level. The AQMA
commences adjacent to Mill West on West Street and extends along Town Hall Street and Wharf Street
and ending on Upper Bolton Brow close to the junction with Pye Nest Road and on Wakefield Road at the
junction with Canal Road.
2.6 Industrial Emissions Directive The Industrial Emissions Directive (2010/75/EU) came into force on the 6th January 2011, replacing the
seven existing Directives, including the Waste Incineration Directive (WID) and Large Combustion Plant
Directive (LDPD), implemented through the Environmental Permitting Regulations (EPR).
The aim of the new Directive is to simplify the existing legislation and reduce administrative costs, whilst
maintaining a high level of protection for the environment and human health. Permits will still be issued
under EPR; however existing and new sites will be required to comply with the requirements of the IED,
which places greater emphasis on new plant best available technology (BAT).
The IED has been transposed into UK law via the Environmental Permitting (England and Wales)
(Amendment) Regulations 2013 (SI 2013 No, 390), which came into force on 27 February 2013.
The design and operation of all new waste incineration facilities must ensure compliance with emission
limit values (ELVs) set out in the IED; these ELVs are summarised in Table 1.
7 Department for Environment, Food and Rural Affairs (DEFRA), (2016): Part IV The Environment Act 1995 Local Air Quality Management Review
and Assessment Technical Guidance (TG16).

Calder Valley Skip Hire - Mearclough Road
Air Quality Impact Assessment
P a g e | 8
Table 1: IED Emission Limits (mg/Nm3) Pollutant ELV (Referenced to 11% O2)
Daily Average
Total dust 10
Total organic carbon (TOC) 10
Hydrogen chloride (HCl) 10
Hydrogen fluoride (HF) 1
Sulphur dioxide (SO2) 50
Oxides of nitrogen (NOx) 200
Carbon monoxide (CO) 50
Half-Hourly Average
Total dust 30
Total organic carbon (TOC) 20
Hydrogen chloride (HCl) 60
Hydrogen fluoride (HF) 4
Sulphur dioxide (SO2) 200
Oxides of nitrogen (NOx) 400
Carbon monoxide (CO) 100
Average over a sample period between 30-Minutes and 8-Hours
Group 1 metals (a) 0.05
Group 2 metals (b) 0.05
Group 3 metals (c) 0.5
Average over a sample period between 6-Hours and 8-Hours
Dioxins and furans (d) 1 x 10⁻⁷
(a) Cadmium (Cd) and Thallium (Tl)
(b) Mercury (Hg)
(c) Antimony (Sb), arsenic (As), lead (Pb), chromium (Cr), cobalt (Co), copper (Cu), manganese (Mn),
nickel (Ni) and vanadium (V)
(d) I-TEQ

Calder Valley Skip Hire - Mearclough Road
Air Quality Impact Assessment
P a g e | 9
3. METHODOLOGY
3.1 Scope of the Assessment The scope of the assessment has been determined in the following way:
• review of air quality data for the area surrounding the site, including data from the Defra Air
Quality Information Resource (UK-AIR);
• desk study to confirm the location of nearby areas that may be sensitive to changes in local
air quality; and
• review and modelling of emissions data which has been used as an input to the dispersion
modelling assessment.
Predicted ground level concentrations are compared with relevant air quality standards for the protection
of health and critical levels/ loads for the protection of sensitive ecosystems and vegetation.
3.2 Dispersion Model Parameters Detailed air quality modelling using the AERMOD 7 dispersion model has been undertaken to predict the
impacts associated with emissions from the proposed facility. As a worst-case, pollutant emissions from
the stack are assumed to be at IED limits.
The anticipated throughput of the facility is approximately 1 tonne per hour, although it is likely that the
facility will frequently operate at lower loads. Emissions to air would be via a 15m stack.
IED emission limits have been assumed for the purposes of the modelling assessment; however actual
emissions from the Site are anticipated to be around 50% of the limit values. Stack emission parameters
(flow rate, temperature etc.) have been provided by the technology supplier.
For the Group III trace metal predictions, it has been assumed in accordance with the Environment
Agency’s (EA) metals guidance8, that each of the metals is emitted at the maximum IED ELV (0.5 mg/Nm3)
as a worst case. The same approach has also been adopted for the Group I and II metals.
Where the screening criteria set out in the guidance are not met, an emission concentration equal to half
of the ELV for Group I metals and 1/9th of the ELV for Group III metals has been assumed. If the screening
criteria are still not met, typical emission concentrations for energy from waste plants have been used, as
specified in the guidance.
8 Guidance to Applicants on Impact Assessment for Group 3 Metals Stack Releases – V.3 September 2012

Calder Valley Skip Hire - Mearclough Road
Air Quality Impact Assessment
P a g e | 10
It is anticipated that the process will not result in significant emissions of polychlorinated biphenyls (PCBs)
or polycyclic aromatic hydrocarbons (PAHs), however emission limits of 0.005 mg/Nm3 and 0.01 mg/Nm3
respectively, have been assumed based on measurements at European waste incineration facilities as
specified in the IPPC Reference Document on BAT for Waste Incineration9.
A summary of the input parameters used in the assessment are identified in Appendix C. It is anticipated
that the facility would operate for 3,976 hours per year and therefore the annual mean mass emission
rates have been scaled down accordingly.
3.2.1 Meteorological Data
Dispersion modelling has been undertaken using five years (2011-2015) of hourly sequential
meteorological data in order to take account of inter-annual variability and reduce the effect of
any atypical conditions. Data from a meteorological station at Bingley (approximately 15km
northeast of the proposed development) has been used for the assessment, which is the most
representative data currently available for the area.
Wind roses for each year of meteorological data are presented in Appendix D.
3.2.2 Building Downwash / Entrainment
The presence of buildings close to emission sources can significantly affect the dispersion of
pollutants by leading to a phenomenon called downwash. This occurs when a building distorts
the wind flow, creating zones of increased turbulence. Increased turbulence causes the plume to
come to ground earlier than otherwise would be the case and result in higher ground level
concentrations closer to the stack.
Downwash effects are only significant where building heights are greater than 30 to 40% of the
emission release height. The downwash structures also need to be sufficiently close for their
influence to be significant.
The main process building on site, which is 8m height to the ridge, has been included in the
dispersion model to account for potential downwash effects.
3.2.3 Topography
The presence of elevated terrain can significantly affect the dispersion of pollutants by increasing
turbulence and reducing the distance between the plume centre line and the ground level.
9 European Commission, Integrated Pollution Prevention and Control Reference Document on the Best Available Techniques for Waste
Incineration, August 2006.

Calder Valley Skip Hire - Mearclough Road
Air Quality Impact Assessment
P a g e | 11
A detailed topological data set has been included in the model to ensure that the impact of terrain
features on the dispersion of emissions from the facility is taken into account.
3.2.4 Nitric Oxide to NO2 Conversion
Oxides of nitrogen (NOx) emitted to atmosphere as a result of combustion will consist largely of
nitric oxide (NO), a relatively innocuous substance. Once released into the atmosphere, NO is
oxidised to NO2. The proportion of NO converted to NO2 depends on a number of factors including
wind speed, distance from the source, solar irradiation and the availability of oxidants, such as
ozone (O3).
A conversion ratio of 70% NOx:NO2 has been assumed for comparison of predicted concentrations
with the long-term objectives for NO2. A conversion ratio of 35% has been utilised for the
assessment of short-term impacts, as recommended by Environment Agency guidance.
3.3 Sensitive Receptors (Human Health) TG16 describes in detail typical locations where consideration should be given to pollutants defined in the
Regulations. Generally, the guidance suggests that all locations 'where members of the public are regularly
present' should be considered. At such locations, members of the public will be exposed to pollution over
the time that they are present, and the most suitable averaging period of the pollutant needs to be used
for assessment purposes.
For instance, on a footpath, where exposure will be transient (for the duration of passage along that path)
comparison with short-term standard (i.e. 15-minute mean or 1-hour mean) may be relevant. In a school,
or adjacent to a private dwelling, however; where exposure may be for longer periods, comparison with
long-term (such as 24-hour mean or annual mean) standards may be most appropriate. In general terms,
concentrations associated with long-term standards are lower than short-term standards owing to the
chronic health effects associated with exposure to low level pollution for longer periods of time.
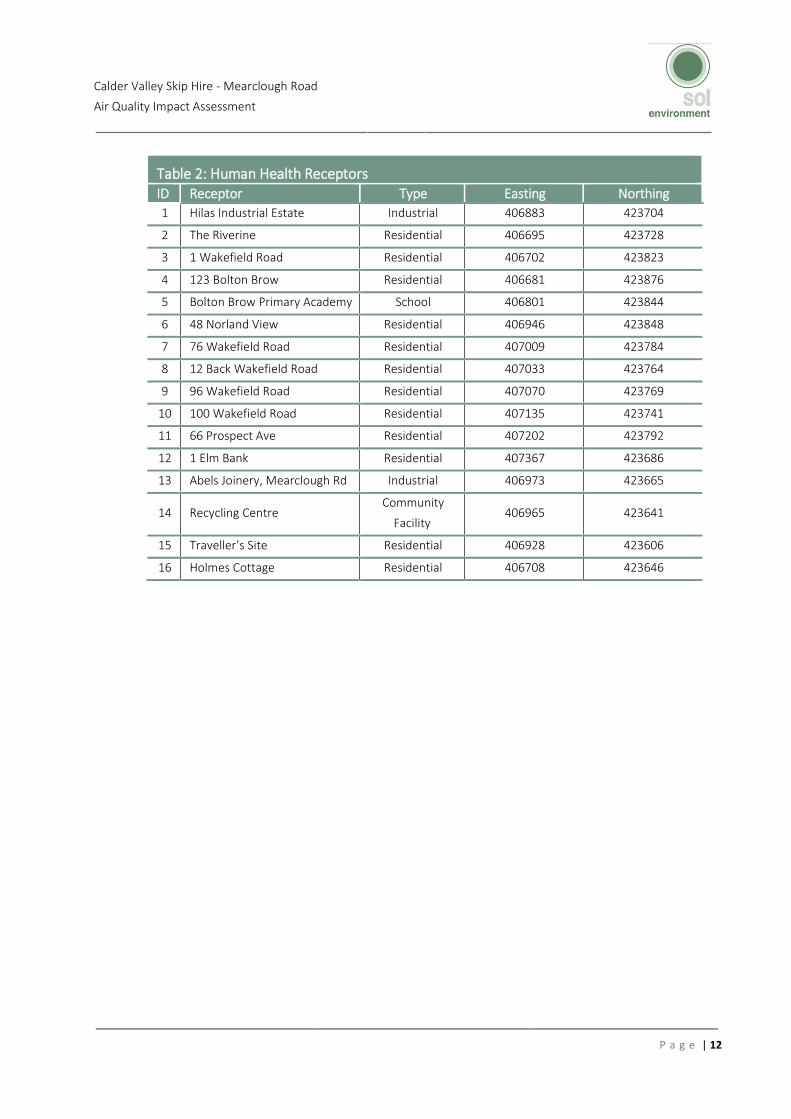
The location of the discrete sensitive receptors selected for the assessment is presented in Table 2 and
Figure 2.
Calder Valley Skip Hire - Mearclough Road
Air Quality Impact Assessment
P a g e | 12
Table 2: Human Health Receptors
ID Receptor Type Easting Northing
1 Hilas Industrial Estate Industrial 406883 423704
2 The Riverine Residential 406695 423728
3 1 Wakefield Road Residential 406702 423823
4 123 Bolton Brow Residential 406681 423876
5 Bolton Brow Primary Academy School 406801 423844
6 48 Norland View Residential 406946 423848
7 76 Wakefield Road Residential 407009 423784
8 12 Back Wakefield Road Residential 407033 423764
9 96 Wakefield Road Residential 407070 423769
10 100 Wakefield Road Residential 407135 423741
11 66 Prospect Ave Residential 407202 423792
12 1 Elm Bank Residential 407367 423686
13 Abels Joinery, Mearclough Rd Industrial 406973 423665
14 Recycling Centre Community
Facility 406965 423641
15 Traveller’s Site Residential 406928 423606
16 Holmes Cottage Residential 406708 423646

Calder Valley Skip Hire - Mearclough Road
Air Quality Impact Assessment
P a g e | 13
Figure 2: Sensitive Human Health Receptor Locations (Contains OS data © 2016)
Pollutant concentrations have been predicted at both discrete receptor locations and over a 1 km
by 1 km Cartesian grid of 25 m resolution and a 3 km by 4 km Cartesian grid of 50 m resolution.
Predicted ground level concentrations are compared with relevant air quality standards and
guidelines for the protection of health.

Calder Valley Skip Hire - Mearclough Road
Air Quality Impact Assessment
P a g e | 14
3.4 Habitat Assessment The Environment Agency’s risk assessment guidance10 states that the impact of emissions to air on
vegetation and ecosystems should be assessed for the following habitat sites within 10 km of the source:
• Special Areas of Conservation (SACs) and candidate SACs (cSACs) designated under the EC
Habitats Directive11;
• Special Protection Areas (SPAs) and potential SPAs designated under the EC Birds Directive12;
and
• Ramsar Sites designated under the Convention on Wetlands of International Importance13.
Within 2km of the source:
• Sites of Special Scientific Interest (SSSI) established by the 1981 Wildlife and Countryside Act;
• National Nature Reserves (NNR);
• Local Nature Reserves (LNR);
• Local Wildlife Sites (LWS); and
• Ancient Woodland.
Habitat receptor designations and locations relevant to the assessment are presented in Table 3.
10 https://www.gov.uk/guidance/air-emissions-risk-assessment-for-your-environmental-permit. 11 Council Directive 92/43/EEC on the conservation of natural habitats and of wild fauna and flora. 12 Council Directive 79/409/EEC on the conservation of wild birds. 13 Ramsar (1971), The Convention of Wetlands of International Importance especially as Waterfowl Habitat.

Calder Valley Skip Hire - Mearclough Road
Air Quality Impact Assessment
P a g e | 15
Table 3: Sensitive Habitat Receptors
Receptor Primary Habitat Approx. Location (Relative to Stack)
South Pennine Moors SAC/ SPA Blanket Bog 5km NW / 7km W
Milner Royd LNR
Broadleaved
woodland and
neutral grassland
<20 m E
Norland Moor LNR
U’ Calluna-
dominated wet
heath (upland
moorland)
1.2 km S
Scarr and Long Woods LNR Broadleaved
woodland 1.2 km E
Rochdale Canal LWS Open Water 100m N
With the exception of Milner Royd, the habitat sites have been represented in the model by discrete
receptors at the boundary of the designated area closest to the proposed development. The maximum
predicted concentration at Milner Royd has been predicted using a Cartesian receptor grid of 25m over
the full extent of the designated area.
The modelled ground level pollutant concentrations are used to predict deposition rates, using typical
deposition velocities. A summary of typical NO2, SO2 and HCl dry deposition velocities is presented in Table
4.
Table 4: Dry Deposition Velocities (m/s) Pollutant Grassland Woodland
Nitrogen Dioxide (NO2) 0.0015 0.0030
Sulphur Dioxide (SO2) 0.012 0.024
Hydrogen Chloride (HCl) 0.025 0.06
The predicted nitrogen deposition rates assume a 100% NOx: NO2 conversion. This represents a worst-case
for the assessment since nitric oxide (NO) has a lower deposition velocity than NO2 and consequently
results in lower deposition rates.
A wet deposition rate for HCl has been calculated using a dry to wet deposition ratio, as follows:
HCl wet deposition rate = HCl dry deposition rate x wet-to-dry deposition ratio

Calder Valley Skip Hire - Mearclough Road
Air Quality Impact Assessment
P a g e | 16
Within a few kilometres of the source, the wet deposition rate is comparable to the dry deposition rate
and with increasing distance, the wet deposition fraction becomes a smaller fraction of the total HCl
deposition. As a worst-case, the wet-to-dry deposition ratio is assumed to be 1 at all the identified habitat
sites.
Predicted ground level concentrations and acidification/ deposition rates are compared with relevant air
quality standards, critical levels and critical loads for the protection of sensitive ecosystems and vegetation
(see Appendix E).
3.5 Significance Criteria
3.5.1 Human Health Impacts
The significance of the predicted long-term impact at human health receptors is determined in
accordance with the EPUK/ IAQM planning guidance14 in combination with the professional
judgement of the author. The impact at individual receptors depends on the predicted change in
the long-term pollutant concentration compared with the relevant air quality standard (AQS) and
existing air quality as illustrated in Table 5.
Table 5: Significance Descriptors for Individual Receptors (Long-Term Impacts) Long-Term Average Conc. at Receptor in Assessment Year
% Change in Concentration Relative to Air Quality Standard (a)
1 2 - 5 5 - 10 >10
75% or less of AQS Negligible Negligible Slight adverse Moderate adverse
76-94% of AQS Negligible Slight adverse Moderate adverse Moderate adverse
95-102% of AQS Slight adverse Moderate adverse Moderate adverse Substantial adverse
103-109% of AQS Moderate adverse Moderate adverse Substantial adverse Substantial adverse
110% or more of AQS Moderate adverse Substantial adverse Substantial adverse Substantial adverse
(a) A change in concentration of less than 0.5% of the AQS is considered insignificant, however changes between 0.5% and 1% are rounded up to 1%.
Short-term impacts of less than 10% of the AQAL are described as negligible, regardless of existing
air quality. Where the short-term process concentrations are 10-20% of the AQAL the severity of
the impact is described as slight adverse. Impacts of 20-50% and over 50% are described as
moderate and substantial adverse, respectively.
14 EPUK/ IAQM (2015), Land-Use Planning & Development Control: Planning for Air Quality, May 2015 (v1.1)
Calder Valley Skip Hire - Mearclough Road
Air Quality Impact Assessment
P a g e | 17
3.5.2 Ecological Impacts
The Environment Agency has developed criteria for assessing at SPAs, SACs, Ramsar sites and
SSSIs, compared with the relevant EAL and background air quality. The criteria are designed to
ensure that there is a substantial safety margin to protect the environment.
Stage 1
A process contribution (PC) is considered insignificant if:
• The long term PC < 1% of the long-term EAL
• The short term PC < 10% of the short-term EAL
Stage 2
If the Stage 1 screening criteria are not met, the PC should be considered in combination with
relevant ambient background pollutant concentrations. The air quality standards are likely to be
met if:
• The long term PC + background concentration < 70% of the EAL
• The short term PC < 20% of the (EAL – short term background concentration)
For local nature sites (SINCs, SLINC’s, NNRs, LNRs and ancient woodland, a process contribution
(PC) is considered insignificant if:
• The long term PC < 100% of the long-term EAL
• The short term PC < 100% of the short-term EAL

Calder Valley Skip Hire - Mearclough Road
Air Quality Impact Assessment
P a g e | 18
4. BASELINE CONDITIONS
4.1 Nitrogen Dioxide Automatic monitoring of roadside NO2 concentrations is undertaken by Calderdale Council on Wharf
Street within the Sowerby Bridge AQMA. Between 2012 and 2014 the annual mean NO2 concentration
was between 42 and 43 μg/m3, in excess of the annual mean air quality objective of 40 μg/m3. However,
the site is 2m from the kerbside and does not represent relevant long-term exposure as the nearest
residential properties are around 10m from the roadside. There were no recorded exceedences of the 1-
hour mean air quality objective of 200 μg/m3 between 2012 and 2014. Prior to 2012, annual mean NO2
concentrations measured within the AQMA were somewhat higher.
Calderdale Council also monitor NO2 via an extensive network of passive diffusion tubes. Currently there
are seven tubes located at roadside locations within the Sowerby Bridge AQMA. A summary of historical
annual mean NO2 concentrations measured by diffusion tube is presented in Table 6. The location of the
tubes is presented in Figure 2. Tubes BS1, BS2 and BS3 (shown as BS in Figure 8.3) are co-located with the
Sowerby Bridge automatic air quality monitoring station (AQMS).
Table 6: Annual Mean NO2 Concentrations Measured by Diffusion Tube (µg/m3)
Site ID Location 2010 2011 2012 2013 2014
SB1 Wharf Street 57 61 53 54 51
SB3 Town Hall Street 51 51 47 47 45
SB12 47 Bolton Brow 45 49 45 n/a n/a
SB13 163 Upper Bolton Brow 43 45 40 40 38
SB15 Bolton Brow 43 51 43 42 41
SB16 2 Calder House 45 46 41 41 41
SB18 Wakefield Road 40 45 35 34 35
BS1 Co-located with AQMS on Wharf Street
55 55 48 47 45
BS2 56 56 49 48 45
BS3 56 56 50 50 46

Calder Valley Skip Hire - Mearclough Road
Air Quality Impact Assessment
P a g e | 19
Figure 2: Monitoring Locations (Contains OS data © 2016)
The data show that annual mean NO2 concentrations continue to exceed the air quality objective at several
locations within the AQMA.
Calderdale Council does not currently monitor background NO2 concentrations in Sowerby Bridge,
therefore the Defra background maps15 have been used to determine the likely baseline at receptors that
are a significant distance from Rochdale Road. These 1 km grid resolution maps are derived from a complex
modelling exercise that takes into account emissions inventories and measurements of ambient air
pollution from both automated and non-automated sites. The latest background maps for NO2 were
issued in June 2016 and are based on 2013 monitoring data.
A maximum annual mean background NO2 concentration for the area of 18.0 µg/m3 has been derived from
a contour plot of the 2016 mapped data, however the monitoring data shows existing NO2 concentrations
at receptors in close proximity to Wakefield Road and Bolton Brow will be considerably higher than this
level due to traffic-related emissions. In order to provide a realistic assessment of potential impacts at
15 http://laqm.defra.gov.uk/review-and-assessment/tools/background-maps.html

Calder Valley Skip Hire - Mearclough Road
Air Quality Impact Assessment
P a g e | 20
roadside locations, the diffusion tube data has been used to determine likely baseline concentrations at
each receptor for the purposes of the assessment (see Table 7). The contribution of traffic-related
emissions to ground-level NO2 concentrations declines rapidly from the roadside to negligible levels by
200m. However, as a worst-case a roadside baseline NO2 concentration has been assumed for all receptor
locations, regardless of their distance from a main road.
The existing baseline is assumed to exceed the annual mean air quality objective at receptor locations in
close proximity to the junction of Wakefield Road with Bolton Brow.
Table 7: Annual Mean NO2 Baseline Concentrations at Receptor Locations (µg/m3)
Receptor Location Annual Mean NO2
Concentration Source
1 Hilas Industrial Estate 34.7 SB18 2012-2014 average
2 The Riverine 34.7 SB18 2012-2014 average
3 1 Wakefield Road 41.0 SB16 2012-2014 average
4 123 Bolton Brow 42.0 SB15 2012-2014 average
5 Bolton Brow Primary
Academy 41.0 SB16 2012-2014 average
6 48 Norland View 34.7 SB18 2012-2014 average
7 76 Wakefield Road 34.7 SB18 2012-2014 average
8 12 Back Wakefield Road 34.7 SB18 2012-2014 average
9 96 Wakefield Road 34.7 SB18 2012-2014 average
10 100 Wakefield Road 34.7 SB18 2012-2014 average
11 66 Prospect Ave 34.7 SB18 2012-2014 average
12 1 Elm Bank 34.7 SB18 2012-2014 average
13 Abels Joinery, Mearclough Rd 34.7 SB18 2012-2014 average
14 Recycling Centre 34.7 SB18 2012-2014 average
15 Traveller’s Site 34.7 SB18 2012-2014 average
16 Holmes Cottage 34.7 SB18 2012-2014 average
4.2 Carbon Monoxide, Particulate Matter, Sulphur Dioxide and Total Organic Carbon (as Benzene)
Monitoring of CO, PM10, PM2.5, SO2 and benzene concentrations is not undertaken by Calderdale Council
in the vicinity of the proposed facility; therefore background concentrations have been obtained from the
Defra maps for use in the assessment.

Calder Valley Skip Hire - Mearclough Road
Air Quality Impact Assessment
P a g e | 21
The CO, SO2 and benzene mapped concentrations are based on 2001 monitoring data. For CO, factors are
available to project the concentrations to future years16. The 2016 SO2 concentrations are assumed to be
75% of the 2001 estimates, in accordance with the 2003 Local Air Quality Management Technical
Guidance17. The 2001 mapping includes projected benzene concentrations for 2010 and these are
assumed to be representative of 2015 concentrations for the purposes of the assessment.
A summary of the annual mean 2015 background concentrations assumed for the assessment is presented
in Table 8. The concentrations were derived from contour plots of the mapped concentrations to
determine the maximum at sensitive receptor locations. The mapped annual mean pollutant
concentrations are well within the relevant AQO’s and EALs.
Table 8: Mapped 2016 Annual Mean Background Concentrations for PM10, PM2.5, CO, SO2 and C6H6 (µg/m3) Pollutant Concentration Standard
Particles (PM10) 14.4 40
Particles (PM2.5) 10.0 25
Sulphur Dioxide (SO2) 4.1 n/a
Carbon Monoxide (CO) 131 n/a
Benzene (C6H6) 0.32 5
4.3 Hydrogen Chloride Ambient monitoring of Hydrogen Chloride is carried out as part of the Defra Acid Gases and Aerosols
Network (AGANET) at a number of, predominantly rural, locations around the UK. T
The closest monitoring site to the proposed facility is at Ladybower in the Peak District, which is around
40 km to the southwest. The average annual mean HCl concentration measured at this location between
2010 and 2012 was 0.31 µg/m3. This concentration is assumed to provide a reasonable estimate of the
background concentration of HCl at the proposed facility.
4.4 Hydrogen Fluoride Monitoring of ambient levels of hydrogen fluoride is not currently carried out in the UK, however the
Expert Panel on Air Quality Standards (EPAQS) report on halogen and hydrogen halides in ambient air18
16 http://laqm.defra.gov.uk/tools-monitoring-data/year-adjustment.html 17 Department for Environment, Food and Rural Affairs (2003): Part IV The Environment Act 1995 Local Air Quality Management Review and
Assessment Technical Guidance, LAQM.TG(03). 18 EPAQS (February 2006), Guidelines for Halogen and Hydrogen Halides in Ambient Air for Protecting Human Health Against Acute Irritancy
Effects.

Calder Valley Skip Hire - Mearclough Road
Air Quality Impact Assessment
P a g e | 22
cites a modelling study which suggests that the typical natural background HF concentration is 0.5 µg/m3,
with an elevated background of 3 µg/m3 where there are local anthropogenic emission sources.
The Defra Pollutant Release Transfer database (PRTR)19 indicates that there are no significant sources of
HF in the vicinity of the proposed facility therefore the natural background HF concentration has been
assumed for the purposes of the assessment.
4.5 Trace Metals Defra has undertaken monitoring of trace elements at a number of locations in the UK since 1976 as part
of the UK Urban and Rural Heavy Metals Monitoring Networks.
To provide an indication of the range of trace metal concentrations that occur in the UK the average
concentrations measured at rural and urban sites between 2008 and 2011 are summarised in Table 9.
With the exception of Cr(VI), all the measured concentrations are well below their respective EAL’s.
Guidance issued by the Environment Agency8 for the assessment of Group 3 metals, states that for
screening purposes it should be assumed that Cr(VI) comprises 20% of the total background chromium).
On this basis the urban average Cr(VI) concentration substantially exceeds the EAL.
For the purposes of the assessment, the UK average rural concentrations are assumed to be reasonably
representative of the baseline trace metal concentrations at the Site.
Table 9: Average UK Trace Metal Concentrations (ng/m3) Pollutant Rural Urban EAL
Antimony (Sb) Not measured Not measured 5,000
Arsenic (As) 0.47 0.68 3
Cadmium (Cd) 0.10 0.30 5
Chromium (Cr) 0.76 4.2 n/a
Trivalent Chromium (Cr(III)) 0.61 (a) 3.4 (a) 5,000
Hexavalent Chromium (Cr(VI)) 0.15 (b) 0.85 (b) 0.2
Cobalt (Co) 0.047 0.21 1,000
Copper (Cu) 2.8 16.8 10,000
Lead (Pb) 4.4 13.9 250 – 500
Manganese (Mn) 2.2 13.2 150
Mercury (Hg) (c) 1.2 2.0 250
19 http://prtr.defra.gov.uk/

Calder Valley Skip Hire - Mearclough Road
Air Quality Impact Assessment
P a g e | 23
Nickel (Ni) 0.83 3.8 20
Thallium (Tl) Not measured Not measured 1,000
Vanadium (V) 1.1 1.7 5,000
(a) 80% of total chromium
(b) 20% of total chromium
(c) Total particulate and vapour
4.6 Dioxins and Furans Monitoring of PCDD/Fs is currently carried out by Defra at six locations in the UK (Hazelrigg, High Muffles,
London, Manchester, Auchencorth Moss and Weybourne) as part of the Toxic Organic Micropollutants
(TOMPs) Network.
To provide an indication of the range of PCDD/F concentrations that occur in the UK, a summary of the
annual mean concentrations measured between 2008 and 2010 is presented in Table 10.
Table 10: UK PCDD/Fs Concentrations (fg TEQ/m3) Monitoring Site Type 2008 2009 2010
London Urban background 10.9 41.4 38.6
Manchester Urban background 19.0 14.2 48.7
Auchencorth Moss Rural background 6.4 0.56 5.0
High Muffles Rural background 1.7 9.38 2.8
Hazelrigg Rural background 3.7 13.5 8.0
Weybourne Rural background - 22.82 2.5
(a) 80% of total chromium
(b) 20% of total chromium
(c) Total particulate and vapour
In general, the concentration of dioxins and furans at rural locations is considerably lower than at urban
locations.
For the purposes of the assessment, the average concentration measured at the rural background sites
between 2008 and 2010 of 8.0 fg/m3 is assumed to provide a reasonable estimate of the baseline dioxin
and furan concentration at the proposed facility.
4.7 Polycyclic Aromatic Hydrocarbons (as benzo[a]pyrene) Monitoring of benzo(a)pyrene (BaP) is currently carried out by DEFRA at a number of locations in the UK
as part of the TOMPS and PAH monitoring and analysis network. A summary of concentrations measured
in the UK is issued by the National Physical Laboratory (NPL) on behalf of Defra on an annual basis. The

Calder Valley Skip Hire - Mearclough Road
Air Quality Impact Assessment
P a g e | 24
most recent report was published in January 2014 and provides annual mean BaP concentrations
measured by the network in 201220.
The average urban and rural background concentrations measured in the UK between 2010 and 2012
were 0.33 ng/m3 and 0.062 respectively.
The average rural background concentration is assumed to provide a reasonable estimate of the
background concentration in the vicinity of the Site.
4.8 Polychlorinated Biphenyls Monitoring of PCBs is currently carried out by DEFRA at six locations in the UK as part of the TOMPs
Network. The average PCB concentration measured at the rural background monitoring sites (Hazelrigg,
Auchencorth, Weybourne and High Muffles) from 2008 to 2010 is 0.000044 µg/m3 and is assumed to be
reasonably representative of the baseline PCB concentration at the Site and nearby sensitive receptors.
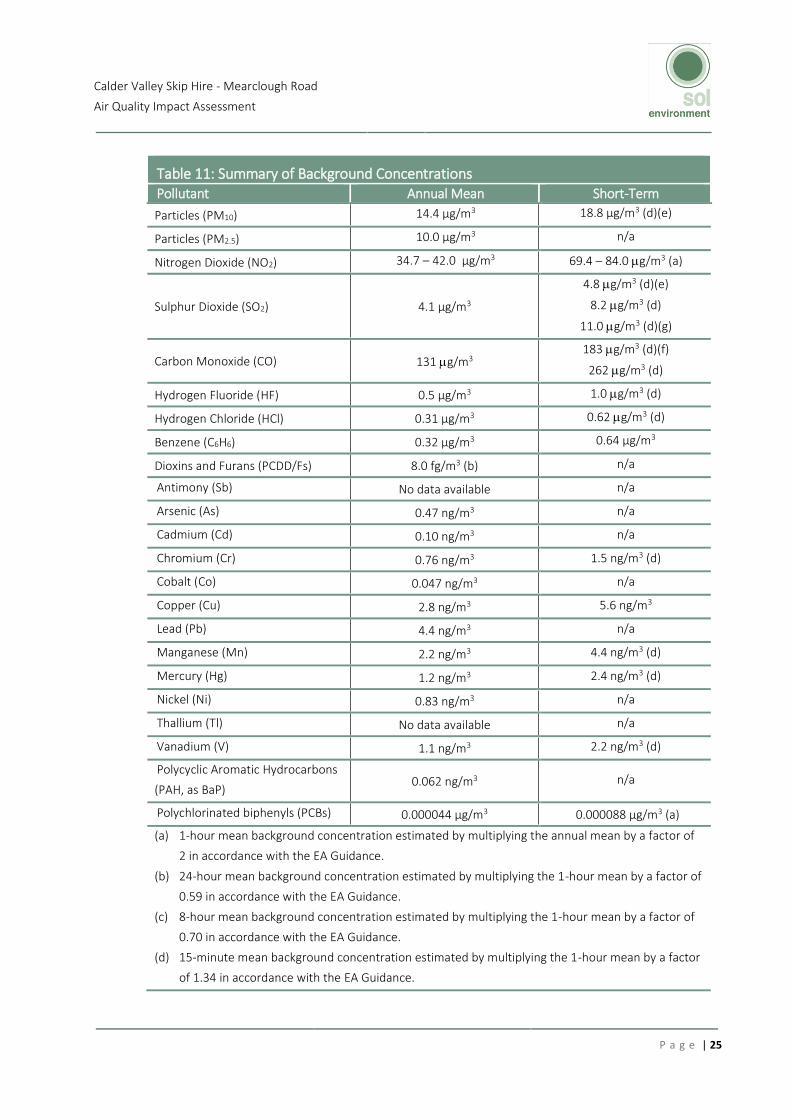
4.9 Summary of Background Concentrations A summary of the annual mean and short-term background concentrations assumed for the assessment
is presented in Table 11. The current background concentrations are assumed to be representative of
future year concentrations. Since pollutant concentrations are expected to decline in the future, this
methodology ensures that the worst-case impacts are determined (i.e. future impacts combined with
existing air quality).
20 Annual Report for 2012 on the UK PAH Monitoring and Analysis Network, NPL Report AS 84, January 2014.
Calder Valley Skip Hire - Mearclough Road
Air Quality Impact Assessment
P a g e | 25
Table 11: Summary of Background Concentrations Pollutant Annual Mean Short-Term
Particles (PM10) 14.4 µg/m3 18.8 µg/m3 (d)(e)
Particles (PM2.5) 10.0 µg/m3 n/a
Nitrogen Dioxide (NO2) 34.7 – 42.0 µg/m3 69.4 – 84.0 g/m3 (a)
Sulphur Dioxide (SO2) 4.1 µg/m3
4.8 g/m3 (d)(e)
8.2 g/m3 (d)
11.0 g/m3 (d)(g)
Carbon Monoxide (CO) 131 g/m3 183 g/m3 (d)(f)
262 g/m3 (d)
Hydrogen Fluoride (HF) 0.5 µg/m3 1.0 g/m3 (d)
Hydrogen Chloride (HCl) 0.31 µg/m3 0.62 g/m3 (d)
Benzene (C6H6) 0.32 µg/m3 0.64 µg/m3
Dioxins and Furans (PCDD/Fs) 8.0 fg/m3 (b) n/a
Antimony (Sb) No data available n/a
Arsenic (As) 0.47 ng/m3 n/a
Cadmium (Cd) 0.10 ng/m3 n/a
Chromium (Cr) 0.76 ng/m3 1.5 ng/m3 (d)
Cobalt (Co) 0.047 ng/m3 n/a
Copper (Cu) 2.8 ng/m3 5.6 ng/m3
Lead (Pb) 4.4 ng/m3 n/a
Manganese (Mn) 2.2 ng/m3 4.4 ng/m3 (d)
Mercury (Hg) 1.2 ng/m3 2.4 ng/m3 (d)
Nickel (Ni) 0.83 ng/m3 n/a
Thallium (Tl) No data available n/a
Vanadium (V) 1.1 ng/m3 2.2 ng/m3 (d)
Polycyclic Aromatic Hydrocarbons
(PAH, as BaP) 0.062 ng/m3 n/a
Polychlorinated biphenyls (PCBs) 0.000044 µg/m3 0.000088 µg/m3 (a)
(a) 1-hour mean background concentration estimated by multiplying the annual mean by a factor of
2 in accordance with the EA Guidance.
(b) 24-hour mean background concentration estimated by multiplying the 1-hour mean by a factor of
0.59 in accordance with the EA Guidance.
(c) 8-hour mean background concentration estimated by multiplying the 1-hour mean by a factor of
0.70 in accordance with the EA Guidance.
(d) 15-minute mean background concentration estimated by multiplying the 1-hour mean by a factor
of 1.34 in accordance with the EA Guidance.

Calder Valley Skip Hire - Mearclough Road
Air Quality Impact Assessment
P a g e | 26
5. ASSESSMENT OF IMPACT, MITIGATION & RESIDUAL EFFECTS
5.1 Human Health Impact
5.1.1 Introduction
Predicted process concentrations (PC) for the five years of meteorological data are presented as
the maximum arising off-site and at each of the discrete receptors identified in Table 2.
The maximum PC is compared with the relevant air quality standard to determine the significance
of the impact, in accordance with the EA risk assessment guidance. Where a potentially significant
impact is identified, the total predicted environmental concentration (process + background) is
compared with the air quality standard (AQS) to assess the likelihood of an exceedance.
5.1.2 Nitrogen Dioxide
The predicted annual mean and 99.8th percentile of 1-hour mean ground level NO2 process
concentrations are presented in Tables 12 and 13.
Table 12: Predicted Annual Mean NO2 Concentrations (µg/m3) Receptor PC PC (% AQS) PEC PEC (% AQS)
Maximum Off-Site 0.41 1.0% 35.1 87.8%
Hilas Industrial Estate 0.068 0.17% 34.8 86.9%
The Riverine 0.062 0.16% 34.8 86.9%
1 Wakefield Road 0.075 0.19% 41.1 103%
123 Bolton Brow 0.11 0.28% 42.1 105%
Bolton Brow Primary Academy 0.13 0.32% 41.1 103%
48 Norland View 0.18 0.46% 34.9 87.2%
76 Wakefield Road 0.32 0.79% 35.0 87.5%
12 Back Wakefield Road 0.38 0.96% 35.1 87.7%
96 Wakefield Road 0.39 0.98% 35.1 87.7%
100 Wakefield Road 0.26 0.65% 35.0 87.4%
66 Prospect Ave 0.21 0.52% 34.9 87.3%
1 Elm Bank 0.12 0.31% 34.8 87.1%
Abels Joinery, Mearclough Rd 0.24 0.59% 34.9 87.3%
Recycling Centre 0.074 0.19% 34.8 86.9%
Traveller’s Site 0.0043 0.011% 34.7 86.8%
Holmes Cottage 0.081 0.20% 34.8 87.0%
AQS 40

Calder Valley Skip Hire - Mearclough Road
Air Quality Impact Assessment
P a g e | 27
Table 13: Predicted 99.8th Percentile of 1-Hour Mean NO2 Concentrations (µg/m3) Receptor PC PC (% AQS) PEC PEC (% AQS)
Maximum Off-Site 18.6 9.3% 88.0 44.0%
Hilas Industrial Estate 2.9 1.4% 72.3 36.1%
The Riverine 2.0 0.99% 71.4 35.7%
1 Wakefield Road 2.6 1.3% 84.6 42.3%
123 Bolton Brow 6.8 3.4% 90.8 45.4%
Bolton Brow Primary Academy 6.2 3.1% 88.2 44.1%
48 Norland View 10.4 5.2% 79.8 39.9%
76 Wakefield Road 4.9 2.5% 74.3 37.2%
12 Back Wakefield Road 4.6 2.3% 74.0 37.0%
96 Wakefield Road 4.8 2.4% 74.2 37.1%
100 Wakefield Road 3.9 1.9% 73.3 36.6%
66 Prospect Ave 6.7 3.3% 76.1 38.0%
1 Elm Bank 1.7 0.85% 71.1 35.6%
Abels Joinery, Mearclough Rd 3.3 1.6% 72.7 36.3%
Recycling Centre 1.6 0.78% 71.0 35.5%
Traveller’s Site 0.41 0.20% 69.8 34.9%
Holmes Cottage 2.3 1.2% 71.7 35.9%
AQS 200
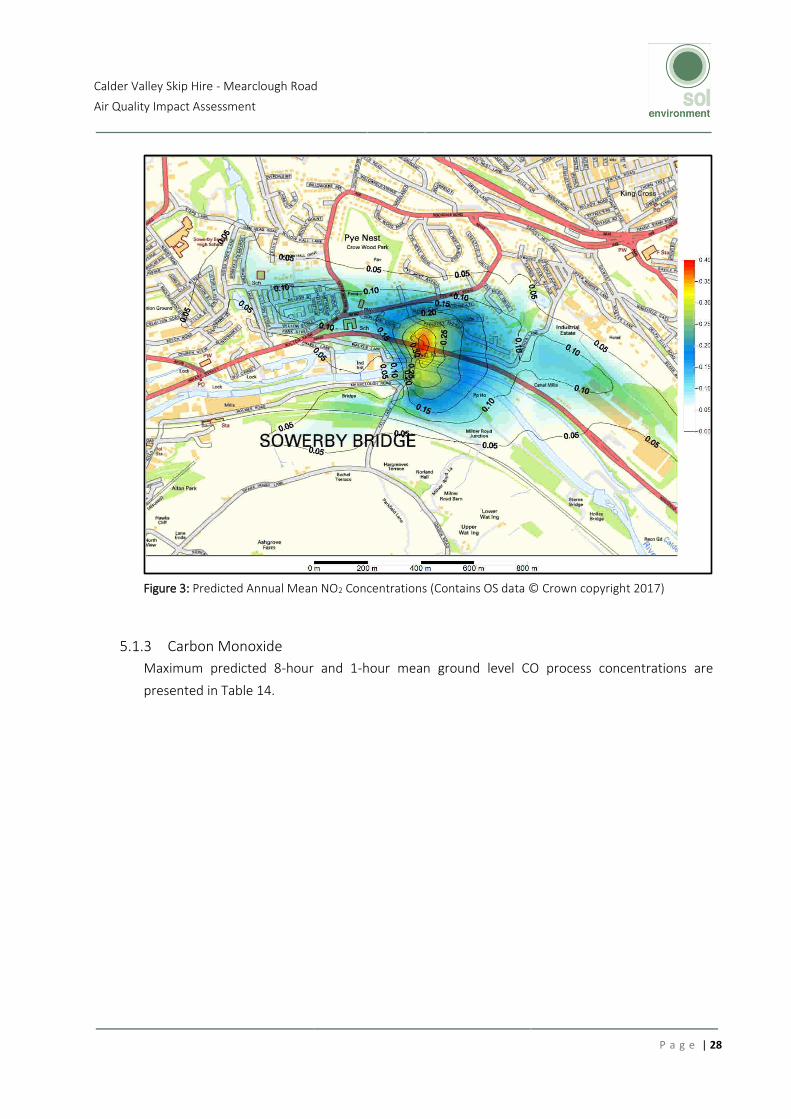
The maximum predicted off-site annual mean NO2 concentration of 0.41 µg/m3 (1.0% of the air
quality objective) occurs to the north of Wakefield Road. The PEC at this location is 87.8% of the
air quality objective and therefore the impact is of negligible significance according to the EPUK/
IAQM planning guidance.
The existing baseline concentration at three receptors is assumed to exceed the air quality
objective of 40 µg/m3, however the PC at these locations is 0.5% of the air quality objective or
below and therefore also of negligible significance.
The maximum short-term impact is less than 10% of the air quality objective at all off-site locations
and is therefore also of negligible significance.
Predicted annual mean NO2 concentrations for the year in which maximum off-site concentrations
are predicted (2011) are presented as a contour plot in Figure 3.
Calder Valley Skip Hire - Mearclough Road
Air Quality Impact Assessment
P a g e | 28
Figure 3: Predicted Annual Mean NO2 Concentrations (Contains OS data © Crown copyright 2017)
5.1.3 Carbon Monoxide
Maximum predicted 8-hour and 1-hour mean ground level CO process concentrations are
presented in Table 14.
Calder Valley Skip Hire - Mearclough Road
Air Quality Impact Assessment
P a g e | 29
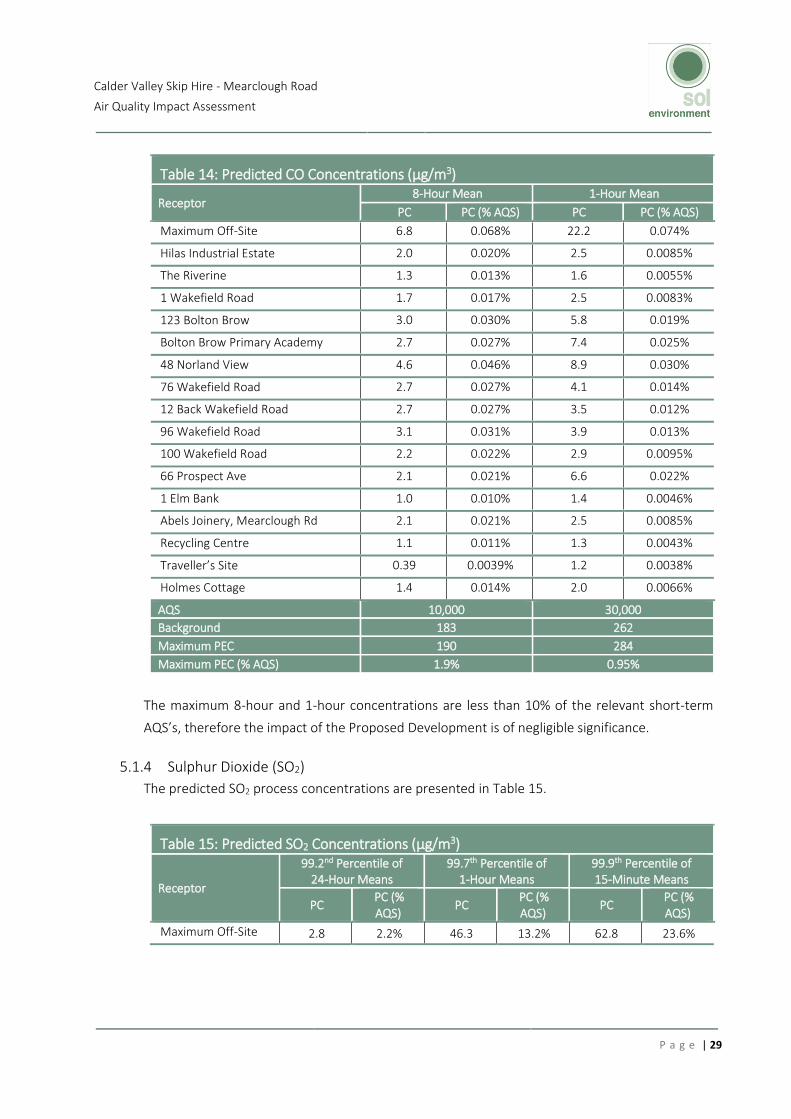
Table 14: Predicted CO Concentrations (µg/m3)
Receptor 8-Hour Mean 1-Hour Mean
PC PC (% AQS) PC PC (% AQS)
Maximum Off-Site 6.8 0.068% 22.2 0.074%
Hilas Industrial Estate 2.0 0.020% 2.5 0.0085%
The Riverine 1.3 0.013% 1.6 0.0055%
1 Wakefield Road 1.7 0.017% 2.5 0.0083%
123 Bolton Brow 3.0 0.030% 5.8 0.019%
Bolton Brow Primary Academy 2.7 0.027% 7.4 0.025%
48 Norland View 4.6 0.046% 8.9 0.030%
76 Wakefield Road 2.7 0.027% 4.1 0.014%
12 Back Wakefield Road 2.7 0.027% 3.5 0.012%
96 Wakefield Road 3.1 0.031% 3.9 0.013%
100 Wakefield Road 2.2 0.022% 2.9 0.0095%
66 Prospect Ave 2.1 0.021% 6.6 0.022%
1 Elm Bank 1.0 0.010% 1.4 0.0046%
Abels Joinery, Mearclough Rd 2.1 0.021% 2.5 0.0085%
Recycling Centre 1.1 0.011% 1.3 0.0043%
Traveller’s Site 0.39 0.0039% 1.2 0.0038%
Holmes Cottage 1.4 0.014% 2.0 0.0066%
AQS 10,000 30,000
Background 183 262
Maximum PEC 190 284
Maximum PEC (% AQS) 1.9% 0.95%
The maximum 8-hour and 1-hour concentrations are less than 10% of the relevant short-term
AQS’s, therefore the impact of the Proposed Development is of negligible significance.
5.1.4 Sulphur Dioxide (SO2)
The predicted SO2 process concentrations are presented in Table 15.
Table 15: Predicted SO2 Concentrations (µg/m3)
Receptor
99.2nd Percentile of 24-Hour Means
99.7th Percentile of 1-Hour Means
99.9th Percentile of 15-Minute Means
PC PC (% AQS)
PC PC (% AQS)
PC PC (% AQS)
Maximum Off-Site 2.8 2.2% 46.3 13.2% 62.8 23.6%

Calder Valley Skip Hire - Mearclough Road
Air Quality Impact Assessment
P a g e | 30
Hilas Industrial
Estate 0.83 0.66% 7.6 2.2% 8.6 3.2%
The Riverine 0.74 0.59% 5.4 1.6% 5.9 2.2%
1 Wakefield Road 0.76 0.61% 7.1 2.0% 7.6 2.9%
123 Bolton Brow 1.1 0.86% 17.1 4.9% 20.3 7.6%
Bolton Brow Primary
Academy 1.1 0.87% 16.1 4.6% 22.3 8.4%
48 Norland View 1.3 1.1% 28.6 8.2% 32.8 12.3%
76 Wakefield Road 1.8 1.4% 13.6 3.9% 14.8 5.6%
12 Back Wakefield
Road 2.0 1.6% 13.0 3.7% 13.4 5.0%
96 Wakefield Road 1.8 1.4% 13.5 3.9% 14.3 5.4%
100 Wakefield Road 1.28 1.0% 10.7 3.1% 11.2 4.2%
66 Prospect Ave 0.84 0.67% 16.1 4.6% 21.9 8.2%
1 Elm Bank 0.57 0.46% 4.8 1.4% 5.0 1.9%
Abels Joinery,
Mearclough Rd 1.6 1.3% 9.4 2.7% 9.6 3.6%
Recycling Centre 0.71 0.57% 4.33 1.2% 4.6 1.7%
Traveller’s Site 0.081 0.065% 0.72 0.21% 3.0 1.1%
Holmes Cottage 0.94 0.75% 6.2 1.8% 7.0 2.6%
AQS 125 350 266
Background 4.8 8.2 11.0
Maximum PEC 7.6 54.5 73.8
Maximum PEC (% AQS)
6.1% 15.6% 27.7%
The maximum predicted PECs are well within the relevant air quality standards at all off-site
locations. The maximum off-site 1-hour and 15-minute mean concentrations would be described
as slight and moderate adverse respectively, however the existing SO2 concentrations in the area
are very low and the risk of an exceedance as a result of emissions from the proposed
development is considered to be negligible.
5.1.5 Particulate Matter (as PM10)
Predicted annual mean and 90.4th percentile of 24-hour mean PM10 concentrations at the selected
receptor locations are presented in Table 16. The predictions assume that 100% of the particulate
matter emitted from the stack is PM10.

Calder Valley Skip Hire - Mearclough Road
Air Quality Impact Assessment
P a g e | 31
Table 16: Predicted PM10 Concentrations (µg/m3)
Receptor Annual Mean 90.4th Percentile of 24-Hour Means
PC PC (% AQS) PC PC (% AQS)
Maximum Off-Site 0.029 0.073% 0.21 0.41%
Hilas Industrial Estate 0.0049 0.012% 0.027 0.054%
The Riverine 0.0045 0.011% 0.032 0.065%
1 Wakefield Road 0.0054 0.013% 0.041 0.082%
123 Bolton Brow 0.0081 0.020% 0.074 0.15%
Bolton Brow Primary Academy 0.0090 0.023% 0.071 0.14%
48 Norland View 0.013 0.033% 0.11 0.22%
76 Wakefield Road 0.023 0.057% 0.18 0.36%
12 Back Wakefield Road 0.027 0.069% 0.19 0.38%
96 Wakefield Road 0.028 0.070% 0.20 0.40%
100 Wakefield Road 0.019 0.047% 0.12 0.25%
66 Prospect Ave 0.015 0.037% 0.10 0.19%
1 Elm Bank 0.0087 0.022% 0.057 0.11%
Abels Joinery, Mearclough Rd 0.017 0.042% 0.143 0.29%
Recycling Centre 0.0053 0.013% 0.041 0.081%
Traveller’s Site 0.00031 0.00077% 0.0014 0.0028%
Holmes Cottage 0.0058 0.014% 0.042 0.083%
AQS 40 50
Background 14.4 18.8
Maximum PEC 14.4 19.0
Maximum PEC (% AQS) 36.0% 38.0%
The maximum off-site annual mean PM10 concentration is less than 0.5% of the air quality
objective, therefore the impact is therefore considered to be of negligible significance.
The short-term PM10 impacts are less than 10% of the air quality objective at all locations and are
therefore also of negligible significance.
5.1.6 Particulate Matter (as PM2.5)
Predicted annual mean PM2.5 process concentrations are presented in Table 17. The predictions
assume that 100% of the particulate matter emitted from the stack is PM2.5.

Calder Valley Skip Hire - Mearclough Road
Air Quality Impact Assessment
P a g e | 32
Table 17: Predicted PM2.5 Concentrations (µg/m3)
Receptor Annual Mean
PC PC (% AQS)
Maximum Off-Site 0.029 0.020%
Hilas Industrial Estate 0.0049 0.018%
The Riverine 0.0045 0.021%
1 Wakefield Road 0.0054 0.032%
123 Bolton Brow 0.0081 0.036%
Bolton Brow Primary Academy 0.0090 0.052%
48 Norland View 0.013 0.091%
76 Wakefield Road 0.023 0.11%
12 Back Wakefield Road 0.027 0.11%
96 Wakefield Road 0.028 0.074%
100 Wakefield Road 0.019 0.060%
66 Prospect Ave 0.015 0.035%
1 Elm Bank 0.0087 0.067%
Abels Joinery, Mearclough Rd 0.017 0.021%
Recycling Centre 0.0053 0.0012%
Traveller’s Site 0.00031 0.023%
Holmes Cottage 0.0058 0.020%
AQS 25
Background 10.0
Maximum PEC 10.0
Maximum PEC (% AQS) 25.0%
The maximum off-site annual mean PM2.5 concentration is less than 0.5% of the EU limit value,
therefore the impact is therefore considered to be of negligible significance.
5.1.7 Total Organic Carbon (as Benzene)
Predicted annual and 1-hour mean ground-level benzene concentrations (PC) are presented in
Table 18.
Calder Valley Skip Hire - Mearclough Road
Air Quality Impact Assessment
P a g e | 33
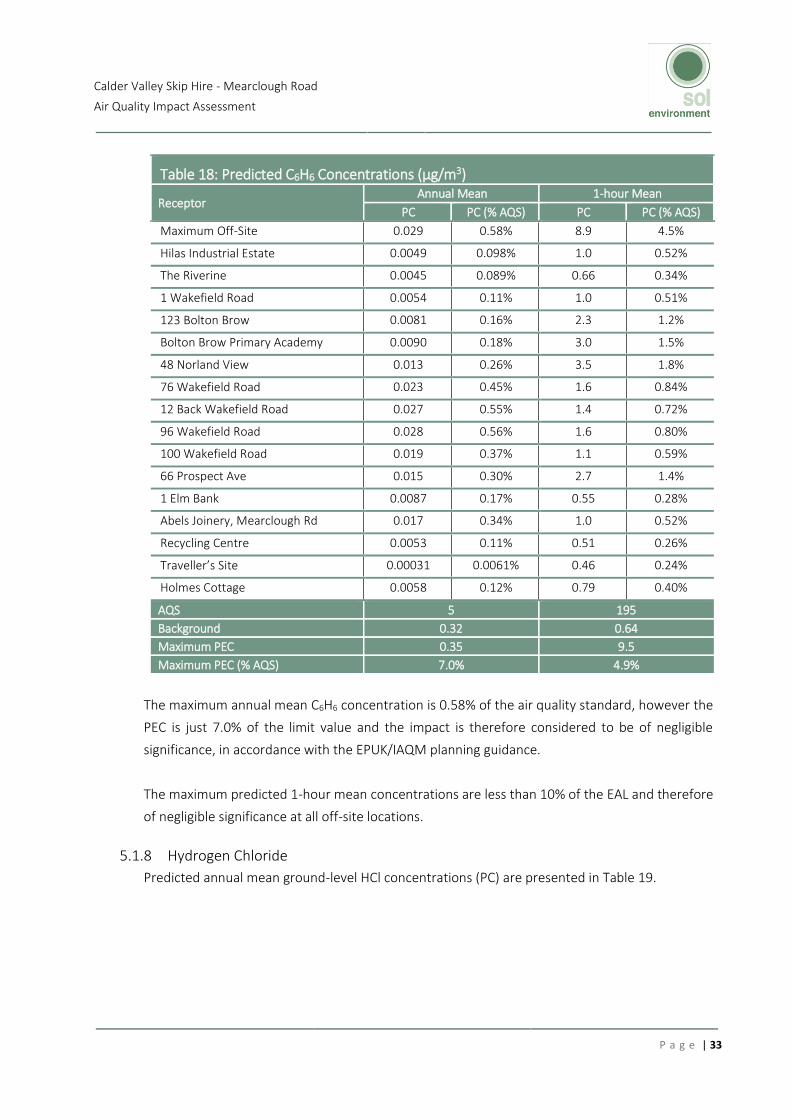
Table 18: Predicted C6H6 Concentrations (µg/m3)
Receptor Annual Mean 1-hour Mean
PC PC (% AQS) PC PC (% AQS)
Maximum Off-Site 0.029 0.58% 8.9 4.5%
Hilas Industrial Estate 0.0049 0.098% 1.0 0.52%
The Riverine 0.0045 0.089% 0.66 0.34%
1 Wakefield Road 0.0054 0.11% 1.0 0.51%
123 Bolton Brow 0.0081 0.16% 2.3 1.2%
Bolton Brow Primary Academy 0.0090 0.18% 3.0 1.5%
48 Norland View 0.013 0.26% 3.5 1.8%
76 Wakefield Road 0.023 0.45% 1.6 0.84%
12 Back Wakefield Road 0.027 0.55% 1.4 0.72%
96 Wakefield Road 0.028 0.56% 1.6 0.80%
100 Wakefield Road 0.019 0.37% 1.1 0.59%
66 Prospect Ave 0.015 0.30% 2.7 1.4%
1 Elm Bank 0.0087 0.17% 0.55 0.28%
Abels Joinery, Mearclough Rd 0.017 0.34% 1.0 0.52%
Recycling Centre 0.0053 0.11% 0.51 0.26%
Traveller’s Site 0.00031 0.0061% 0.46 0.24%
Holmes Cottage 0.0058 0.12% 0.79 0.40%
AQS 5 195
Background 0.32 0.64
Maximum PEC 0.35 9.5
Maximum PEC (% AQS) 7.0% 4.9%
The maximum annual mean C6H6 concentration is 0.58% of the air quality standard, however the
PEC is just 7.0% of the limit value and the impact is therefore considered to be of negligible
significance, in accordance with the EPUK/IAQM planning guidance.
The maximum predicted 1-hour mean concentrations are less than 10% of the EAL and therefore
of negligible significance at all off-site locations.
5.1.8 Hydrogen Chloride
Predicted annual mean ground-level HCl concentrations (PC) are presented in Table 19.

Calder Valley Skip Hire - Mearclough Road
Air Quality Impact Assessment
P a g e | 34
Table 19: Predicted HCl Concentrations (µg/m3)
Receptor 1-Hour Mean
PC PC (% AQS)
Maximum Off-Site 26.6 3.5%
Hilas Industrial Estate 3.1 0.41%
The Riverine 2.0 0.26%
1 Wakefield Road 3.0 0.40%
123 Bolton Brow 7.0 0.93%
Bolton Brow Primary Academy 8.9 1.2%
48 Norland View 10.6 1.4%
76 Wakefield Road 4.9 0.65%
12 Back Wakefield Road 4.2 0.56%
96 Wakefield Road 4.7 0.62%
100 Wakefield Road 3.4 0.46%
66 Prospect Ave 8.0 1.1%
1 Elm Bank 1.7 0.22%
Abels Joinery, Mearclough Rd 3.1 0.41%
Recycling Centre 1.5 0.21%
Traveller’s Site 1.4 0.18%
Holmes Cottage 2.4 0.32%
AQS 750
Background 0.31
Maximum PEC 26.9
Maximum PEC (% AQS) 3.6%
The maximum predicted hourly mean concentrations are less than 10% of the EAL and are
therefore of negligible significance.
5.1.9 Hydrogen Fluoride
The predicted maximum monthly and 1-hour mean ground-level hydrogen fluoride
concentrations are presented in Table 20.
Calder Valley Skip Hire - Mearclough Road
Air Quality Impact Assessment
P a g e | 35
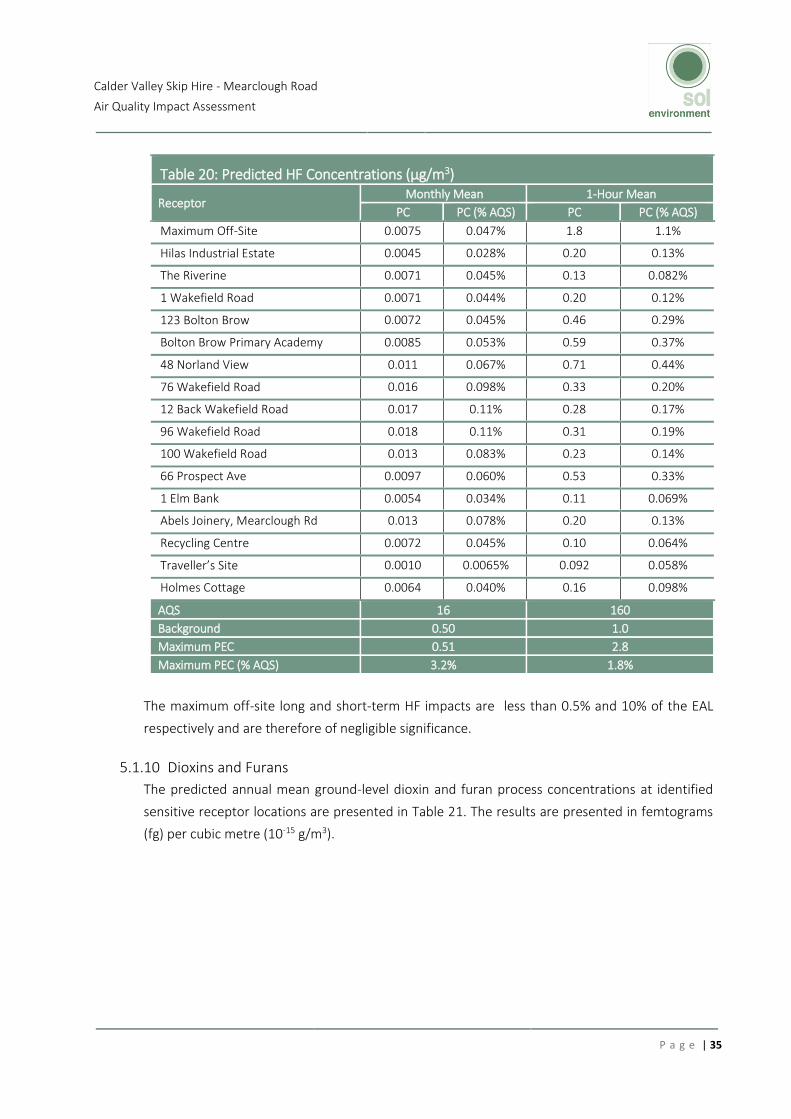
Table 20: Predicted HF Concentrations (µg/m3)
Receptor Monthly Mean 1-Hour Mean
PC PC (% AQS) PC PC (% AQS)
Maximum Off-Site 0.0075 0.047% 1.8 1.1%
Hilas Industrial Estate 0.0045 0.028% 0.20 0.13%
The Riverine 0.0071 0.045% 0.13 0.082%
1 Wakefield Road 0.0071 0.044% 0.20 0.12%
123 Bolton Brow 0.0072 0.045% 0.46 0.29%
Bolton Brow Primary Academy 0.0085 0.053% 0.59 0.37%
48 Norland View 0.011 0.067% 0.71 0.44%
76 Wakefield Road 0.016 0.098% 0.33 0.20%
12 Back Wakefield Road 0.017 0.11% 0.28 0.17%
96 Wakefield Road 0.018 0.11% 0.31 0.19%
100 Wakefield Road 0.013 0.083% 0.23 0.14%
66 Prospect Ave 0.0097 0.060% 0.53 0.33%
1 Elm Bank 0.0054 0.034% 0.11 0.069%
Abels Joinery, Mearclough Rd 0.013 0.078% 0.20 0.13%
Recycling Centre 0.0072 0.045% 0.10 0.064%
Traveller’s Site 0.0010 0.0065% 0.092 0.058%
Holmes Cottage 0.0064 0.040% 0.16 0.098%
AQS 16 160
Background 0.50 1.0
Maximum PEC 0.51 2.8
Maximum PEC (% AQS) 3.2% 1.8%
The maximum off-site long and short-term HF impacts are less than 0.5% and 10% of the EAL
respectively and are therefore of negligible significance.
5.1.10 Dioxins and Furans
The predicted annual mean ground-level dioxin and furan process concentrations at identified
sensitive receptor locations are presented in Table 21. The results are presented in femtograms
(fg) per cubic metre (10-15 g/m3).

Calder Valley Skip Hire - Mearclough Road
Air Quality Impact Assessment
P a g e | 36
Table 21: Predicted Dioxin and Furan Concentrations (fg/m3)
Receptor Annual Mean
PC PC (% Background)
Maximum Off-Site 0.29 3.6%
Hilas Industrial Estate 0.049 0.61%
The Riverine 0.045 0.56%
1 Wakefield Road 0.054 0.67%
123 Bolton Brow 0.08 1.0%
Bolton Brow Primary Academy 0.09 1.1%
48 Norland View 0.13 1.6%
76 Wakefield Road 0.23 2.8%
12 Back Wakefield Road 0.27 3.4%
96 Wakefield Road 0.28 3.5%
100 Wakefield Road 0.19 2.3%
66 Prospect Ave 0.15 1.9%
1 Elm Bank 0.087 1.1%
Abels Joinery, Mearclough Rd 0.17 2.1%
Recycling Centre 0.053 0.66%
Traveller’s Site 0.0031 0.038%
Holmes Cottage 0.058 0.72%
Background 8.0
There are no assessment criteria for dioxins and furans. The predicted maximum contribution
from the proposed development at a receptor location is 3.6% of the average background
concentration measured at rural monitoring sites in the UK.
5.1.11 PAH (as Benzo[a]pyrene)
The maximum predicted annual mean ground level BaP process concentrations are presented in
Table 22. The results are presented in nanograms (ng) per cubic metre (10-9 g/m3).
Calder Valley Skip Hire - Mearclough Road
Air Quality Impact Assessment
P a g e | 37
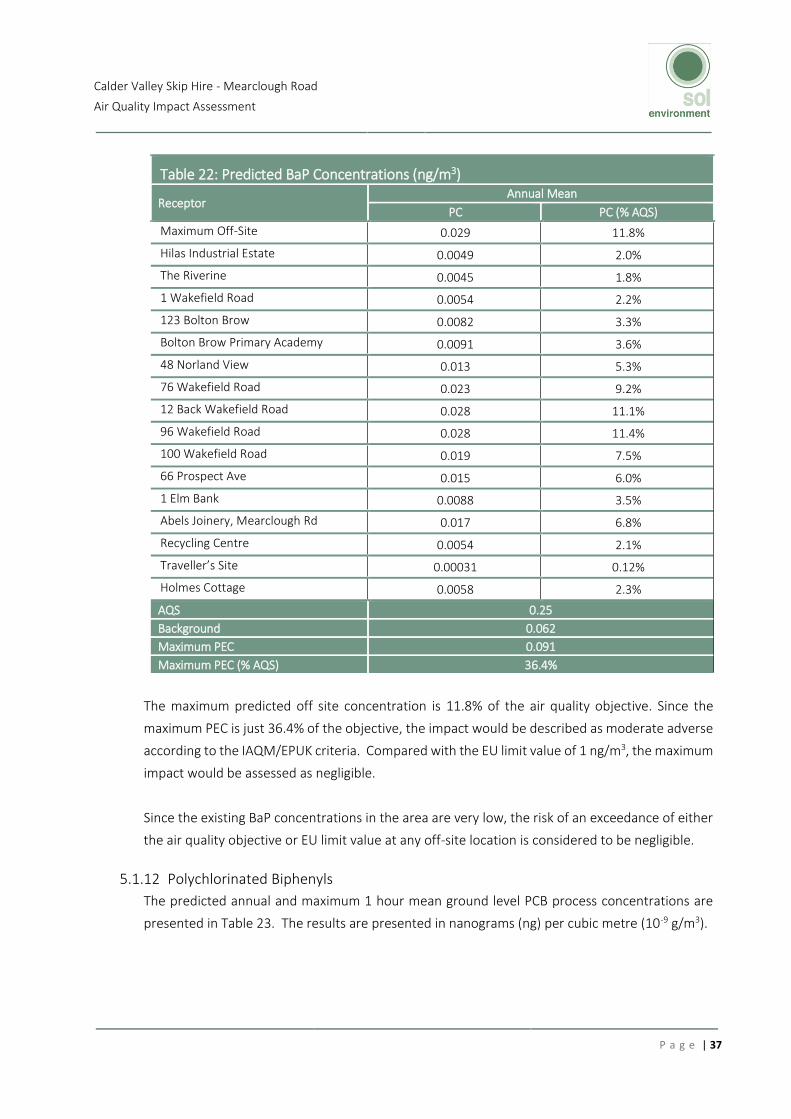
Table 22: Predicted BaP Concentrations (ng/m3)
Receptor Annual Mean
PC PC (% AQS)
Maximum Off-Site 0.029 11.8%
Hilas Industrial Estate 0.0049 2.0%
The Riverine 0.0045 1.8%
1 Wakefield Road 0.0054 2.2%
123 Bolton Brow 0.0082 3.3%
Bolton Brow Primary Academy 0.0091 3.6%
48 Norland View 0.013 5.3%
76 Wakefield Road 0.023 9.2%
12 Back Wakefield Road 0.028 11.1%
96 Wakefield Road 0.028 11.4%
100 Wakefield Road 0.019 7.5%
66 Prospect Ave 0.015 6.0%
1 Elm Bank 0.0088 3.5%
Abels Joinery, Mearclough Rd 0.017 6.8%
Recycling Centre 0.0054 2.1%
Traveller’s Site 0.00031 0.12%
Holmes Cottage 0.0058 2.3%
AQS 0.25
Background 0.062
Maximum PEC 0.091
Maximum PEC (% AQS) 36.4%
The maximum predicted off site concentration is 11.8% of the air quality objective. Since the
maximum PEC is just 36.4% of the objective, the impact would be described as moderate adverse
according to the IAQM/EPUK criteria. Compared with the EU limit value of 1 ng/m3, the maximum
impact would be assessed as negligible.
Since the existing BaP concentrations in the area are very low, the risk of an exceedance of either
the air quality objective or EU limit value at any off-site location is considered to be negligible.
5.1.12 Polychlorinated Biphenyls
The predicted annual and maximum 1 hour mean ground level PCB process concentrations are
presented in Table 23. The results are presented in nanograms (ng) per cubic metre (10-9 g/m3).

Calder Valley Skip Hire - Mearclough Road
Air Quality Impact Assessment
P a g e | 38
Table 23: Predicted PCB Concentrations (ng/m3)
Receptor Annual Mean 1-Hour Mean
PC PC (% AQS) PC PC (% AQS)
Maximum Off-Site 0.015 0.0073% 2.2 0.037%
Hilas Industrial Estate 0.0024 0.0012% 0.25 0.0042%
The Riverine 0.0022 0.0011% 0.16 0.0027%
1 Wakefield Road 0.0027 0.0013% 0.25 0.0042%
123 Bolton Brow 0.0041 0.0020% 0.58 0.0097%
Bolton Brow Primary Academy 0.0045 0.0023% 0.74 0.012%
48 Norland View 0.0065 0.0033% 0.89 0.015%
76 Wakefield Road 0.011 0.0057% 0.41 0.0068%
12 Back Wakefield Road 0.014 0.0069% 0.35 0.0058%
96 Wakefield Road 0.014 0.0070% 0.39 0.0065%
100 Wakefield Road 0.0093 0.0047% 0.29 0.0048%
66 Prospect Ave 0.0074 0.0037% 0.66 0.011%
1 Elm Bank 0.0044 0.0022% 0.14 0.0023%
Abels Joinery, Mearclough Rd 0.0084 0.0042% 0.25 0.0042%
Recycling Centre 0.0027 0.0013% 0.13 0.0021%
Traveller’s Site 0.00015 0.000077% 0.12 0.0019%
Holmes Cottage 0.0029 0.0014% 0.20 0.0033%
AQS 200 6000
Background 0.044 0.088
Maximum PEC 0.059 2.3
Maximum PEC (% AQS) 0.030% 0.038%
Maximum predicted ground level annual mean and 1-hour mean PCB concentrations are less than
1% and 10% of the long and short-term EALs, therefore the impact is of negligible significance.
5.1.13 Trace Metals
Step 1 Screening
The predicted maximum long and short term trace metal impacts at sensitive receptors for
emissions at maximum IED limits are presented in Tables 24 and 25 respectively.
For the group 3 metals (Sb, As, Pb, Cr, Co, Cu, Mn, Ni and V), if both the long and short term PECs
are within the relevant EALs, then the impact is considered insignificant, in accordance with the
Environment Agency’s metals guidance7.
Calder Valley Skip Hire - Mearclough Road
Air Quality Impact Assessment
P a g e | 39
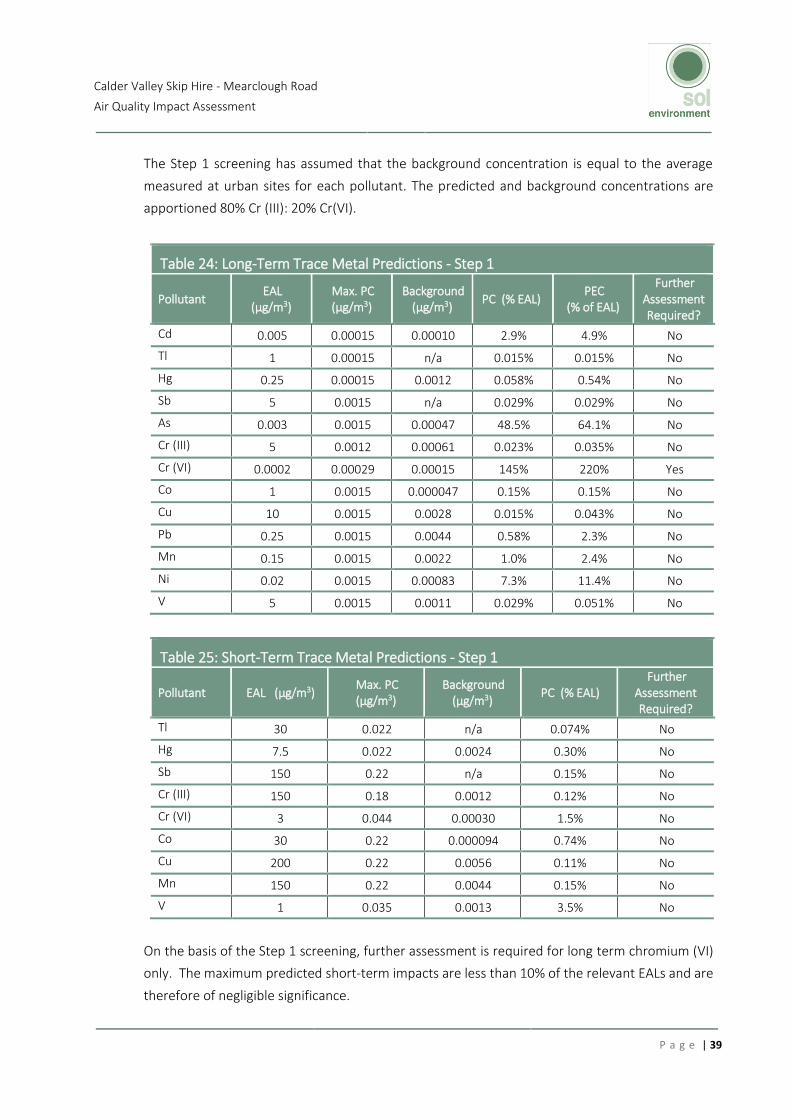
The Step 1 screening has assumed that the background concentration is equal to the average
measured at urban sites for each pollutant. The predicted and background concentrations are
apportioned 80% Cr (III): 20% Cr(VI).
Table 24: Long-Term Trace Metal Predictions - Step 1
Pollutant EAL
(µg/m3) Max. PC (µg/m3)
Background (µg/m3)
PC (% EAL) PEC
(% of EAL)
Further Assessment Required?
Cd 0.005 0.00015 0.00010 2.9% 4.9% No
Tl 1 0.00015 n/a 0.015% 0.015% No
Hg 0.25 0.00015 0.0012 0.058% 0.54% No
Sb 5 0.0015 n/a 0.029% 0.029% No
As 0.003 0.0015 0.00047 48.5% 64.1% No
Cr (III) 5 0.0012 0.00061 0.023% 0.035% No
Cr (VI) 0.0002 0.00029 0.00015 145% 220% Yes
Co 1 0.0015 0.000047 0.15% 0.15% No
Cu 10 0.0015 0.0028 0.015% 0.043% No
Pb 0.25 0.0015 0.0044 0.58% 2.3% No
Mn 0.15 0.0015 0.0022 1.0% 2.4% No
Ni 0.02 0.0015 0.00083 7.3% 11.4% No
V 5 0.0015 0.0011 0.029% 0.051% No
Table 25: Short-Term Trace Metal Predictions - Step 1
Pollutant EAL (µg/m3) Max. PC (µg/m3)
Background (µg/m3)
PC (% EAL) Further
Assessment Required?
Tl 30 0.022 n/a 0.074% No
Hg 7.5 0.022 0.0024 0.30% No
Sb 150 0.22 n/a 0.15% No
Cr (III) 150 0.18 0.0012 0.12% No
Cr (VI) 3 0.044 0.00030 1.5% No
Co 30 0.22 0.000094 0.74% No
Cu 200 0.22 0.0056 0.11% No
Mn 150 0.22 0.0044 0.15% No
V 1 0.035 0.0013 3.5% No
On the basis of the Step 1 screening, further assessment is required for long term chromium (VI)
only. The maximum predicted short-term impacts are less than 10% of the relevant EALs and are
therefore of negligible significance.
Calder Valley Skip Hire - Mearclough Road
Air Quality Impact Assessment
P a g e | 40
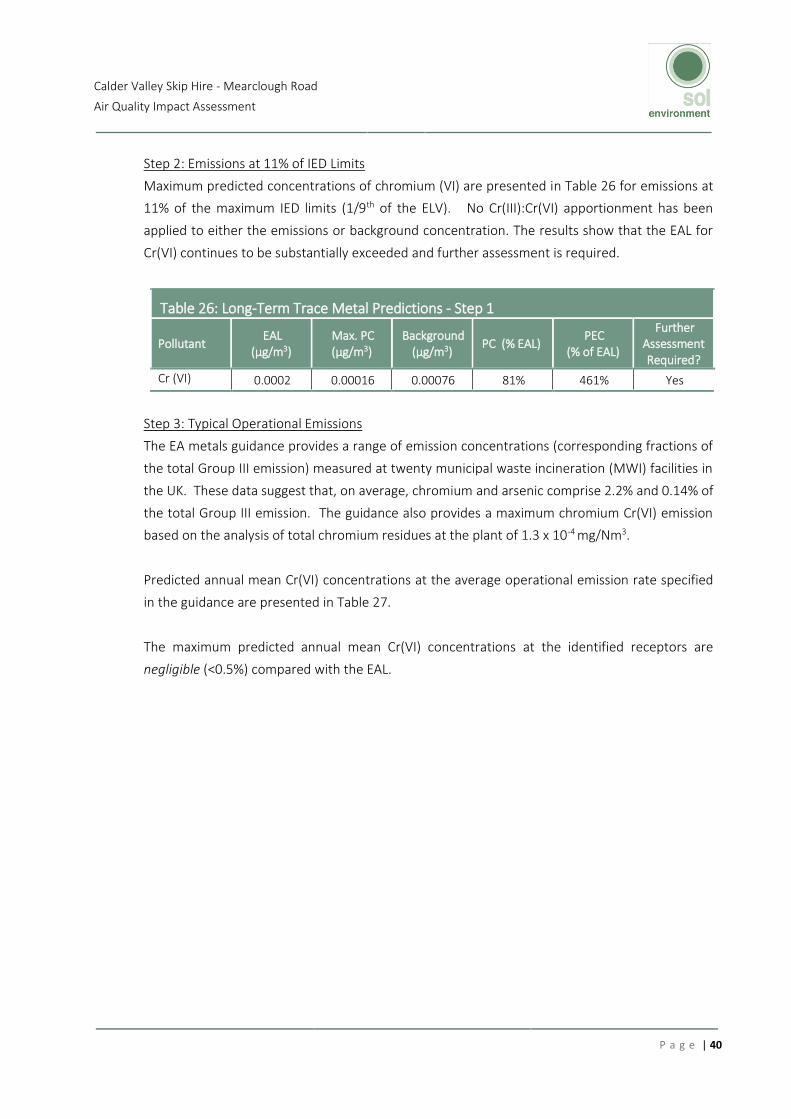
Step 2: Emissions at 11% of IED Limits
Maximum predicted concentrations of chromium (VI) are presented in Table 26 for emissions at
11% of the maximum IED limits (1/9th of the ELV). No Cr(III):Cr(VI) apportionment has been
applied to either the emissions or background concentration. The results show that the EAL for
Cr(VI) continues to be substantially exceeded and further assessment is required.
Table 26: Long-Term Trace Metal Predictions - Step 1
Pollutant EAL
(µg/m3) Max. PC (µg/m3)
Background (µg/m3)
PC (% EAL) PEC
(% of EAL)
Further Assessment Required?
Cr (VI) 0.0002 0.00016 0.00076 81% 461% Yes
Step 3: Typical Operational Emissions
The EA metals guidance provides a range of emission concentrations (corresponding fractions of
the total Group III emission) measured at twenty municipal waste incineration (MWI) facilities in
the UK. These data suggest that, on average, chromium and arsenic comprise 2.2% and 0.14% of
the total Group III emission. The guidance also provides a maximum chromium Cr(VI) emission
based on the analysis of total chromium residues at the plant of 1.3 x 10⁻⁴ mg/Nm3.
Predicted annual mean Cr(VI) concentrations at the average operational emission rate specified
in the guidance are presented in Table 27.
The maximum predicted annual mean Cr(VI) concentrations at the identified receptors are
negligible (<0.5%) compared with the EAL.

Calder Valley Skip Hire - Mearclough Road
Air Quality Impact Assessment
P a g e | 41
Table 27: Predicted Cr(VI) Concentrations (ng/m3)
Receptor Annual Mean
PC PC (% AQS)
Maximum Off-Site 0.00010 0.051%
Hilas Industrial Estate 0.000017 0.0086%
The Riverine 0.000016 0.0078%
1 Wakefield Road 0.000019 0.0094%
123 Bolton Brow 0.000028 0.014%
Bolton Brow Primary Academy 0.000032 0.016%
48 Norland View 0.000046 0.023%
76 Wakefield Road 0.000079 0.040%
12 Back Wakefield Road 0.000096 0.048%
96 Wakefield Road 0.000098 0.049%
100 Wakefield Road 0.000065 0.033%
66 Prospect Ave 0.000052 0.026%
1 Elm Bank 0.000031 0.015%
Abels Joinery, Mearclough Rd 0.000059 0.029%
Recycling Centre 0.000019 0.0093%
Traveller’s Site 0.0000011 0.00054%
Holmes Cottage 0.000020 0.010%
AQS 0.2

Calder Valley Skip Hire - Mearclough Road
Air Quality Impact Assessment
P a g e | 42
5.1.14 Summary of Stack Emissions Impact on Human Health
A summary of the significance of the predicted significance of the impact on pollutant
concentrations at sensitive receptor locations is presented in Table 28.
Table 28: Summary of Significance of Human Health Impacts
Pollutant Significance
Particles (PM10) Negligible
Particles (PM2.5) Negligible
Nitrogen Dioxide (NO2) Negligible
Sulphur Dioxide (SO2) Negligible
Carbon Monoxide (CO) Negligible
Hydrogen Fluoride (HF) Negligible
Hydrogen Chloride (HCl) Negligible
Benzene (C6H6) Negligible
Dioxins and Furans (PCDD/Fs) Negligible
Group I Trace Metals (Cd + Tl) Negligible
Group II Trace Metals (Hg) Negligible
Group III Trace Metals (Sb, As, Pb, Cr, Co, Cu, Mn, Ni, V) Negligible
Dioxins and Furans (PCDD/Fs) Negligible
PAH (as BaP) Negligible
PCBs Negligible
5.2 Habitat Impact
5.2.1 Airborne Concentrations of NOx, SO2 and NH3
Predicted maximum ground level concentrations of NOx, SO2 and HF at the identified habitat sites
are compared with the relevant critical levels (CL) in Tables 29 and 30.

Calder Valley Skip Hire - Mearclough Road
Air Quality Impact Assessment
P a g e | 43
Table 29: Predicted Maximum NOx and SO2 PC as a Percentage of the Critical Levels
Habitat Site Annual Mean NOx 24-Hour Mean NOx Annual Mean SO2
South Pennine Moors SAC/ SPA 0.0034% 0.068% 0.0013%
Milner Royd LNR 1.5% 15.1% 0.58%
Norland Moor LNR 0.012% 0.34% 0.0047%
Scarr and Long Woods LNR 0.075% 0.70% 0.029%
Rochdale Canal LWS 1.5% 10.2% 0.58%
Critical Level 30 75 20
Table 30: Predicted Maximum HF PC as a Percentage of the Critical Levels
Habitat Site Daily Mean HF Weekly Mean HF
South Pennine Moors SAC/ SPA 0.0053% 0.0034%
Milner Royd LNR 1.2% 1.2%
Norland Moor LNR 0.027% 0.019%
Scarr and Long Woods LNR 0.056% 0.054%
Rochdale Canal LWS 0.81% 1.2%
Critical Level 5 0.5
The PCs are well within the critical levels at all the identified habitat sites. At South Pennine Moors
SAC/ SPA the impacts are less than 1% and 10% of the long and short-term critical levels
respectively and therefore of negligible significance.
5.2.2 Eutrophication
Predicted maximum nutrient nitrogen deposition rates are compared with the lower critical load
for eutrophication in Table 31.
Table 31: Predicted Eutrophication Rate (kg N/ha/yr) Habitat Site PC Critical Load PC (as %age of CL)
South Pennine Moors SAC/
SPA 0.00015 5 0.0029%
Milner Royd LNR 0.13 10 1.3%
Norland Moor LNR 0.00052 10 0.0052%
Scarr and Long Woods LNR 0.0064 10 0.064%
The PCs are well within the relevant critical loads at all the identified habitat sites. At South
Pennine Moors SAC/SPA the impact is less than 1% of the critical load and therefore of negligible
significance.
Calder Valley Skip Hire - Mearclough Road
Air Quality Impact Assessment
P a g e | 44
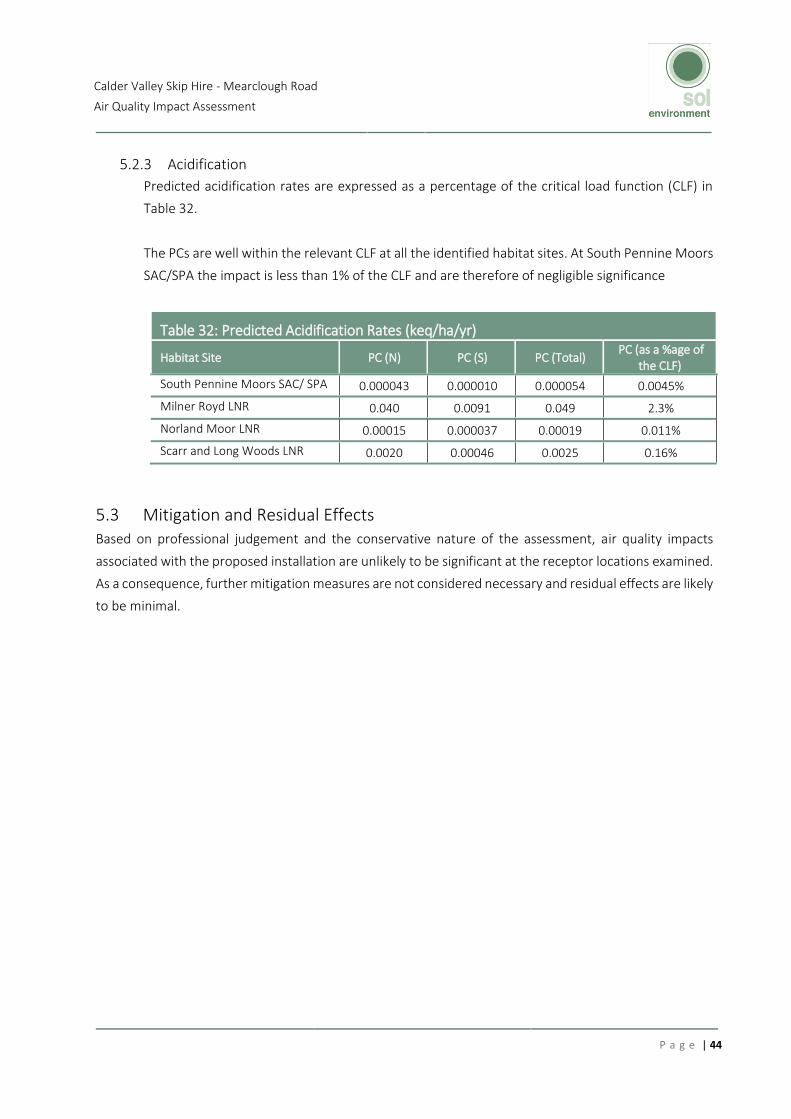
5.2.3 Acidification
Predicted acidification rates are expressed as a percentage of the critical load function (CLF) in
Table 32.
The PCs are well within the relevant CLF at all the identified habitat sites. At South Pennine Moors
SAC/SPA the impact is less than 1% of the CLF and are therefore of negligible significance
Table 32: Predicted Acidification Rates (keq/ha/yr)
Habitat Site PC (N) PC (S) PC (Total) PC (as a %age of
the CLF)
South Pennine Moors SAC/ SPA 0.000043 0.000010 0.000054 0.0045%
Milner Royd LNR 0.040 0.0091 0.049 2.3%
Norland Moor LNR 0.00015 0.000037 0.00019 0.011%
Scarr and Long Woods LNR 0.0020 0.00046 0.0025 0.16%
5.3 Mitigation and Residual Effects Based on professional judgement and the conservative nature of the assessment, air quality impacts
associated with the proposed installation are unlikely to be significant at the receptor locations examined.
As a consequence, further mitigation measures are not considered necessary and residual effects are likely
to be minimal.

Calder Valley Skip Hire - Mearclough Road
Air Quality Impact Assessment
P a g e | 45
6. CONCLUSIONS
An assessment has been carried out to determine the local air quality impacts associated with the
operation of the proposed waste to energy facility.
Detailed air quality modelling using the AERMOD 7 dispersion model has been undertaken to predict the
impacts associated with stack emissions from the Site. As a worst-case, emissions from the site have been
assumed to occur at the IED limits. Actual emissions from the site are anticipated to be significantly lower.
For a proposed stack height of 15m, predicted maximum off-site concentrations are within the relevant
air quality standards for all pollutants considered. The significance of the predicted impact at sensitive
receptor locations has been assessed as negligible.
The predicted process contributions are also negligible compared with the critical levels and critical loads
for nutrient nitrogen deposition and acidification at nearby statutory sensitive habitat sites.
Based on the above information, it is considered that air quality does not pose a constraint to development
of the site as proposed.

Calder Valley Skip Hire - Mearclough Road
Air Quality Impact Assessment
P a g e | 46
(This page is intentionally left blank)

Calder Valley Skip Hire - Mearclough Road
Air Quality Impact Assessment
P a g e | 47
Appendix A – Air Quality Terminology
Term Definition Accuracy A measure of how well a set of data fits the true value.
Air quality objective Policy target generally expressed as a maximum ambient concentration to be achieved, either without exception or with a permitted number of exceedances within a specific timescale (see also air quality standard).
Air quality standard The concentrations of pollutants in the atmosphere which can broadly be taken to achieve a certain level of environmental quality. The standards are based on the assessment of the effects of each pollutant on human health including the effects on sensitive sub groups (see also air quality objective).
Ambient air Outdoor air in the troposphere, excluding workplace air.
Annual mean The average (mean) of the concentrations measured for each pollutant for one year. Usually this is for a calendar year, but some species are reported for the period April to March, known as a pollution year. This period avoids splitting winter season between 2 years, which is useful for pollutants that have higher concentrations during the winter months.
AQMA Air Quality Management Area.
DEFRA Department for Environment, Food and Rural Affairs.
Exceedance A period of time where the concentrations of a pollutant is greater than, or equal to, the appropriate air quality standard.
Fugitive emissions Emissions arising from the passage of vehicles that do not arise from the exhaust system.
LAQM Local Air Quality Management.
NO Nitrogen monoxide, a.k.a. nitric oxide.
NO2 Nitrogen dioxide.
NOx Nitrogen oxides.
O3 Ozone.
Percentile The percentage of results below a given value.
PM10 Particulate matter with an aerodynamic diameter of less than 10 micrometres.
ppb parts per billion The concentration of a pollutant in the air in terms of volume ratio. A concentration of 1 ppb means that for every billion (109) units of air, there is one unit of pollutant present.
ppm parts per million The concentration of a pollutant in the air in terms of volume ratio. A concentration of 1 ppm means that for every billion (106) units of air, there is one unit of pollutant present.
Ratification (Monitoring)
Involves a critical review of all information relating to a data set, in order to amend or reject the data. When the data have been ratified they represent the final data to be used (see also validation).
µg/m3 micrograms per cubic metre
A measure of concentration in terms of mass per unit volume. A concentration of 1ug/m3 means that one cubic metre of air contains one microgram (millionth of a gram) of pollutant.
UKAS United Kingdom Accreditation Service.
Uncertainty A measure, associated with the result of a measurement, which characterizes the range of values within which the true value is expected to lie. Uncertainty is usually expressed as the range within which the true value is expected to lie with a 95% probability, where standard statistical and other procedures have been used to evaluate this figure. Uncertainty is more clearly defined than the closely related parameter 'accuracy', and has replaced it on recent European legislation.

Calder Valley Skip Hire - Mearclough Road
Air Quality Impact Assessment
P a g e | 48
Term Definition
USA Updating and Screening Assessment.
Validation (modelling) Refers to the general comparison of modelled results against monitoring data carried out by model developers.
Validation (monitoring) Screening monitoring data by visual examination to check for spurious and unusual measurements (see also ratification).
Verification (modelling)
Comparison of modelled results versus any local monitoring data at relevant locations.

Calder Valley Skip Hire - Mearclough Road
Air Quality Impact Assessment
P a g e | 49
Appendix B – Air Quality Standards and Objectives
Pollutant Averaging
Period EAL / AQS (g/m3) Comments
Nitrogen dioxide (NO2)
annual 40 UK AQO and EU Limit Value
1-hour 200
UK AQO and EU Limit Value, not to be exceeded more than 18 times per annum,
equivalent to the 99.8th percentile of 1-hour means
Sulphur dioxide (SO2)
24-hour 125
UK AQO and EU Limit Value, not to be exceeded more than 3 times per annum,
equivalent to the 99.2nd percentile of 24-hour means
1-hour 350
UK AQO and EU Limit Value, not to be exceeded more than 24 times per annum,
equivalent to the 99.7th percentile of 1-hour means
15-minute 266 UK AQO, not to be exceeded more than 35 times per annum, equivalent to the 99.9th
percentile of 15-minute means
Carbon monoxide (CO) 8-hour 10,000 UK AQO and EU Limit Value
1-hour 30,000 EAL
Particulate matter (as PM10)
annual 40 UK AQO and EU Limit Value
24-hour 50
UK AQO and EU Limit Value, not to be exceeded more than 35 times per annum,
equivalent to the 90.4th percentile of 24 hour means
Particulate matter (as PM2.5)
annual 25 EU Limit Value
Benzene (C6H6) annual 5 AQO (England and Wales) and EU Limit Value
1-hour 195 EAL
Hydrogen Chloride (HCl) 1-hour 750 EAL
Hydrogen Fluoride (HF) 1 hour 160 EAL
monthly 16 EAL
Antimony (Sb) annual 5 EAL
1-hour 150 EAL
Arsenic (As) annual 0.006 EU Target Value
annual 0.003 EAL
Cadmium (Cd) annual 0.005 EU Target Value
Chromium III (CrIII) annual 5 EAL

Calder Valley Skip Hire - Mearclough Road
Air Quality Impact Assessment
P a g e | 50
1-hour 150 EAL
Chromium VI (CrVI) annual 0.0002 EAL
Cobolt (Co) annual 1 EAL
1-hour 30 EAL
Copper (Cu) annual 10 EAL
1-hour 200 EAL
Manganese (Mn) annual 0.15 EAL
1-hour 150 EAL
Lead (Pb) annual 0.25 UK AQO
annual 0.50 EU Limit Value
Mercury (Hg) annual 0.25 EAL
1-hour 7.5 EAL
Nickel (Ni) annual 0.02 EU Target Value
Thallium(Tl) annual 1 EAL
1-hour 30 EAL
Vanadium (V) annual 5 EAL
24-hour 1 EAL
Polycyclic Aromatic Hydrocarbons (PAH) as Benzo[a]Pyrene
annual 0.00025 UK AQO
annual 0.001 EU Limit Value
Polychlorinated Biphenyls (PCBs)
annual 0.2 EAL
1-hour 6 EAL
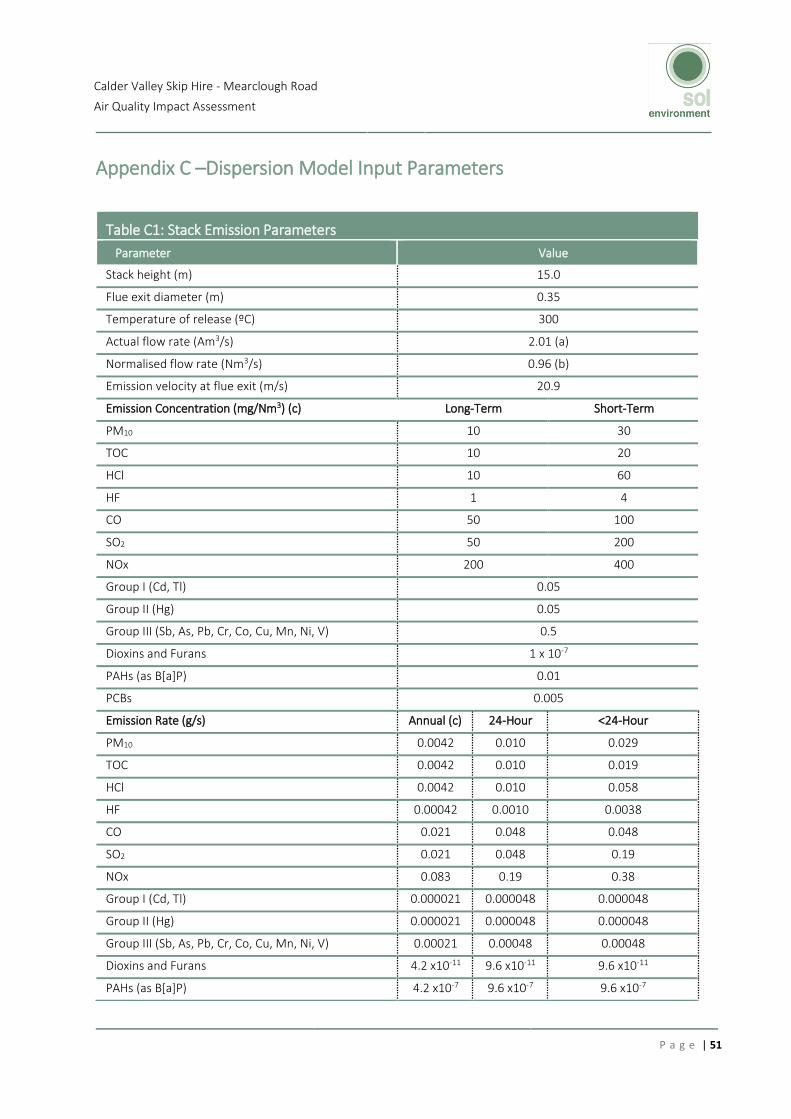
Calder Valley Skip Hire - Mearclough Road
Air Quality Impact Assessment
P a g e | 51
Appendix C –Dispersion Model Input Parameters
Table C1: Stack Emission Parameters
Parameter Value
Stack height (m) 15.0
Flue exit diameter (m) 0.35
Temperature of release (ºC) 300
Actual flow rate (Am3/s) 2.01 (a)
Normalised flow rate (Nm3/s) 0.96 (b)
Emission velocity at flue exit (m/s) 20.9
Emission Concentration (mg/Nm3) (c) Long-Term Short-Term
PM10 10 30
TOC 10 20
HCl 10 60
HF 1 4
CO 50 100
SO2 50 200
NOx 200 400
Group I (Cd, Tl) 0.05
Group II (Hg) 0.05
Group III (Sb, As, Pb, Cr, Co, Cu, Mn, Ni, V) 0.5
Dioxins and Furans 1 x 10⁻⁷
PAHs (as B[a]P) 0.01
PCBs 0.005
Emission Rate (g/s) Annual (c) 24-Hour <24-Hour
PM10 0.0042 0.010 0.029
TOC 0.0042 0.010 0.019
HCl 0.0042 0.010 0.058
HF 0.00042 0.0010 0.0038
CO 0.021 0.048 0.048
SO2 0.021 0.048 0.19
NOx 0.083 0.19 0.38
Group I (Cd, Tl) 0.000021 0.000048 0.000048
Group II (Hg) 0.000021 0.000048 0.000048
Group III (Sb, As, Pb, Cr, Co, Cu, Mn, Ni, V) 0.00021 0.00048 0.00048
Dioxins and Furans 4.2 x10⁻¹¹ 9.6 x10⁻¹¹ 9.6 x10⁻¹¹
PAHs (as B[a]P) 4.2 x10⁻⁷ 9.6 x10⁻⁷ 9.6 x10⁻⁷

Calder Valley Skip Hire - Mearclough Road
Air Quality Impact Assessment
P a g e | 52
PCBs 2.1 x10⁻⁶ 4.8 x10⁻⁶ 4.8 x10⁻⁶
(a) At 573K, 11% O2, dry, 101.3kPa
(b) At 11% O2, 273K, 101.3 kPa, dry
(c) Based on 3,796 operational hours per year.

Calder Valley Skip Hire - Mearclough Road
Air Quality Impact Assessment
P a g e | 53
Appendix D – Wind Roses by year, Bingley
2011
2012
0
0
3
1.5
6
3.1
10
5.1
16
8.2
(knots)
(m/s)
Wind speed
0°
22.5°
45°
67.5°
90°
112.5°
135°
157.5°
180°
202.5°
225°
247.5°
270°
292.5°
315°
337.5°
500
1000
1500
2000
0
0
3
1.5
6
3.1
10
5.1
16
8.2
(knots)
(m/s)
Wind speed
0°
22.5°
45°
67.5°
90°
112.5°
135°
157.5°
180°
202.5°
225°
247.5°
270°
292.5°
315°
337.5°
500
1000
1500
2000

Calder Valley Skip Hire - Mearclough Road
Air Quality Impact Assessment
P a g e | 54
2013
2014
0
0
3
1.5
6
3.1
10
5.1
16
8.2
(knots)
(m/s)
Wind speed
0°
22.5°
45°
67.5°
90°
112.5°
135°
157.5°
180°
202.5°
225°
247.5°
270°
292.5°
315°
337.5°
500
1000
1500
2000
C:\Mod\MetData\Bingley\Bingley_14.met
0
0
3
1.5
6
3.1
10
5.1
16
8.2
(knots)
(m/s)
Wind speed
0°
22.5°
45°
67.5°
90°
112.5°
135°
157.5°
180°
202.5°
225°
247.5°
270°
292.5°
315°
337.5°
500
1000
1500
2000

Calder Valley Skip Hire - Mearclough Road
Air Quality Impact Assessment
P a g e | 55
2015
0
0
3
1.5
6
3.1
10
5.1
16
8.2
(knots)
(m/s)
Wind speed
0°
22.5°
45°
67.5°
90°
112.5°
135°
157.5°
180°
202.5°
225°
247.5°
270°
292.5°
315°
337.5°
500
1000
1500
2000
2500

Calder Valley Skip Hire - Mearclough Road
Air Quality Impact Assessment
P a g e | 56
Appendix E – Environmental Assessment Levels for the Protection of Vegetation and Ecosystems
Critical Levels
Critical levels are thresholds of airborne pollutant concentrations above which damage may be sustained
to sensitive plants and animals.
The critical levels for the protection of vegetation and ecosystems (as defined by the EU Directive
2008/50/EC and the 2010 UK Air Quality Standards Regulations) that are relevant to the assessment are
summarised in Table E1.
Table E1: Critical Levels for the Protection of Vegetation and Ecosystems
Pollutant Averaging Period Concentration (g/m3)
Oxides of Nitrogen (NOx) Annual Mean 30
24-Hour Mean 75
Sulphur Dioxide (SO2) Annual Mean / Winter
Mean (31 Oct to 1 Mar)
10 (sensitive habitats with lichen and bryophytes)
20 (all other habitats)
Hydrogen Fluoride (HF) Weekly Mean 0.5
Daily Mean 5
Critical Loads
Critical loads refer to the threshold beyond which deposition of pollutants to water or land results in
measurable damage to vegetation and habitats. This takes the form of either gravitational settling of
particulate matter (dry deposition) or wet deposition, where atmospheric pollutants dissolve in water
vapour and then precipitate to the ground (e.g. as rain, snow, fog etc.).
Critical loads for eutrophication (nutrient nitrogen deposition) and background nutrient nitrogen
deposition rates have been obtained from the Air Pollution Information System (APIS) and are
summarised in Table E2 for the identified habitat sites.
Table E2: Critical Loads (Eutrophication) and Background Nutrient Nitrogen Deposition
Habitat Site Critical Load (kg
N/ha/a) Background N
Deposition (kg N/ha/a)
South Pennine Moors SAC/ SPA 5 28.6
Milner Royd LNR 10 40.7
Norland Moor LNR 10 29.8
Scarr and Long Woods LNR 10 40.7

Calder Valley Skip Hire - Mearclough Road
Air Quality Impact Assessment
P a g e | 57
The background nutrient nitrogen deposition rate exceeds the critical load at all of the identified habitat
sites.
For acidic deposition, the critical load of a habitat site is largely determined by the underlying geology
and soils. The critical load of acidification is defined by a critical load function (CLF) which describes the
relationship between the relative contributions of sulphur (S) and nitrogen (N) to the total acidification.
The critical load function is defined by the following parameters:
• CLmaxS, the maximum critical load of acidity for S, assuming there is no N deposition;
• CLminN, is the critical load of acidity due to nitrogen removal processes in the soil only (i.e.
independent of deposition); and
• CLmaxN, is the maximum critical load of acidity for N, assuming there is no S deposition.
The critical loads for acidification for the local habitat sites are presented in Table E3.
Table E3: Critical Loads (Acidification) and Background Nitrogen and Sulphur Acidification Rates
Habitat Site Critical Load (keq/ha/a)
Background Acidification (keq/ha/a)
Max S Min N Max N N S
South Pennine Moors SAC/ SPA 0.86 0.32 1.19 2.04 0.66
Milner Royd LNR 1.99 0.14 2.13 2.91 0.85
Norland Moor LNR 0.52 1.25 1.77 2.13 0.78
Scarr and Long Woods LNR 1.44 0.14 1.58 2.91 0.85