airport business & industry insights
TRANSCRIPT
special report:airports2014
May 2014
flightglobal.com/airlines | Airline Business | 25
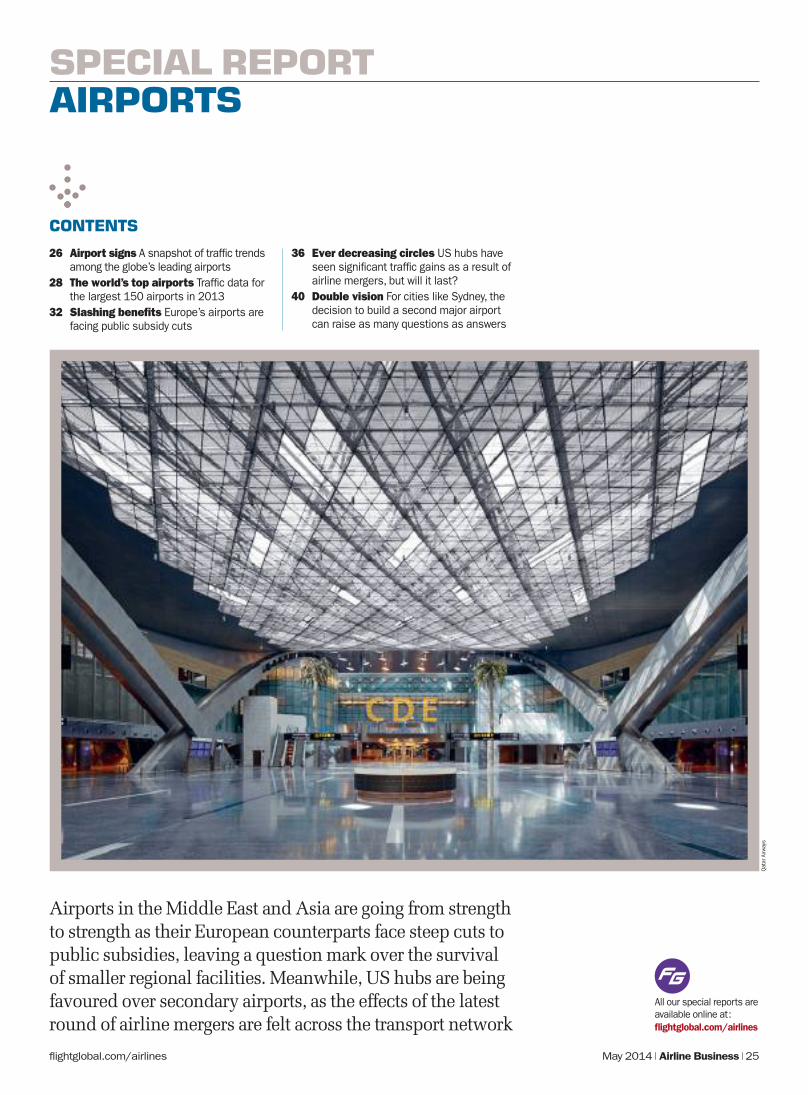
SPECIAL REPORT AIRPORTS
CONTENTS
26 Airport signs A snapshot of traffic trends among the globe’s leading airports
28 The world’s top airports Traffic data for the largest 150 airports in 2013
32 Slashing benefits Europe’s airports are facing public subsidy cuts
36 Ever decreasing circles US hubs have seen significant traffic gains as a result of airline mergers, but will it last?
40 Double vision For cities like Sydney, the decision to build a second major airport can raise as many questions as answers
May 2014
All our special reports are available online at : flightglobal.com/airlines
Airports in the Middle East and Asia are going from strength to strength as their European counterparts face steep cuts to public subsidies, leaving a question mark over the survival of smaller regional facilities. Meanwhile, US hubs are being favoured over secondary airports, as the effects of the latest round of airline mergers are felt across the transport network
Qat
ar A
irway
s

flightglobal.com/airlines26 | Airline Business |
AIRPORTS TRAFFIC SNAPSHOT
May 2014
USA288.4m
Europe134.5m
Middle East66.4m
Asia-Pacific212.7m
TOP 10 AIRPORTS – PASSENGER TRAFFIC BY AIRPORT ORIGIN
AIRPORT SIGNSPassenger numbers grew by 4% among the world’s biggest hubs in 2013, despite aircraft movements staying flat as the Gulf and Turkish hubs continue to drive industry growth
Atlanta Hartsfield
94.4m-1.1%Jak
arta
Soeka
rno
60.1m
+4.1%
Dal
las/
Fort
W
orth
60.5
m+3
.2%
Paris
Cha
rles
de G
aulle
62.1
m
+0.7
%
Dubai International66.4m+15.2%
Los AngelesInternational
66.7m+4.7%
Chicag
o
O’Hare
66.8m
+0.2%
TokyoInternational
68.9m+3.2%
London
Heathrow
72.4m
+3.3%Beijing
Capital83.7m+2.2%
TOP 100AIRPORTS TOTAL
3.45bn passengers+4.0%
TOP 10 AIRPORTS PASSENGER TRAFFIC
Delta Air Lines’ main hub Atlanta Hartsfield retained its position as the world’s busiest airport in 2013, despite traffic dropping by 1% to 94.4 million. Elsewhere, there was little change among the first five – although Beijing closed the gap with Atlanta after a 2% rise in traffic to 83.7 million. The biggest change in the top 10 was the
impressive growth of Dubai International, where passenger numbers jumped by 15% to 66.4 million. The hub moved up three places to become the seventh busiest airport in 2013. This continues the rapid growth which has seen it rise from being the 65th biggest airport in 2002.
TOP OF THE SHOP

flightglobal.com/airlines | Airline Business | 27May 2014
04
2.53
bn
06
2.76
bn
07
2.92
bn
08
2.89
bn
09
2.82
bn
10
3.00
bn
11
3.16
bn
123.
30bn
133.
45bn
05
2.66
bn
10-YEAR TREND: TOP 100 AIRPORTS TRAFFIC
Rex
Feat
ures
, Dub
ai A
irpor
ts
Data for all graphics: ACI World
Asia-Pacific1.31bn
Europe12.77m
Middle East4.83m
SouthAmerica2.43m
Africa0.56m
Asia-Pacific30.19m
North America13.98m
Europe1.10bn
REGIONAL SPLIT – TOP 150 AIRPORTS
North America1.24bnMiddle East
0.16bn
South America0.22bn
Africa0.03bn
Total passengers:
4.07bn
4.4%
Total cargo tonnes: 64.78m
-0.1%
PASSENGER GROWTH AMONG TOP 100: 2013 LEADERS
Rank City Airport Change %
91 Istanbul Sabiha Gökçen 27.0
55 Kunming Changshui 23.8
20 Kuala Lumpur International 19.1
71 Hangzhou Xiaoshan International 15.7
7 Dubai International 15.2
61 Chongqing Jianbei International 14.6
62 Bogota El Dorado International 14.2
85 Xiamen Gaoqi International 13.8
18 Istanbul Ataturk International 13.4
33 Sao Paulo Guarulhos International 12.3
60 Xi'an Xianyang International 12.3
NOTES: Rankings based on year-on-year change in passenger traffic for the Top 100 airports. Based on preliminary ACI World data for 2013.
With Turkish Airlines using it as a reliever for its operations at Ataturk, and its position as the main base for expanding Pegasus Airlines, it is little wonder that Istanbul’s Sabiha Gokcen International saw traffic soar by 27% to 18.8 million in 2013 – making it the fastest growing airport in the top 100.Four of the top 10 fastest growing gateways – Kunming, Hangzhou, Chongqing and
Xiamen – were in China, underlining the country’s continued economic growth, as well as the growing importance of its regional hubs. However, it was Bangkok’s Don Mueang International that saw the most impressive growth, with traffic rising by 175%, to take it just outside the top 100, thanks to its role as a low-cost alternative to and reliever for Suvarnabhumi International.
GROWING UP

flightglobal.com/airlines28 | Airline Business |
AIRPORTS RANKINGS
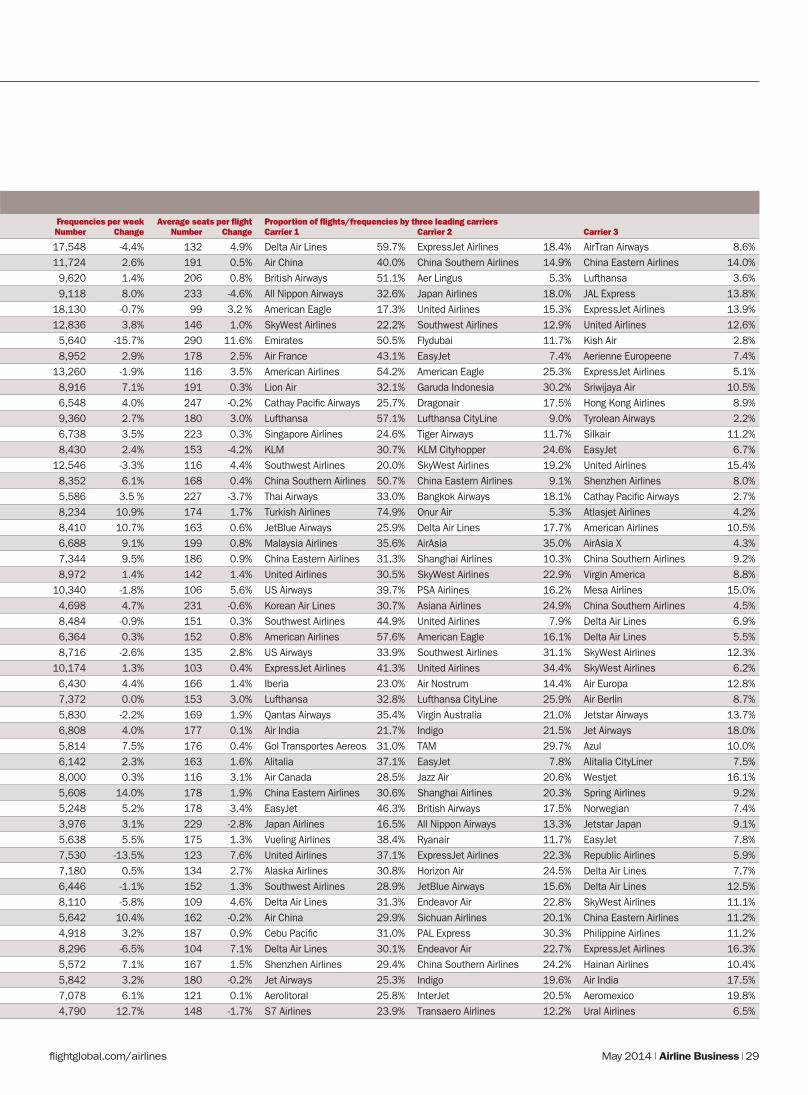
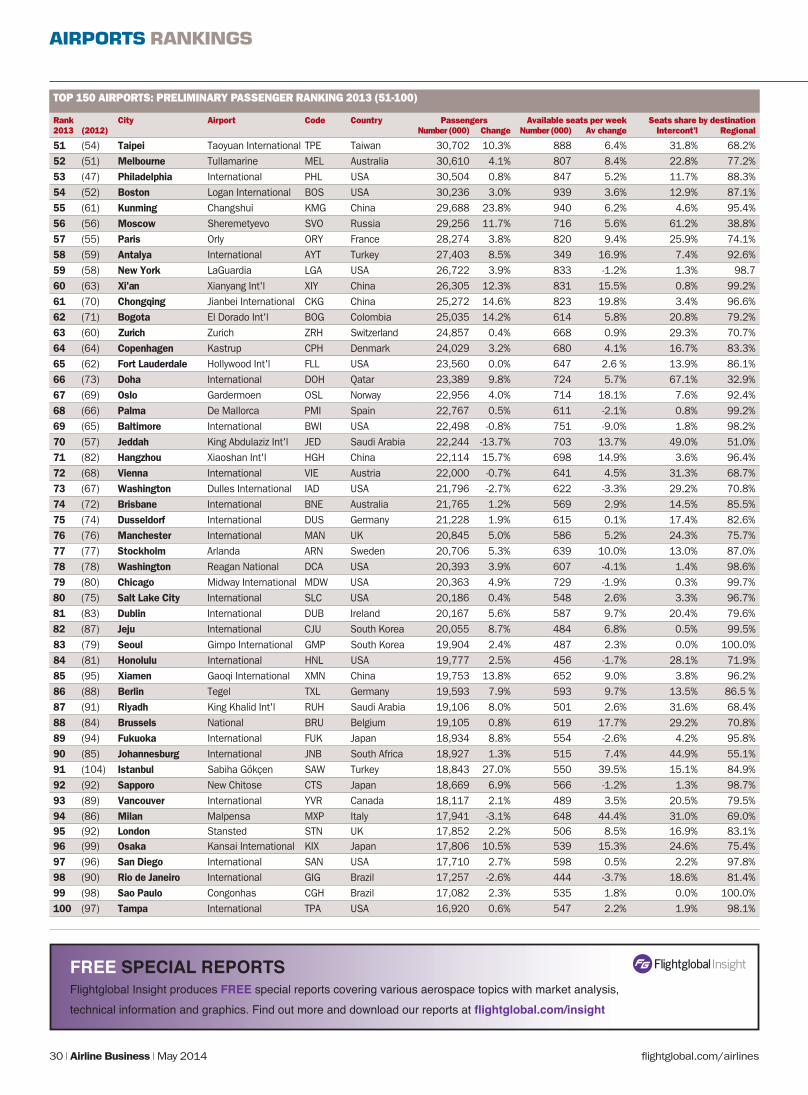
THE WORLD’S TOP AIRPORTSDATA COMPILED BY FLIGHTGLOBAL INSIGHT
May 2014
The Airline Business Top 150 airports passenger ranking, compiled using Airports Council International data, shows passenger growth of 4% in 2013, driven by the strong growth of both the Middle East and Asia-Pacific markets
TOP 150 AIRPORTS: PRELIMINARY PASSENGER RANKING 2013 (1-50) AND INNOVATA FREQUENCY/CAPACITY ANALYSIS (MAY 2014)
Rank City Airport Code Country Passengers Available seats per week Seats share by destination2013 (2012) Number (000) Change Number (000) Av change Intercont’l Regional
1 (1) Atlanta Atlanta Hartsfield Int'l ATL USA 94,431 -1.1% 2,321 0.3% 8.9% 91.1% 2 (2) Beijing Capital PEK China 83,712 2.2% 2,242 3.1% 16.3% 83.7% 3 (3) London Heathrow LHR UK 72,368 3.3% 1,979 2.3% 54.4% 45.6% 4 (4) Tokyo Haneda Int’l HND Japan 68,907 3.2% 2,123 3.0% 7.1% 92.9% 5 (5) Chicago O'Hare International ORD USA 66,777 0.2% 1,788 2.5% 13.1% 86.9% 6 (6) Los Angeles International LAX USA 66,668 4.7% 1,875 4.8% 19.8% 80.2% 7 (10) Dubai International DXB UAE 66,432 15.2% 1,637 -5.9% 79.5% 20.5% 8 (7) Paris Charles de Gaulle CDG France 62,053 0.7% 1,596 5.4% 51.2% 48.8% 9 (8) Dallas/Fort Worth International DFW USA 60,471 3.2% 1,537 1.5% 6.5% 93.5% 10 (9) Jakarta Soekarno Hatta CGK Indonesia 60,137 4.1% 1,707 7.4% 10.7% 89.3% 11 (12) Hong Kong International HKG China 59,594 6.3% 1,616 3.8% 48.8% 51.2% 12 (11) Frankfurt International FRA Germany 58,037 0.9% 1,688 5.7% 47.2% 52.8% 13 (15) Singapore Changi SIN Singapore 53,726 5.0% 1,502 3.8% 56.5% 43.5% 14 (16) Amsterdam Schiphol AMS Netherlands 52,569 3.0% 1,288 -1.9% 39.0% 61.0% 15 (13) Denver International DEN USA 52,556 -1.1% 1,451 1.0% 1.5% 98.5% 16 (18) Guangzhou Baiyun International CAN China 52,450 8.6% 1,402 6.6% 14.9% 85.1% 17 (14) Bangkok Suvarnabhumi BKK Thailand 51,363 -3.1% 1,266 -0.3% 61.5% 38.5% 18 (20) Istanbul Ataturk International IST Turkey 51,173 13.4% 1,437 12.7% 43.5% 56.5% 19 (17) New York JFK JFK USA 50,424 2.3% 1,375 11.5% 50.8% 49.2% 20 (27) Kuala Lumpur International KUL Malaysia 47,498 19.1% 1,331 10.0% 37.7% 62.3% 21 (21) Shanghai Pudong PVG China 47,190 5.1 % 1,366 10.5% 25.7% 74.3% 22 (22) San Francisco International SFO USA 44,946 1.2% 1,270 2.8% 17.2% 82.8% 23 (23) Charlotte Douglas CLT USA 43,457 5.4% 1,092 3.7% 6.4% 93.6% 24 (29) Seoul Incheon International ICN South Korea 41,680 6.5% 1,083 4.1% 51.2% 48.8% 25 (24) Las Vegas McCarran LAS USA 40,933 0.3% 1,278 -0.6% 3.7% 96.3% 26 (28) Miami International MIA USA 40,563 2.8% 964 1.1% 47.1% 52.9% 27 (25) Phoenix Sky Harbor PHX USA 40,342 -0.2% 1,176 0.1% 1.1% 98.9% 28 (26) Houston George Bush IAH USA 39,799 -0.2% 1,045 1.7% 14.1% 85.9% 29 (19) Madrid Barajas MAD Spain 39,718 -12.1% 1,069 5.8% 28.7% 71.3% 30 (30) Munich International MUC Germany 38,673 0.8% 1,126 3.0% 27.5% 72.5%31 (31) Sydney Kingsford Smith SYD Australia 38,254 2.4% 984 -0.4% 28.5% 71.5% 32 (37) Delhi Indira Gandhi Int'l DEL India 36,712 7.3% 1,206 4.1% 23.5% 76.5% 33 (43) Sao Paulo Guarulhos Int'l GRU Brazil 36,461 12.3 % 1,023 7.9% 23.0% 77.0% 34 (32) Rome Fiumicino FCO Italy 36,166 -2.2% 998 3.9% 29.0% 71.0% 35 (35) Toronto Pearson International YYZ Canada 36,109 3.4 % 930 3.5% 28.4% 71.6% 36 (39) Shanghai Hongqiao Int’l SHA China 35,600 5.2 % 997 16.2% 0.0% 100.0% 37 (36) London Gatwick LGW UK 35,463 3.6% 936 8.8% 21.8% 78.2% 38 (42) Tokyo Narita Int'l NRT Japan 35,315 7.5 % 912 0.2% 54.5% 45.5% 39 (34) Barcelona El Prat BCN Spain 35,197 0.2 % 987 6.8% 15.6% 84.4% 40 (38) Newark Liberty International EWR USA 35,016 2.9 % 926 -6.9% 27.3% 72.7% 41 (40) Seattle Tacoma International SEA USA 34,777 4.7 % 959 3.2% 7.6% 92.4% 42 (33) Orlando International MCO USA 34,769 -1.5 % 982 0.2% 9.7% 90.3% 43 (41) Minneapolis-St. Paul International MSP USA 33,892 2.2 % 885 -1.5% 3.6% 96.4% 44 (46) Chengdu Shuangliu Int'l CTU China 33,446 5.9 % 915 10.1% 4.4% 95.6% 45 (45) Manila Ninoy Aquino Int'l MNL Philippines 32,857 3.1 % 918 4.2% 35.7% 64.3% 46 (44) Detroit Wayne County DTW USA 32,390 0.5 % 862 0.2% 8.3% 91.7% 47 (49) Shenzhen Baoan International SZX China 32,268 9.1 % 929 8.7% 2.5% 97.5% 48 (48) Mumbai International BOM India 31,959 6.4 % 1,051 3.1% 25.9% 74.1% 49 (50) Mexico City Benito Juarez Int'l MEX Mexico 31,535 6.9 % 859 6.2% 14.5% 85.5% 50 (53) Moscow Domodedovo Int'l DME Russia 30,851 9.2 % 709 10.8% 62.1% 37.9%
flightglobal.com/airlines | Airline Business | 29May 2014
Frequencies per week Average seats per flight Proportion of flights/frequencies by three leading carriersNumber Change Number Change Carrier 1 Carrier 2 Carrier 3
17,548 -4.4% 132 4.9% Delta Air Lines 59.7% ExpressJet Airlines 18.4% AirTran Airways 8.6%11,724 2.6% 191 0.5% Air China 40.0% China Southern Airlines 14.9% China Eastern Airlines 14.0%9,620 1.4% 206 0.8% British Airways 51.1% Aer Lingus 5.3% Lufthansa 3.6%9,118 8.0% 233 -4.6% All Nippon Airways 32.6% Japan Airlines 18.0% JAL Express 13.8%
18,130 -0.7% 99 3.2 % American Eagle 17.3% United Airlines 15.3% ExpressJet Airlines 13.9%12,836 3.8% 146 1.0% SkyWest Airlines 22.2% Southwest Airlines 12.9% United Airlines 12.6%5,640 -15.7% 290 11.6% Emirates 50.5% Flydubai 11.7% Kish Air 2.8%8,952 2.9% 178 2.5% Air France 43.1% EasyJet 7.4% Aerienne Europeene 7.4%
13,260 -1.9% 116 3.5% American Airlines 54.2% American Eagle 25.3% ExpressJet Airlines 5.1%8,916 7.1% 191 0.3% Lion Air 32.1% Garuda Indonesia 30.2% Sriwijaya Air 10.5%6,548 4.0% 247 -0.2% Cathay Pacific Airways 25.7% Dragonair 17.5% Hong Kong Airlines 8.9%9,360 2.7% 180 3.0% Lufthansa 57.1% Lufthansa CityLine 9.0% Tyrolean Airways 2.2%6,738 3.5% 223 0.3% Singapore Airlines 24.6% Tiger Airways 11.7% Silkair 11.2%8,430 2.4% 153 -4.2% KLM 30.7% KLM Cityhopper 24.6% EasyJet 6.7%
12,546 -3.3% 116 4.4% Southwest Airlines 20.0% SkyWest Airlines 19.2% United Airlines 15.4%8,352 6.1% 168 0.4% China Southern Airlines 50.7% China Eastern Airlines 9.1% Shenzhen Airlines 8.0%5,586 3.5 % 227 -3.7% Thai Airways 33.0% Bangkok Airways 18.1% Cathay Pacific Airways 2.7%8,234 10.9% 174 1.7% Turkish Airlines 74.9% Onur Air 5.3% Atlasjet Airlines 4.2%8,410 10.7% 163 0.6% JetBlue Airways 25.9% Delta Air Lines 17.7% American Airlines 10.5%6,688 9.1% 199 0.8% Malaysia Airlines 35.6% AirAsia 35.0% AirAsia X 4.3%7,344 9.5% 186 0.9% China Eastern Airlines 31.3% Shanghai Airlines 10.3% China Southern Airlines 9.2%8,972 1.4% 142 1.4% United Airlines 30.5% SkyWest Airlines 22.9% Virgin America 8.8%
10,340 -1.8% 106 5.6% US Airways 39.7% PSA Airlines 16.2% Mesa Airlines 15.0%4,698 4.7% 231 -0.6% Korean Air Lines 30.7% Asiana Airlines 24.9% China Southern Airlines 4.5%8,484 -0.9% 151 0.3% Southwest Airlines 44.9% United Airlines 7.9% Delta Air Lines 6.9%6,364 0.3% 152 0.8% American Airlines 57.6% American Eagle 16.1% Delta Air Lines 5.5%8,716 -2.6% 135 2.8% US Airways 33.9% Southwest Airlines 31.1% SkyWest Airlines 12.3%
10,174 1.3% 103 0.4% ExpressJet Airlines 41.3% United Airlines 34.4% SkyWest Airlines 6.2%6,430 4.4% 166 1.4% Iberia 23.0% Air Nostrum 14.4% Air Europa 12.8%7,372 0.0% 153 3.0% Lufthansa 32.8% Lufthansa CityLine 25.9% Air Berlin 8.7%5,830 -2.2% 169 1.9% Qantas Airways 35.4% Virgin Australia 21.0% Jetstar Airways 13.7%6,808 4.0% 177 0.1% Air India 21.7% Indigo 21.5% Jet Airways 18.0%5,814 7.5% 176 0.4% Gol Transportes Aereos 31.0% TAM 29.7% Azul 10.0%6,142 2.3% 163 1.6% Alitalia 37.1% EasyJet 7.8% Alitalia CityLiner 7.5%8,000 0.3% 116 3.1% Air Canada 28.5% Jazz Air 20.6% Westjet 16.1%5,608 14.0% 178 1.9% China Eastern Airlines 30.6% Shanghai Airlines 20.3% Spring Airlines 9.2%5,248 5.2% 178 3.4% EasyJet 46.3% British Airways 17.5% Norwegian 7.4%3,976 3.1% 229 -2.8% Japan Airlines 16.5% All Nippon Airways 13.3% Jetstar Japan 9.1%5,638 5.5% 175 1.3% Vueling Airlines 38.4% Ryanair 11.7% EasyJet 7.8%7,530 -13.5% 123 7.6% United Airlines 37.1% ExpressJet Airlines 22.3% Republic Airlines 5.9%7,180 0.5% 134 2.7% Alaska Airlines 30.8% Horizon Air 24.5% Delta Air Lines 7.7%6,446 -1.1% 152 1.3% Southwest Airlines 28.9% JetBlue Airways 15.6% Delta Air Lines 12.5%8,110 -5.8% 109 4.6% Delta Air Lines 31.3% Endeavor Air 22.8% SkyWest Airlines 11.1%5,642 10.4% 162 -0.2% Air China 29.9% Sichuan Airlines 20.1% China Eastern Airlines 11.2%4,918 3.2% 187 0.9% Cebu Pacific 31.0% PAL Express 30.3% Philippine Airlines 11.2%8,296 -6.5% 104 7.1% Delta Air Lines 30.1% Endeavor Air 22.7% ExpressJet Airlines 16.3%5,572 7.1% 167 1.5% Shenzhen Airlines 29.4% China Southern Airlines 24.2% Hainan Airlines 10.4%5,842 3.2% 180 -0.2% Jet Airways 25.3% Indigo 19.6% Air India 17.5%7,078 6.1% 121 0.1% Aerolitoral 25.8% InterJet 20.5% Aeromexico 19.8%4,790 12.7% 148 -1.7% S7 Airlines 23.9% Transaero Airlines 12.2% Ural Airlines 6.5%
flightglobal.com/airlines30 | Airline Business |
AIRPORTS RANKINGS
May 2014
TOP 150 AIRPORTS: PRELIMINARY PASSENGER RANKING 2013 (51-100)
Rank City Airport Code Country Passengers Available seats per week Seats share by destination2013 (2012) Number (000) Change Number (000) Av change Intercont’l Regional
51 (54) Taipei Taoyuan International TPE Taiwan 30,702 10.3% 888 6.4% 31.8% 68.2% 52 (51) Melbourne Tullamarine MEL Australia 30,610 4.1% 807 8.4% 22.8% 77.2% 53 (47) Philadelphia International PHL USA 30,504 0.8% 847 5.2% 11.7% 88.3% 54 (52) Boston Logan International BOS USA 30,236 3.0% 939 3.6% 12.9% 87.1% 55 (61) Kunming Changshui KMG China 29,688 23.8% 940 6.2% 4.6% 95.4% 56 (56) Moscow Sheremetyevo SVO Russia 29,256 11.7% 716 5.6% 61.2% 38.8% 57 (55) Paris Orly ORY France 28,274 3.8% 820 9.4% 25.9% 74.1% 58 (59) Antalya International AYT Turkey 27,403 8.5% 349 16.9% 7.4% 92.6% 59 (58) New York LaGuardia LGA USA 26,722 3.9% 833 -1.2% 1.3% 98.7 60 (63) Xi'an Xianyang Int'l XIY China 26,305 12.3% 831 15.5% 0.8% 99.2% 61 (70) Chongqing Jianbei International CKG China 25,272 14.6% 823 19.8% 3.4% 96.6% 62 (71) Bogota El Dorado Int'l BOG Colombia 25,035 14.2% 614 5.8% 20.8% 79.2% 63 (60) Zurich Zurich ZRH Switzerland 24,857 0.4% 668 0.9% 29.3% 70.7% 64 (64) Copenhagen Kastrup CPH Denmark 24,029 3.2% 680 4.1% 16.7% 83.3% 65 (62) Fort Lauderdale Hollywood Int'l FLL USA 23,560 0.0% 647 2.6 % 13.9% 86.1% 66 (73) Doha International DOH Qatar 23,389 9.8% 724 5.7% 67.1% 32.9% 67 (69) Oslo Gardermoen OSL Norway 22,956 4.0% 714 18.1% 7.6% 92.4% 68 (66) Palma De Mallorca PMI Spain 22,767 0.5% 611 -2.1% 0.8% 99.2% 69 (65) Baltimore International BWI USA 22,498 -0.8% 751 -9.0% 1.8% 98.2% 70 (57) Jeddah King Abdulaziz Int'l JED Saudi Arabia 22,244 -13.7% 703 13.7% 49.0% 51.0% 71 (82) Hangzhou Xiaoshan Int'l HGH China 22,114 15.7% 698 14.9% 3.6% 96.4% 72 (68) Vienna International VIE Austria 22,000 -0.7% 641 4.5% 31.3% 68.7% 73 (67) Washington Dulles International IAD USA 21,796 -2.7% 622 -3.3% 29.2% 70.8% 74 (72) Brisbane International BNE Australia 21,765 1.2% 569 2.9% 14.5% 85.5% 75 (74) Dusseldorf International DUS Germany 21,228 1.9% 615 0.1% 17.4% 82.6% 76 (76) Manchester International MAN UK 20,845 5.0% 586 5.2% 24.3% 75.7% 77 (77) Stockholm Arlanda ARN Sweden 20,706 5.3% 639 10.0% 13.0% 87.0% 78 (78) Washington Reagan National DCA USA 20,393 3.9% 607 -4.1% 1.4% 98.6% 79 (80) Chicago Midway International MDW USA 20,363 4.9% 729 -1.9% 0.3% 99.7% 80 (75) Salt Lake City International SLC USA 20,186 0.4% 548 2.6% 3.3% 96.7% 81 (83) Dublin International DUB Ireland 20,167 5.6% 587 9.7% 20.4% 79.6% 82 (87) Jeju International CJU South Korea 20,055 8.7% 484 6.8% 0.5% 99.5% 83 (79) Seoul Gimpo International GMP South Korea 19,904 2.4% 487 2.3% 0.0% 100.0% 84 (81) Honolulu International HNL USA 19,777 2.5% 456 -1.7% 28.1% 71.9% 85 (95) Xiamen Gaoqi International XMN China 19,753 13.8% 652 9.0% 3.8% 96.2% 86 (88) Berlin Tegel TXL Germany 19,593 7.9% 593 9.7% 13.5% 86.5 %87 (91) Riyadh King Khalid Int'l RUH Saudi Arabia 19,106 8.0% 501 2.6% 31.6% 68.4% 88 (84) Brussels National BRU Belgium 19,105 0.8% 619 17.7% 29.2% 70.8% 89 (94) Fukuoka International FUK Japan 18,934 8.8% 554 -2.6% 4.2% 95.8% 90 (85) Johannesburg International JNB South Africa 18,927 1.3% 515 7.4% 44.9% 55.1%91 (104) Istanbul Sabiha Gökçen SAW Turkey 18,843 27.0% 550 39.5% 15.1% 84.9% 92 (92) Sapporo New Chitose CTS Japan 18,669 6.9% 566 -1.2% 1.3% 98.7% 93 (89) Vancouver International YVR Canada 18,117 2.1% 489 3.5% 20.5% 79.5% 94 (86) Milan Malpensa MXP Italy 17,941 -3.1% 648 44.4% 31.0% 69.0% 95 (92) London Stansted STN UK 17,852 2.2% 506 8.5% 16.9% 83.1% 96 (99) Osaka Kansai International KIX Japan 17,806 10.5% 539 15.3% 24.6% 75.4% 97 (96) San Diego International SAN USA 17,710 2.7% 598 0.5% 2.2% 97.8% 98 (90) Rio de Janeiro International GIG Brazil 17,257 -2.6% 444 -3.7% 18.6% 81.4% 99 (98) Sao Paulo Congonhas CGH Brazil 17,082 2.3% 535 1.8% 0.0% 100.0% 100 (97) Tampa International TPA USA 16,920 0.6% 547 2.2% 1.9% 98.1%
FREE SPECIAL REPORTSFlightglobal Insight produces FREE special reports covering various aerospace topics with market analysis,
technical information and graphics. Find out more and download our reports at

flightglobal.com/airlines | Airline Business | 31May 2014
TOP 150 AIRPORTS: PRELIMINARY PASSENGER RANKING 2013 (101-150)
Rank City Airport Code Country Passengers2013 (2012) Number (000) Change
101 (100) Brasilia International BSB Brazil 16,560 4.1% 102 (106) Abu Dhabi International AUH UAE 16,526 12.4% 103 (150) Bangkok Don Mueang Int'l DMK Thailand 16,479 175.4%104 (102) Okinawa Naha OKA Japan 16,040 6.6% 105 (107) Cancun International CUN Mexico 16,037 10.2% 106 (101) Lisbon Portela LIS Portugal 16,009 4.6% 107 (109) Santiago International SCL Chile 15,313 7.7% 108 (103) Helsinki Vantaa HEL Finland 15,273 2.8% 109 (108) Portland International PDX USA 15,030 4.4% 110 (110) Nanjing International NKG China 14,965 7.1% 111 (117) Lima Jorge Chavez Int'l LIM Peru 14,909 11.8% 112 (111) Auckland International AKL New Zealand 14,842 6.7%113 (112) Geneva International GVA Switzerland 14,340 3.9% 114 (115) Calgary International YYC Canada 14,314 4.9% 115 (119) Tel Aviv Ben Gurion Int'l TLV Israel 14,228 8.3% 116 (112) Montreal Trudeau Int'l YUL Canada 14,096 2.2% 117 (118) Osaka Itami International ITM Japan 13,824 4.6% 118 (116) Perth Perth PER Australia 13,810 3.3% 119 (114) Hamburg Hamburg HAM Germany 13,503 -1.4% 120 (104) Cairo International CAI Egypt 13,476 -9.2% 121 (121) Chennai International MAA India 12,961 1.5%122 (123) Malaga Malaga AGP Spain 12,904 2.7% 123 (126) St Petersburg Pulkovo LED Russia 12,854 15.0%124 (124) Bengaluru International BLR India 12,779 6.4% 125 (122) St Louis Lambert Int’l STL USA 12,570 -0.9% 126 (120) Athens International ATH Greece 12,519 -3.2%127 (129) Caracas Simon Bolivar CCS Venezuela 12,180 15.0% 128 (125) Nice Nice Cote d'Azur NCE France 11,554 3.3% 129 (140) Phuket International HKT Thailand 11,342 18.9% 130 (130) Houston William Hobby HOU USA 11,109 6.4% 131 (137) Moscow Vnukovo VKO Russia 11,108 14.5% 132 (127) Prague Vaclav Havel PRG Czech Rep 10,965 1.6% 133 (143) Ankara Esenboga Int'l ESB Turkey 10,960 17.8% 134 (139) Warsaw Frederic Chopin WAW Poland 10,684 11.4% 135 (128) Belo Horizonte Tancredo Neves CNF Brazil 10,526 -1.7% 136 (135) Nashville International BNA USA 10,351 5.2% 137 (133) Kolkata Netaji Subhas Bose CCU India 10,284 3.6% 138 (142) Izmir Adnan Menderes ADB Turkey 10,261 9.2% 139 (149) Tianjin Binhai International TSN China 10,036 19.6% 140 (141) Austin Bergstrom Int'l AUS USA 10,018 6.2% 141 (132) Kansas City International MCI USA 9,794 -2.1% 142 (146) Edinburgh Edinburgh EDI UK 9,775 6.3% 143 (134) Gran Canaria Las Palmas LPA Spain 9,765 -1.3% 144 (131) Oakland International OAK USA 9,743 -3.0% 145 (138) London Luton LTN UK 9,705 0.8% 146 (144) Nagoya Chubu International NGO Japan 9,702 4.9% 147 (145) Busan Gimhae Int’l PUS South Korea 9,681 5.2% 148 (148) Alicante Alicante ALC Spain 9,631 8.9% 149 (136) Stuttgart Stuttgart STR Germany 9,578 -1.5% 150 (147) Buenos Aires Jorge Newbery AEP Argentina 9,553 8.0%
NOTES: The survey is primarily based on preliminary returns to the Airports Council International and Innovata schedule data. Innovata data has been used for frequency and available seat statistics and is based on flight schedules files for the week of 12-18 May 2014 compared with the week 13-19 May 2013. SEAT SHARE INTERCONTINENTAL/REGIONAL: Split based on the following Innovata areas: North America, Central America, South America, Eastern Europe, Western Europe, Middle East, Australasia, South Asia, East Asia, Southeast Asia, Southern Africa. Frequencies are for passenger services only. SOURCE: ACI World/Innovata-part of Flightglobal
TOP 100 ALPHABETICAL INDEX
Airport Rank Airport Rank
Amsterdam Schiphol 14 Melbourne Tullamarine 52 Antalya International 58 Mexico City 49 Atlanta Hartsfield Int'l 1 Miami International 26 Baltimore International 69 Milan Malpensa 94 Bangkok Suvarnabhumi 17 Minneapolis-St. Paul 43 Barcelona-El Prat 39 Moscow Domodedovo 50 Beijing Capital 2 Moscow Sheremetyevo 56 Berlin Tegel 86 Mumbai International 48 Bogota - El Dorado Int'l 62 Munich International 30 Boston Logan Int'l 54 New York JFK 19 Brisbane International 74 New York LaGuardia 59 Brussels National 88 Newark Liberty Int'l 40 Charlotte Douglas 23 Orlando International 42 Chengdu Shuangliu Int'l 44 Osaka Kansai Int'l 96 Chicago Midway Int'l 79 Oslo Gardermoen 67 Chicago O'Hare Int'l 5 Palma de Mallorca 68 Chongqing Jianbei Int'l 61 Paris Charles de Gaulle 8 Copenhagen Kastrup 64 Paris Orly 57 Dallas/Fort Worth Int'l 9 Philadelphia Int'l 53 Delhi Indira Gandhi Int'l 32 Phoenix Sky Harbor 27 Denver International 15 Rio de Janeiro Int'l 98 Detroit Wayne County 46 Riyadh King Khalid Int'l 87 Doha International 66 Rome Fiumicino 34 Dubai International 7 Salt Lake City Int'l 80 Dublin International 81 San Diego International 97 Dusseldorf International 75 San Francisco Int'l 22 Fort Lauderdale 65 Sao Paulo Congonhas 99 Frankfurt International 12 Sao Paulo Guarulhos 33 Fukuoka International 89 Sapporo - New Chitose 92 Guangzhou Baiyun Int'l 16 Seattle Tacoma Int'l 41 Hangzhou Xiaoshan Int'l 71 Seoul Gimpo Int'l 83 Hong Kong Int'l 11 Seoul Incheon Int'l 24 Honolulu International 84 Shanghai Hongqiao Int'l 36 Houston George Bush 28 Shanghai Pudong Int'l 21 Istanbul Ataturk Int'l 18 Shenzhen Baoan Int'l 47 Istanbul Sabiha Gökçen 91 Singapore Changi 13 Jakarta Soekarno 10 Stockholm Arlanda 77 Jeddah King Abdulaziz 70 Sydney Kingsford Smith 31 Jeju International 82 Taipei Taoyuan Int'l 51 Johannesburg Int'l 90 Tampa International 100 Kuala Lumpur Int'l 20 Tokyo Haneda Int’l 4 Kunming Changshui 55 Tokyo Narita Int'l 38 Las Vegas McCarran 25 Toronto Pearson Int'l 35 London Gatwick 37 Vancouver International 93 London Heathrow 3 Vienna International 72 London Stansted 95 Washington Dulles Int'l 73 Los Angeles Int'l 6 Washington Reagan 78 Madrid Barajas 29 Xiamen Gaoqi Int'l 85 Manchester Int'l 76 Xi'an Xianyang Int'l 60 Manila Ninoy Aquino 45 Zurich 63

flightglobal.com/airlines32 | Airline Business |
European airports are being forced to wean themselves off state aid and become more efficient. But will small regional facilities be able to survive the proposed cuts?
AIRPORTS EUROPE
SLASHING BENEFITS
REPORTOLIVER CLARK LONDON
The dire financial state of many of Europe’s regional airports has been laid bare in new statistics recently released by trade body ACI Europe.
They show that 42.5% of Europe’s airports are making an annual loss – and this proportion rises the less traffic the airport handles.
Based on operating income alone, 59% of gateways handling between 1 million and 5 million passengers per annum are incurring an annual loss, while 73% of airports han-dling fewer than 1 million passengers are in the red. In an effort to reverse that trend, the European Commission is seeking to cut the public subsidies that airports can receive in a bid to encourage them to become profitable and reduce overcapacity.
The Commission plans to grade state aid entitlement for investment and operating assistance on a sliding scale based on annual passenger traffic, with aid “intensities” rang-
ing between 75% and 25%. Since April, oper-ating aid has ceased for airports with traffic exceeding 5 million passengers. Only in rare cases where a “clear market failure exists” will aid be granted.
Airports with under 3 million passengers will enter a 10-year “transitional period”, in which they are expected to wean themselves off operating aid and produce a business model that is self-sustaining. During that period, only 50% of funding gaps can be cov-ered by public grants.
The Commission recommends these air-ports “gradually increase airport charges for airlines, rationalise their activities, differenti-ate their business model or attract new air-lines and customers to fill idle capacity”.
Airports handling 700,000 passengers or fewer will be entitled to 80% of their existing operating grants, and facilities deemed to be in remote or peripheral areas of Europe will get even more.
May 2014
While ACI Europe director general Olivier Jankovec welcomes the decision to allow sig-nificant aid for airports under 700,000 passen-gers – the trade body calculates 800,000 pas-sengers per annum as the minimum needed to cover operating costs – he says some gate-ways could be forced to close.
CLOSURE RISK“There is a risk that some very small airports might close, because although the Commis-sion has revisited its initial proposal and now allows operating aid for airports up to 700,000 passengers a year, it still requires such aid to be not more than 80% of historic levels of aid airports have been receiving.
“I think you have a lot of airports that have done a lot of cost cutting already over the last few years and would find it very difficult to find this additional 20% reduction in their funding – so that might be a problem for some of these airports.”
Jankovec emphasises that the scale of any air-port closures is likely to be small, and says feed-
ESTIMATED REDUCTION IN OPERATING AID OVER 10 YEARS
Airport size (annual passengers) Previous aid Under new guidelines
0-200,000 €1.95 billion €974 million-1.95 billion200,000-500,000 €2.5 billion €1.25 billion500,000-1 million €183 million €92 million1-3 million €71 million €36 million3-5 million N/A N/ATOTAL €4.7 BILLION €2.4-3.3 BILLIONAVERAGE PER PASSENGER €6.20 €3.10-€4.30SOURCE: European Commission

flightglobal.com/airlines | Airline Business | 33
these airports and, indeed, retention of busi-ness at the airport.” In its new guidelines the Commission is also seeking to tackle the con-troversial issue of incentives offered by air-ports to airlines to open new routes.
Previously, the guidelines covering such grants were fairly vague, and this has led to numerous investigations by the Commission into arrangements it suspected constituted illegal state aid, such as its probes into deals between Ryanair and Charleroi airport.
Marketing support, rebates and incentive schemes – the typical levers that airports use to incentivise airlines – are still allowed under the new guidelines, but will now be
back from ACI members regarding the Commis-sion’s guidelines is generally good.
However, he also criticises the decision by the Commission to revisit the guidelines in five years, arguing that this could threaten airport investment.
“When you run a business, especially the airport business, which is about long-term planning, you need certainty beyond five years. So that is something we regret very much that the Commission did not give at least 10 or 15 years, so the issue will be reopened again,” he adds.
Declan Collier, chief executive of London City airport, is more scathing about the new guidelines: “To expect the economics of small regional airports to be assisted by the airlines is a bridge too far. I don’t think that the air-lines have an interest – and in many cases the financial strength – to help these airports.
NEW GUIDELINES“So I think the cessation of state aid will have an impact both on the provision of routes to
Europe’s airports have to clean up
their financial act
Rex
Fea
ture
s
Percentage of European airports reporting a yearly loss
42.5%
May 2014
expected to pass the so-called Market Econ-omy Operator test, which assesses whether in a similar situation a private operator would have seen the benefits of granting such aid.
Airlines departing from airports with fewer than 3 million passengers will receive a fixed level of start-up aid covering 50% of airport charges for three years. Member states are also encouraged to notify the Commission of their start-up schemes.
AID INVESTIGATIONSMichael Jürgen Werner, a partner with legal firm Norton Rose Fulbright, says the new regu-lations could bring much-needed clarity to the relationship between airports and airlines, but may prove difficult to enforce in practice.
“As far as the airports and national authori-ties stick to the new guidelines and the requirements set out therein, the procedures of state-aid investigations might decrease in the future,” he says.
“However, the Market Economy Operator test is difficult to tackle as it involves very complex economic analysis, which might even take the European Commission several years – as was shown in some recent cases, for example the investigation into the Berlin air-port, Frankfurt-Hahn airport and various oth-ers,” adds Werner. ■
Read more about how the Commission’s new guidelines will affect Europe’s airports:flightglobal.com/airportaid


We’re writing to confirm a date we made with our customers in 2008. The first LEAP engine began testing September 4, 2013. Right on schedule. Just like our last 21 engines.
Go to cfmaeroengines.com
CFM International is a 50/50 joint company between Snecma (Safran) and GE.
MORE TO BELIEVE IN
LEAP year
Superior performance | Lower cost of ownership | Greater reliability

36 | Airline Business | flightglobal.com/airlines
EVER DECREASING CIRCLES
REPORTEDWARD RUSSELL WASHINGTON DC
May 2014
US airline consolidation has allowed the country’s hub airports to grab an even bigger piece of the air traffic pie, but is it a short-term trend?

| Airline Business | 37flightglobal.com/airlines
Get
ty Im
ages
Not too long ago American Air-lines flew to Burbank and United Airlines to Oakland, two cities they had served for dec-ades, while Southwest Airlines
ringed cities like Washington DC with flights to secondary airports far from the centre.
Enter rapidly rising fuel prices, a major recession and a round of mega-mergers, and the landscape of airline services to airports in major regions has changed dramatically.
American and United have dropped their respective services to Burbank and Oakland while Southwest is on the cusp of becoming the third-largest carrier in terms of the num-ber of slots at Ronald Reagan Washington National airport, situated just over 6km (3.7 miles) from the White House.
“If you look at the major metro areas, you’re seeing a consolidation around one major air-port instead of two, or two instead of more,” says William Swelbar, a research engineer at the Massachusetts Institute of Technology’s International Center for Air Transportation and an executive vice-president at InterVistas. “It’s a way for airlines to serve metro areas without having redundant service.”
Major airports in the Boston, Dallas/Fort Worth, Los Angeles, Miami, New York, San Francisco and Washington DC regions all saw passenger traffic increase by as much as a quarter between 2007 and 2013 while, in most cases, traffic fell at secondary facilities in the same regions, according to an Airline Business analysis of passenger traffic in large multi-airport regions in the USA.
In all of these areas, low-cost carriers flocked to major airports and mainline carri-ers consolidated their operations following each airline’s respective merger. JetBlue Air-ways supplanted American Airlines and Delta Air Lines as the number one carrier in Boston; Delta has built a profitable dual hub at New York's JFK and LaGuardia airports; and Virgin America has successfully made inroads on United’s monopoly in San Fran-cisco. Growth at these airports even occurred as national traffic numbers fell. Only 826 mil-lion passengers flew in 2013, a 1.8% fall from the 841 million in 2007, US DOT data shows.
The San Francisco and Washington DC areas are examples of these shifts at work.
BAY SHIFTSan Francisco International airport has seen some of the most dramatic passenger traffic growth among major airports in the USA since 2007. It handled 45 million passengers in 2013, more than a quarter higher than six
years ago. Passenger numbers at nearby Oak-land International airport fell by about a third to 9.7 million in 2013 and those for San Jose International airport declined by 18% to 8.8 million during the same period.
Kimberly Becker Aguirre, director of avia-tion at San Jose airport, says the launch of Vir-gin America from San Francisco airport in 2007 was a turning point.
JetBlue and Southwest announced new ser-vices to the region’s primary airport the same year and have since shifted their focus there and away from Oakland and San Jose.
Competitive spirit is not the only driver behind the moves. Scott Laurence, vice-presi-dent of network planning and partnerships at JetBlue, said recently that low-cost carriers cannot command the same unit revenue pre-miums at Oakland and San Jose as they can at San Francisco.
This is one of the drivers behind the New York-based airline’s decision to place its new Mint premium product aboard a dedicated fleet of Airbus A321s on the New York JFK-San Francisco route from the second half of 2014, he adds.
JetBlue has no plans to expand its presence at either Oakland or San Jose beyond red-eyes to the east coast and limited services to its Long Beach focus city, says Laurence.
The carrier has since disclosed plans to end its red-eye between Oakland and Washington Dulles, citing a need to “free up aircraft” for its new service to Washington National air-port. In addition to JetBlue’s cuts, San Jose will lose both Alaska Airlines and Virgin America on the San Jose-Los Angeles route when they each end services on 5 April and 14 May, respectively.
United, long the dominant carrier at San Francisco, optimised its network in the bay area following its merger with Continental Airlines in 2010.
This included discontinuing services to Oakland in 2012, which the airline deter-mined that it could not support with only a few flights a day to Denver, and a significant build-up of its hub at San Francisco.
“San Francisco is the premier Asian gate-way from the United States… [and] is key to
“San Francisco is the premier Asian gateway from the United States”
JEFF SMISEKChief executive, United Airlines
May 2014
AIRPORTS USA

flightglobal.com/airlines38 | Airline Business |
our growth strategy to Asia,” said Jeff Smisek, chief executive of United, at the opening of the carrier’s new boarding area E at the airport in January. The Chicago-based carrier resumed nonstop service to Taipei on 29 March and Atlanta on 1 April, and will add new services to Chengdu on 9 June.
United’s capacity at San Francisco was up 15% to 36.8 billion ASKs and departures were up 13% to nearly 107,000 in 2013 compared with 2010, Flightglobal/Innovata data shows.
CAPITAL DESIREWashington National is in the midst of a pas-senger boom. Traffic increased 9% to 20.4 million from 2007 to 2013, and American’s recent divestiture of 43 slot pairs to JetBlue, Southwest and Virgin America has operator Metropolitan Washington Airports Authority (MWAA) expecting another 2.4 million annual passengers in the next few years.
“There’s been a series of regulatory deci-sions made that have made it easier for carri-ers that could not service Reagan National before to shift to the airport,” says Margaret McKeough, chief operating officer of MWAA. These actions include forcing mainline carri-ers to divest slots to LCCs in exchange for approval of various business deals and creat-ing new slots for flights outside Washington National’s 2,000km (1,250 miles) perimeter.
As a result, traffic at Washington Dulles, the region’s expansive but distant international airport, has fallen by 11% to 21.9 million pas-sengers between 2007 and 2013, according to data from the operator.
“It’s an imbalance in the distribution about the domestic passengers in this market,” says McKeough.
LCCs cannot get enough of the improved access. JetBlue gained eight slot pairs from the Delta-US Airways slot swap in 2011 and 16 pairs from the American-US Airways merger earlier in 2014. Southwest also bought 27 pairs and Virgin America four pairs from American. Southwest’s gains come despite ample access to Baltimore/Washington and Dulles airports.
Bob Jordan, the carrier’s chief commercial officer, says that Baltimore – where Southwest controls nearly 61% of the market, according to the DOT – is not a “meaningful alternative” for business and government passengers from Washington DC, despite being a “great airport”.
“Southwest wants to compete,” he said recently. “The only thing standing in our way to competing more effectively at Reagan is
access”. The Dallas-based airline will operate 44 daily flights from Washington National once it completes the roll-out of the new flights in November.
Only American, Delta and United will have larger slot portfolios.
Baltimore/Washington has yet to be hit by growth at Washington National. Passenger traffic increased by 6.9% to 22.5 million pas-sengers from 2007 to 2013, airport data shows. This trend is expected to continue as the airport invests $125 million in an expanded international concourse.
The slump in traffic at Dulles is not expected to continue.
McKeough calls the current imbalance a “short-term situation”, citing the airport’s large footprint and ability to expand as the Washington DC region adds an anticipated 2 million more residents by 2040.
Southwest has already disclosed plans to add new nonstop flights from Dulles to Las Vegas and San Diego in November, and United, which operates a large hub at the air-port, may be prompted to expand at the facil-ity with the loss of feed in the southeastern USA from its former codeshare partner US Airways and the decision to close its Cleve-land hub.
SHORT-TERM TRENDMWAA is not alone in its belief that the shift in traffic to primary airports is a short-term trend. The Airports Council International (ACI) North America sees passengers slowly return-ing to secondary airports in the San Francisco area as well as elsewhere around the USA. “It’s going back to the day that airlines see those secondary airports as a way to enter the market without competing directly with United at San Francisco,” says Matt Cornelius, managing director of air policy at the association.
Oakland and San Jose have seen new ser-vices on foreign carriers with Norwegian beginning services from the former to Oslo and Stockholm this May and ANA launching services from the latter to Tokyo Narita in 2013. Spirit Airlines has also selected Oak-land as its entry point to the Bay Area.
More shifts are likely. The American-US Airways merger is still in its early days, which includes a move by the latter into Oneworld from Star Alliance, and both Southwest and United continue to optimise their networks following their respective 2010 mergers, says Deborah McElroy, executive vice-president of policy and external affairs at ACI North America. “The deck chairs are still shifting,” she says. ■
AIRPORTS USA
May 2014
SAN FRANCISCO AREA AIRPORT PASSENGER TRAFFIC 2007 AND 2013
Airport Passenger traffic (millions)
2007 2013 Change
San Francisco 35.8 45.0 +9.2Oakland 14.6 9.7 -4.9San Jose 10.7 8.8 -1.9SOURCE: Airport operators
WASHINGTON DC AREA AIRPORT PASSENGER TRAFFIC 2007 AND 2013
Airport Passenger traffic (millions)
2007 2013 Change
Washington Dulles 24.7 21.9 -2.8Washington National 18.7 20.4 +1.7Baltimore/Washington 21.0 22.5 +1.5SOURCE: Airport operators
“The only thing standing in our way to competing effectively is access”
BOB JORDANCCO, Southwest Airlines


flightglobal.com/airlines40 | Airline Business |
For cities like Sydney, the decision to build a second major airport can raise as many questions as answers
AIRPORTS MULTI-HUBS
DOUBLE VISION
REPORTDAVID KNIBB BRISBANE
Australia’s government has finally announced the site for Sydney’s second airport. This may end a decades-long debate, but it is only the first of many questions
still facing one of the country’s most contentious projects.
Sydney offers lessons for any airport authority considering a new facility, and a reminder to airlines of what to expect.
Arguments have raged for years over whether, where, and when to build a second airport for Sydney. As Australia’s biggest hub, everyone knows that decisions affecting Syd-ney are critical to Australian aviation – indeed, to the nation’s economy. Whether to build a new airport, and where, are questions that have now been resolved in favour of a green-field site at Badgerys Creek, 55km (34 miles) west of the city. When and exactly what are still open questions.
Alan Joyce, chief executive of Qantas, keeps urging lawmakers to get on with it. However, managers of the current Kingsford Smith air-port, a mere 15km south of central Sydney, dis-pute studies warning that all peak hour slots at the current airport will be allocated by next year and it will hit full capacity by 2025. They claim any second airport is a “white elephant”, because Kingsford Smith could operate for at least another 20 years by relaxing its curfew and lifting its cap of 80 aircraft movements per hour.
Add a third runway and another terminal, they stress, and it could last even longer. This, of course, is a declaration of war to local resi-dents; they have the ear of elected officials and have even formed a political party to oppose further expansion.
INNER CONFLICTThis would all sound familiar in Toronto, where Porter Airlines is asking for a longer runway at Billy Bishop airport on an island near the city centre. Inner city airports every-where face these kinds of battles between pas-sengers who like the convenience of a close-in airport, and residents who would like it to go away. Porter, which only operates turboprops, wants Transport Canada to extend Billy Bish-op’s single runway and lift the ban on jet air-craft so it can operate Bombardier CSeries jets. Air Canada wants better access to Billy Bishop regardless of expansion, and WestJet wants in too. Conversely, city officials want a cap on passengers and flights.
Even after decisions are made, issues remain over what happens in the interim. If
May 2014

flightglobal.com/airlines | Airline Business | 41
Sydney residents want a new airport further away, while other parties claim
Kingsford Smith can be expanded
Rex
Fea
ture
s
May 2014
the best solution would be a new “state-of-the-art supersite”, and once it opens, Kings-ford Smith should close.
Warren Truss, Australia’s deputy prime minister and minister for infrastructure and regional development, simply says “it is clear the Sydney region will need another major airport”, but he does not define what “major” means.
Groot, who has helped plan airports on sev-eral continents, stresses that considerations beyond aviation will influence what type of airport to build. An international hub, for instance, works best in “a service-oriented metropolitan area with an export-oriented economy”. It needs good customs and immi-gration support, and it helps if the area is mul-tilingual. “The common wisdom is that a good hub also needs at least 30% O&D traf-fic,” says Groot, although “Atlanta does well with only 20%”.
Uta Kohse, managing partner of the Aachen-based Airport Research Center, stresses how important it is to “split passen-ger segments” in defining the roles of separate airports serving a common metropolitan area. She compares London's Heathrow and Gat-wick airports, on the one hand, with London City on the other. “London City is a good example of an inner city airport used by busi-ness travellers who are not transferring to other flights,” she says.
PERFECT SPLITExamples of good passenger segment splits, Kohse explains, are low-cost, charter, and short-haul operators that mostly carry O&D traffic, compared with full-service airlines that handle lots of transfer traffic.
“It is horrible,” she warns, when this latter type of airline must split operations between two airports.
Tension often exists, Groot says, between airport consultants and local promoters who have grandiose visions that their new airport will become the crossroads of the world. “There is a fine line between being optimistic and realistic,” he says.
work started tomorrow on Sydney’s second airport, it could still be years before Badgerys Creek opens. Meanwhile, Kingsford Smith’s annual passenger traffic, already over 38 mil-lion, keeps growing at 3.5% per year. How much more must the airport expand to keep pace with traffic, if only during the interim before Badgerys Creek opens?
POTENTIAL DISASTERSydney residents might consider the experi-ence at Quito, Ecuador. Its new airport was finished and ready to go in 2011, but sat idle for months because airlines resisted the move and local officials did not like the access roads. Then there is the potential for what might be called the Berlin nightmare, where Tegel airport was due to close when the new Willy Brandt Brandenburg airport opened in late 2011. Airlines added flights in anticipa-tion of the opening, but Brandenburg is still not finished and the latest estimates are that its first flight will not land before 2016. Mean-while, Berliners endure more low-flying air-craft and passengers describe overcrowded Tegel as “a disaster”.
The big question facing Sydney now is what type of airport to build on the Badgerys Creek site. Once that is resolved, other answers will fall into place.
But few people seem to have given this much thought – specifically, no one has undertaken for Sydney what airport planners call a market potential analysis.
Marnix Groot, senior consultant at Luf-thansa Consulting, is such a planner: “A mar-ket potential analysis, or MPA, is not the same thing as a traffic forecast,” Groot explains. “A traffic forecast is an extension of historic data. A MPA is more optimistic. It represents a less constrained model. A new airport’s potential can be more than a prediction based on traffic at the old airport.”
According to Groot, the MPA depends on what is contemplated for the new airport. He calls this “the concept”. Is this new airport intended to be a hub? How much of its traffic will be origin and destination (O&D)? Will it replace the old airport?
For purposes of a study on the economic effects of a second Sydney airport, the eco-nomics advisory practice Deloitte Access Eco-nomics, assumed that Badgerys Creek would only be a secondary airport. Taking the oppo-site view, Brett Godfrey, former chief execu-tive of what was then Virgin Blue, told the Royal Aeronautical Society in Sydney that
“A new airport’s potential can be more
than a prediction”MARNIX GROOT
Senior consultant, Lufthansa Consulting
flightglobal.com/airlines42 | Airline Business |
In advocating a “supersite” for Sydney, Brett Godfrey not only claimed that the world’s most impressive airports are in cities that have only one airport – he might have cited Singapore’s Changi airport – but he also offered three practical reasons: a single airport avoids expensive ground links to shuttle pas-sengers and cargo back and forth between air-ports; closing the old airport and selling its site can help fund the new one; and sticking with a single airport avoids airline resistance to having to move.
ONE CITY, TWO AIRPORTSGodfrey asks: “Having two airports – who are you going to get to move out to it? Are you going to send Qantas? Qantas won't go. Will Virgin go? No. Are you going to send Regional Express out there?” Because Badgerys Creek is 40km farther from the city than Kingsford Smith, these are not idle questions.
Kohse and Groot agree that airlines gener-ally dislike multiple airports serving the same city. Groot cites Shanghai, where the older airport at Hongqiao remained open after the launch of operations at Pudong. Shanghai-based China Eastern Airlines was forced to split its domestic and international networks, thus frustrating an effective hub. But he also points to New York City, where three airports serve the metropolitan area without much duplication because airlines have decided whether to use JFK or Newark as their hub.
“The argument that selling the old airport site to fund the new airport is sometimes raised,” Groot says, “but airport planners nor-mally don’t consider this.” For instance, part of the runway at Hong Kong’s old Kai Tak air-port became a cruise terminal, but other parts are still being sold, 16 years after flights moved to Chek Lap Kok. As Groot explains: “Proceeds from selling an old airport site can reimburse some costs of the new one, but often long after the fact.”
Sometimes the new airport replaces the old one and the latter closes.
This was the fate of Kai Tak, Denver’s Sta-pleton, and, more recently, Russia’s Rostov, Ecuador’s Quito, and China’s Hefei and Kun-
ming airports. Kuala Lumpur did a variation on this. After opening KL International, 50km from the capital, the airport authority scaled down Subang by demolishing its interna-tional terminal, converting that space into a business park, and limiting Subang to general aviation, military and turboprop operations.
Qatar’s Doha illustrates another variation. When the new Hamad International opens – now slated for May 2014 – Doha’s old airport will gradually be phased out. Akbar Al Baker, chief executive of Qatar Airways, the operator of the new airport, says Qatar “would prefer to have a soft opening to not put too much load on new systems and gradually ramp up the use of the airport”.
Ramping down the old airport can prove harder than planned. “As the closing date approaches,“ Groot says, “local businesses start to realise how much they like the con-venience of their downtown airport and they’d like it kept open.” Sometimes at the last minute they succeed. He cites Seoul’s Gimpo and Taipei’s Songshan as downtown airports that survived the launch of new air-ports, and now provide downtown to down-town flights.
By contrast, Bangkok’s close-in Don Mueang closed but then reopened to take pressure off the newer Suvarnabhumi airport. In 2012 the Thai government ordered all char-ters and low-cost carriers to relocate to Don Mueang – another example of Kohse’s “split-ting passenger segments”. As a result, Asia’s oldest operating airport is staging a comeback.
When a city retains multiple airports, the
downtown airport usually handles short-hauls, and the newer, more distant facility becomes the international hub. This is the pattern at most of the 30-40 cities around the world that host multiple airports. Exceptions include the suburban airports around Los Angeles, such low-cost airports as Mel-bourne’s Avalon, and Tokyo’s role reversals where close-in Haneda opened to overseas flights in 2010 and low-cost domestic carriers are creating bases at Narita.
Proponents advance various arguments to justify second airports. One of the most inter-esting comes from Beijing. Even though its Capital International airport, already the world’s second busiest, has room to grow, the government decided before embarking on more expansion to ask: “What is the ideal size of an airport?”.
Answering this question, it decided to build a second airport at Daxing on the oppo-site side of the city after planners had pon-dered not only the effects on passengers and air traffic control of expanding the Capital International airport even more, but also eco-nomic and social implications. The result is a policy called “one city, two airports”.
Groot says that Capital airport has attracted businesses to the north side of the city, while the less-developed south side “resembles the Third World”. The new policy is designed to disperse to both sides of the city the economic benefits of an airport, and simultaneously avoid some of the congestion that more expansion on the north would spawn.
DOUBLE TROUBLEAirlines are not thrilled. Once Daxing opens as Beijing’s second airport – now slated for 2018 – Chinese carriers may need to double their flights to serve both. If not, pity the poor passenger who must connect from one side of Beijing to the other.
Managing multiple airports brings its own set of issues. London’s major airports are sepa-rately owned and operated – and they com-pete with each other for traffic – but it is more typical for multiple airports serving the same city to share common management.
The Sydney Airport Corporation, which manages Kingsford Smith, has first right of refusal to manage any new airport built within 100km. Chairman Max Moore-Wilton says his group would consider exercising this option: “We will participate constructively, if there's a need for a second Sydney airport”. As far as he is concerned, however, it is still a question of whether, as well as when and what. Some airport debates never die. ■
AIRPORTS MULTI-HUBS
May 2014
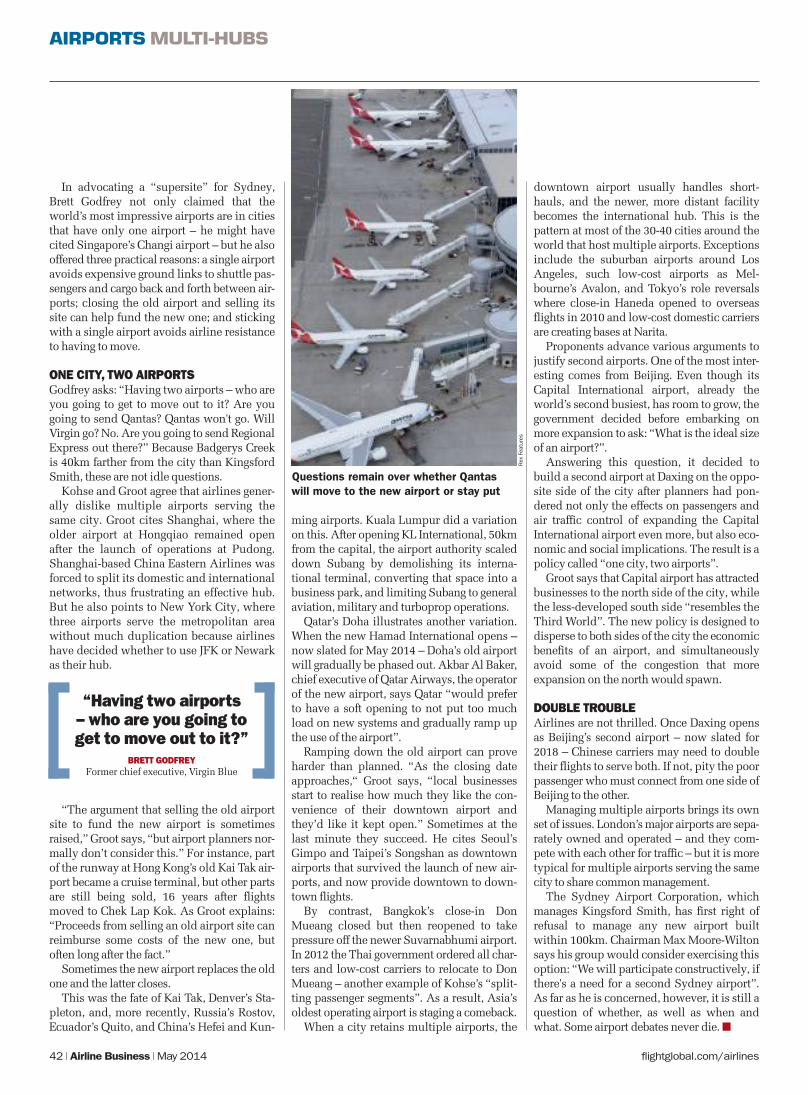
Questions remain over whether Qantas will move to the new airport or stay put
“Having two airports – who are you going to get to move out to it?”
BRETT GODFREYFormer chief executive, Virgin Blue
Rex
Fea
ture
s

Flightglobal InsightQuadrant House, The Quadrant, Sutton, Surrey, SM2 5AS, UKTel: +44 20 8652 8724 Email: [email protected] Web: www.flightglobal.com/insight