alameda point fiscal impact analysis - · pdf file17.12.2013 · alameda point...
TRANSCRIPT
AlamedaPoint
FiscalImpactAnalysis
DRAFTReport
November20,2013
Oakland Office: 1939 Harrison Street, Suite 430 Oakland, CA 94612

ii | P a g e
This page intentionally left blank.
iii | P a g e
TableofContents
Table of Contents ......................................................................................................................................... iii
I. Introduction ...................................................................................................................................... 1
II. Development Description ................................................................................................................. 4
III. Overview of Methodology ............................................................................................................ 5
Project Demographics ........................................................................................................................... 5
Estimated Assessed Value ..................................................................................................................... 6
IV. Estimated Revenues ...................................................................................................................... 7
General Fund Revenues ............................................................................................................................ 9
Property Tax .......................................................................................................................................... 9
Property Tax In‐Lieu of Vehicle License Fee (VLF) ................................................................................ 9
Property Transfer Tax ........................................................................................................................... 9
Sales Tax ................................................................................................................................................ 9
Utility Users Tax .................................................................................................................................. 10
Non General Fund Revenues .................................................................................................................. 10
Gas Tax (Fund 211) .............................................................................................................................. 10
Alameda County Measure B (Fund 215) ............................................................................................. 10
Urban Runoff (Fund 351) .................................................................................................................... 10
A‐17 Sewer Service Fee (Fund 602) .................................................................................................... 11
Library Fund (Fund 210) ...................................................................................................................... 11
Estimated Revenues ................................................................................................................................ 11
V. Estimated Expenditures .................................................................................................................. 13
Fire ...................................................................................................................................................... 13
Police ................................................................................................................................................... 14
Public Works ....................................................................................................................................... 14
Parks and Recreation .......................................................................................................................... 15
Library ................................................................................................................................................. 15
General Government .......................................................................................................................... 15
Planning and Building Services ........................................................................................................... 15
Estimated Expenditures ...................................................................................................................... 15
VI. Phasing and Mitigation ............................................................................................................... 16

iv | P a g e
VII. Sensitivity Analysis ...................................................................................................................... 17
Supporting Tables ................................................................................................................................... 18
1 | P a g e
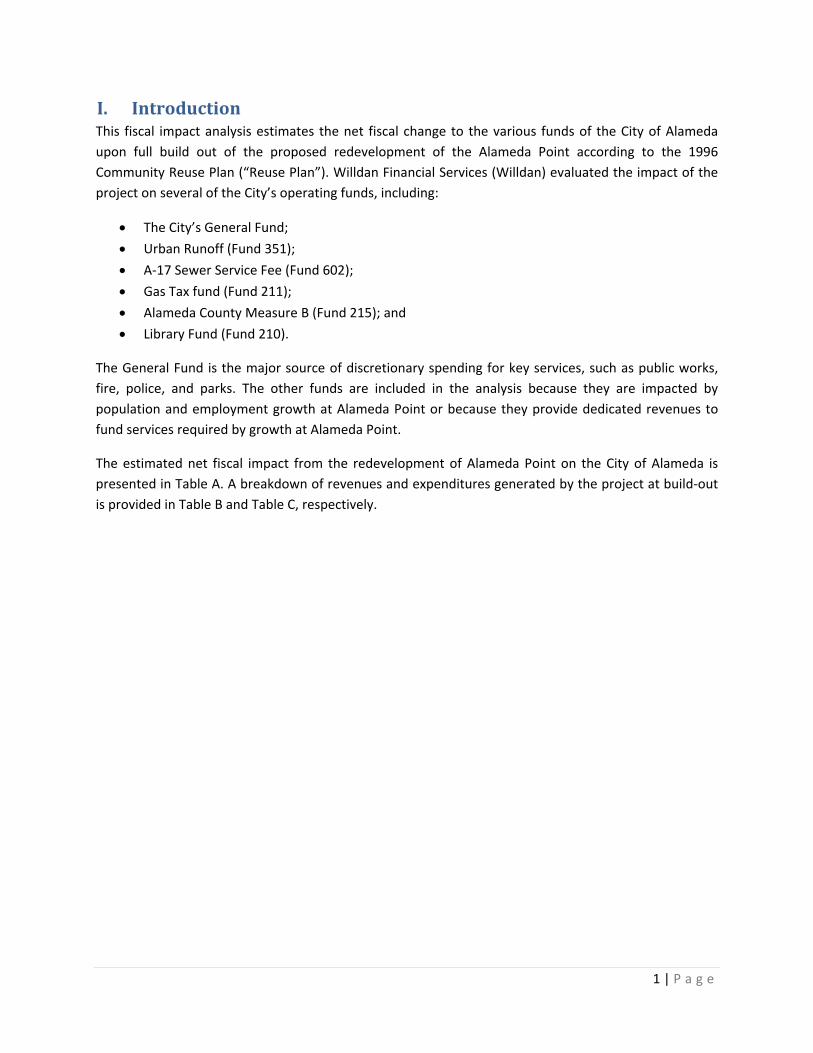
I. IntroductionThis fiscal impact analysis estimates the net fiscal change to the various funds of the City of Alameda
upon full build out of the proposed redevelopment of the Alameda Point according to the 1996
Community Reuse Plan (“Reuse Plan”). Willdan Financial Services (Willdan) evaluated the impact of the
project on several of the City’s operating funds, including:
The City’s General Fund;
Urban Runoff (Fund 351);
A‐17 Sewer Service Fee (Fund 602);
Gas Tax fund (Fund 211);
Alameda County Measure B (Fund 215); and
Library Fund (Fund 210).
The General Fund is the major source of discretionary spending for key services, such as public works,
fire, police, and parks. The other funds are included in the analysis because they are impacted by
population and employment growth at Alameda Point or because they provide dedicated revenues to
fund services required by growth at Alameda Point.
The estimated net fiscal impact from the redevelopment of Alameda Point on the City of Alameda is
presented in Table A. A breakdown of revenues and expenditures generated by the project at build‐out
is provided in Table B and Table C, respectively.
2 | P a g e
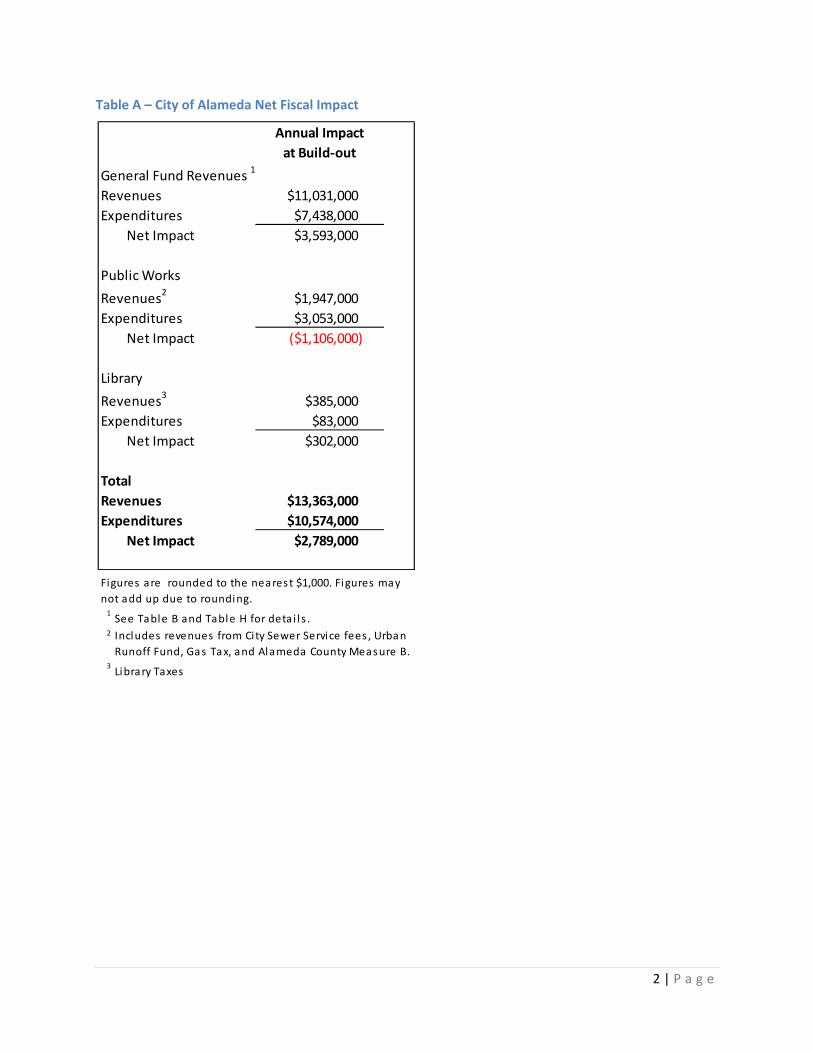
Table A – City of Alameda Net Fiscal Impact
Annual Impact
at Build‐out
General Fund Revenues 1
Revenues $11,031,000
Expenditures $7,438,000
Net Impact $3,593,000
Public Works
Revenues2
$1,947,000
Expenditures $3,053,000
Net Impact ($1,106,000)
Library
Revenues3
$385,000
Expenditures $83,000
Net Impact $302,000
Total
Revenues $13,363,000
Expenditures $10,574,000
Net Impact $2,789,000
1See Table B and Table H for detai l s .
2
3Library Taxes
Figures are rounded to the nearest $1,000. Figures may
not add up due to rounding.
Includes revenues from City Sewer Service fees , Urban
Runoff Fund, Gas Tax, and Alameda County Measure B.
3 | P a g e
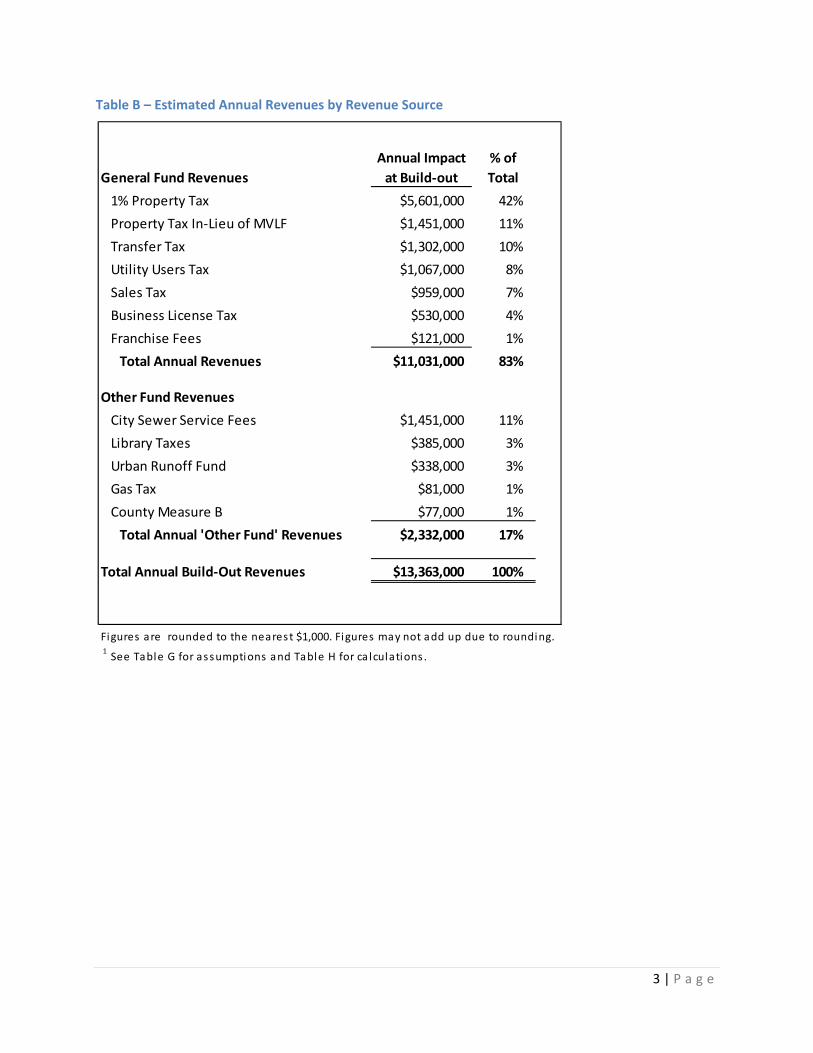
Table B – Estimated Annual Revenues by Revenue Source
General Fund Revenues
Annual Impact
at Build‐out
% of
Total
1% Property Tax $5,601,000 42%
Property Tax In‐Lieu of MVLF $1,451,000 11%
Transfer Tax $1,302,000 10%
Utility Users Tax $1,067,000 8%
Sales Tax $959,000 7%
Business License Tax $530,000 4%
Franchise Fees $121,000 1%
Total Annual Revenues $11,031,000 83%
Other Fund Revenues
City Sewer Service Fees $1,451,000 11%
Library Taxes $385,000 3%
Urban Runoff Fund $338,000 3%
Gas Tax $81,000 1%
County Measure B $77,000 1%
Total Annual 'Other Fund' Revenues $2,332,000 17%
Total Annual Build‐Out Revenues $13,363,000 100%
Figures are rounded to the nearest $1,000. Figures may not add up due to rounding.1See Table G for assumptions and Table H for ca lculations .

4 | P a g e
Table C – Estimated Annual Expenditures by Department
II. DevelopmentDescriptionThis analysis evaluates the impacts of the Reuse Plan. A summary of the development proposed under
the Reuse Plan is provided on Table D.
Expenditure Category Total % of Total
Fire $3,303,000 31%
Public Works $3,053,000 29%
Police $1,960,000 19%
Parks $1,900,000 18%
General Government $154,000 1%
Recreation $121,000 1%
Library $83,000 1%
Total Annual Expenditures $10,574,000 100%
Figures are are rounded to the nearest $1,000. Figures may not add up due to rounding.
1 See Table I for assumptions and Table J for calculations.
Fire, $3,303,000
Public Works,
$3,053,000
Police, $1,960,000
Parks, $1,900,000
General Government, $154,000
Recreation, $121,000
Library, $83,000

5 | P a g e
Table D – Proposed Development 1
III. OverviewofMethodologyThis section details the underlying methodology used to estimate the fiscal impact of the Reuse Plan on
City of Alameda. This analysis uses a combination of techniques to estimate the increases in revenues
and expenditures. Where possible, the increases in revenues and expenditures are modeled following
the manner in which they are collected and allocated, referred to as the case study methodology. For
example, increases in property tax revenues are based on an estimate of the increase in assessed
valuation associated with a given project component. In other cases, where this type of detailed
modeling is not possible due to lack of adequate data, Willdan utilized revenue and expenditure
multipliers that represent the current average per service population. Generally, this methodology
presents a reasonably conservative analysis of the potential fiscal impacts of the proposed
development.
The sources of revenue included in the analysis are property tax in‐lieu of motor vehicle license fees,
property transfer tax, 1% property tax, business license tax, utility users tax, sales tax, franchise fees,
fines and forfeitures, City sewer service fees, urban runoff fees, library taxes, gas tax fund, and Alameda
County Measure B tax revenues. The expenditures included in the analysis are: the Fire Department,
Police, Public Works, Parks and Recreation, and Library.
The net marginal tax revenue and service cost impacts of the Reuse Plan at Alameda Point have been
estimated on an on‐going annual basis. All results of the analysis are presented in current dollars, rather
than inflated to a future nominal value.
ProjectDemographicsAs described above, in order to estimate some of revenues and expenditures generated by the project,
Willdan utilized revenue and expenditure multipliers that represent the current average per service
population. In order to apply these multipliers, it is necessary to estimate the number of persons served
upon full build‐out according to the Reuse Plan.
Residential Units Total
Units 1,425
Commercial Space Sq. Ft.
Office 1,627,500
Manufacturing/Warehouse 3,060,500
Retail 300,000
Service 512,000
5,500,000
1Based on Reuse Plan.
6 | P a g e
The estimated number of persons served includes new residents and employees anticipated at Alameda
Point at build‐out. Resident projections are calculated assuming a factor of 2.27 persons‐per‐household.
Employee estimates are based on average of 1.62 employees per 1,000 square feet of commercial uses.
Willdan assumes that each employee has approximately one‐half (0.50) the impact of a resident on the
cost of providing certain municipal services. Therefore, depending on the service, the total number of
persons served could be equal to the on‐site residential population plus 0.50 the on‐site employee
population. The fiscal analysis uses this “total persons served” figure to estimate certain municipal
service revenue and cost increases. Estimated persons served at build‐out is presented in Table E.
Table E – Estimated Population and Employment at Build‐Out
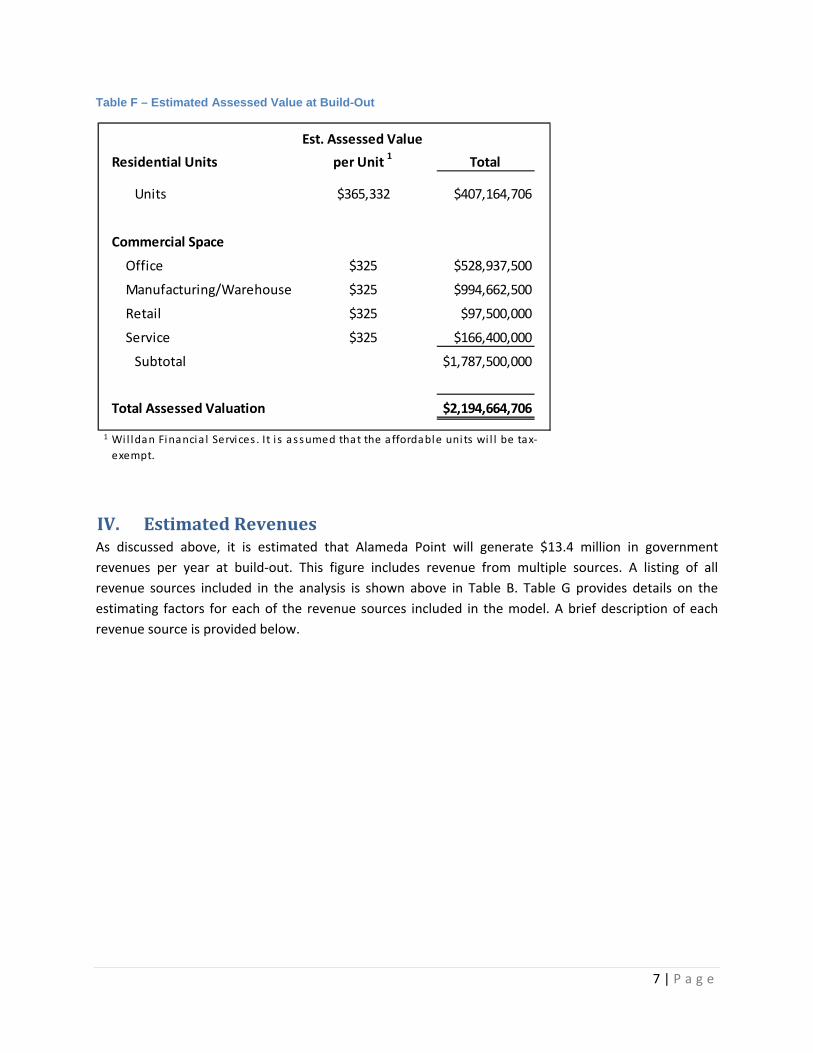
EstimatedAssessedValueSome of the estimated revenues, such as property taxes and property transfer tax, are based on the
estimated net increase in assessed value associated with the implementation of the Reuse Plan. Table F
presents the estimated assessed value of the project at build‐out.
Residents
Residents
per Unit 1
Total
Units 2.27 3,240
Commercial Employees
Empl. Per
1,000 sq. ft. 1
Total
Office 1.62 2,636
Manufacturing/Warehouse 1.62 4,957
Retail 1.62 486
Service 1.62 829
1.62 8,909
Commercial Resident Equivalents
Empl. Per
Res. 1
Total
Office 0.5 1,318
Manufacturing/Warehouse 0.5 2,479
Retail 0.5 243
Service 0.5 415
4,455
Total Daytime Population 2
12,149
Total Resident Equivalent Population 7,695
1Wi l ldan Financia l Services .
2Daytime population i s the tota l number of res idents plus the tota l number of employees .
7 | P a g e
Table F – Estimated Assessed Value at Build-Out
IV. EstimatedRevenuesAs discussed above, it is estimated that Alameda Point will generate $13.4 million in government
revenues per year at build‐out. This figure includes revenue from multiple sources. A listing of all
revenue sources included in the analysis is shown above in Table B. Table G provides details on the
estimating factors for each of the revenue sources included in the model. A brief description of each
revenue source is provided below.
Residential Units
Est. Assessed Value
per Unit 1
Total
Units $365,332 $407,164,706
Commercial Space
Office $325 $528,937,500
Manufacturing/Warehouse $325 $994,662,500
Retail $325 $97,500,000
Service $325 $166,400,000
Subtotal $1,787,500,000
Total Assessed Valuation $2,194,664,706
1 Wi l ldan Financia l Services . It i s assumed that the affordable units wil l be tax‐
exempt.
8 | P a g e
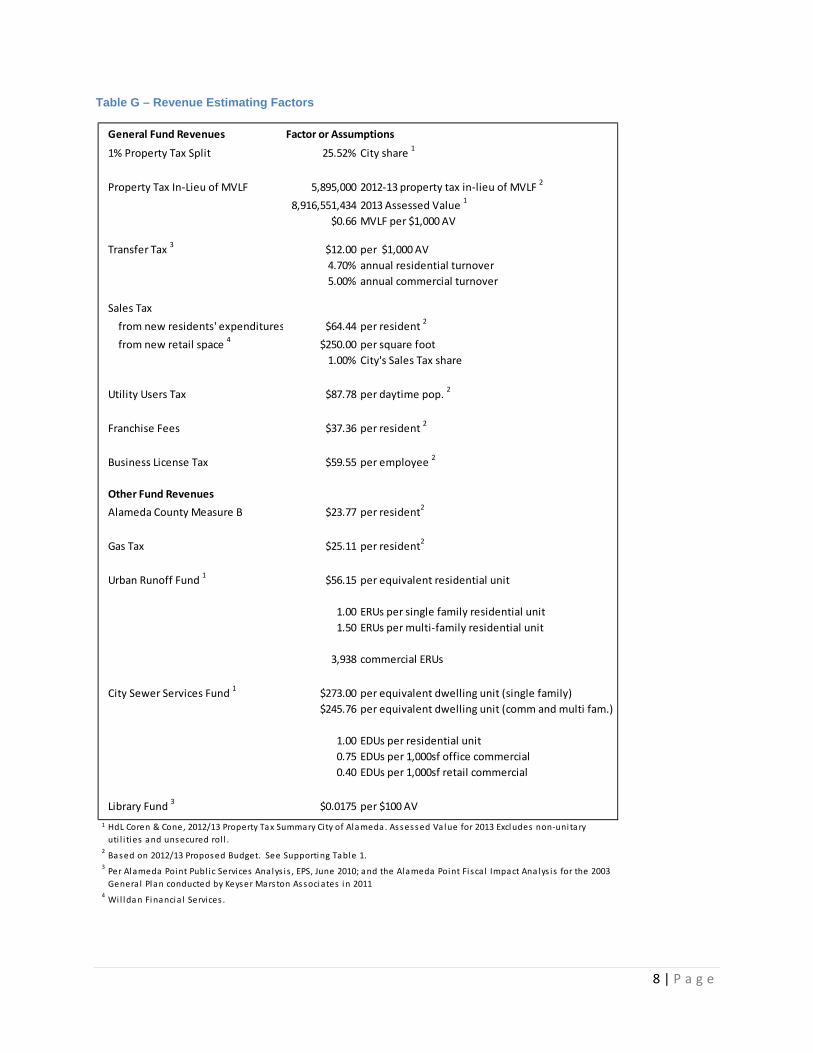
Table G – Revenue Estimating Factors
General Fund Revenues Factor or Assumptions
1% Property Tax Split 25.52% City share 1
Property Tax In‐Lieu of MVLF 5,895,000 2012‐13 property tax in‐lieu of MVLF 2
8,916,551,434 2013 Assessed Value 1
$0.66 MVLF per $1,000 AV
Transfer Tax 3
$12.00 per $1,000 AV
4.70% annual residential turnover
5.00% annual commercial turnover
Sales Tax
from new residents' expenditures $64.44 per resident 2
from new retail space 4
$250.00 per square foot
1.00% City's Sales Tax share
Utility Users Tax $87.78 per daytime pop. 2
Franchise Fees $37.36 per resident 2
Business License Tax $59.55 per employee 2
Other Fund Revenues
Alameda County Measure B $23.77 per resident2
Gas Tax $25.11 per resident2
Urban Runoff Fund 1
$56.15 per equivalent residential unit
1.00 ERUs per single family residential unit
1.50 ERUs per multi‐family residential unit
3,938 commercial ERUs
City Sewer Services Fund 1
$273.00 per equivalent dwelling unit (single family)
$245.76 per equivalent dwelling unit (comm and multi fam.)
1.00 EDUs per residential unit
0.75 EDUs per 1,000sf office commercial
0.40 EDUs per 1,000sf retail commercial
Library Fund 3
$0.0175 per $100 AV
1
2
3
4
Per Alameda Point Publ ic Services Analys i s , EPS, June 2010; and the Alameda Point Fisca l Impact Analys is for the 2003
General Plan conducted by Keyser Marston Associates in 2011
Wil ldan Financia l Services .
Based on 2012/13 Proposed Budget. See Supporting Table 1.
HdL Coren & Cone, 2012/13 Property Tax Summary City of Alameda. Assessed Value for 2013 Excludes non‐unitary
uti l i ties and unsecured rol l .

9 | P a g e
GeneralFundRevenues
PropertyTaxThe property taxes the City will receive from the project are derived from the total assessed value of
new development in Alameda Point and the City’s property tax allocation share of the one percent ad
valorem property tax. According to HdL Coren & Cone, on average, the City of Alameda receives 25.52%
of the one percent ad valorem property tax.1 The City is also pursuing the possibility of using an
Infrastructure Financing District (IFD) to fund a portion of the infrastructure required for development of
the Reuse Plan. An IFD would use a portion of the property tax revenues generated to fund debt service
on infrastructure bonds. Any resulting fiscal deficit from establishment of an IFD would be mitigated
through a services financing district, such as a Community Facilities District (CFD).
PropertyTaxIn‐LieuofVehicleLicenseFee(VLF)As a part of the State Budget Act of 2004, the California State Legislature cut the backfill to cities and
counties for reductions in the VLF and in return gave cities and counties additional property tax revenue.
This revenue swap is described in detail in “The VLF for Property Tax Swap of 2004: Facts for Local
Officials”.2 Revenue and Taxation Code Section (c)(1)(B)(i) specifies that in FY05‐06 and beyond, the VLF
Adjustment Amount for each city and county is to grow in proportion to the growth of gross assessed
valuation in that jurisdiction from the prior year.
PropertyTransferTaxProperty transfer tax is based on the assessed value of the development’s land uses and the anticipated
turnover rate of properties over time. This fiscal impact analysis is based on the assumption that the
project’s residential units will turn over approximately once every 21 years (4.70 percent per year) while
commercial property will turn over once every 20 years (5.0 percent per year) while. The City receives a
property transfer tax of $12.00 per $1,000 of transferred value upon sale of property.
SalesTaxSales tax of one (1) percent goes to the City. Willdan assumes that the project will generate new retail
sales tax due to expenditures from new residents as well as new retail square footage. The average per
resident is based on the City’s projected sales tax revenues reported in the budget for fiscal year 2012‐
13. The sales per square foot factor for new retail, is estimated by Willdan based on market trends.
Willdan also assumes that commercial development will not generate any sales tax from b2b (business
to business) sales.
BusinesslicensesThis is an annual tax levied upon all businesses operating within the City. The estimates from the Project
are based on Citywide average per employee.
1 HdL Coren & Cone, 2012/13 Property Tax Summary, City of Alameda. The 25.52% estimate is net of state mandated contributions to the Educational Revenue Augmentation fund (ERAF). 2 www.californiacityfinance.com/VLFswapNtakeFAQ.pdf.
10 | P a g e
FranchiseFeesFranchise fees are received by the City from utility providers serving the community, including Alameda
Municipal Power (AMP). These companies pay the City a franchise fee based on a percentage of their
revenue earned within the City limits. These fees serve as compensation for, among other things, wear
and tear on City streets. Franchise fees can change, among other things, when the customer base
expands, when additional services are used, or when rates change.
The estimated Franchise Fee increase related to the Project is based on a Citywide average per resident.
Franchise fee revenues from AMP are excluded from the analysis.
UtilityUsersTaxUtility users tax is 7.5 percent of utility bills for utility users (residential and/or commercial) within the
City. Water service is excluded from the tax. The estimates from the Project are based on Citywide
averages per daytime population (i.e., total residents and workers).
NonGeneralFundRevenues
GasTax(Fund211)The City is allocated a portion of gas tax revenue for the design and engineering activities related to
street improvements. The estimates from the Project are based on Citywide average per resident.
AlamedaCountyMeasureB(Fund215)The City of Alameda receives a share of the County’s proceeds of a one‐half cent sales tax increase
approved by Alameda County voters in 2000. Measure B funds are used for capital projects, such as
resurfacing, sidewalks, and traffic signal upgrades, as well as Paratransit service and bicycle and
pedestrian improvements. Funds are also used to maintain street infrastructure (e.g. pothole patching,
controller replacement, signal pole painting, etc.).
The City’s share of Alameda County Measure B is based on a variety of complex formulas depending on
the type of funding granted. For example, local streets and roads funding is allocated on a combination
of population and road miles. The estimates from the Project are based on Citywide average per
resident.
UrbanRunoff(Fund351)The Urban Runoff Fund accounts for revenues from the Storm Water Fee used for expenditures
associated with the City’s Clean Water Program, which is designed to mitigate the effects of pollution
entering the City’s storm water system. The City currently uses the funds to perform drainage
maintenance and street sweeping, as well as ongoing capital repair.
The Fee is based on the amount of pollution that the City estimates enters the municipal storm water
system as a result of the installation or maintenance of impervious surfaces. The current Storm Water
Fee is $56.15 per Equivalent Residential Unit (ERU).

11 | P a g e
A‐17SewerServiceFee(Fund602)The fund accounts for revenues and expenditures related to the operation of the municipal sewer
system including operations, maintenance, capital financing, debt service, billing, and collections.
Revenues are generated from Sewer Service Fees, which are currently $273.00 per Equivalent Dwelling
Unit (EDU).
LibraryFund(Fund210)The fund receives a special tax of $0.0175 per $100 in assessed value to support operation of the City’s
branch library system, including staff, collections, and facility maintenance.
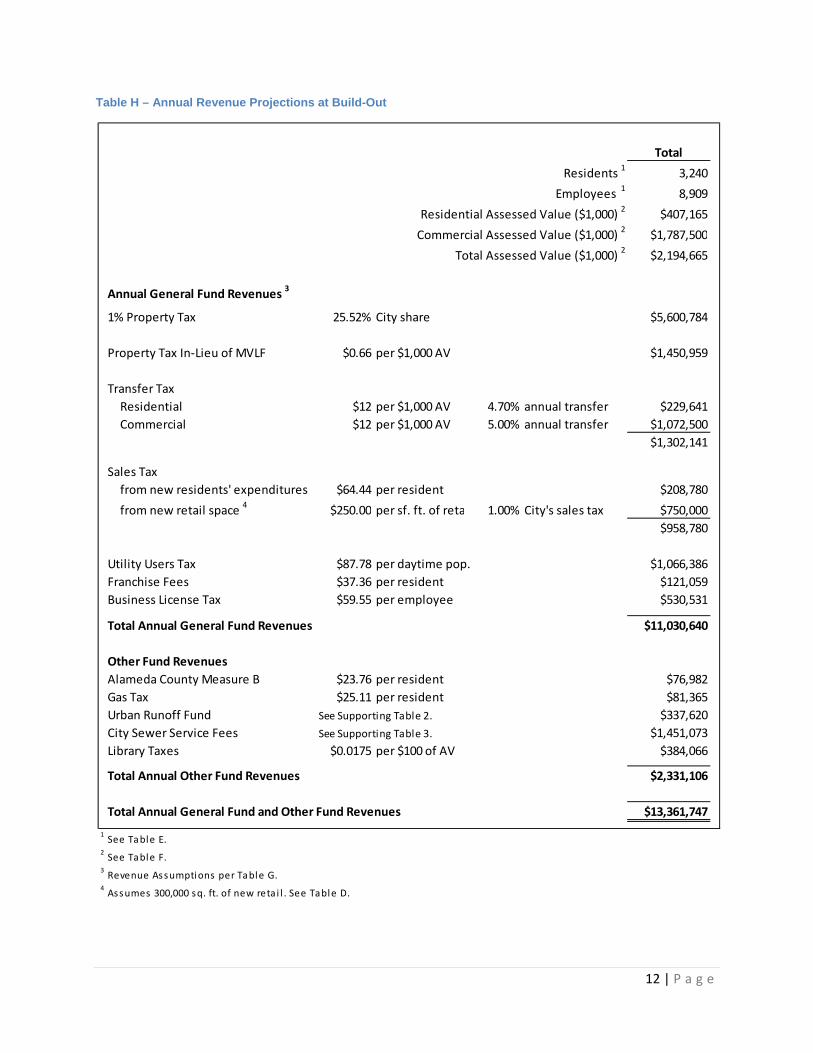
EstimatedRevenuesThe factors described above are used to estimate the revenues that will be generated by the project
upon build‐out. Table H presents the calculations for estimating these revenues.
12 | P a g e
Table H – Annual Revenue Projections at Build-Out
Total
Residents 1
3,240
Employees 1
8,909
Residential Assessed Value ($1,000) 2
$407,165
Commercial Assessed Value ($1,000) 2
$1,787,500
Total Assessed Value ($1,000) 2
$2,194,665
Annual General Fund Revenues 3
1% Property Tax 25.52% City share $5,600,784
Property Tax In‐Lieu of MVLF $0.66 per $1,000 AV $1,450,959
Transfer Tax
Residential $12 per $1,000 AV 4.70% annual transfer $229,641
Commercial $12 per $1,000 AV 5.00% annual transfer $1,072,500
$1,302,141
Sales Tax
from new residents' expenditures $64.44 per resident $208,780
from new retail space 4
$250.00 per sf. ft. of reta 1.00% City's sales tax $750,000
$958,780
Utility Users Tax $87.78 per daytime pop. $1,066,386
Franchise Fees $37.36 per resident $121,059
Business License Tax $59.55 per employee $530,531
Total Annual General Fund Revenues $11,030,640
Other Fund Revenues
Alameda County Measure B $23.76 per resident $76,982
Gas Tax $25.11 per resident $81,365
Urban Runoff Fund See Supporting Table 2. $337,620
City Sewer Service Fees See Supporting Table 3. $1,451,073
Library Taxes $0.0175 per $100 of AV $384,066
Total Annual Other Fund Revenues $2,331,106
Total Annual General Fund and Other Fund Revenues $13,361,747
1See Table E.
2See Table F.
3Revenue Assumptions per Table G.
4Assumes 300,000 sq. ft. of new reta i l . See Table D.

13 | P a g e
V. EstimatedExpendituresIt is estimated that Alameda Point will generate approximately $10.6 million in expenditures per year at
build‐out. This figure includes expenditures for various City services. Table I provides details on the
estimating factors for each of the expenditure categories included in the model. A brief description of
each expenditure category is provided below.
Table I – Expenditure Estimating Factors
FireCitywide, the Fire Department operates four fire stations and is also responsible for water rescue calls. Emergency Medical Services (EMS) are provided by the City from Station 2, located on Pacific Avenue at Webster Street. A fifth station, Station 5, was located at Alameda Point, but was closed because of its low level of activity. Currently Station 2 is the nearest station
Expenditure Category Factor or Assumptions
Fire
Costs and Offsets $3,302,621 annual engine company cost 1
Police
Base Officers 8 build‐out officers 2
7,695 build‐out resident equivalents
1.0 officers per 1,000 resident equivalent
$245,000 annual costs per officer
Public Works New Dev. Adaptive Reuse
Base Roadway Maintenance $0.65 psf 1,580,000 sf 723,000 sf road maintenance 3
$0.008 plf 174,000 lf 0 lf curbs and gutters 3
$1.00 psf 615,000 sf 0 sf landscape maint. 3
10% of total roadway maint. sidewalks, signs, signals
$0.50 per daytime population administrative 3
Offsite Roadway Maintenance $0.65 psf 334,000 sf pavement areas 3
$0.008 plf 30,200 lf curbs and gutters 3
$1.00 psf 145,000 sf landscape / sidewalk 3
Existing City‐Occupied Buildings $91,768 per year for utilities
$267,347 per year for maintenance
Recreation 4 $15.74 per resident equivalent
Parks 5 $20,000 per acre 95 acres 3
Library $25.71 per resident
General Government 6 $108.36 per unit
1See Supporting Table 4.
2Police Department.
3Area dimensions provided by Carlson, Barbee & Gibson Engineering.
4Based 60% cost recovery for Parks and Recreation budget. See Supporting Table 1.
5Maintenance costs per acre provided by Alameda Recreation and Park Department.
6 Based on 2012/13 Proposed Budget. General government expenses include operation and maintenance costs for the City Council, City Attorney, City Clerk, City
Manager, Finance, and Human Services. See Supporting Table 2.
14 | P a g e
to Alameda Point. The 2012/130 operating budget for the City’s Fire Department is $23.4 million. Based on consultation with the Fire Department, the City has determined that an engine company will
be required in a new station at Alameda Point. The exact timing and location of the station has not yet
been determined.3
The Fire Department has provided the cost of an engine company and operation of the fire station for
the Alameda Point development. In addition, the Fire Department has estimated the cost of providing
staff for inspections and fire prevention. The analysis includes the revenue the department will receive
from charges for inspections and from ambulance services. It is important to note that the fire station
will likely be required at some point before full build out of the Reuse Plan (and therefore the full level
of revenues reflected in this analysis). As a result, there may be a temporary period during the
development of the Reuse Plan that the City experiences a net fiscal deficit.
PoliceBoth homes and businesses in the Reuse Plan will generate calls for service from the Police Department.
Willdan assumes, based on input from the Police Department, that the Alameda Point development will
require approximately one (1) new officer per every 1,000 resident equivalents at a cost of $245,000 per
officer.
PublicWorksThe Public Works Department maintains roads, bike lanes, traffic signals, storm sewers, and a variety of
other public facilities throughout the City. The Department will have new maintenance responsibilities,
and costs, with the development of the Reuse Plan, including existing facilities (such as City Hall West
and storage facilities) and the new facilities that will come with development.
Public works costs in the analysis include: 1) Road Maintenance, 2) Curbs and Gutters, 3) Landscape and
Maintenance, 4) Sidewalks, Signs, and Signals, and 5) Administrative costs. The total square footage and
linear footage for each of these categories was estimated by Carlson, Barbee & Gibson Engineering
(CBG), the City’s civil engineer consultant for Alameda Point.
New infrastructure maintenance costs are estimated by applying "per square foot” or "per linear foot”
costs provided by the City’s Department of Public Works to the estimated square feet or linear feet of
road, curb, landscaping, and other items.
The road maintenance estimate includes the measures necessary to maintain the roads at a pavement
condition index (PCI) consistent with the rest of the City. This includes a schedule of slurry sealing every
five years, with major reconstruction every 20 years. These costs are averaged over a 20‐year period,
yield a cost per square foot of $0.65.
3 An ambulance may be required at a later date, which would increase costs of services.
15 | P a g e
ParksandRecreationPark maintenance expenditure estimates are based on an average cost per acre of $20,000. The total
park acreage at build‐out was estimated by CBG.
Recreation program expenditures are estimated based on the Parks and Recreation budget for Fiscal
Year 2012‐13. Expenditures are based on a per‐resident equivalent basis. It is assumed that for the
Reuse Plan the Department will recover 60 percent of its program costs through fees and other charges
consistent with the City’s current budget.
The Sports Park and Aquatic Center will be constructed as part of the overall infrastructure financing
plan. Ongoing costs of operation and maintenance are assumed to be cover by fees and user charges
not including any debt service payments.
LibraryThe City’s existing library facilities include the 47,500‐square foot Main Library (opened in 2006),
the West End Branch (3,400 square feet), and the Bay Farm Island branch (2,688 square feet).
There are approximately 224,000 volumes in the library’s collection, and approximately 483,000
volumes are borrowed each year. The West End branch is the closest branch to Alameda Point,
but transportation options to and from Alameda Point are currently limited.
The West End Branch primarily serves residents in the western portion of the City, which is
defined as all census tracts west of Constitution Way and Eighth Streets.
Willdan has calculated the per capita cost of library services in the City, and has applied this per capita
cost to the projected population of the plan to estimate the cost to the Library of the new residents.
GeneralGovernmentGeneral government expenses include operation and maintenance costs for the City Council, City
Attorney, City Clerk, City Manager, Finance, and Human Services. The 2012/13 operating
budget for general government is $10.6 million. It is assumed that 33 percent of the costs of
these programs will increase as the number of City residents increases, or $108 per resident.
PlanningandBuildingServicesPlanning and Building Services are fully funded by fees; therefore, the project is not expected to have
any fiscal impact on the cost of these services.
EstimatedExpendituresThe factors described above are used to estimate the expenditures that will be generated by the project
upon build‐out. Table H presents the calculations.
16 | P a g e
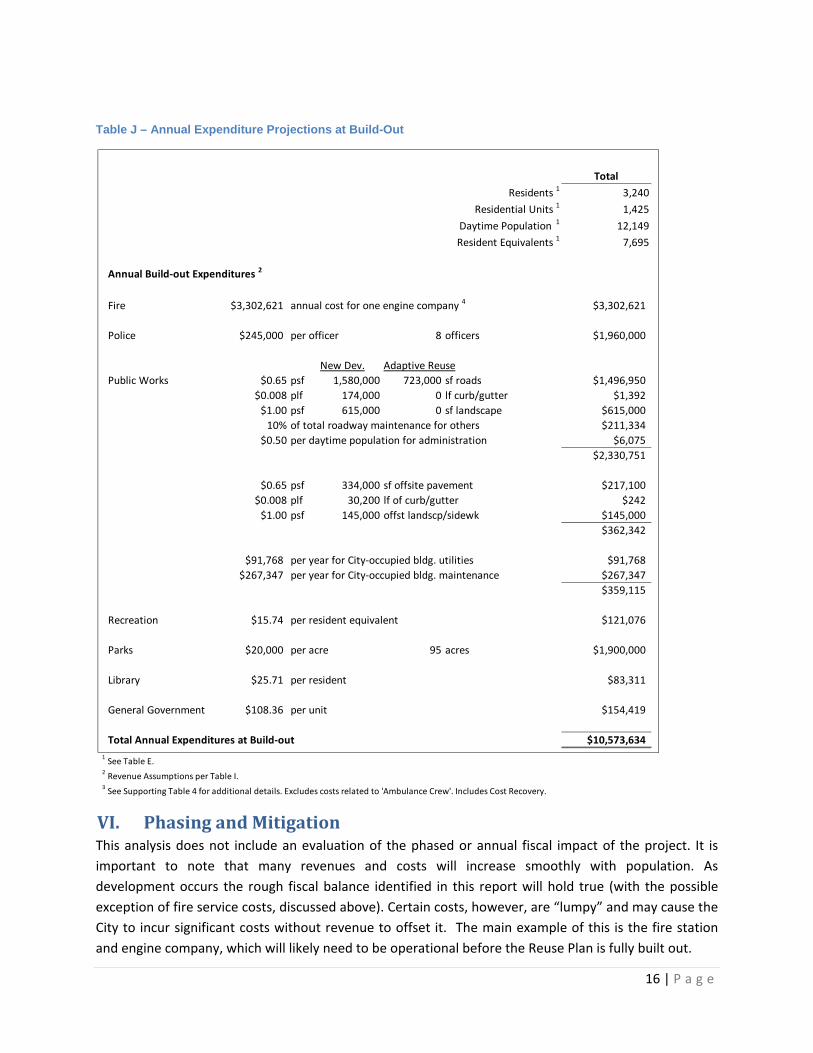
Table J – Annual Expenditure Projections at Build-Out
VI. PhasingandMitigationThis analysis does not include an evaluation of the phased or annual fiscal impact of the project. It is
important to note that many revenues and costs will increase smoothly with population. As
development occurs the rough fiscal balance identified in this report will hold true (with the possible
exception of fire service costs, discussed above). Certain costs, however, are “lumpy” and may cause the
City to incur significant costs without revenue to offset it. The main example of this is the fire station
and engine company, which will likely need to be operational before the Reuse Plan is fully built out.
Total
Residents 1 3,240
Residential Units 1 1,425
Daytime Population 1 12,149
Resident Equivalents 1 7,695
Annual Build‐out Expenditures 2
Fire $3,302,621 annual cost for one engine company 4 $3,302,621
Police $245,000 per officer 8 officers $1,960,000
New Dev. Adaptive Reuse
Public Works $0.65 psf 1,580,000 723,000 sf roads $1,496,950
$0.008 plf 174,000 0 lf curb/gutter $1,392
$1.00 psf 615,000 0 sf landscape $615,000
10% of total roadway maintenance for others $211,334
$0.50 per daytime population for administration $6,075
$2,330,751
$0.65 psf 334,000 sf offsite pavement $217,100
$0.008 plf 30,200 lf of curb/gutter $242
$1.00 psf 145,000 offst landscp/sidewk $145,000
$362,342
$91,768 per year for City‐occupied bldg. utilities $91,768
$267,347 per year for City‐occupied bldg. maintenance $267,347
$359,115
Recreation $15.74 per resident equivalent $121,076
Parks $20,000 per acre 95 acres $1,900,000
Library $25.71 per resident $83,311
General Government $108.36 per unit $154,419
Total Annual Expenditures at Build‐out $10,573,634
1See Table E.
2Revenue Assumptions per Table I.
3See Supporting Table 4 for additional details. Excludes costs related to 'Ambulance Crew'. Includes Cost Recovery.

17 | P a g e
It should also be noted that lease revenues generated at Alameda Point are currently used, in part, to
offset Alameda Point’s maintenance and operations costs, including certain City services. As
development is implemented and revenue‐generating buildings are demolished, it will be crucial that
the fiscal impacts of this transition be evaluated carefully on an annual basis.
VII. SensitivityAnalysisWilldan has also examined the possibility that the Reuse Plan will include a major retail sales tax
generator. This would have the effect of increasing sales tax revenues substantially, while also increasing
police protection costs from the addition of two sworn officers. A major retail sales tax generator would
also generate somewhat lower property tax revenues (from lower assessed value relative to office
development). The net fiscal impact of the Reuse Plan with a major retail sales tax generator would be
$5.2 million annually, an increase of $2.4 million.
Willdan has also estimated the impact of forming an IFD to fund infrastructure. Assuming that the IFD
uses 80% of the property tax generated, the total property tax revenue would be reduced by
approximately $4 million. It is expected that any resulting fiscal deficit would be offset by a special tax or
assessment to pay for services.

18 | P a g e
SupportingTables

19 | P a g e
Supporting Table 1 – City Demographic and Budget Assumptions
City of Alameda Population/Jobs 2013
Housing Units 1
32,429
Population 1
75,126
Employees 2
28,547
Total Daytime Population 103,673
Resident Equivalent 0.5
Resident Equivalent Population 3
89,400
General Fund Revenues
FY12‐13
Proposed Budget 4
%
Variable Estimating Factor
Property Taxes /Sales Tax in Lieu $22,682,000 Case Study
Sales Tax $4,841,000 100% $64.44 per resident
Utility Users Tax $9,100,000 100% $87.78 per daytime pop.
Franchise Fees 5
$2,807,000 100% $37.36 per resident
Advanced AMP Franchise Fees 5
$1,100,000
MVLF in Lieu $5,895,000 Case Study
Transfer and Transient Occ. Taxes $5,418,000 Not Calculated
Business License $1,700,000 100% $59.55 per employee
Departmental Revenues $7,062,857 Not Calculated
Cost Allocation Reimbursements $4,251,400 Not Calculated
Interest Return on Investments $1,177,400 Not Calculated
Other Revenues $51,000 Not Calculated
Transfers In $727,820 Not Calculated
Use of Reserves $1,064,984 Not Calculated
Total General Fund Revenues $67,878,461
General Fund Expenditures
FY12‐13
Proposed Budget 4
%
Variable Estimating Factor
General Government
Council $330,653 33% $3.40 per unit
Attorney $1,561,112 33% $16.05 per unit
Clerk $738,879 33% $7.59 per unit
Manager $2,516,537 33% $25.87 per unit
Finance $2,066,158 33% $21.24 per unit
Central Services $2,323,694 33% $23.65 per unit
Human Services $1,028,622 33% $10.57 per unit
Subtotal General Government $10,565,655 $108.36 per unit
Non Departmental $1,412,852 Not Calculated
Recreation and Parks $3,516,844 40% $15.74 per res. equiv.
Fire $23,451,439 Case Study
Police $25,198,394 Case Study
Public Works $1,160,032 Case Study
Transfers to Other Funds $6,927,755 Case Study
Total General Fund Expenditures $72,232,971
Other Funds ‐ REVENUES
FY12‐13
Proposed Budget 4
%
Variable Estimating Factor
Alameda County Measure B $1,785,444 100% $23.77 per resident
Gas Tax $1,886,606 100% $25.11 per resident
Urban Runoff Fund $3,118,776 100% Case Study
Other Funds ‐ EXPENDITURES
Library Net Program Budget $1,931,741 100% $25.71 per resident
1Ca l i fornia State Department of Finance; Table 2: E‐5 Ci ty/County Population and Housing Estimates , 1/1/2013
2
3
4Ci ty of Alameda ‐ Genera l Fund Budget Summary Fiscal Years 2010‐2011 through 2013‐2014.
5
Association of Bay Area Governments (ABAG) 2009 Projections . Annual growth rate derived from 2010 and 2015 job
estimates to generate a 2013 estimate.
Daytime population i s the tota l number of res idents plus the tota l number of employees . Res ident Equiva lents i s
the tota l number of res idents plus the total number of employees weighted by the res ident equivalent factor.
Franchise Fees are adjusted to exclude advance paytments to be received from Alameda Municipa l Power (AMP)
and are for 2013‐14, per Fred Marsh.
20 | P a g e
Supporting Table 2 – Urban Runoff Revenues
Total
Residential units 1
1,425
Commercial square feet 1
5,500,000
Build‐out Equivalent Residential Units 2
Single Family Residential Unit ERUs 1.00 ERUs per single family residential un 125
Multi‐Family Residential Unit ERUs 1.50 ERUs per multi‐family residential un 1,950
Commercial Square Feet ERUs 3
3,938
6,013
Annual Urban Runoff Revenues 2
Single Family Residential Unit ERUs $56.15 per ERU $7,019
Multi‐Family Residential Unit ERUs $56.15 per ERU $109,493
Commercial Square Feet ERUs $56.15 per ERU $221,109
$337,620
Methodology based on Alameda Point Public Services Analysis conducted by EPS, June 2010. 1See Table D.
2Revenue Assumptions per Table G.
3 Total estimated ERUs are derived from the Alameda Point Publ ic Services Analys is conducted by EPS, June
2010. Tota l dis tributed by area based on corresponding square footage.
21 | P a g e
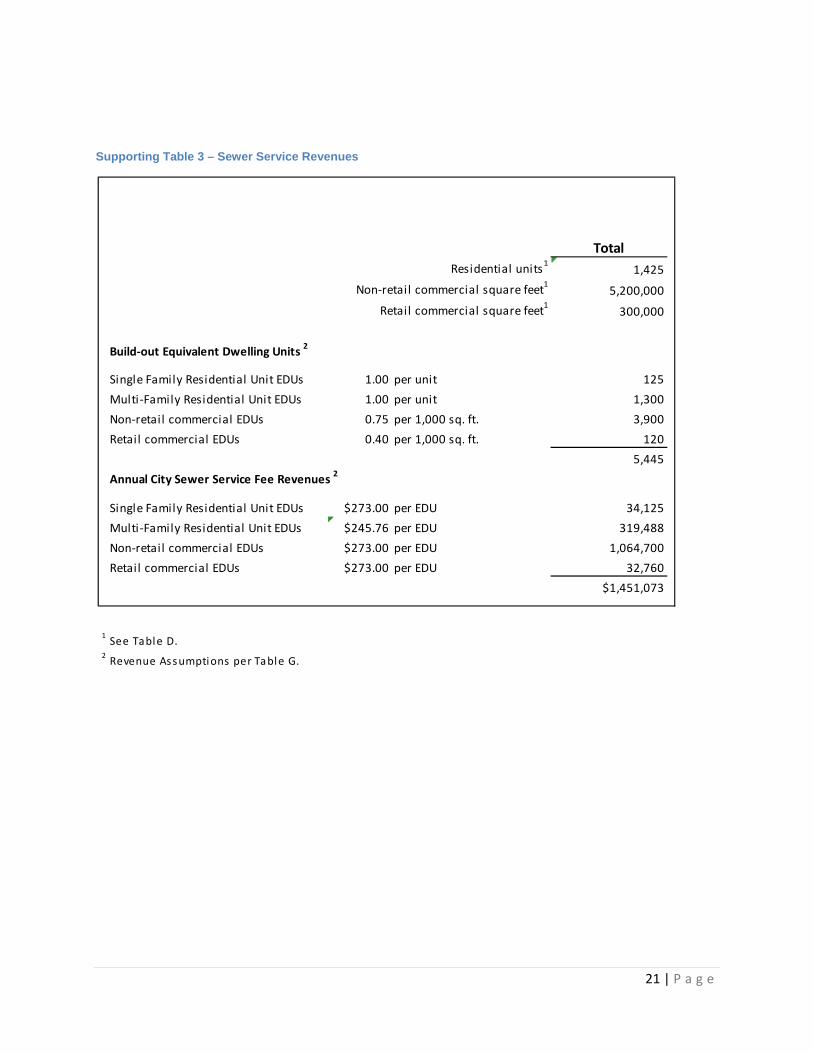
Supporting Table 3 – Sewer Service Revenues
Total
Residential units1
1,425
Non‐retail commercial square feet1
5,200,000
Retail commercial square feet1
300,000
Build‐out Equivalent Dwelling Units 2
Single Family Residential Unit EDUs 1.00 per unit 125
Multi‐Family Residential Unit EDUs 1.00 per unit 1,300
Non‐retail commercial EDUs 0.75 per 1,000 sq. ft. 3,900
Retail commercial EDUs 0.40 per 1,000 sq. ft. 120
5,445
Annual City Sewer Service Fee Revenues 2
Single Family Residential Unit EDUs $273.00 per EDU 34,125
Multi‐Family Residential Unit EDUs $245.76 per EDU 319,488
Non‐retail commercial EDUs $273.00 per EDU 1,064,700
Retail commercial EDUs $273.00 per EDU 32,760
$1,451,073
1See Table D.
2Revenue Assumptions per Table G.
22 | P a g e
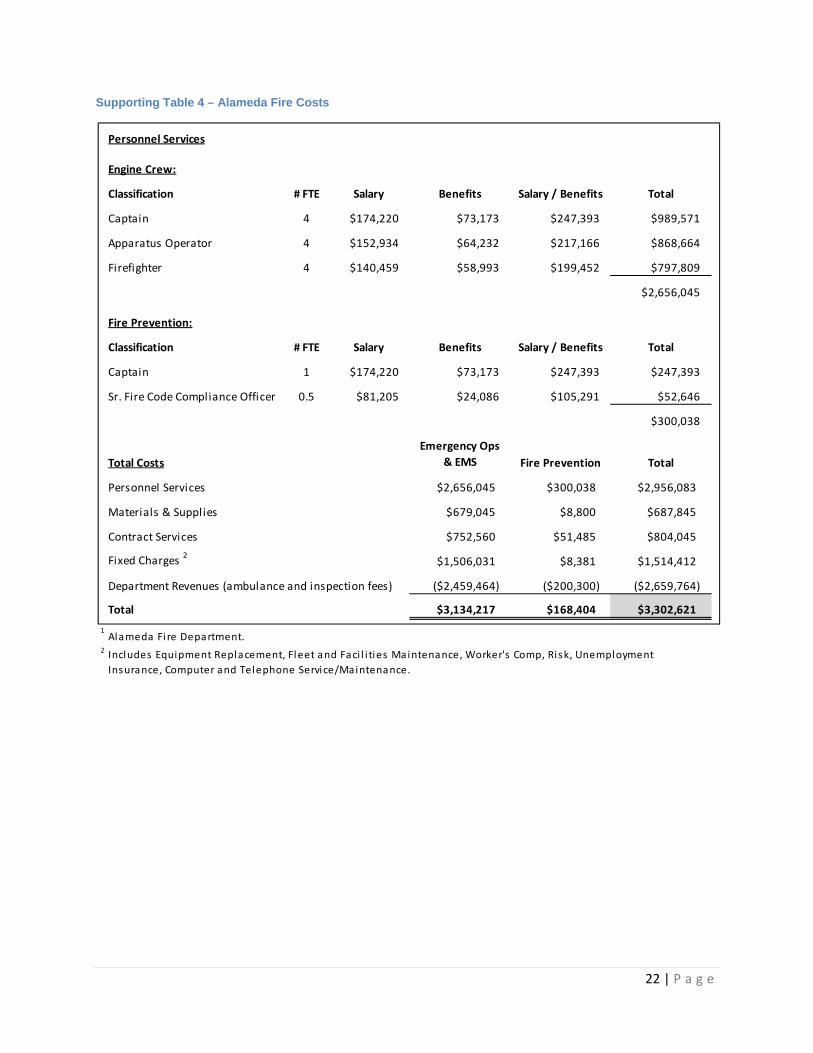
Supporting Table 4 – Alameda Fire Costs
Personnel Services
Engine Crew:
Classification # FTE Salary Benefits Salary / Benefits Total
Captain 4 $174,220 $73,173 $247,393 $989,571
Apparatus Operator 4 $152,934 $64,232 $217,166 $868,664
Firefighter 4 $140,459 $58,993 $199,452 $797,809
$2,656,045
Fire Prevention:
Classification # FTE Salary Benefits Salary / Benefits Total
Captain 1 $174,220 $73,173 $247,393 $247,393
Sr. Fire Code Compliance Officer 0.5 $81,205 $24,086 $105,291 $52,646
$300,038
Total Costs
Emergency Ops
& EMS Fire Prevention Total
Personnel Services $2,656,045 $300,038 $2,956,083
Materials & Supplies $679,045 $8,800 $687,845
Contract Services $752,560 $51,485 $804,045
Fixed Charges 2
$1,506,031 $8,381 $1,514,412
Department Revenues (ambulance and inspection fees) ($2,459,464) ($200,300) ($2,659,764)
Total $3,134,217 $168,404 $3,302,621
1Alameda Fi re Department.
2 Includes Equipment Replacement, Fleet and Faci l i ties Maintenance, Worker's Comp, Risk, Unemployment
Insurance, Computer and Telephone Service/Maintenance.