alberta opioid response surveillance report · the most up-to-date data shows that 523 people died...
TRANSCRIPT

Alberta Health
Alberta Opioid Response Surveillance Report
2018 Q3
December 11, 2018

Alberta Health, Analytics and Performance Reporting Branch Alberta Opioid Response Surveillance Report, 2018 Q3 December 11, 2018
© 2018 Government of Alberta Page 1
Highlights
The most up-to-date data shows that 523 people died from an apparent accidental opioid poisoning so far in 2018.
On average, 2 individuals die every day in Alberta as a result of an apparent accidental opioid poisoning.
In the most recent quarter, 158 people died from an apparent accidental fentanyl-related poisoning, compared to 167 people in the previous quarter.
While fentanyl-related deaths continue to increase, the increase appears to have slowed, and concurrently, non-fentanyl opioid deaths have decreased significantly. While it is too early to know for sure, this suggests overdose deaths may be plateauing.

Alberta Health, Analytics and Performance Reporting Branch Alberta Opioid Response Surveillance Report, 2018 Q3 December 11, 2018
© 2018 Government of Alberta Page 2
Key points
Apparent accidental poisoning deaths related to fentanyl
In the third quarter of 2018, there were 158 apparent accidental poisoning deaths related to fentanyl in Alberta. By comparison, there were 167 of these deaths in the second quarter of 2018.
From January 1, 2018 to September 30, 2018, 87 per cent of deaths occurred in larger urban municipalities (Edmonton, Calgary, Red Deer, Grande Prairie, Fort McMurray, Lethbridge, Medicine Hat).
In the third quarter of 2018, the Calgary Zone (64) and Edmonton Zone (59) had the highest numbers of fentanyl deaths. The Calgary Zone continued to have the highest rate per 100,000 person years at 18.7 (a decrease from last reporting period), compared to the provincial average of 15.2 per 100,000 person years.
Apparent accidental poisoning deaths related to non-fentanyl opioids
In the second quarter of 2018, there were 14 apparent accidental poisoning deaths related to an opioid other than fentanyl in Alberta. By comparison, there were 15 of these deaths in the first quarter of 2018. In 2017, 38 apparent accidental poisoning deaths related to an opioid other than fentanyl occurred in the second quarter.
From January 1, 2018 to June 30, 2018, 66 per cent of non-fentanyl opioid-related deaths occurred in larger urban municipalities (Edmonton, Calgary, Red Deer, Grande Prairie, Fort McMurray, Lethbridge, Medicine Hat).
In the second quarter of 2018, the Calgary Zone (4) and South Zone (4) had the highest number of these deaths. The South Zone had the highest rate at 2.6 per 100,000 person years, compared to a provincial average of 1.3 per 100,000 person years.
Confirmed drug poisoning deaths
Among all confirmed drug and alcohol poisoning deaths (accidental and suicide) in 2017 and 2018, opioids (fentanyl or non-fentanyl) were directly involved in 78 per cent of deaths. 22 per cent of all confirmed drug and alcohol poisoning deaths (accidental and suicide) did not involve any opioid.
Multiple substances are often used at the same time as opioids, including fentanyl. This may be a result of an individual using multiple substances including opioids, or through the contamination of drugs with opioids such as fentanyl.
In 2018, 77 per cent of accidental fentanyl related deaths listed at least one other substance as contributing to death, the most frequent being methamphetamine and cocaine.
Emergency department visits
In the second quarter of 2018, there were 2,972 emergency and urgent care visits related to harm associated with opioids and other drug use. In the previous quarter, there were 2,830 emergency and urgent care visits related to opioids and other substances of misuse.
In the second quarter of 2018, emergency and urgent care visits related to harm associated with opioids and other drug use occurred among 2,460 unique individuals, of whom 14 per cent had more than one visit.
Supervised consumption services
In the most recent quarter, there were 63,973 visits to supervised consumption services sites in Edmonton, Calgary, and Lethbridge. In the same time period, there were 2,663 unique clients who attended these sites, and 646 overdoses were attended to at these sites.
Alberta Health, Analytics and Performance Reporting Branch Alberta Opioid Response Surveillance Report, 2018 Q3 December 11, 2018
© 2018 Government of Alberta Page 3
Disclaimer This surveillance report presents emergency department visits, hospitalizations, drug dispensing from community pharmacies, emergency medical services, naloxone kit dispensing, supervised consumption services visits, and mortality data associated with opioids and other drugs in Alberta.
Data sources are updated and verified at differing time periods. Results are subject to change based on differences in data submission schedules and updates from the various data systems. Data may change in later reporting as it is submitted by the medical examiner, health facilities, supervised consumption services, and pharmacies. Recent data may be less complete due to delays in data submission.
The number of drug overdose deaths related to fentanyl/opioids may change (including increases/decreases in previous numbers) as certification of deaths can take six months or longer, and certification of cause of death may lead to a change in classification.
Apparent deaths = Preliminary evidence suggests that the death was most likely a drug overdose.
Confirmed deaths = A Medical Examiner has determined the cause of death based on all available evidence, and listed the cause of death on a death certificate (including the substances directly involved in the overdose).
Fentanyl related poisoning deaths: Deaths in which fentanyl or a fentanyl analogue was identified as a cause of death (these may also have involved non-fentanyl opioids).
Non-fentanyl opioid related poisoning deaths: Deaths in which an opioid (not fentanyl or a fentanyl analogue) was identified as a cause of death. Due to the added complexity of non-fentanyl opioid related poisoning deaths, there is a three-month delay in identifying these preliminary (apparent) cases for surveillance purposes compared to fentanyl related deaths.
Manner of death is determined by Alberta’s Office of the Chief Medical Examiner. Manner of death may be either accidental (i.e., unintentional), suicide (i.e., intentional), homicide, or undetermined. This report presents accidental and undetermined deaths grouped together as “accidental deaths”. Suicide/intentional deaths are only reported for confirmed deaths. Homicide deaths are not included in this report.
Throughout this report:
Q1 = January to March
Q2 = April to June
Q3 = July to September
Q4 = October to December
Local Geographic Areas (LGAs) refers to 132 geographic areas created by Alberta Health and Alberta Health Services to support local health service planning, monitoring, public health surveillance, and deep dive analytics.
For more details on data sources and methods, please see the Data notes section at the end of this report.
Alberta Health, Analytics and Performance Reporting Branch Alberta Opioid Response Surveillance Report, 2018 Q3 December 11, 2018
© 2018 Government of Alberta Page 4
Table of contents Highlights ................................................................................................................................................................. 1
Key points ................................................................................................................................................................ 2
Disclaimer ................................................................................................................................................................ 3
Table of contents ..................................................................................................................................................... 4
Mortality data: Apparent accidental opioid poisoning deaths .................................................................................. 7
Fentanyl and non-fentanyl related deaths ........................................................................................................... 7
Figure 1: Number of apparent accidental opioid poisoning deaths related to any opioid, by quarter. January 1, 2016 to September 30, 2018. ....................................................................................................................... 7
Figure 2: Proportion of fentanyl vs. non-fentanyl related apparent accidental opioid poisoning deaths, by quarter. January 1, 2016 to June 30, 2018. ..................................................................................................... 7
Fentanyl related deaths ....................................................................................................................................... 8
Figure 3: Number of apparent accidental fentanyl poisoning deaths, by Zone (based on place of death) and quarter. January 1, 2016 to September 30, 2018. ........................................................................................... 8
Table 2: Number of apparent accidental fentanyl poisoning deaths, by quarter. ............................................ 8
Table 3: Rate (per 100,000 person years) and number of apparent accidental drug poisoning deaths related to fentanyl, by Zone (based on place of death). January 1, 2016 to September 30, 2018. ............................. 9
Table 4: Rate (per 100,000 person years) and number of apparent accidental drug poisoning deaths related to fentanyl, by municipality (based on place of death). January 1, 2016 to September 30, 2018. .................. 9
Figure 4: Number of apparent accidental drug poisoning deaths related to carfentanil, by Zone (based on place of death) and quarter. January 1, 2016 to September 30, 2018. ......................................................... 10
Table 5: Number of apparent accidental carfentanil poisoning deaths, by quarter. ...................................... 10
Non-fentanyl opioid related deaths ................................................................................................................... 11
Figure 5: Number of apparent accidental drug poisoning deaths related to an opioid other than fentanyl, by Zone (based on place of death) and quarter. January 1, 2016 to June 30, 2018. ......................................... 11
Table 6: Number of apparent accidental drug poisoning deaths related to an opioid other than fentanyl, by quarter. ........................................................................................................................................................... 11
Table 7: Rate (per 100,000 person years) and number of apparent accidental drug poisoning deaths related to an opioid other than fentanyl, by Zone (based on place of death). January 1, 2016 to June 30, 2018. .... 12
Table 8: Rate (per 100,000 person years) and number of apparent accidental drug poisoning deaths related to an opioid other than fentanyl, by municipality (based on place of death). January 1, 2016 to June 30, 2018. .............................................................................................................................................................. 12
Municipalities of Edmonton and Calgary (opioid related deaths) ...................................................................... 13
Figure 6: Rate (per 100,000 person years) and counts of apparent accidental opioid poisoning deaths, in the Municipality of Edmonton, based on place of overdose, by LGA. January 1, 2018 to September 30, 2018. .............................................................................................................................................................. 13
Figure 7: Rate (per 100,000 person years) and counts of apparent accidental opioid poisoning deaths, in the Municipality of Calgary, based on place of overdose, by LGA. January 1, 2018 to September 30, 2018. ........................................................................................................................................................................ 14
Demographics and recent medical history of apparent accidental opioid poisoning decedents ...................... 15
Figure 8: Apparent accidental poisoning deaths related to fentanyl, by sex and age. January 1, 2018 to September 30, 2018. ...................................................................................................................................... 15
Figure 9: Apparent accidental poisoning deaths related to an opioid other than fentanyl, by sex and age, January 1, 2018 to June 30, 2018. ................................................................................................................. 15
Figure 10: Proportion of apparent accidental poisoning deaths related to fentanyl, by medical history within the 30 days before the date of death. January 1, 2018 to June 30, 2018. .................................................... 16

Alberta Health, Analytics and Performance Reporting Branch Alberta Opioid Response Surveillance Report, 2018 Q3 December 11, 2018
© 2018 Government of Alberta Page 5
Figure 11: Proportion of apparent accidental poisoning deaths related to an opioid other than fentanyl, by medical history within the 30 days before the date of death, January 1, 2018 to June 30, 2018. ................. 16
Confirmed drug and alcohol poisoning deaths (accidental and suicide) ............................................................... 17
Figure 12: Number of confirmed drug and alcohol poisoning deaths in Alberta, by drug causing death, manner of death, and year. 2016 to 2018. ..................................................................................................................... 17
Figure 13: Confirmed fentanyl poisoning deaths (accidental) in Alberta, by most common additional substances causing death and year. 2016 to 2018. ......................................................................................... 18
Emergency department visits ................................................................................................................................ 19
Figure 14: Rate of emergency department (ED) visits related to harm associated with opioids and other drug use, by quarter and Zone, per 100,000 person years. January 1, 2015 to June 30, 2018. .............................. 19
Table 9: Top 10 ED facilities utilized for emergency visits related to harm associated with opioids and other drug use, January 1, 2015 to June 30, 2018..................................................................................................... 19
Hospitalizations ..................................................................................................................................................... 20
Figure 15: Rate of hospitalizations related to harm associated with opioids and other drug use, by quarter and Zone, per 100,000 person years. January 1, 2015 to June 30, 2018. .............................................................. 20
Table 10: Top 10 facilities utilized for hospitalizations related to harm associated with opioids and other drug use, January 1, 2015 to June 30, 2018. ............................................................................................................ 20
Methadone & buprenorphine/naloxone dispensing from community pharmacies ................................................ 21
Figure 16: Rate of unique individuals dispensed methadone indicated for opioid dependence from community pharmacies per 100,000, by quarter and Zone. January 1, 2016 to September 30, 2018. .............................. 21
Figure 17: Rate of unique individuals dispensed buprenorphine/naloxone (generic brands and SuboxoneTM) indicated for opioid dependence from community pharmacies per 100,000, by quarter and Zone. January 1, 2016 to September 30, 2018. ............................................................................................................................ 21
Naloxone kit dispensing and distribution through Alberta Health Services’ naloxone program ............................ 22
Figure 18: Naloxone kits dispensed/distributed by registered site type, January 1, 2016 to September 30, 2018. .................................................................................................................................................................. 22
Table 11: Number of sites registered to distribute naloxone kits, January 1, 2016 to September 30, 2018. ... 22
Figure 19: Naloxone kits dispensed/distributed by community pharmacies and other registered sites, by Zone. January 1, 2016 to September 30, 2018. .......................................................................................................... 23
Figure 20: Naloxone kits dispensed by community pharmacies, by Zone and month. January 1, 2016 to September 30, 2018. ......................................................................................................................................... 23
Supervised consumption services ......................................................................................................................... 24
The following includes data from community supervised consumption services only. For Edmonton, the three sites (Boyle Street Community Service, Boyle Street Health Centre, and George Spady) are included. Data from the Royal Alexandra inpatient services is not included. ............................................................................ 24
Figure 21: Number of visits per month and site, January 1, 2018 to September 30, 2018 .............................. 24
Table 12: Number of visits per month and site, January 1, 2018 to September 30, 2018 ................................ 24
Figure 22: Unique clients by quarter and site, January 1, 2018 to September 30, 2018 .................................. 25
Figure 23: Total number of attended overdoses per month and site, January 1, 2018 to September 30, 2018 ........................................................................................................................................................................... 25
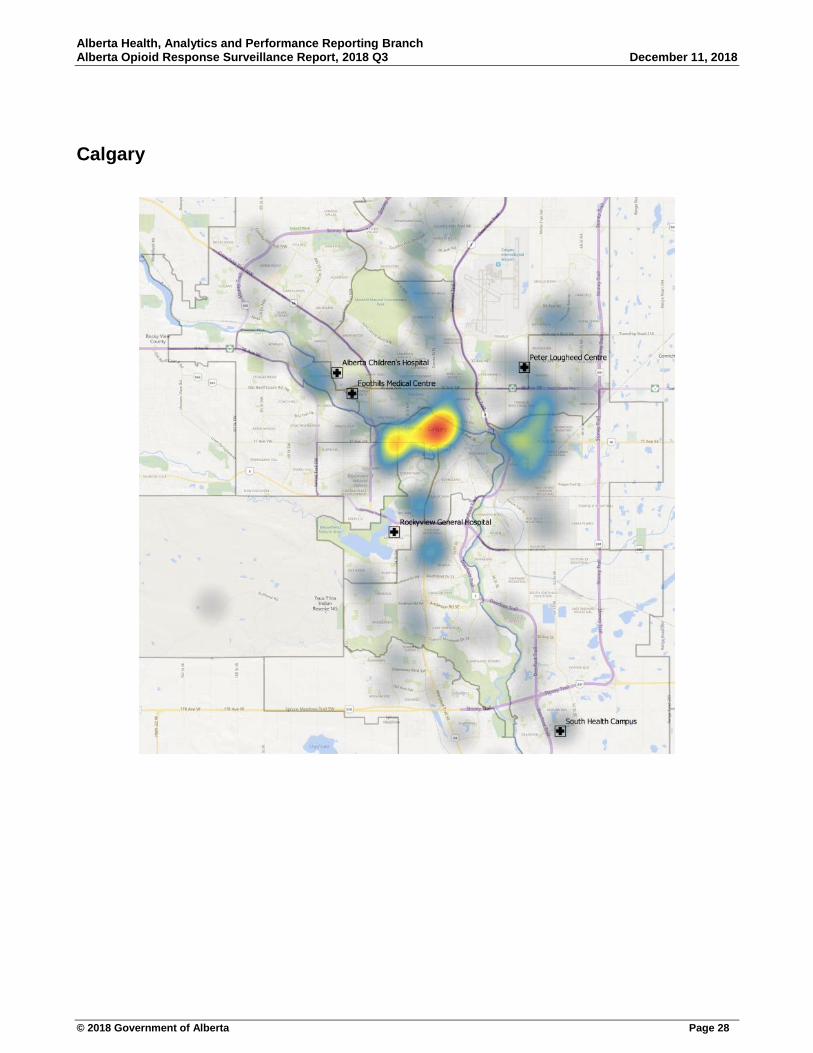
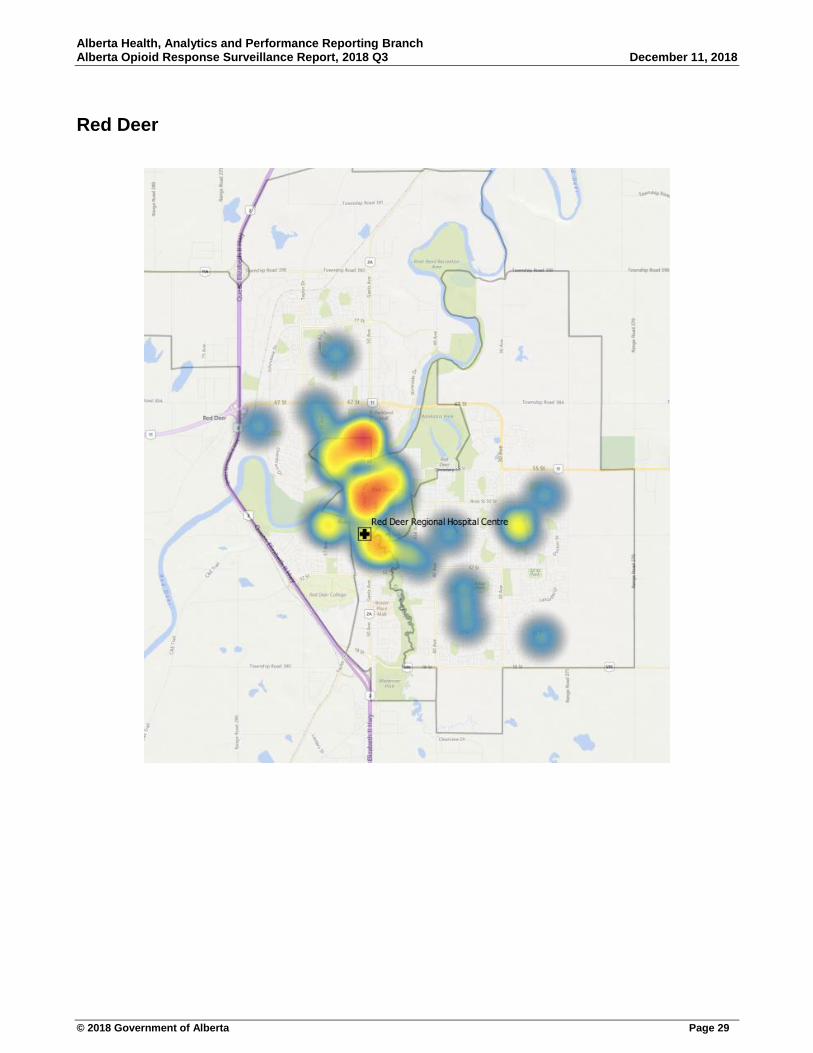
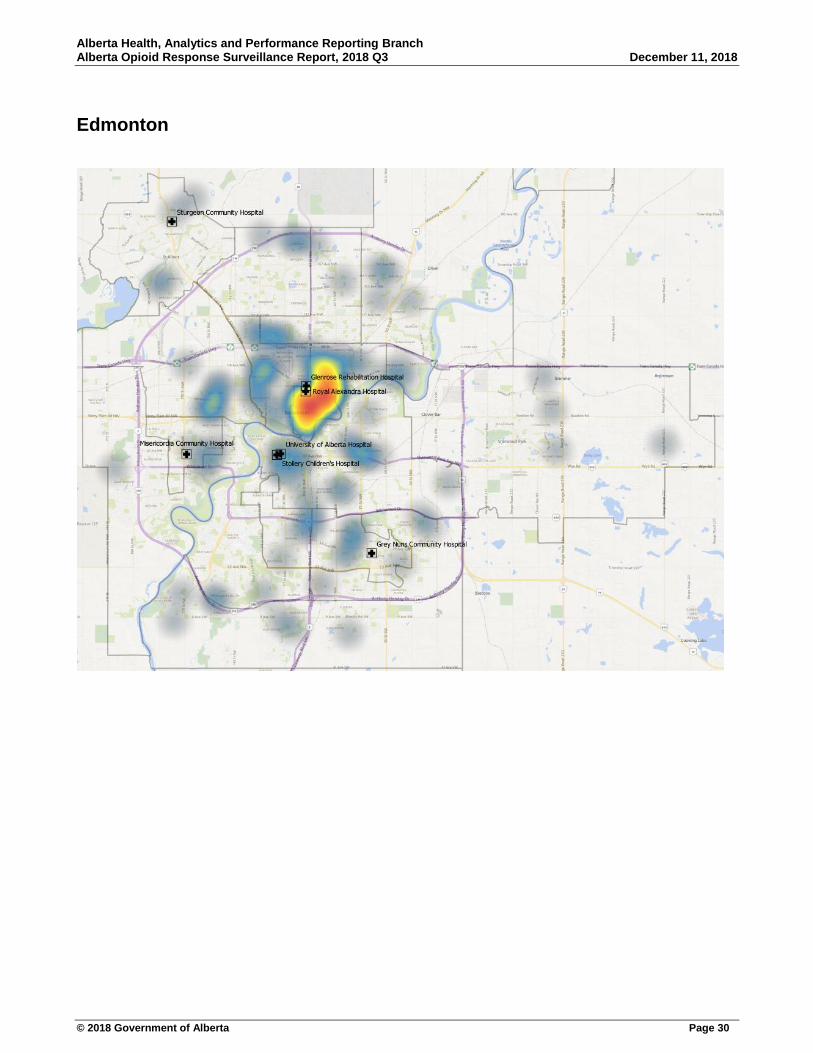
Appendix 1: Opioid related poisoning deaths in major Albertan cities .................................................................. 26
Lethbridge.......................................................................................................................................................... 26
Medicine Hat...................................................................................................................................................... 27
Calgary .............................................................................................................................................................. 28
Red Deer ........................................................................................................................................................... 29
Edmonton .......................................................................................................................................................... 30

Alberta Health, Analytics and Performance Reporting Branch Alberta Opioid Response Surveillance Report, 2018 Q3 December 11, 2018
© 2018 Government of Alberta Page 6
Fort McMurray ................................................................................................................................................... 31
Grande Prairie ................................................................................................................................................... 32
Data notes ............................................................................................................................................................. 33

Alberta Health, Analytics and Performance Reporting Branch Alberta Opioid Response Surveillance Report, 2018 Q3 December 11, 2018
© 2018 Government of Alberta Page 7
Mortality data: Apparent accidental opioid poisoning deaths
Fentanyl and non-fentanyl related deaths
Figure 1: Number of apparent accidental opioid poisoning deaths related to any opioid, by quarter. January 1, 2016 to September 30, 2018.
*Only fentanyl related opioid deaths are available for most recent quarter
Since January 1, 2016 1,782 individuals have died from an accidental opioid poisoning in Alberta.
Figure 2: Proportion of fentanyl vs. non-fentanyl related apparent accidental opioid poisoning deaths, by quarter. January 1, 2016 to June 30, 2018.
Almost all opioid poisoning deaths are now related to fentanyl. In the second quarter of 2018, 92 per cent of all opioid poisoning deaths were related to fentanyl.
68 80 83116 116 131 141
178 169 167 15853 50
6241 37
38 3431
14 15121 130
145157 153
169 175
209
183 182
158
0
50
100
150
200
250
Q12016
Q22016
Q32016
Q42016
Q12017
Q22017
Q32017
Q42017
Q12018
Q22018
Q32018*
Nu
mb
er o
f ap
par
ent
op
ioid
dru
g o
verd
ose
dea
ths
Fentanyl Non-Fentanyl Opioids
56% 62% 57%74% 76% 78% 81% 85% 92% 92%
44% 38% 43%26% 24% 22% 19% 15% 8% 8%
0%
10%
20%
30%
40%
50%
60%
70%
80%
90%
100%
Q12016
Q22016
Q32016
Q42016
Q12017
Q22017
Q32017
Q42017
Q12018
Q22018
Pro
po
rtio
n o
f ap
par
ent
op
ioid
dru
g o
verd
ose
dea
ths
Fentanyl Non-Fentanyl Opioids

Alberta Health, Analytics and Performance Reporting Branch Alberta Opioid Response Surveillance Report, 2018 Q3 December 11, 2018
© 2018 Government of Alberta Page 8
Fentanyl related deaths
Figure 3: Number of apparent accidental fentanyl poisoning deaths, by Zone (based on place of death) and quarter. January 1, 2016 to September 30, 2018.
Since January 1, 2016, a total of 1,407 individuals in Alberta died from an apparent accidental drug poisoning death related to fentanyl (347 in 2016, 566 in 2017, and 494 in 2018).
In 2018, on average, 165 individuals in Alberta died from an apparent accidental drug poisoning death related to fentanyl per quarter, while in 2017, on average, 142 individuals died from an apparent accidental drug poisoning death related to fentanyl per quarter.
Table 2: Number of apparent accidental fentanyl poisoning deaths, by quarter.
Total
0
200
400
600
800
1000
1200
1400
1600
0
20
40
60
80
100
120
140
160
180
200
Q1 2016 Q2 2016 Q3 2016 Q4 2016 Q1 2017 Q2 2017 Q3 2017 Q4 2017 Q1 2018 Q2 2018 Q3 2018
Cu
mla
tive
to
tal d
eath
s
Fem
tan
yl r
elat
ed
dea
ths
South Calgary Central Edmonton North Cumulative total
South Zone 3 1 4 5 4 5 11 7 13 13 11 77
Calgary Zone 30 32 38 50 53 64 66 82 84 85 64 648
Central Zone 10 6 5 18 5 11 14 16 18 19 12 134
Edmonton Zone 17 28 33 35 40 38 38 54 46 39 59 427
North Zone 8 13 3 8 14 13 12 19 8 11 12 121
Alberta 68 80 83 116 116 131 141 178 169 167 158 1,407
Q1
20
16
Q2
20
16
Q3
20
16
Q4
20
16
Q1
20
17
Q2
20
17
Q3
20
17
Q4
20
17
Q1
20
18
Q2
20
18
Q3
20
18
1,407

Alberta Health, Analytics and Performance Reporting Branch Alberta Opioid Response Surveillance Report, 2018 Q3 December 11, 2018
© 2018 Government of Alberta Page 9
Table 3: Rate (per 100,000 person years) and number of apparent accidental drug poisoning deaths related to fentanyl, by Zone (based on place of death). January 1, 2016 to September 30, 2018.
2016 2017 2018 YTD* Count Rate Count Rate Count Rate
South Zone 13 4.3 27 8.8 37 16.0
Calgary Zone 150 9.3 265 16.2 233 18.7
Central Zone 39 8.1 46 9.5 49 13.4
Edmonton Zone 113 8.4 170 12.4 144 13.9
North Zone 32 6.5 58 11.8 31 8.3
Alberta 347 8.2 566 13.2 494 15.2
The Calgary and Edmonton Zones continue to have the highest number of apparent accidental poisoning deaths related to fentanyl. In 2018, the Calgary Zone continued to have the highest rate per 100,000 person years at 18.7, compared to a provincial average of 15.2 per 100,000 person years. The South Zone followed closely behind the Calgary Zone with the second highest rate of 16.0 per 100,000 person years.
Table 4: Rate (per 100,000 person years) and number of apparent accidental drug poisoning deaths related to fentanyl, by municipality (based on place of death). January 1, 2016 to September 30, 2018.
2016 2017 2018 YTD* Count Rate Count Rate Count Rate
Lethbridge 8 8.3 15 15.3 22 29.4
Medicine Hat 2 2.9 7 10.2 8 15.5
Calgary 144 10.9 240 18.0 217 21.7
Red Deer 23 21.1 23 21.4 31 38.5
Edmonton 99 10.2 136 13.7 129 17.4
Fort McMurray 9 11.1 14 17.6 8 13.4
Grande Prairie 10 13.5 27 36.4 16 28.8
Total 295 10.8 462 16.8 431 20.9
The municipalities of Calgary and Edmonton continue to have the highest number of apparent accidental poisoning deaths related to fentanyl. However, in 2018 YTD, the Municipality of Red Deer had the highest rate of apparent drug poisoning deaths related to fentanyl per 100,000 person years, followed by the Municipality of Lethbridge and Grande Prairie.
*YTD = January 1, 2018 to September 30, 2018
Alberta Health, Analytics and Performance Reporting Branch Alberta Opioid Response Surveillance Report, 2018 Q3 December 11, 2018
© 2018 Government of Alberta Page 10
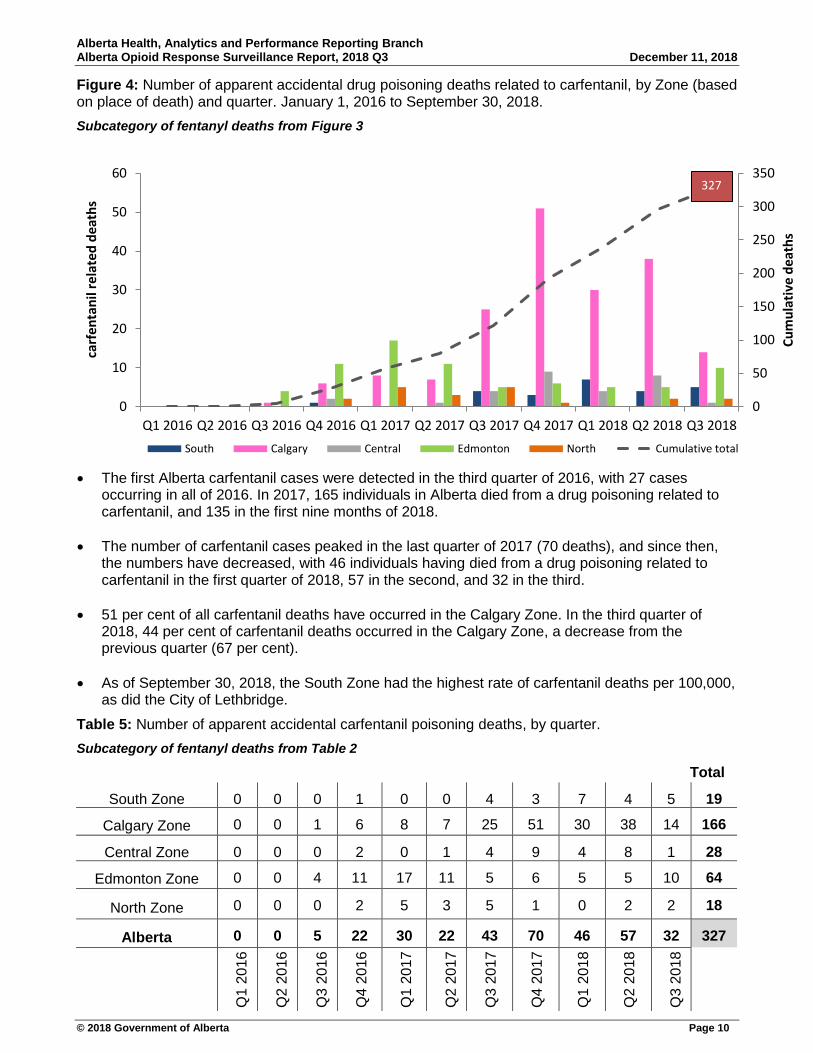
Figure 4: Number of apparent accidental drug poisoning deaths related to carfentanil, by Zone (based on place of death) and quarter. January 1, 2016 to September 30, 2018.
Subcategory of fentanyl deaths from Figure 3
The first Alberta carfentanil cases were detected in the third quarter of 2016, with 27 cases
occurring in all of 2016. In 2017, 165 individuals in Alberta died from a drug poisoning related to carfentanil, and 135 in the first nine months of 2018.
The number of carfentanil cases peaked in the last quarter of 2017 (70 deaths), and since then, the numbers have decreased, with 46 individuals having died from a drug poisoning related to carfentanil in the first quarter of 2018, 57 in the second, and 32 in the third.
51 per cent of all carfentanil deaths have occurred in the Calgary Zone. In the third quarter of 2018, 44 per cent of carfentanil deaths occurred in the Calgary Zone, a decrease from the previous quarter (67 per cent).
As of September 30, 2018, the South Zone had the highest rate of carfentanil deaths per 100,000, as did the City of Lethbridge.
Table 5: Number of apparent accidental carfentanil poisoning deaths, by quarter.
Subcategory of fentanyl deaths from Table 2
Total
0
50
100
150
200
250
300
350
0
10
20
30
40
50
60
Q1 2016 Q2 2016 Q3 2016 Q4 2016 Q1 2017 Q2 2017 Q3 2017 Q4 2017 Q1 2018 Q2 2018 Q3 2018
Cu
mu
lati
ve d
eath
s
carf
enta
nil
rela
ted
dea
ths
South Calgary Central Edmonton North Cumulative total
327
South Zone 0 0 0 1 0 0 4 3 7 4 5 19
Calgary Zone 0 0 1 6 8 7 25 51 30 38 14 166
Central Zone 0 0 0 2 0 1 4 9 4 8 1 28
Edmonton Zone 0 0 4 11 17 11 5 6 5 5 10 64
North Zone 0 0 0 2 5 3 5 1 0 2 2 18
Alberta 0 0 5 22 30 22 43 70 46 57 32 327
Q1
20
16
Q2
20
16
Q3
20
16
Q4
20
16
Q1
20
17
Q2
20
17
Q3
20
17
Q4
20
17
Q1
20
18
Q2
20
18
Q3
20
18
Alberta Health, Analytics and Performance Reporting Branch Alberta Opioid Response Surveillance Report, 2018 Q3 December 11, 2018
© 2018 Government of Alberta Page 11
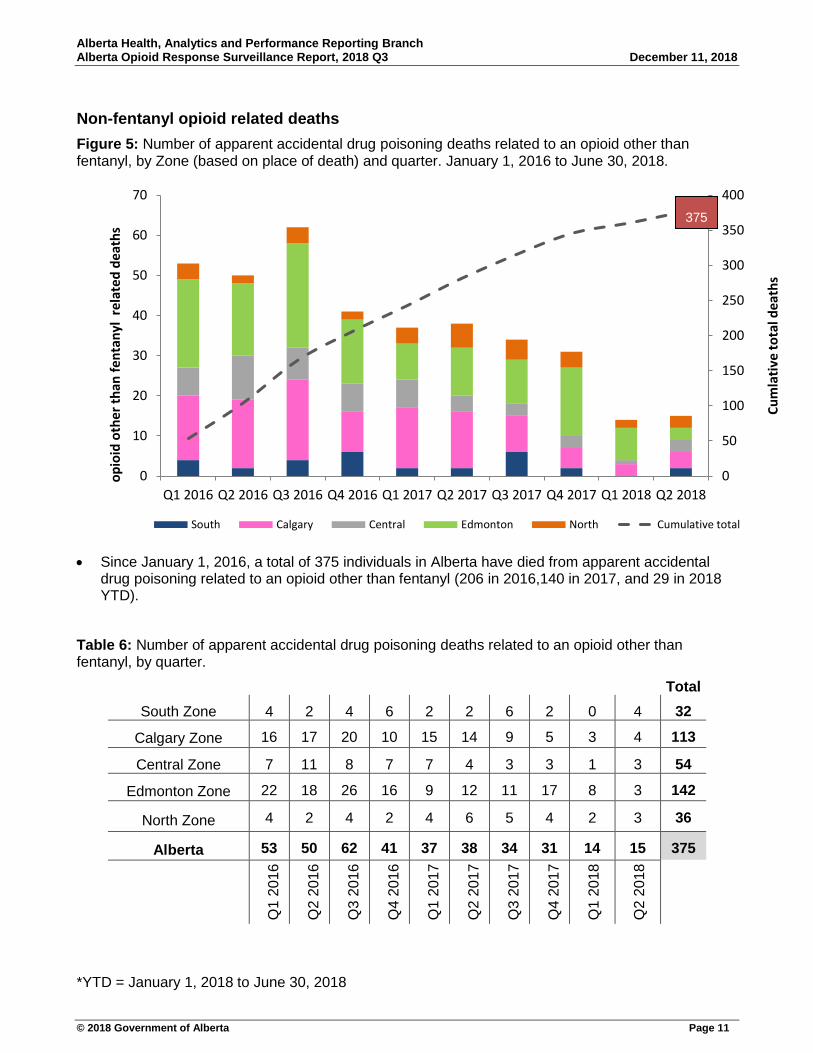
Non-fentanyl opioid related deaths
Figure 5: Number of apparent accidental drug poisoning deaths related to an opioid other than fentanyl, by Zone (based on place of death) and quarter. January 1, 2016 to June 30, 2018.
Since January 1, 2016, a total of 375 individuals in Alberta have died from apparent accidental drug poisoning related to an opioid other than fentanyl (206 in 2016,140 in 2017, and 29 in 2018 YTD).
Table 6: Number of apparent accidental drug poisoning deaths related to an opioid other than fentanyl, by quarter.
Total
South Zone 4 2 4 6 2 2 6 2 0 4 32
Calgary Zone 16 17 20 10 15 14 9 5 3 4 113
Central Zone 7 11 8 7 7 4 3 3 1 3 54
Edmonton Zone 22 18 26 16 9 12 11 17 8 3 142
North Zone 4 2 4 2 4 6 5 4 2 3 36
Alberta 53 50 62 41 37 38 34 31 14 15 375
Q1
20
16
Q2
20
16
Q3
20
16
Q4
20
16
Q1
20
17
Q2
20
17
Q3
20
17
Q4
20
17
Q1
20
18
Q2
20
18
*YTD = January 1, 2018 to June 30, 2018
0
50
100
150
200
250
300
350
400
0
10
20
30
40
50
60
70
Q1 2016 Q2 2016 Q3 2016 Q4 2016 Q1 2017 Q2 2017 Q3 2017 Q4 2017 Q1 2018 Q2 2018
Cu
mla
tive
to
tal d
eath
s
op
ioid
oth
er
than
fen
tan
yl r
elat
ed
dea
ths
South Calgary Central Edmonton North Cumulative total
375

Alberta Health, Analytics and Performance Reporting Branch Alberta Opioid Response Surveillance Report, 2018 Q3 December 11, 2018
© 2018 Government of Alberta Page 12
Table 7: Rate (per 100,000 person years) and number of apparent accidental drug poisoning deaths related to an opioid other than fentanyl, by Zone (based on place of death). January 1, 2016 to June 30, 2018.
2016 2017 2018 YTD* Count Rate Count Rate Count Rate
South Zone 16 5.3 12 3.9 4 2.6
Calgary Zone 63 3.9 43 2.6 7 0.8
Central Zone 33 6.9 17 3.5 4 1.6
Edmonton Zone 82 6.1 49 3.6 11 1.6
North Zone 12 2.4 19 3.9 5 2.0
Alberta 206 4.9 140 3.3 29 1.3
The Calgary and Edmonton Zones continue to have the highest number of these deaths. In 2018 YTD, the South Zone had the highest rate per 100,000 person years at 2.6, compared to the provincial average of 1.3 per 100,000 person years.
Table 8: Rate (per 100,000 person years) and number of apparent accidental drug poisoning deaths related to an opioid other than fentanyl, by municipality (based on place of death). January 1, 2016 to June 30, 2018.
2016 2017 2018 YTD* Count Rate Count Rate Count Rate
Lethbridge 4 4.1 3 3.1 1 2.0
Medicine Hat 4 5.9 3 4.4 0 0.0
Calgary 47 3.6 34 2.5 6 0.9
Red Deer 12 11.0 7 6.5 2 3.7
Edmonton 66 6.8 42 4.2 10 2.0
Fort McMurray 1 1.2 2 2.5 0 0.0
Grande Prairie 1 1.4 4 5.4 0 0.0
Total 135 5.0 95 3.5 19 1.4
The municipalities of Calgary and Edmonton continue to have the highest number of these deaths. In the 2018 YTD, the Municipality of Red Deer had the highest rate of apparent accidental drug poisoning deaths related to an opioid other than fentanyl per 100,000 person years.
*YTD = January 1, 2018 to June 30, 2018

Alberta Health, Analytics and Performance Reporting Branch Alberta Opioid Response Surveillance Report, 2018 Q3 December 11, 2018
© 2018 Government of Alberta Page 13
Municipalities of Edmonton and Calgary (opioid related deaths)
Figure 6: Rate (per 100,000 person years) and counts of apparent accidental opioid poisoning deaths, in the Municipality of Edmonton, based on place of overdose, by LGA. January 1, 2018 to September 30, 2018.
Within the Municipality of Edmonton, the LGA with a significantly higher rate of apparent accidental opioid poisoning deaths compared to the municipality average was Eastwood. However, 65 per cent of the total deaths occurred in LGAs outside of this area.
The place where the overdose occurred was the same as the individual’s home address for 51 per cent of fentanyl-related deaths in Edmonton.
The neighborhoods with five or more deaths were Boyle Street (8), Downtown (8), and Central McDougall (6).
Note: Place of death was used as the place of the overdose, except in instances where the place of death occurred in a hospital and there was no record of where the overdose occurred. In Edmonton, a hospital was the place of death in 23 per cent of deaths.
Number in blue circle represents neighborhood level counts

Alberta Health, Analytics and Performance Reporting Branch Alberta Opioid Response Surveillance Report, 2018 Q3 December 11, 2018
© 2018 Government of Alberta Page 14
Figure 7: Rate (per 100,000 person years) and counts of apparent accidental opioid poisoning deaths, in the Municipality of Calgary, based on place of overdose, by LGA. January 1, 2018 to September 30, 2018.
Within the Municipality of Calgary, the LGAs with significantly higher rates of apparent accidental opioid poisoning deaths compared to the municipality average were Nosehill, Centre, Centre North, and East. However, 46 per cent of the total deaths occurred in LGAs outside of these areas.
The place where the overdose occurred was the same as the individual’s home address for 56 per cent of fentanyl-related deaths in Calgary.
The neighborhoods with more than five deaths were Beltline (19), Downtown East Village (8), Dover (6), and Huntington Hills (6).
Note: Place of death was used as the place of the overdose, except in instances where the place of death occurred in a hospital and there was no record of where the overdose occurred. In Calgary, a hospital was the place of death in 22 per cent of deaths.
Number in blue circle represents neighborhood level counts

Alberta Health, Analytics and Performance Reporting Branch Alberta Opioid Response Surveillance Report, 2018 Q3 December 11, 2018
© 2018 Government of Alberta Page 15
Demographics and recent medical history of apparent accidental opioid poisoning decedents
Figure 8: Apparent accidental poisoning deaths related to fentanyl, by sex and age. January 1, 2018 to September 30, 2018.
79 per cent of apparent accidental drug poisoning deaths related to fentanyl were among males. Among males, the highest number of deaths occurred among individuals spanning the ages of 25 to 29 years. Among females, the highest number of deaths occurred among individuals spanning the ages of 35 to 39 years.
Figure 9: Apparent accidental poisoning deaths related to an opioid other than fentanyl, by sex and age, January 1, 2018 to June 30, 2018.
52 per cent of apparent accidental poisoning deaths related to an opioid other than fentanyl were among males. Among males and females, the average age of death was 44 years.
0
10
20
30
40
50
60
70
80
15–19 20–24 25–29 30–34 35–39 40–44 45–49 50–54 55–59 60–64 65–69 70+
Nu
mb
er o
f fe
nta
nyl
dea
ths
Male
Female
0
1
2
3
4
5
15–19 20–24 25–29 30–34 35–39 40–44 45–49 50–54 55–59 60–64 65–69 70+
Nu
mb
er o
f o
pio
id d
eath
s
Male
Female

Alberta Health, Analytics and Performance Reporting Branch Alberta Opioid Response Surveillance Report, 2018 Q3 December 11, 2018
© 2018 Government of Alberta Page 16
Figure 10: Proportion of apparent accidental poisoning deaths related to fentanyl, by medical history within the 30 days before the date of death. January 1, 2018 to June 30, 2018.
Figure 11: Proportion of apparent accidental poisoning deaths related to an opioid other than fentanyl, by medical history within the 30 days before the date of death, January 1, 2018 to June 30, 2018.
Among apparent accidental poisoning deaths related to fentanyl, the most frequent health care utilization within 30 days before the individual’s date of death was having an antidepressant or anxiolytic dispensed from a community pharmacy or substance use related visit.
Among apparent accidental poisoning deaths poisoning related to an opioid other than fentanyl, having an opioid dispensed from a community pharmacy was the most frequent health care utilization in the 30 days prior to death.
Note: 98% of individuals had their personal health number (PHN) available, and were included in this analysis. The above
includes the number of individuals who sought one of the services at least once. Individuals can be counted in more than one category. Health service means a physician, inpatient, or emergency department visit.
21%
21%
18%
17%
11%
5%
4%
1%
0% 5% 10% 15% 20% 25%
Substance abuse related health service
Antidepressant/anxiolytic dispensed from acommunity pharmacy
Opioid dispensed from a community pharmacy
Mental health related health service
ED visit related to opioid/substances of misuse
Pain related health service
Methadone or buprenorphine/naloxone dispensedfrom a community pharmacy
More than one ED visit related to opioid/substancesof misuse
67%
56%
33%
19%
19%
7%
4%
0%
0% 20% 40% 60% 80%
Opioid dispensed from a community pharmacy
Antidepressant/anxiolytic dispensed from acommunity pharmacy
Mental health related health service
Substance abuse related health service
Pain related health service
ED visit related to opioid/substances of misuse
Methadone or buprenorphine/naloxone dispensedfrom a community pharmacy
More than one ED visit related to opioid/substancesof misuse
Within 30 days before death
Within 30 days before death
50 per cent accessed at least one of the services listed
89 per cent accessed at least one of the services listed

Alberta Health, Analytics and Performance Reporting Branch Alberta Opioid Response Surveillance Report, 2018 Q3 December 11, 2018
© 2018 Government of Alberta Page 17
Confirmed drug and alcohol poisoning deaths (accidental and suicide)
Figure 12: Number of confirmed drug and alcohol poisoning deaths in Alberta, by drug causing death, manner of death, and year. 2016 to 2018.
Some drug poisoning deaths in 2017, and many drug poisoning deaths in 2018, are currently under review by the Office of the Chief Medical Examiner and have not been confirmed. Therefore, upon completion of all cases, the final number of total drug poisoning deaths in 2017 and 2018 will be higher than the current number.
From 2016 to 2018, the proportion of all drug poisoning deaths that were unintentional (accidental) increased from 85 per cent to 90 per cent, while the proportion of all drug poisoning deaths that were intentional (suicide) decreased from 15 per cent to 10 per cent.
From 2016 to 2018, the proportion of unintentional (accidental) drug poisoning deaths involving any opioid (non-fentanyl or fentanyl) increased from 81 per cent to 84 per cent, while the proportion of unintentional (accidental) drug poisoning deaths not involving any opioid decreased from 19 per cent to 16 per cent.
From 2016 to 2018, the proportion of intentional (suicide) drug poisoning deaths involving any opioid (non-fentanyl or fentanyl) increased from 40 per cent to 41 per cent, while the proportion of intentional (suicide) drug poisoning deaths not involving any opioid decreased from 60 per cent to 59 per cent.
From 2016 to 2018, approximately 20 per cent of all opioid related poisoning deaths (accidental and suicides) also listed alcohol as contributing to the poisoning death.
Alcohol was the only substance listed as causing death in 66 (3 per cent) of drug and alcohol overdose deaths from 2016 to 2018. 96 per cent were accidental poisoning deaths, and 4 per cent were suicides.
Note: Certification of more complex drug overdose deaths involving less potent opioids and drugs may take longer than
fentanyl related deaths to certify, and therefore, non-fentanyl drug related deaths are potentially underreported in 2016 and 2017. The above includes deaths where the cause was due to acute poisoning or poisoning by an exogenous substance where the manner was intentional (suicide) or unintentional (accidental). Deaths as a result of chronic substance use were excluded. Deaths as a result of poisoning or toxic effects due to carbon monoxide and household chemicals were excluded. “Other drugs” refers to prescription drugs (i.e. antidepressants, benzodiazepines), illicit drugs such as cocaine, methamphetamine and MDMA, and unspecified drugs. These numbers are estimates for surveillance purposes only.
347
546
248206
135
23
127152
508 4 3
41 3512
7552
22
0
100
200
300
400
500
600
2016 2017 2018
Unintentional fentanyl Unintentional non-fentanyl opioidOther unintentional drug & alcohol Intentional fentanylIntentional non-fentanyl opioid Other intentional drug & alcohol
Total: 804 Total: 924 Total: 358

Alberta Health, Analytics and Performance Reporting Branch Alberta Opioid Response Surveillance Report, 2018 Q3 December 11, 2018
© 2018 Government of Alberta Page 18
Figure 13: Confirmed fentanyl poisoning deaths (accidental) in Alberta, by most common additional substances causing death and year. 2016 to 2018.
In 2018, approximately 23 per cent of all fentanyl poisoning deaths had no other substances listed on the death certificate as causing death, while 41 per cent had methamphetamine listed, 36 per cent had cocaine listed, and 5 per cent had heroin listed.
The proportion of fentanyl poisoning deaths where methamphetamine was also listed as causing death was 1.4 times higher in 2018 compared to 2016 (41 per cent in 2018, 29 per cent in 2016), and the similar when compared to 2017 (43 per cent).
The proportion of fentanyl poisoning deaths where cocaine was also listed as causing death was similar in 2016, 2017, and 2018 (36 per cent in 2018, 33 per cent in 2017, 29 per cent in 2016).
The proportion of fentanyl poisoning deaths where heroin was also listed as causing death in has decreased from 24 per cent in 2016, to 5 per cent in 2018.
Note: “Other opioids” includes: morphine, oxycodone, codeine, and hydromorphone (ICD-10 T40.2). “Other synthetic opioids” includes: tramadol, buprenorphine, and illicit synthetic opioids such as U47700 (ICD-10 T40.4). Since multiple substances may be listed on one death certificate, deaths can be counted more than once in each category. Other substances contributing to death are taken from Part 1 of the medical certificate of death. This has changed from previous quarterly reporting, where substances contributing to death were taken from both Parts 1 and 2 of the medical certificate of death. In addition to changes resulting from more completed reviews of deaths, this change in methodology may have resulted in differences from previously reported proportions.
29% 29% 29%
24%
7%
18%
33%
43%
20%
8%
23%
36%
41%
5%
10%
0%
5%
10%
15%
20%
25%
30%
35%
40%
45%
50%
No other substances Cocaine Methamphetamine Heroin Other opioids
2016
2017
2018

Alberta Health, Analytics and Performance Reporting Branch Alberta Opioid Response Surveillance Report, 2018 Q3 December 11, 2018
© 2018 Government of Alberta Page 19
Emergency department visits
Figure 14: Rate of emergency department (ED) visits related to harm associated with opioids and other drug use, by quarter and Zone, per 100,000 person years. January 1, 2015 to June 30, 2018.
The rate of ED visits related to harm associated with opioids and other drug use increased by 66.3 per cent from the first quarter of 2015 to the second quarter of 2018. From the first quarter of 2018 to the second quarter of 2018, the rate increased by 5.0 per cent.
In 2018, on average, the rate of ED visits related to harm associated with opioids and other drug use was the highest in the South Zone (438 visits per 100,000 person years); approximately 64 per cent higher than the provincial average over this period (267 visits per 100,000 person years).
From the first quarter of 2015 to the second quarter of 2018, the Calgary and Edmonton Zones had the highest number of ED visits related to harm associated with opioids and other drug use, and on average, made up 30 and 25 per cent of all provincial ED visits related harm associated with opioids and other drug use per quarter, respectively.
Table 9: Top 10 ED facilities utilized for emergency visits related to harm associated with opioids and other drug use, January 1, 2015 to June 30, 2018
Rank Facility Count Percent of all
visits*
Rank Facility Count Percent of all
visits*
1 Royal Alexandra Hospital 3,877 12% 6 Red Deer Regional Hospital 1,476 4%
2 Peter Lougheed Centre 3,461 10% 7 South Health Campus 1,405 4%
3 Rockyview General Hospital
2,643 8% 8 Chinook Regional Hospital 1,341 4%
4 Foothills Medical Centre 2,612 8% 9 Grey Nuns Community Hospital
1,268 4%
5 U of A Hospital 2,012 6% 10 Sheldon M Chumir Center 1,092 3%
*Percentage of the total 33,147 ED visits related to harm associated with opioids and other drug use that occurred at the specified facility.
Note: Includes ED visits for all behavioural and mood disorders due to opioid use, and poisoning by all
substances-all causes. (All F11 and T40 ICD-10 codes, any diagnosis field)
0
50
100
150
200
250
300
350
400
450
500
Q1 Q2 Q3 Q4 Q1 Q2 Q3 Q4 Q1 Q2 Q3 Q4 Q1 Q2
2015 2016 2017 2018
ED v
isit
rat
e p
er 1
00
,00
0
Calgary Central Edmonton North South Provincial average
Alberta Health, Analytics and Performance Reporting Branch Alberta Opioid Response Surveillance Report, 2018 Q3 December 11, 2018
© 2018 Government of Alberta Page 20
Hospitalizations
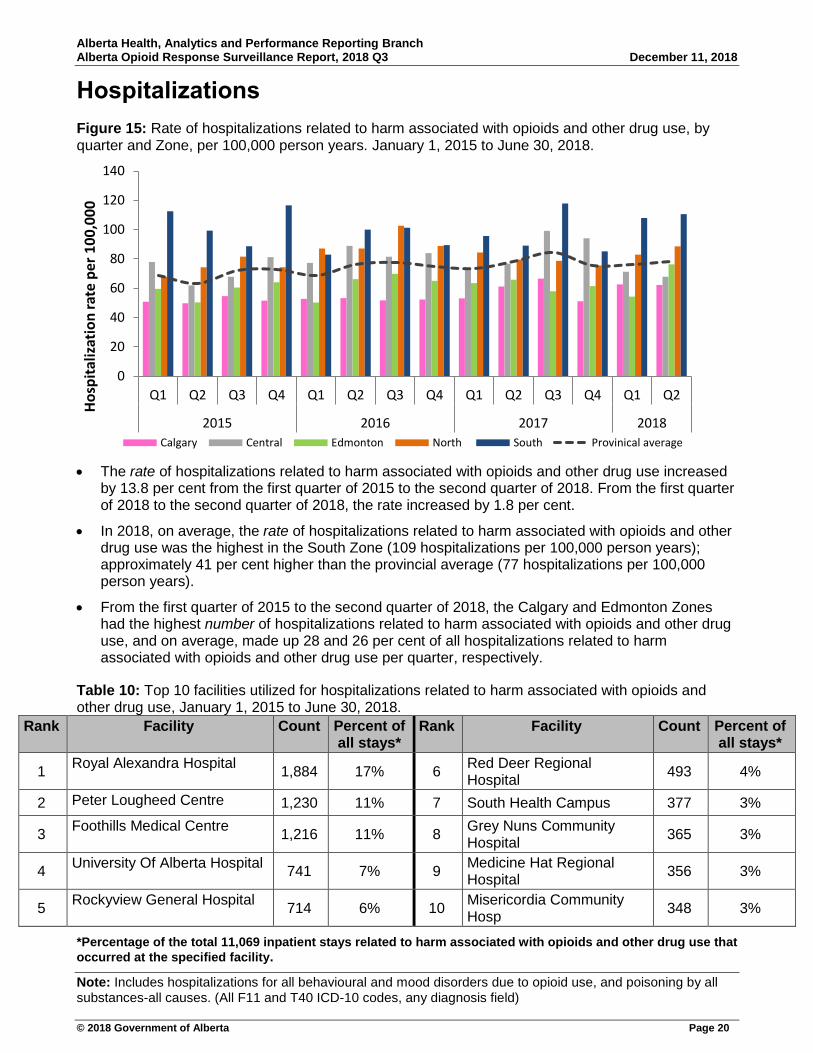
Figure 15: Rate of hospitalizations related to harm associated with opioids and other drug use, by quarter and Zone, per 100,000 person years. January 1, 2015 to June 30, 2018.
The rate of hospitalizations related to harm associated with opioids and other drug use increased by 13.8 per cent from the first quarter of 2015 to the second quarter of 2018. From the first quarter of 2018 to the second quarter of 2018, the rate increased by 1.8 per cent.
In 2018, on average, the rate of hospitalizations related to harm associated with opioids and other drug use was the highest in the South Zone (109 hospitalizations per 100,000 person years); approximately 41 per cent higher than the provincial average (77 hospitalizations per 100,000 person years).
From the first quarter of 2015 to the second quarter of 2018, the Calgary and Edmonton Zones had the highest number of hospitalizations related to harm associated with opioids and other drug use, and on average, made up 28 and 26 per cent of all hospitalizations related to harm associated with opioids and other drug use per quarter, respectively.
Table 10: Top 10 facilities utilized for hospitalizations related to harm associated with opioids and other drug use, January 1, 2015 to June 30, 2018.
Rank Facility Count Percent of all stays*
Rank Facility Count Percent of all stays*
1 Royal Alexandra Hospital
1,884 17% 6 Red Deer Regional Hospital
493 4%
2 Peter Lougheed Centre 1,230 11% 7 South Health Campus 377 3%
3 Foothills Medical Centre
1,216 11% 8 Grey Nuns Community Hospital
365 3%
4 University Of Alberta Hospital
741 7% 9 Medicine Hat Regional Hospital
356 3%
5 Rockyview General Hospital
714 6% 10 Misericordia Community Hosp
348 3%
*Percentage of the total 11,069 inpatient stays related to harm associated with opioids and other drug use that
occurred at the specified facility.
Note: Includes hospitalizations for all behavioural and mood disorders due to opioid use, and poisoning by all substances-all causes. (All F11 and T40 ICD-10 codes, any diagnosis field)
0
20
40
60
80
100
120
140
Q1 Q2 Q3 Q4 Q1 Q2 Q3 Q4 Q1 Q2 Q3 Q4 Q1 Q2
2015 2016 2017 2018
Ho
spit
aliz
atio
n r
ate
per
10
0,0
00
Calgary Central Edmonton North South Provinical average

Alberta Health, Analytics and Performance Reporting Branch Alberta Opioid Response Surveillance Report, 2018 Q3 December 11, 2018
© 2018 Government of Alberta Page 21
Methadone & buprenorphine/naloxone dispensing from community pharmacies
Figure 16: Rate of unique individuals dispensed methadone indicated for opioid dependence from community pharmacies per 100,000, by quarter and Zone. January 1, 2016 to September 30, 2018.
In Alberta, the rate of unique individuals dispensed methadone indicated for opioid dependence from community pharmacies per 100,000 increased slightly from the second quarter to the third quarter of 2018 by 2 per cent. The South Zone had the highest rate in the third quarter of 2018, 191 per cent higher than the provincial average (628 per 100,000 vs. 328 per 100,000).
Figure 17: Rate of unique individuals dispensed buprenorphine/naloxone (generic brands and SuboxoneTM) indicated for opioid dependence from community pharmacies per 100,000, by quarter and Zone. January 1, 2016 to September 30, 2018.
In Alberta, the rate of unique individuals dispensed buprenorphine/naloxone indicated for opioid dependence from community pharmacies per 100,000 continues to increase, as seen by the 6 per cent increase from the second to the third quarter of 2018. The South Zone had the highest rate in the third quarter of 2018, 217 per cent higher than the provincial average (798 per 100,000 vs. 367 per 100,000).
0
100
200
300
400
500
600
700
Q1 Q2 Q3 Q4 Q1 Q2 Q3 Q4 Q1 Q2 Q3
2016 2017 2018
Met
had
on
e d
isp
ensi
ng
rate
per
1
00
,00
0
Calgary Central Edmonton
North South Provincial average
0
100
200
300
400
500
600
700
800
900
Q1 Q2 Q3 Q4 Q1 Q2 Q3 Q4 Q1 Q2 Q3
2016 2017 2018
Sub
oxo
ne
dis
pen
sin
g ra
te p
er
10
0,0
00
CalgaryCentralEdmontonNorthSouth

Alberta Health, Analytics and Performance Reporting Branch Alberta Opioid Response Surveillance Report, 2018 Q3 December 11, 2018
© 2018 Government of Alberta Page 22
Naloxone kit dispensing and distribution through Alberta Health Services’ naloxone program Figure 18: Naloxone kits dispensed/distributed by registered site type, January 1, 2016 to September 30, 2018.
From January 1, 2016 to September 30, 2018, 100,176 naloxone kits were dispensed in Alberta through Alberta Health Services’ (AHS’) naloxone program, and 5,819 reversals were self-reported.
Approximately 3,250 naloxone kits were distributed in Alberta by the Alberta Community Council on HIV (ACCH) between July 2015 and January 2016. In January 2016, AHS began its naloxone program through registered distribution sites.
Table 11: Number of sites registered to distribute naloxone kits, January 1, 2016 to September 30, 2018.
South Calgary Central Edmonton North Total
Community pharmacies 91 388 130 367 113 1,089
AHS Health Centre 42 71 49 46 82 290
Medical First Response 12 15 25 11 26 89
AHS Mental Health 4 23 13 32 14 86
Private 13 20 15 25 4 77
First Nations sites 2 5 8 5 23 43
Primary Care Network 0 5 3 5 2 15
Corrections 2 4 1 3 1 11
ACCH Harm Reduction 2 1 1 1 3 8
Post-Secondary Institutions 0 2 2 3 0 7
Metis 0 0 0 1 6 7
AHS Regional Housing 0 3 0 3 0 6
Private Opioid Dependency Program 2 0 1 2 1 6
Peace Officers 0 2 0 1 2 5
AHS Opioid Dependency Program 1 1 0 1 1 4
Private Harm Reduction 0 0 1 2 0 3
Total 171 540 249 508 278 1,746
Note: Naloxone kits dispensing data from community pharmacies comes from Alberta Blue Cross. All other kit distribution
data comes from the AHS Naloxone Kit Program.
29781832806841,2181,5631,894
2,6733,694
25,28827,590
34,050
0 5,000 10,000 15,000 20,000 25,000 30,000 35,000 40,000
AHS regional housingPrimary Care Network
Post secondary institutionsPrivate harm reduction
MetisAHS Opioid dependency program
CorrectionsFirst Nations Sites
PrivateAHS Mental HealthAHS Health Centre
Community pharmaciesACCH Harm Reduction
Naloxone kits dispensed/distributed

Alberta Health, Analytics and Performance Reporting Branch Alberta Opioid Response Surveillance Report, 2018 Q3 December 11, 2018
© 2018 Government of Alberta Page 23
Figure 19: Naloxone kits dispensed/distributed by community pharmacies and other registered sites, by Zone. January 1, 2016 to September 30, 2018.
Throughout the province, non-pharmacy sites are dispensing more naloxone kits than community pharmacies (72 per cent of all kits given out by non-pharmacy sites).
While the Calgary Zone has dispensed the highest total volume of kits in the province (31 per cent), in the most recent quarter, the South Zone had the highest per 100,00 rate of kits dispensed from both community pharmacies and other registered sites, nearly three times higher than the provincial average.
Figure 20: Naloxone kits dispensed by community pharmacies, by Zone and month. January 1, 2016 to September 30, 2018.
Across Alberta, in 2018, community pharmacies dispensed an average of 1,480 kits per month, a decrease of 6 per cent from the previous reporting period (previous report: 1,577 per month).
The median age of an individual receiving a naloxone kit dispensed from a community pharmacy was 31 years, and 57 per cent were male.
Since January 1, 2016, 27,590 naloxone kits have been dispensed from community pharmacies in Alberta.
Note: Naloxone kit dispensing data from community pharmacies comes from Alberta Blue Cross. All other kit distribution
data comes from the AHS Naloxone Kit Program.
2,119 1,954
8,345
2,147
9,217
7,144 7,240
14,269
10,594
16,377
0
2,000
4,000
6,000
8,000
10,000
12,000
14,000
16,000
18,000
South North Edmonton Central Calgary
Nal
oxo
ne
kits
dis
pen
sed
Community pharmacies
Other registered sites
0
5,000
10,000
15,000
20,000
25,000
0
500
1,000
1,500
2,000
2,500
J F M A M J J A S O N D J F M A M J J A S O N D J F M A M J
2016 2017 2018
Cu
mu
lati
ve t
ota
l kit
s d
isp
en
sed
Nal
oxo
ne
kits
dis
pe
nse
d
North
Edmonton
Central
Calgary
South
Cumulative total
23,782
Alberta Health, Analytics and Performance Reporting Branch Alberta Opioid Response Surveillance Report, 2018 Q3 December 11, 2018
© 2018 Government of Alberta Page 24
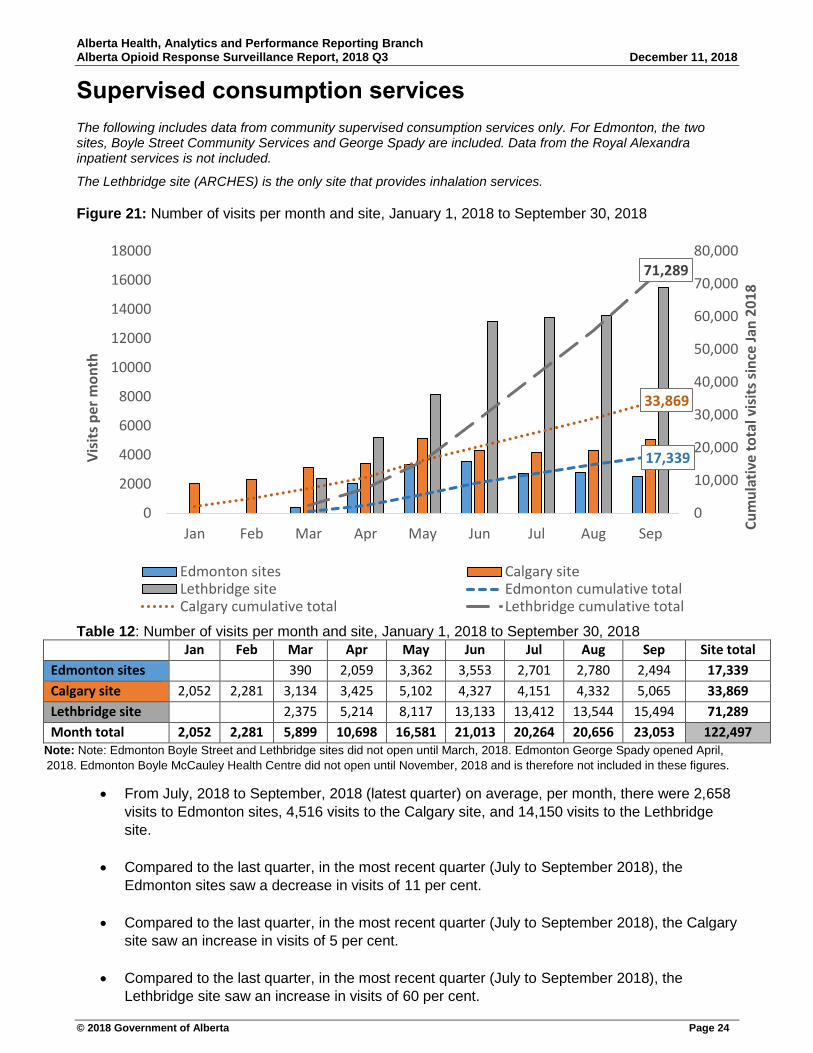
Supervised consumption services
The following includes data from community supervised consumption services only. For Edmonton, the two sites, Boyle Street Community Services and George Spady are included. Data from the Royal Alexandra inpatient services is not included.
The Lethbridge site (ARCHES) is the only site that provides inhalation services.
Figure 21: Number of visits per month and site, January 1, 2018 to September 30, 2018
Table 12: Number of visits per month and site, January 1, 2018 to September 30, 2018 Jan Feb Mar Apr May Jun Jul Aug Sep Site total
Edmonton sites
390 2,059 3,362 3,553 2,701 2,780 2,494 17,339
Calgary site 2,052 2,281 3,134 3,425 5,102 4,327 4,151 4,332 5,065 33,869
Lethbridge site
2,375 5,214 8,117 13,133 13,412 13,544 15,494 71,289
Month total 2,052 2,281 5,899 10,698 16,581 21,013 20,264 20,656 23,053 122,497 Note: Note: Edmonton Boyle Street and Lethbridge sites did not open until March, 2018. Edmonton George Spady opened April,
2018. Edmonton Boyle McCauley Health Centre did not open until November, 2018 and is therefore not included in these figures.
From July, 2018 to September, 2018 (latest quarter) on average, per month, there were 2,658
visits to Edmonton sites, 4,516 visits to the Calgary site, and 14,150 visits to the Lethbridge
site.
Compared to the last quarter, in the most recent quarter (July to September 2018), the
Edmonton sites saw a decrease in visits of 11 per cent.
Compared to the last quarter, in the most recent quarter (July to September 2018), the Calgary
site saw an increase in visits of 5 per cent.
Compared to the last quarter, in the most recent quarter (July to September 2018), the
Lethbridge site saw an increase in visits of 60 per cent.
17,339
33,869
71,289
0
10,000
20,000
30,000
40,000
50,000
60,000
70,000
80,000
0
2000
4000
6000
8000
10000
12000
14000
16000
18000
Jan Feb Mar Apr May Jun Jul Aug Sep
Cu
mu
lati
ve t
ota
l vis
its
sin
ce J
an 2
01
8
Vis
its
per
mo
nth
Edmonton sites Calgary siteLethbridge site Edmonton cumulative totalCalgary cumulative total Lethbridge cumulative total
Alberta Health, Analytics and Performance Reporting Branch Alberta Opioid Response Surveillance Report, 2018 Q3 December 11, 2018
© 2018 Government of Alberta Page 25
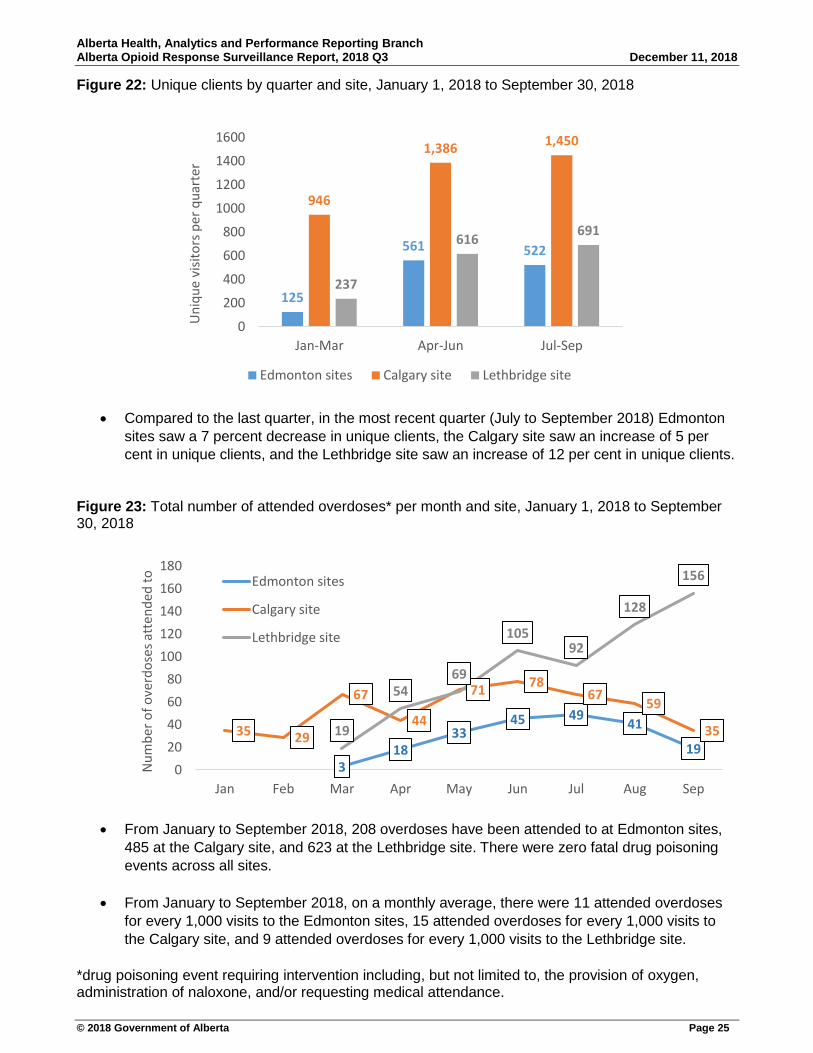
Figure 22: Unique clients by quarter and site, January 1, 2018 to September 30, 2018
Compared to the last quarter, in the most recent quarter (July to September 2018) Edmonton
sites saw a 7 percent decrease in unique clients, the Calgary site saw an increase of 5 per
cent in unique clients, and the Lethbridge site saw an increase of 12 per cent in unique clients.
Figure 23: Total number of attended overdoses* per month and site, January 1, 2018 to September 30, 2018
From January to September 2018, 208 overdoses have been attended to at Edmonton sites,
485 at the Calgary site, and 623 at the Lethbridge site. There were zero fatal drug poisoning
events across all sites.
From January to September 2018, on a monthly average, there were 11 attended overdoses
for every 1,000 visits to the Edmonton sites, 15 attended overdoses for every 1,000 visits to
the Calgary site, and 9 attended overdoses for every 1,000 visits to the Lethbridge site.
*drug poisoning event requiring intervention including, but not limited to, the provision of oxygen, administration of naloxone, and/or requesting medical attendance.
125
561 522
946
1,3861,450
237
616691
0
200
400
600
800
1000
1200
1400
1600
Jan-Mar Apr-Jun Jul-Sep
Un
iqu
e vi
sito
rs p
er q
uar
ter
Edmonton sites Calgary site Lethbridge site
318
3345 49
41
1935 29
67
44
7178
6759
3519
5469
10592
128
156
0
20
40
60
80
100
120
140
160
180
Jan Feb Mar Apr May Jun Jul Aug Sep
Nu
mb
er o
f o
verd
ose
s at
ten
ded
to
Edmonton sites
Calgary site
Lethbridge site

Alberta Health, Analytics and Performance Reporting Branch Alberta Opioid Response Surveillance Report, 2018 Q3 December 11, 2018
© 2018 Government of Alberta Page 26
Appendix 1: Opioid related poisoning deaths in major Albertan cities
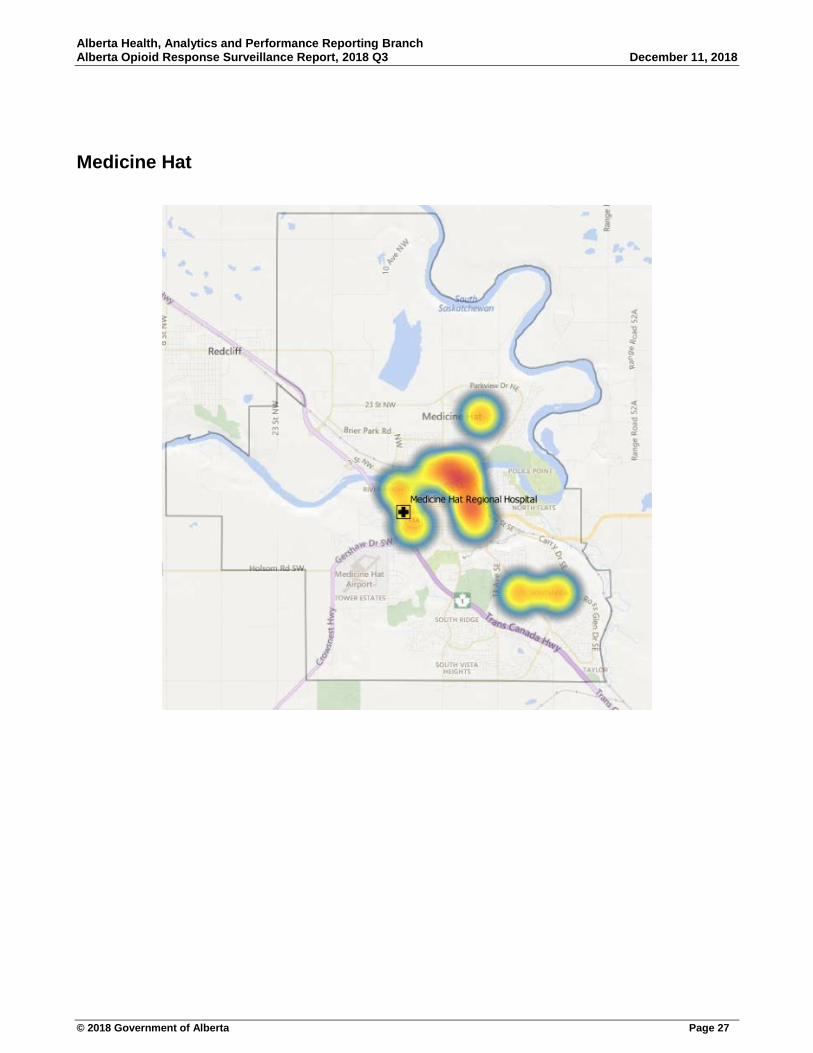
Apparent accidental opioid poisoning deaths, by Municipality (based on place of overdose). January 1, 2018 to September 30, 2018.
Lethbridge
Alberta Health, Analytics and Performance Reporting Branch Alberta Opioid Response Surveillance Report, 2018 Q3 December 11, 2018
© 2018 Government of Alberta Page 27
Medicine Hat
Alberta Health, Analytics and Performance Reporting Branch Alberta Opioid Response Surveillance Report, 2018 Q3 December 11, 2018
© 2018 Government of Alberta Page 28
Calgary
Alberta Health, Analytics and Performance Reporting Branch Alberta Opioid Response Surveillance Report, 2018 Q3 December 11, 2018
© 2018 Government of Alberta Page 29
Red Deer
Alberta Health, Analytics and Performance Reporting Branch Alberta Opioid Response Surveillance Report, 2018 Q3 December 11, 2018
© 2018 Government of Alberta Page 30
Edmonton

Alberta Health, Analytics and Performance Reporting Branch Alberta Opioid Response Surveillance Report, 2018 Q3 December 11, 2018
© 2018 Government of Alberta Page 31
Fort McMurray

Alberta Health, Analytics and Performance Reporting Branch Alberta Opioid Response Surveillance Report, 2018 Q3 December 11, 2018
© 2018 Government of Alberta Page 32
Grande Prairie

Alberta Health, Analytics and Performance Reporting Branch Alberta Opioid Response Surveillance Report, 2018 Q3 December 11, 2018
© 2018 Government of Alberta Page 33
Data notes
Data source(s) for report 1. Emergency department data-National Ambulatory Care Reporting System (NACRS)
2. Hospitalization data -Discharge Abstract Database (DAD)
3. Physician claims data –Supplemental Enhanced Service Event (SESE)
4. Alberta Health Care Insurance Plan (AHCIP) Quarterly Population Registry Files
5. Alberta Health Postal Code Translation File (PCTF)
6. Pharmaceutical Information Network (PIN)
7. Office of the Chief Medical Examiner (OCME) MEDIC data
8. AHS EMS Direct delivery and AHS contractors-ground ambulance services data
9. AHS Naloxone Program data
10. Alberta Blue Cross Data
11. Supervised consumption services
Mortality data
The following substances are used to identify opioid poisoning deaths.
Fentanyl: fentanyl, 3-methylfentanyl, acetylfentanyl, furanylfentanyl, norfentanyl, butyrylfentanyl, despropionylfentanyl, acrylfentanyl, methoxyacetylfentanyl, cyclopropylfentanyl, fluoroisobutyrlfentanyl (FIBF), or carfentanil
Non-fentanyl opioids: non-specified opiate, heroin, oxycodone, hydromorphone, morphine, codeine, tramadol, illicit synthetic opioids (e.g., U-47700), buprenorphine, or methadone
Fentanyl-related deaths are any deaths in which fentanyl or a fentanyl analogue was identified as a cause of death (these may also have involved non-fentanyl opioids). Non-fentanyl related deaths are deaths in which an opioid other than fentanyl or a fentanyl analogue was identified as a cause of death.
Emergency Medical Services data
Emergency Medical Services (EMS) data comes from AHS EMS Direct delivery and most AHS Contractor – ground ambulance services. Air ambulance and Interfacility Transfers are not included. AHS direct delivery does 97 per cent of the operational responses in the Municipality of Edmonton, 99 per cent in the Municipality of Calgary, and approximately 82 per cent in the entire province of Alberta. MS opioid related events refer to any EMS response where the Medical Control Protocol of Opiate Overdose was documented and/or naloxone was administered.
Emergency visits
Emergency Department (ED) visits are defined by the Alberta MIS chart of accounts. Specifically, the three Functional Centre Accounts used to define any ACCS (Alberta Care Classification System) visits into an emergency visit could be:
1. 71310 – Ambulatory care services described as emergency
2. 71513 – Community Urgent Care Centre (UCC). As of 2014, the UCCs in Alberta are listed below:
Airdrie Regional Health Centre, Cochrane Community Health Centre, North East Edmonton Health Centre, Health First Strathcona, Okotoks Health and Wellness Centre, Sheldon M Chumir Centre, South Calgary Health Centre
3. 71514 – Community Advanced Ambulatory Care Centre (AACC). As of 2014, the only AACC in Alberta is La Crete Health Centre

Alberta Health, Analytics and Performance Reporting Branch Alberta Opioid Response Surveillance Report, 2018 Q3 December 11, 2018
© 2018 Government of Alberta Page 34
Community pharmacy drug dispensing
1. The Pharmaceutical Information Network (PIN) Database is used to estimate dispensation events for the province between 2014 and 2016 only from community pharmacies. Variability can be dependent on the way the drug is prescribed.
2. The PIN database is up-to-date. PIN records can change due to data reconciliations, which may affect results. Results are more stable with older data.
Opioid dependency drugs are defined by the ATC code (Anatomical Therapeutic Chemical), as given in the table below.
The following DINs were excluded since they are indicated for pain relief by Health Canada.
02247701, 02247700, 02241377, 02247699, 02247698, 02247694
ATC Code Drug Name ATC Grouping
N07BC51 Buprenorphine, combinations Drugs used in opioid dependence
N07BC02 Methadone Drugs used in opioid dependence