alfred r. fregly grcrylaiel
TRANSCRIPT
NAM 1-994 V
LABYRINTHINE DEFECTS AS SHOWN BY ATAXIA AND CALORIC TESTS
Alfred R . Fregly and Ashton Grcrylaiel
August 1968
This document has been approved for public release and sale; i t s distribution i s unlimited.
I I I
I This document has been approved for public release and sale; i t s distribution i s unlimited. l
I
I * LABYRINTHINE DEFECTS AS SHOWN BY ATAXIA AND CALORIC TESTS*
Alfred R. Fregly and Ashion Graybiel
I
1
Bureau of Medicine and Surgery MR005.04-002 1 .144
NASA Order R-93
Rei eased by
Captain J . W. Weaver, MC USN Commanding Officer
22 August 1968
* This research was conducted under the sponsorship of the Office of Advanced Research
and Technology, National Aeronautics and Space Administration.
NAVAL AEROSPACE MEDICAL INSTITUTE NAVAL AEROSPACE MEDICAL CENTER
PENSACOLA, FLORIDA 32512
SUMMARY PAGE
THE PROBLEM
How well do ataxia test scores that fall at the lowest 5 per cent of the normative distributions predict threshold caloric responses also falling i n the same range, and, conversely, how well do the caloric responses predict the ataxia test scores i n various groups of individuals?
F I ND I NG S
Most of the individuals with labyrinthine defects severe enough to produce ataxia test performances scores within the lowest 5 per cent o f the normal distributions also showed threshold caloric test responses which fel l within the same range. Similarly, almost as many individuals with decreased threshold caloric test responses also showed poor ataxia test performance scores. In those individuals with total or near total bi- lateral loss of labyrinthine function each test was the maximum, or nearly maximum, predickr o f the other.
ACKNOWLEDGEMENTS
Appreciation i s expressed io Doctors James R. Nelson, Paul H. Nieberding, Laurence E. Thomas, James M. Haynes, Vernon C. Bragg, William F. House, D. Robert Frisina, Harold F. Schuknecht, M. E. McLeod, and to Mr. James C. Sansing for their assistance. We are especially indebted to Mr. Theron L. Trimble who ad- ministered a l l of the caloric and most o f the ataxia tests.
INTRODUCTION
As part of our study of the problems of man's gravitoinertial force environment in space flight, particular attention has been given to testing the vestibular organs to determine their role i n man's abil ity to withsiund such an environment. A threshold caloric test (8) and an ataxia test battery (1,5) were introduced recently as part of the testing procedure at this laboratory. They serve as rapid, reliable screening tests for selecting individuals without known labyrinthine defects from those who have such de- fecfs, and provide a means for comprehensively studying their vestibular apparatus.
b
Slight, even moderate, degrees of vestibular ataxia may go unrecognized in persons who either do not challenge their capabilities in this regard or misinterpret their handicap as poor "athletic ability. 'I Moreover, ataxia as well as a loss of semi- circular canal function may go undetected during routine medical evaluations because of insufficiently precise measurements. Our findings with the threshold caloric test and the quantitative ataxia test battery have led us to suspect abnormal scores on both if either one i s abnormal. The purpose of this report i s to demonstrate their diagnostic value independently and jointly, based on an analysis of the scores obtained on 365 individuals classified either as normal subjects or as persons with various diseases and disorders of the inner ear.
PROC EDUR E
SUBJECTS
The ''vestibular normal11 group consisted of 240 men, i n the age range of 17 to 63 years, who had been tested by the threshold caloric and by the ataxia test battery. The group included student military aviators, volunteer Navy enlisted research subjects, medical students, Navy deep sea divers, individuals with varied experience on centri- fuges, and military and civil ian technical and scientific personnel. A l l were in good health and free of any known vestibular disturbance, and had had benefit of recent medical and audiometric evaluations.
The group of patients with vertigo included men and women (N=76), with an age range of 18 io 71 years, who were referred from military and civil ian physicians because of vertigo as a major symptom or complaint. The great majority of these referrals pre- sented a diagnostic problem; some had received a tentative diagnosis, while the symptoms of others could not be diagnosed. Diagnoses of the remaining few individuals represented the following classifications: vestibular neuronitis, typical and atypical Mdnigre's syn- drome, postural vertigo, positional nystagmus, labyrinthine artery occlusion, post- traumatic pseudobulbar palsy, acoustic trauma, longstanding deafness, orthostatic light- headedness, cerebral vascular insufficiency, and psychogenic disorder. The health and physical status of these patients were adequate for undergoing testing.
The group of bilateral labyrinthine-defective (BL-D) subjects consisted of 26 men, 18 to 48 years of age, in whom meningitis or mastoiditis had developed early in life.
1
Ten of these subjects have participated frequently in the vestibular research program at this laboratory (2,4); the other 16 subjects with highly similar afflictions had been screened recently from a larger population of deaf students and faculty at Gallaudet College for the purpose of their participating in vestibular research. The health and physical status of these individuals ranged from good to excellent.
Eleven individuals constituted the group of unilateral labyrinthine-defectives (UL-Ds) and included men and women, in the age range of 33 to 58 years, who were treated surgically for acoustic neuroma (7) one-half year to three years prior to thres- hold caloric and ataxia testing. Their health and physical status were adequate for undergoing testing.
The group with Mgnikre's syndrome, treated with streptomycin sulfate ten years previously (6), was composed of three men, 42, 50, and 56 years of age, and one woman, 49 years of age. Their health and physical status were adequate for testing.
Another group consisted of five men, 21 to 34 years of age, i n whom total or near total deafness had occurred as a result of head injury and who were screened from a larger population of deaf students and faculty a t Gallaudet College. A l l were in excellent health and good to excellent physical condition.
The group of congenitally deaf subjects consisted of two men, 19 and 20 years of age, and one woman, 19 years of age. As established from available health records, questionnaires, and interviews, a l l of this group had been totally deaf since birth or before their first birthday. The etiology was not known. Their health and physical condition were good to excellent.
APPARATUS AND METHOD Threshold Caloric Test -
The apparatus and procedures were nearly identical to those described previously by McLeod and Meek (8). In the majority of cases a single Bronwill constant temper- ature regulator was used, and in the remaining cases the apparatus consisted of a pair of these regulators, a Yellow Springs thermistor, and Yellow Springs telethermometer that maintained constant water temperature. The thermistor was located at the tip of the irrigating nozzle and detected the temperature of the water as i t left the end of the irrigating tube; the telethermometer indicated this temperature to the nearest 0.1' C. The nozzle tip was 1 mm in diameter and permitted delivery of 100 to 120 cc of water against the ear drum during the 40 seconds o f irrigation.
Subjects were positioned either in a chaise lounge (lawn type) or on a couch so that a line drawn fmm the outer canthus of fhe eye to the tragus of the ear was vertical. This placed the horizontal semicircular canals in an approximately vertical plane. Prior to irrigation the mom was darkened. After 30 seconds of irrigation the subjects were given a mental arithmetic problem to maintain alertness. While the subject looked straight ahead (towards the ceiling), his eyes were observed under illuminated Frenzel lens for nystagmus for a period of 30 to 60 seconds after irrigation stripped. The threshold
i 2
caloric response was defined as the temperature of the irrigating water which elicited a minimum of three successive nystagmic beats in the appropriate direction within any fivesecond period following cessation of irrigation. Electronystagmographic records, which indicated quantitatively that this criterion was m e t , were obtained simultaneously on the more recently tested symptom-free normals, o n some patients with vertigo (approximately 15%), and o n all of the labyrinthine-defective subjects.
Because few responses above the %.A0 C to 36.6' C range could be elicited (8), the initial irrigating water temperature used with hose subjects (the rnaiorify) tested earliest was 3 6 . 4 O C. Increased experience with the test method, however, indicated that, in s o m e individuals, the most accurate threshold could be obtained with a n initial irrigating temperature as high as 36.8' C.
.
In those instances in which nystagmus was unusually strong or weak, threshold levels were redefined upwards by repeat irrigation with water warmed in 0.20 C incre- ments when the responses were strong, and with water cooled in 0.20 C decrements when they were weak, until changes, if any, could be noted. In this manner accumcy of the threshold response was maximized.
Five minutes elapsed between irrigations. First the right ear then the left ear was irrigated, followed by continued alternate irrigation with upward o r downward adjusf- ment of water temperature until a threshold response for each ear was firmly established or, in sub'ects having severe vestibular defects, could be established within the lowest b limit (2.6 C) of the irrigating water temperature. In the interest of saving time and preserving subject motivation and alertness, initial decreases in the stimulus applied to labyrinthine-defective individuals were often in 5.0' C and 10.00 C rather than in 0.20 steps.
Rail and Floor Ataxia Test Batteries ----- The seven performance test items are described here only briefly since detailed
descriptions have been previously published (1,5). The t e s t s were administered in the following sequence: 1) Sharpened Romberg (SR), consisting of standing on the floor with eyes closed for 60 seconds; 2) rail walking and rail standing; 3) standing on one (each) leg on the floor with eyes closed for 30 seconds (SOLEC-R and SOLEC-L); 4) walking a 12-foot line on the floor with eyes closed (WALEC), scored as inches of deviation from the line. Rail walking and rail standing consisted of (a) walking with eyes open (Walk E/O) o n a 3/4-inch by 8-foot rail, scored as number of steps (maximum of five steps per trial); (b) standing with eyes open (Stand E/O) o n the 3/4- inch rail, scored to the nearest second (maximum of 60 seconds per trial); and (c) stand- ing with eyes closed (Stand E/C) o n a 2-1/4 by =-inch rail, also scored to the nearest second with a maximum of 60 seconds per trial.
The body position required of all subjects was: (a) body erect or nearly erect, (b) arms folded against chest, and (c) feet, -- shoes on, tandemly aligned heel-to-toe (SO LEC tests excepted).
3
RESULTS
The distribution of the threshold caloric responses of the ''normative" group and of the group of patients referred because of vertigo are shown in Tables I and I I , respectively, and the individual threshold caloric test responses in the five other groups of subjects are shown in Table 1 1 1 . The individual mil and floor ataxia test battery performance scores obtained in a l l except the normal and vertigo patient groups are shown in Tables IV and V.*
"Abnormal I' threshold caloric responses are defined arbitrarily as responses hav- ing a 5th percentile or lower equivalent (s34.50 C) in relation to the distribution of responses in the less sensitive ear of the normative group (Table I ) . Similarly, ''abnormal" ataxia test performance sk i l l s are defined arbitrarily as scores having a 5th percentile or lower equivalent in relation to normative standards of performance in various age classifications, as reported elsewhere (1,5). For example, scores having 5th percentile mnkings i n a control (standardization) group of 17-42-year-old normal men were 171 (SR), 6 (Walk E/O), 11 (Stand E/O), 15 (Stand E/C), 56 (SOLEC-R), 59 (SOLEC-L), and 24 (WALEC), and in a control (standardization) group of 18-29- year-old women the corresponding scores were 35, 5, 11, 16, 27, 36, and 24 on these tests.
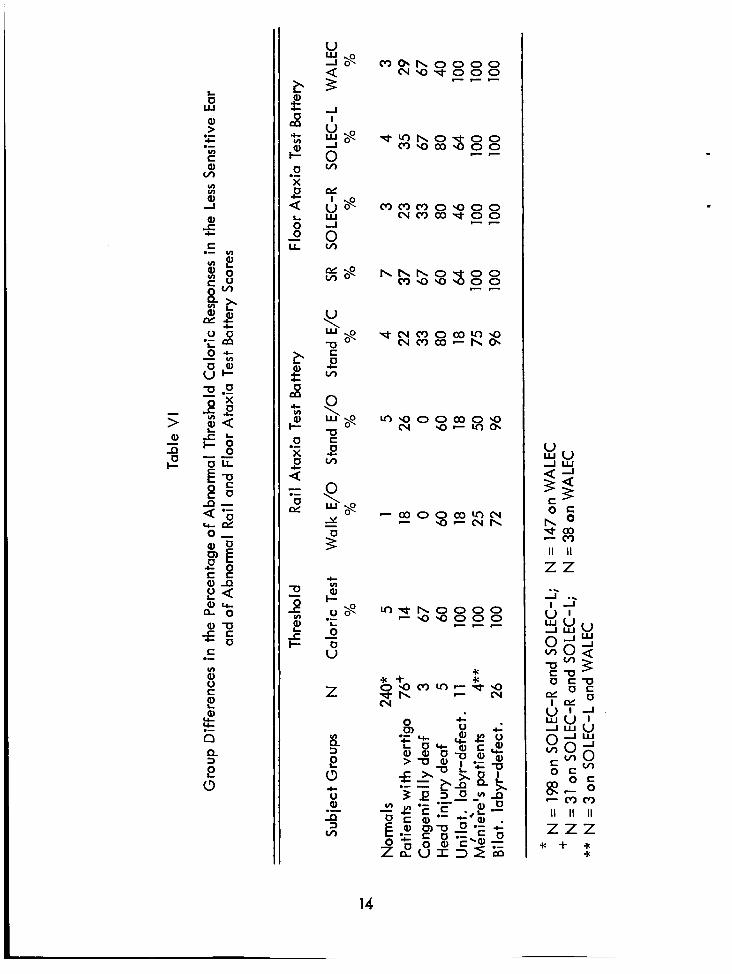
GROUP DIFFERENCES IN ABNORMAL RESPONSES TO TESTS
As shown in Table VI, the threshold caloric response of a l l of the BL-Ds, Me'ni&re's patients, and UL-Ds were abnormal as defined by the arbitrary cui-off criterion; 60 per cent and 67 per cent of the head injury deaf and congenitally deaf individuals, respectively, and 14 per cent of the patients with vertigo also had ab- normal threshold caloric responses. The group differences in the frequency of abnormal ataxia test scores very nearly paralleled those in caloric responses. Generally, the greater the vestibular loss, as shown by decreased response to caloric stimulation in the less sensitive ear, the greater was the likelihood that such loss would be reflected also by impaired ataxia test performance. Of particular interest was the finding that indi- viduals with various loss of labyrinthine function were more often identified as being abnormal by their floor ataxia test battery scores than by their ra i l ataxia test baftery scores.
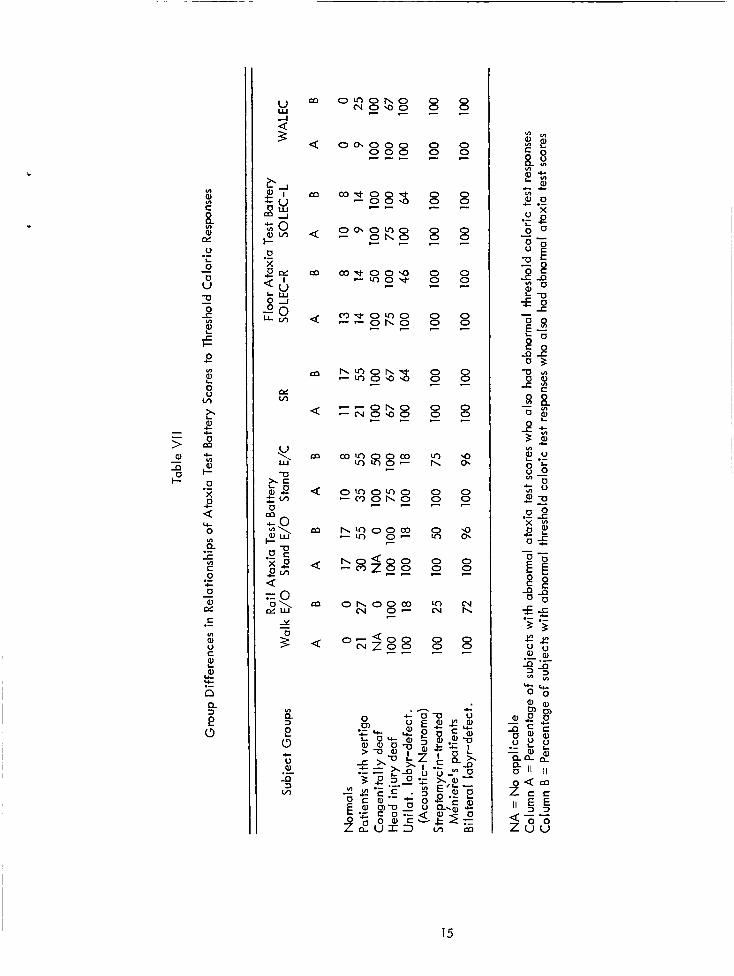
BETWEEN-TEST PRED ICTAB l L l N '%
The percentage of subjects in each group with abnormal ataxia test scores who also had abnormal threshold caloric test responses, and, conversely, the percentage of subjects in each group with abnormal threshold caloric test responses who also had abnormal ataxia test scores are indicated i n Table VII. - - - - - - - - - -
All tables appear a t end of text. *
4
Abnormal ataxia test scores were found to be highly predictive of abnormal threshold caloric test responses not only of individuals with bilateral or unilateral labyrinthine defects but also of the congenitally deaf and head injury deaf. More- over, more than twice the percentage of patients with vertigo who had abnormal ataxia test scores than of normal individuals who had such scores were identified also, as having abnormal threshold caloric test responses. patients, and BL-Ds predictability was perfect; i.e. , abnormal scores on each of the seven items comprising the rail and floor ataxia test batteries showed maximum (100%) prediction of abnormal threshold caloric test responses. In a l l five groups of subjects in which VIIlth nerve involvement was certain (patients with vertigo and the normals excluded), the WALEC test was the best single predictor of abnormally reduced sensi- t ivity to caloric stimulation of the vestibular organ.
In the groups of UL-Ds, Miniere's
-
Similarly, abnormal threshold caloric test responses were highly predictive of abnormal ataxia test scores (B columns, Table Vll). and in the group of BL-Ds, the prediction was perfect i n the four items making up the floor ataxia test battery, and was substantial (25% to 96% agreement) on the rai l ataxia test battery. In the remaining three groups i n which VIIlth nerve involvement was certain (UL-D, HID, and CD) 18 per cent to 100 per cent of subiects with abnormal threshold caloric responses also had impaired postural equilibrium. An impressive 14 per cent to 55 per cenf of patients with vertigo who were identified as having ab- normal caloric thresholds also were identified as being ataxic, whereas only 0 to 17 per cent o f the normals were so identified.
In the group of MeniBre's patients
Generally, scores on the WALEC and SR tests were the best predictors and those of the Stand E/O and Walk E/O tests the poorest predictors of abnormal caloric re- sponses. It i s apparent also from results in Table VI1 that abnormal ataxia test scores predicted abnormal caloric responses better than abnormal caloric responses predicted abnormal ataxia test scores.
It i s of further interest to note that, i n the group of patients with vertigo, those who had a I 5th percentile level caloric response unilaterally did not differ i n the extent of their ataxia (frequency of abnormal scores on items of the test batteries) from those who had 5 5th percentile level caloric responses bilaterally. Thus from the stand- point of an ataxia test, bilateral loss was equivalent to unilateral loss of horizontal canal sensitivity to threshold caloric stimulation. Similarly, in this same group, com- parison of the most ataxic individuals on the basis of the percentage of ataxia tests on which scores fel l 5 5th percentile level revealed no systematic differences in caloric thresholds i n the: 1) less sensitive ear, 2) more sensitive ear, 3) mean responses of both ears, 4) between-ear difference in responses, and 5) frequency of unilateral versus bilateral responses 5 5th percentile level. I t i s noteworthy also that the levels of thres- hold caloric responses i n this group (Table II) were independent of age and sex influences.
5
DISCUSSION
The abil ity of the threshold caloric test and the ataxia test battery mutually to identify those individuals with severe unilateral or bilateral labyrinthine defects was of a high order. At the lowest 5 per cent of the caloric test and ataxia test score dis- tributions, a t least, ataxia test performance s k i l l s appear to have a common relationship with sensitivity of the horizontal semicircular canals to caloric Stimulation. In larger samples of individuals who have various loss of labyrinthine function, it would be use- ful to use other cut-off criteria, ranging from the lowest 1 per cent to the lowest 15 per cent or more. In large samples, moreover, correlation, including multiple cor- relation, procedures would permit determination of the minimum number of ataxia tests and the best combination of those tests that could reliably predict, and be pre- dicted by, threshold caloric test responses. From present indications, i t appears that results on the tests performed with eyes closed, particularly walking, would be ex- pected to yield the highest relationship to results of threshold caloric testing.
.
The threshold caloric response standards set forth in Table I show that 95 per cent of "normal" individuals had threshold values between 2 34.6' C in the less sensi- tive ear and 2 35.4' C in the more sensitive ear. The latter i s identical to the average response found earlier in both ears in a different, although probably equivalent, sample of individuals (8). The 0.9' C difference in thresholds between the more sensitive and the less sensitive ear a t the lowest 5 per cent of the distributions and the lesser dif- ference in thresholds between ears at other points on the distributions (0. !?' C - 0.6OC ), i f shown to be reliable upon testing of larger samples of individuals, may have both prac- tical and theoretical implications. In addition io a need for statistical crossvalidation, clinical validity of caloric test findings at the lowest ends of the distribution i s desir- able.
Among the twelve normal individuals having the lowest responses i n the less sensitive ear, four were Navy deep sea divers who have descended to 200 feet using only scuba gear; one suffered a ruptured ear drum due to blocking of the eustachian tube during a low pressure chamber descent, and one had sustained a broken neck in a racing car mishap many years previously. The remaining six individuals had either slight unilateral hearing loss, as established by audiometric testing, or complete free- dom from any clinically detectable otoneurological defect.
The identification of far fewer patients with vertigo than individuals with pro- nounced labyrinthine defects as abnormal on the ataxia test or caloric test reflects the fact that such patients represented heterogenous types and severity of otoneurological disturbances or were not free of other medical problems, and, therefore, could not be grouped by any single criterion other than having been referred by an otologist or neurologist. The diagnostic classifications of those having abnormal caloric thresholds included Mgnigre's syndrome (three), vestibular neuronitis (one), streptomycin deaf- ness (one), severe unilateral deafness (two), paroxysmal positional vertigo (one), and "vertiginous epilepsy " (one).
6
CONCLUSIONS
'
An investigation of the frequency with which abnormal scores on ataxia tests are associated with abnormal scores on a threshold caloric test i n limited samples of indi- viduals who had various loss of labyrinthine function revealed the following:
1. Most individuals with labyrinthine defects severe enough so that their ataxia test performance scores fell within the lowest 5 per cent of the normal dis- tribution of scores also had threshold caloric responses which fell within the same range.
2. Similarly, almost as many individuals w i th impaired threshold caloric test test responses also showed impairments i n their ataxia test performance scores.
3. One third to one fifth of a heterogenous group of patients with vertigo were differentiated from a group of symptom-free normals by the frequency with which ataxia test scores and threshold caloric test responses alike fell 5 5th percentile levels.
4. Generally, the severity of loss or disturbance o f labyrinthine function p a r alleled the severity of impairment of caloric responses and ataxia test per- formances.
5. Among the ataxia tests, walking a line on the floor with eyes closed (WALEC) was the most sensitive and walking a 3/4-inch-wide rail with eyes open (Walk E/O) was the least sensitive to loss or disturbance of labyrinthine function.
6. Ataxia tests performed with eyes closed were more sensitive to various loss or disturbance o f labyrinthine function than were those ataxia tests performed with eyes open.
7. While influences governing threshold caloric test responses are far more
agreement shown between results of each in groups of individuals with various loss or disturbance of labyrinthine function implies a common vestibular effect to a considerable degree.
I I
specific than those affecting results on the ataxia tests, the high degree of ~
7
REFERENCES
1 . Fregly, A. R. , and Graybiel, A. , An ataxia test battery not requiring rails. Aerospace -*I- Med 393277-282, 1968.
2. Graybiel, A. , Vestibular sickness and some of its implications for space flight. - in: Fields, W. S. , and Alford, B, R. (Eds.), Neurological Aspects of Auditory - and Vestibular Disorders. Springfield, 111. : Charles C Thomas, 1 9 a . Pp. 248-270.
-
. 3. Graybiel, A. , Functional disturbances of vestibular origin of significance in space
flight. Presented at the Second international Symposium on Basic Environmental Problems of Man in Space, Paris, France, June 14-18, 1965.
4. Graybiel, A., Orientation in aerospace flight. Special Report No. 66-6. NASA Order No. R-93. Pensacola, Fla. : Naval Aerospace Medical institute, 1966.
5. Graybiel, A. , and Fregly, A. R., A new quantitative ataxia test battery. - Acta otolaryng . , Stockh. , - 61:292-312, 1966.
6. Graybiel, A., Schuknecht, H. F., Fregly, A. R., Miller, E. F. II, and McLeod, M. E. , Streptomycin in M&iere's disease: Long-term follow-up. Arch. Otolaryng 85: ' 56- 170, 1967.
' I - - 7. House, W. F . (Ed.), Transtemporal bone microsurgical removal of acoustic
neuromas. Monograph. - Arch. Otolaryng * ' - 80597-756, 1964.
8. McLeod, M. E., and Meek, J. C., A threshold caloric test: Results in normal subiects. NSAM-834. NASA Order No. R-37. Pensacola, Fla.: Naval School of Aviation Medicine, 1962.
8
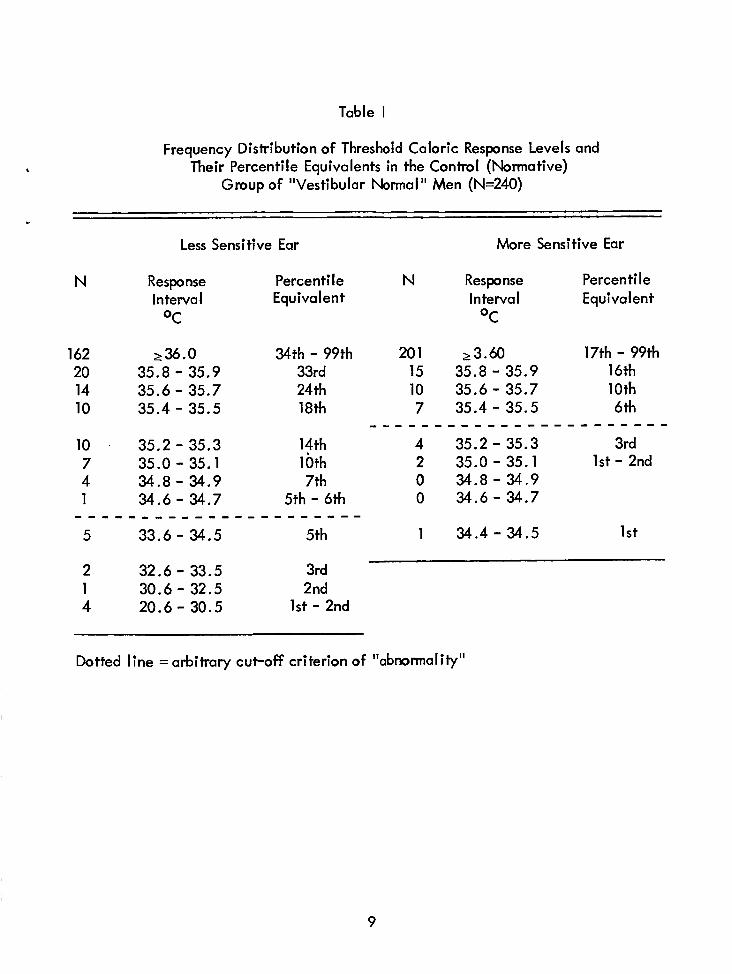
Table 1
Frequency Distribution of Threshold Caloric Response Levels and Their Percentile Equivalents in the Control (Normative)
Group of "Vestibular Normal" Men (N=240)
Less Sensitive Ear More Sensitive Ear
N Response Percen ti I e N Response Percentile I nterva I Equivalent Interval Equivalent
OC OC
162 236.0 34th - 99th 20 35.8 - 35.9 33rd 14 35.6 - 35.7 24 th 10 35.4 - 35.5 18th
10 . 35.2-35.3 14th 7 35.0 - 35.1 10th 4 34.8 - 34.9 7th
5 33.6 - 34.5 5th
1 34.6 - 34.7 5th - 6th . . . . . . . . . . . . . . . . . . . . . .
20 1 23.60 17th - 99th 15 35.8- 35.9 16th
7 35.4 - 35.5 6th
4 35.2 - 35.3 3rd 2 35.0 - 35.1 1st - 2nd 0 34.8- 34.9 0 34.6-34.7
10 35.6- 35.7 loth
. . . . . . . . . . . . . . . . . . . . . . .
1 34.4-34.5 15t
2 32.6 - 33.5 3rd 1 30.6 - 32.5 2nd 4 20.6 - 30.5 1st - 2nd
Dotted line = arbitrary cui-off criterion of "abnormality"
9
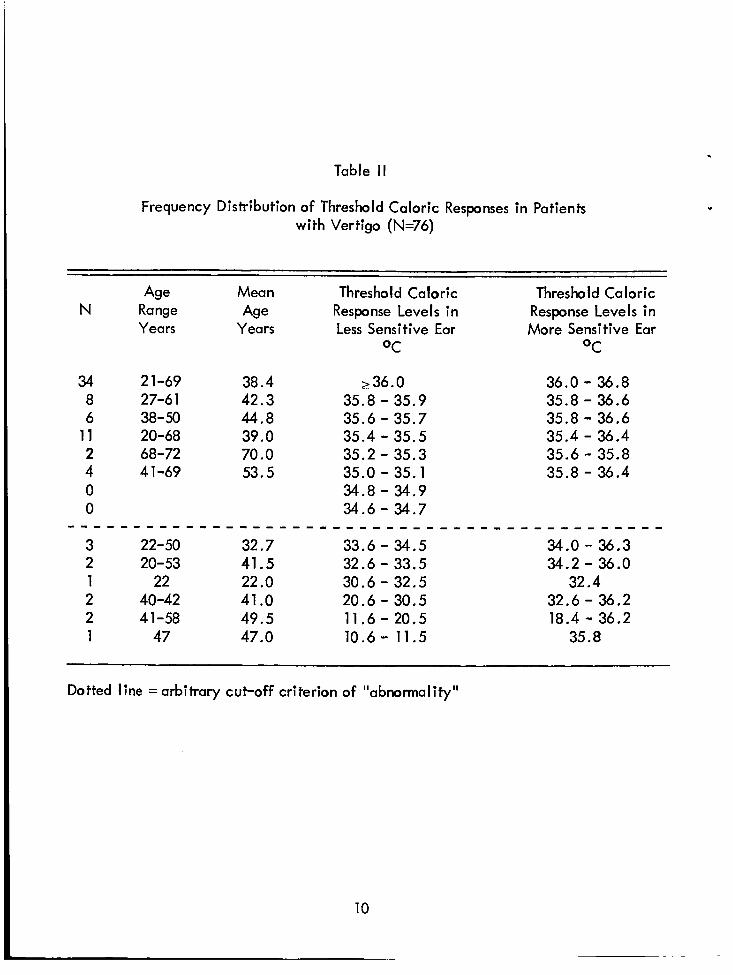
Table II
Frequency Distribution of Threshold Caloric Responses in Patients with Vertigo (N=76)
Age Mean Thresh0 Id Caloric Threshold Caloric N Range Age Response Levels in Response Levels in
Years Years Less Sensitive Ear More Sensitive Ear OC OC
34 2 1-69 38.4 236.0 36.0 - 36.8 8 27-6 1 42.3 35.8 - 35.9 35.0 - 36.6 6 38- 50 44.8 35.6 - 35.7 35.8 - 36.6
11 20-68 39.0 35.4 - 35.5 35.4 - 36.4 2 68-72 70.0 35.2 - 35.3 35.6 - 35.8 4 4 1-69 53.5 35.0 - 35.1 35.8 - 36.4 0 34.8 - 34.9 0 34.6 - 34.7
3 22-50 32.7 33.6 - 34.5 34.0 - 36.3 2 20-53 41.5 32.6 - 33.5 34.2 - 36.0 1 22 22 .o 30.6 - 32.5 32.4 2 40-42 41 .O 20.6 - 30.5 32.6 - 36.2 2 41-58 49.5 11.6 - 20.5 18.4 - 36.2 1 47 47.0 10.6- 11.5 35.8
. . . . . . . . . . . . . . . . . . . . . . . . . . . . . . . . . . . . . . . . . . . . .
Dotted line = arbitrary cut-off criterion of IIabnormaIity"
10
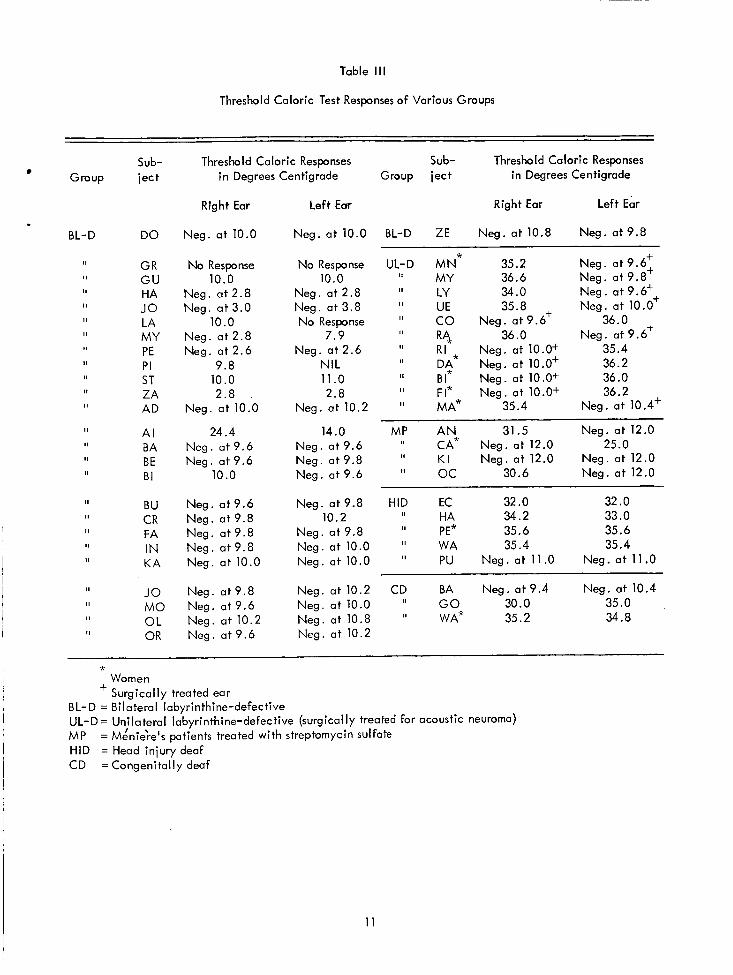
Table Ill
Threshold Caloric Test Responses of Various Groups
Group
BL-D
II
II
I II
II
II I 1
I II
II
II
II I
Sub- ject
DO
GR G U HA JO LA MY PE P I ST ZA AD
A I BA BE BI
BU CR FA IN KA
JO M O OL OR
Threshold Caloric Responses Sub- Threshold Caloric Responses in Degrees Centigrade Group ject i n Degrees Centigrade
Right Ear
Neg. a t 10.0
No Response 10.0
Neg. a t 2 . 8 Neg. a t 3.0
10.0 Neg. a t 2.8 Neg. a t 2.6
9.8 10.0 2.8
Neg. a t 10.0
24.4 Neg. a t 9.6 Neg. a t 9.6
10 .o
Neg. a t 9.6 Neg. a t 9.8 Neg. a t 9 . 8 Neg. a t 9.8 Neg. a t 10.0
Neg. a t9 .8 Neg. a t 9 . 6 Neg. a t 10.2 Neg. a t 9.6
Left Ear Right Ear Left Ear
Neg. a t 10.0 BL-D ZE Neg. a t 10.8 Neg. at 9.8
No Response 10.0
Neg. a t 2.8 Neg. at 3.8 No Response
7.9 Neg. a t 2.6
NIL 11.0 2.8
Neg. a t 10.2
14.0 Neg. a t 9.6 Neg. a t 9.8 Neg. at 9.6
UL-D MN* 35.2 Neg. a t 9.6: II 36.6 Neg. a t 9.8 MY
UE I1 LY 34.0 Neg. a t 9.6++ II 35.8 + Neg. a t 10.0 II CO Neg. a t9 .6 36.0 +
'I R 4 , 36.0 Neg. a t 9.6 II Neg. a t 10.0+ 35.4 II 36.2 II B I Neg. a t 1 O . W 36.0 II FI* Neg. a t 10.0+ 36.2 II MA* 35.4 Neg. a t 10.4'
,I CA* Neg. a t 12.0 25.0 I I K I Neg. a t 12.0 Neg. a t 12.0
RI * D,$ Neg. a t 10.0'
MP A N 31.5 Neg. a t 12.0
Neg. a t 12.0 oc 30.6
Neg. at9.8 HID EC 32 .O 32.0 II HA 34.2 33.0 I, 35.6 Neg. a t 9.8 PE* 35.6
Neg. a t 10.0 'I PU Neg. a t 11.0 Neg. a t 11.0
10.2
Neg. a t 10.0 I' WA 35.4 35.4
Neg. a t 10.2 CD BA Neg. a t9 .4 Neg. a t 10.4 Neg. a t 10.0 I' G O 30.0 35.0 Neg. at 10.8 'I WAX 35.2 34.8 Neg. a t 10.2
* Women Surg ica I I y treated ear
+ B L- D = Bilateral labyrinthine-defec tive UL-D = Unilateral labyrinthine-defective (surgically treated for acoustic neuroma) MP HID = Head injury deaf CD =Congenitally deaf
= MLnieh's patients treated with streptomycin sulfate
11
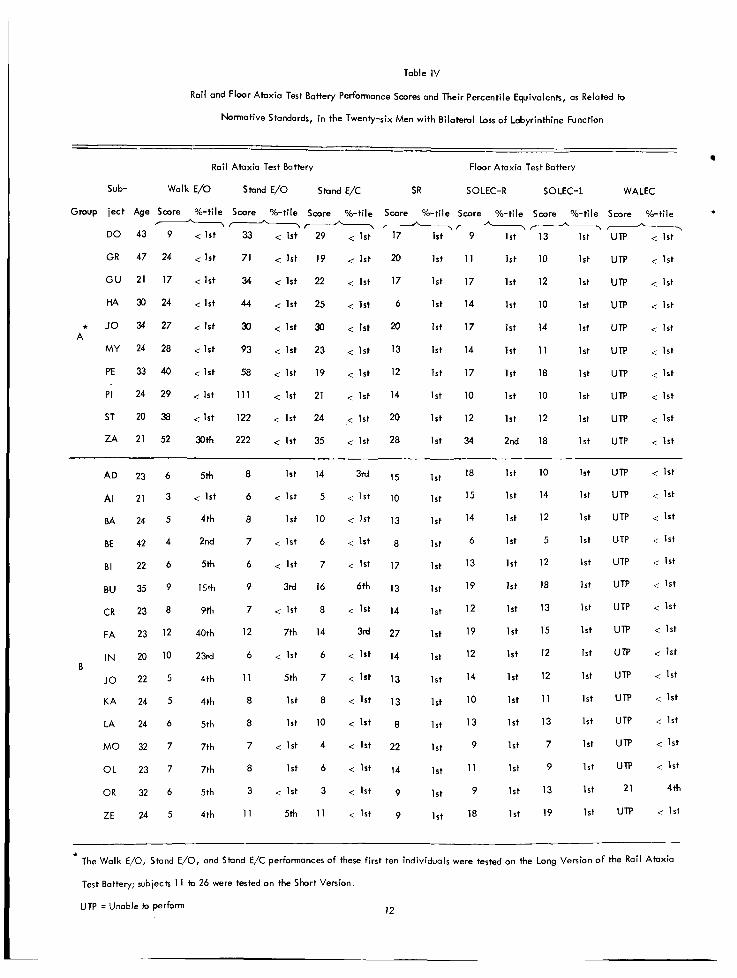
Table IV
Rail and Floor Ataxia Test Battery Performance Scores and Their Percentile Equivalents, as Related to
Normative Standards, in the Twenty-six Men with Bilateral Loss o f Labyrinthine Function
Rail Ataxia Test Battery Floor Ataxia Test Battery
Sub- Walk E/O Stand E/O Stand E/C SR SOLEC-R so LEC- L WALEC
Group ject Age Score %-ti le Score %-tile Score %ti le Score %-ti le Score %-tile Score %-tile Scare %-tile
DO 43 9 < 1 s t 33 < 1st 29 < 1 s t 17 1st 9 1 s t 13 1st UTP < 1 s t
GR 47 24 < 1st 71 c 1st 19 < 1 s t 20 1st 1 1 1st 10 1st UTP < 1st
GU 21 17 < 1st 34 < 1st 22 < 1 s t 17 1st 17 1st 12 1st UTP < 1st
I------------
HA 30 24 < 1 s t 44 < 1st 25 < 1st 6 1st 14 1st 10 1st UTP < 1st
* JO 34 27 < 1st 30 < 1st 30 < 1st 20 1st 17 1st 14 1st A
M Y 24 28 < 1st 93 < 1st 23 < 1st 13 1 s t 14 1st 11 1 s t
PE 33 40 < 1 s t 58 < 1 s t 19 < 1st 12 1st 17 1st 18 1 s t
P I 24 29 < 1st 111 < 1st 21 < 1st 14 1 s t 10 1st 10 1st
ST 20 38 < 1st 122 < 1st 24 < 1st 20 1st 12 1st 12 1st
ZA 21 52 30th 222 < 1st 35 < 1st 28 1 s t 34 2nd 18 1 s t
AD 23 6 5th 8 1st 14 3rd 15 1st 18
AI 21 3 < 1 s t 6 < 1st 5 < 1st 10 1st 15 1st 14 1st
BA 24 5 4th 8 1 s t 10 < 1 s t 13 1st 14 1s t 12 1st
BE 42 4 2nd 7 < 1 s t 6 < 1st 8 1 s t 6 1st 5 1st
BI 22 6 5th 6 < 1st 7 < 1st 17 lst 13 1st 12 1st
BIJ 35 9 13Th 9 3rd 16 6th 13 Ist 19 1st 18 1st
CR 23 8 9th 7 < 1st 8 < 1 s t 14 1st 12
1st 10 1 s t
1 s t 13 1s t
1 s t 15 1 st
1st 12 1st
FA 23 12 40th 12 7th 14 3rd 27 1st 19
IN 20 10 2 3 ~ d 6 < 1st 6 < 1st 14 1st 12
JO 22 5 4th 11 5th 7 < 1st 13 1st 14 1st 12 1st
KA 24 5 4th 8 1st 8 < 1st 13 Ist 10 1st 11 1st
LA 24 6 5th a 1 s t 10 < 1st 1st 13 1st 13 1st
MO 32 7 7th 7 < 1st 4 < 1st 22 1 s t 9 1st 7 1st
O L 23 7 7th B 1st 6 < 1st 14 1 s t 11 1st 9 1st
B
OR 32 6 5th 3 < 1 s t 3 < 1st 9 1st 9 1st 13 1st
1 s t 19 1st ZE 24 5 4th 1 1 5th 11 < 1st 9 1 s t 18
UTP
UTP
UTP
UTP
U TP
U TP
UTP
U TP
UTP
U TP
UTP
U TP
UTP
UTP
UTP
UTP
U TP
UTP
UTP
UTP
21
UTP
c 1 s t
< 1st
< 1 s t
< 1 s t
< 1st
< 1st
< 1st
< 1st
< 1st
< 1st
< 1s t
< 1 s t
< 1st
< 1st
< 1st
< 1st
< 1st
< 1st
< 1st
< 1st
4th
< 1st
* The Walk E/O, Stand E/O, and Stand E/C performances of these first ten individuals were tested on the Long Version o f the Rail Ataxia
Test Battery; subjects 1 1 to 26 were tested an the Short Version.
UTP = Unable to perform 12
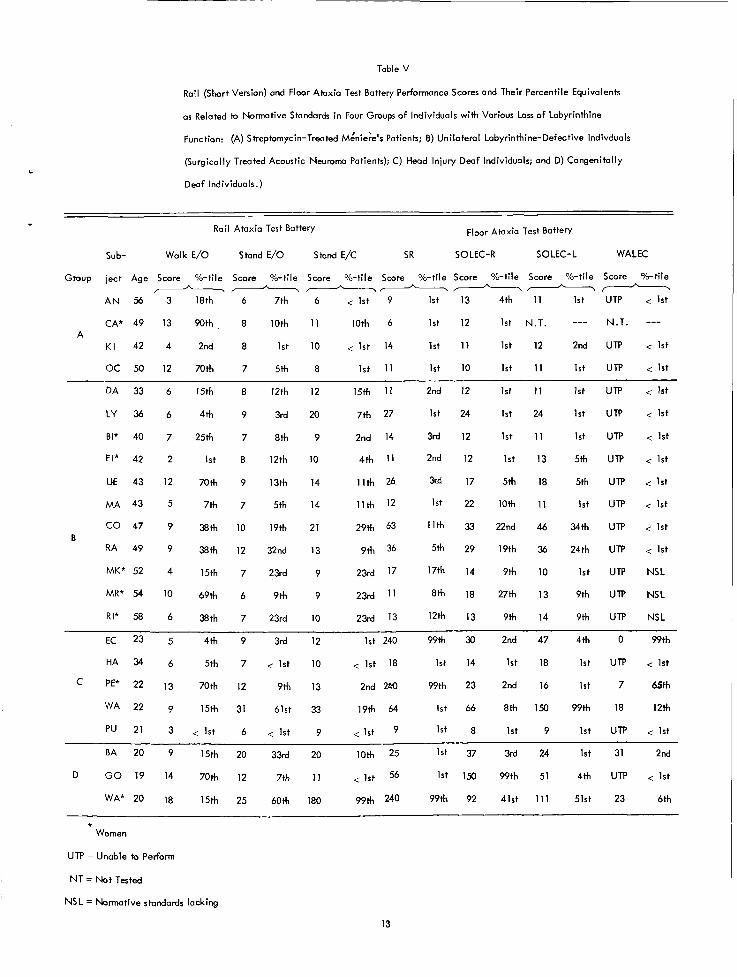
Table V
Rail (Short Version) and Floor Ataxia Test Battery Performance Scares and Their Percentile Equivalents
as Related to Normative Standards i n Four Groups of Individuals with Various Loss o f Labyrinthine
Function: (A) Streptomycin-Treated M:nie;e's Patients; B) Unilateral Labyrinthine-Defective lndivduals
(Surgically Treated Acoustic Neuroma Patients); C) Head Injury Deaf Individuals; and D) Congenitally
Deaf Individuals.)
Rail Ataxia Test Battery Floor Atoxio Test Battery
WALEC SO LEC- L Sub- Walk E/O Stand E/O Stand E/C SR SOLEC-R
Group ject Age Score %-ti le Score %-tile Scare %-tile Score %-tile Scare %-tile Scare %-tile Score %-tile
A N 56 3 18th 6 7th 6 < 1 s t 9 1st 13 4th 11 1s t UTP < 1st
CA* 49 13 90th 8 10th 11 loth 6 1st 12 1st N.T. --- N.T. ---
---**-*
A K I 42 4 2nd 8 1 s t 10 < 1st 14 1st 11 1s t 12 2nd UTP < 1 s t
OC 50 12 70th 7 5th 8 1 s t 11 1s t 10 1s t 11 1st UTP < 1st
1st UTP < 1st DA 33 6 15th 8 12th 12 15th 1 1 2nd 12 1st 11
1s t 24 1st UTP < 1st LY 36 6 4th 9 3rd 20 7th 27 1st 24
1st UTP < 1st BI* 40 7 25th 7 8th 9 2nd 14 3rd 12 1st 11
FI* 42 2 1st 8 12th 10 4th 1 1 2nd 12 1st 13 5th UTP < 1 s t
UE 43 12 70th 9 13th 14 11th 26 3rd 17 5th 18 5th UTP < 1st
1st 22 10th 11 1st UTP < 1st M A 43 5 7th 7 5th 14 11th 12
co 47 9 38th 10 19th 21 29th 63 11th 33 22nd 46 34th UTP < 1st
RA 49 9 38th 12 32nd 13 9th 36 5th 29 19th 36 24th UTP < 1st B
23rd 17 17th 14 9th 10 1s t UTP NSL MK* 52 4 15th 7 23rd 9
MR* 54 10 69th 6 9th 9 23rd l1 8th 18 27th 13 9th UTP NSL
RI* 58 6 38th 7 23rd 10 23rd 13 12th 13 9th 14 9th UTP NSL
EC 23 5 4th 9 3rd 12 Ist 240 99th 30 2nd 47 4th 0 99th
1s t 14 1st 18 1st UTP < 1 s t
1st 7 65th
1s t 66 8th 150 99th 18 12th
HA 34 6 5th 7 < 1 s t 10 < 1st 18
PE* 22 13 70th 12 9th 13 2nd 2 M 99th 23 2nd 16
22 9 15th 31 61st 33 19th 64
1st 8 1st 9 1st UTP < 1st pu 21 3 < 1 s t 6 < 1st 9 < 1st 9
BA 20 9 15th 20 33rd 20 10th 25 1st 37 3rd 24 1st 31 2nd
D GO 19 14 70th 12 7th 11 < 1st 56 1 s t 150 99th 51 4th UTP < 1st
WA* 20 18 15th 25 60th 180 99th 240 99th 92 41st 111 51st 23 6th
* Women
UTP = Unable to Perform
N T = Not Tested
NSL = Normative standards lacking
13
L CI
W
al > .- .- t E
6
.f
al ln In
J
Q
Q U
C i g .- 6 t! * n
O C
al .- P z 0
m o * n o o o o c v 9 - d - 0 0 0
- 7 -
n n n o 00 c9-09300 - 7
II II
z z A-
I >-
II II II z z z
* + * *
14
. " $
g 8
C
cr: V
0 .- L - s U 0 - -5 L
8
L I-
e " P)
Ln
L
c
x 2 m O
c v)
2 o X .- : rc 0
B 5 .- 6 0
0 P) u: C
.- c -
.- 8 V C P)
0 L
Lc 2
a n 3
6
m
Q
m
Q
m
a
m
a
m
Q
m
Q
m
4
O U J O h O c " _ o " _ b
o ( x o o 0 000 - - e
" 3 8 8 3 -- g a o w o
c Ohg
c T ) * o w o - -0h_o c
- - O h 0 - N g s g
O h O O W N 2-
0 - a 0 0 N Z 2 g
0 0 c
0 0 - 0 0 c
0 0 c
0 0 7
8 c
0 2
0 0 c
UJ h
0 2
5: 0 0 - n cv
0 2
8 - 0 0 - 0 0 c
0 0 - 0 2
0 0 -
8
8
c
c
9 a
0 2
'0 0.
0 0 c
N h
0 0
c
15
Unc Iassified
7 8 . T O T A L N O O F P A G E S
16
LABYRINTHINE DEFECTS AS SHOWN BY ATAXIA AND CALORIC TESTS
7 6 . N O O F R E F S
8
A . U T H O R I S I ( F i r s f name, middle i n l f i a l . l a s f name)
Alfred R. Fregly and Ashton Graybiel
1 S U P P L E M E N T A R Y N O T E S
R E P O R T D A T E
12 S P O N S O R I N G M I L I T A R Y A C T I V I T Y
22 August 1968 a . C O N T H A C T O R G R A N T N O
b. P R O J E C T NO
MR005.04-0021 c .
d
NAM 1-994
9b . O T H E R R E P O R T N O ( S ) (Any other numbers that may be assigned this report)
144 o OISTRIBUTTON S T A T E M E N T
3 b 8 S T R A C T
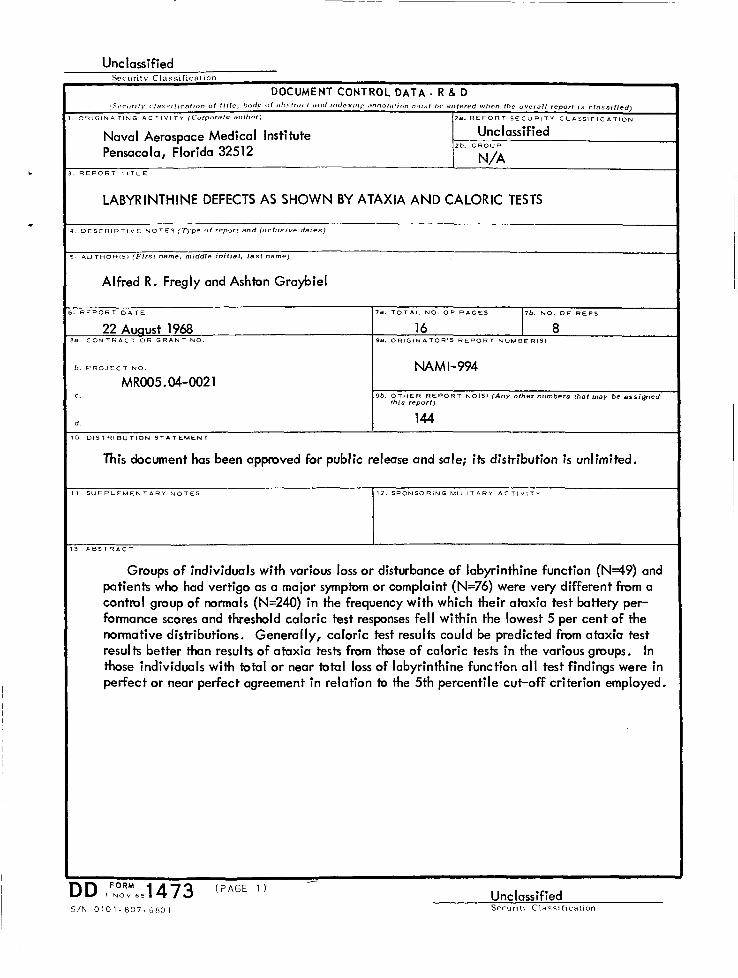
Groups o f individuals with various loss or disturbance of labyrinthine function (N49) and patients who had vertigo as a major symptom or complaint (N=76) were very different from a control group of normals (N=240) i n the frequency with which their ataxia test battery per- formance scores and threshold caloric test responses fel l within the lowest 5 per cent of the normative distributions. Generally, caloric test results could be predicted from ataxia test results better than results of ataxia tests from those of caloric tests i n the various groups. In those individuals with total or near total loss of labyrinthine function a l l test findings were in perfect or near perfect agreement i n relation to the 5th percentile cut-off criterion employed.
Unclassified Securitv Classification
4 K E Y W O R D S
-
Ataxia
Caloric tests
Deafness
Labyrinthine defects
Locomokr functions
0 kneum logy
Postural equilibrium
Psychomotor skills
Vertigo
Vestibular functions
L I N K A - R O L E -
L I N K 8 - R O L E -
W T
L I N K C
R O L E -
DD IFNooR;Me11473 ( B A C K ) Uric lass if ied ( P A G E 2 ) Security Class i f icat ion