align multi-year forecasts with tactical plans and ... multi-year forecasts with tactical plans and...
TRANSCRIPT
Align Multi-Year Forecasts with Tactical
Plans and Operational Budgets
Presenters:
Peri Pierone, CEO, Axiom EPM
Laura Roberts, SVP Financial Planning & Analysis Sterling Bank
Setting a Context within Finance
Case Study – Sterling Bank
Closing Remarks
October 27th, 2013
Agenda
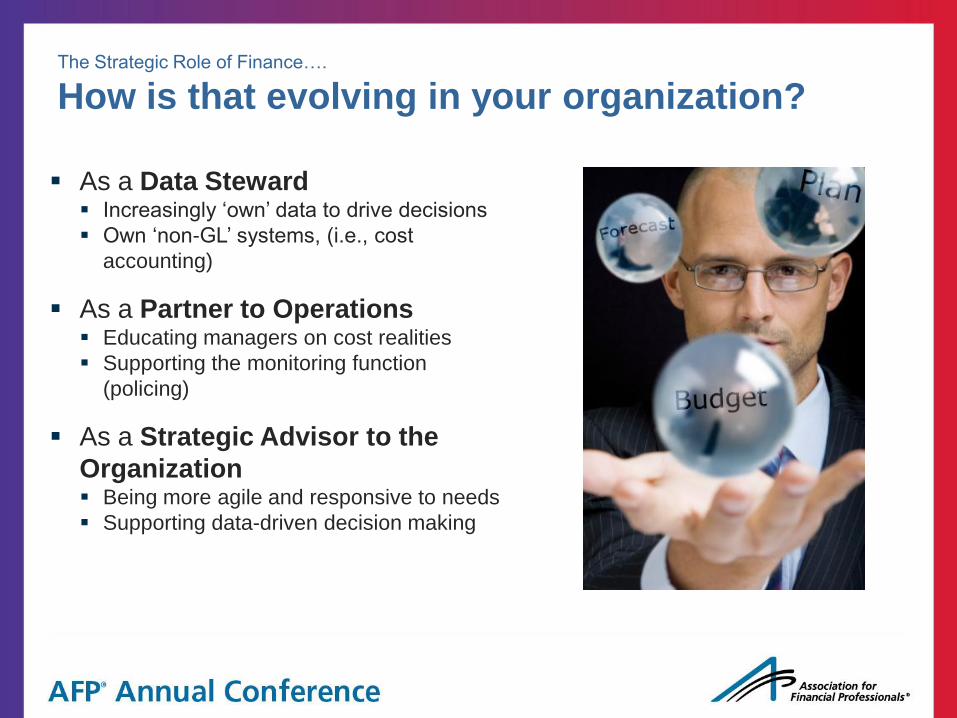
The Strategic Role of Finance….
How is that evolving in your organization?
As a Data Steward Increasingly ‘own’ data to drive decisions
Own ‘non-GL’ systems, (i.e., cost
accounting)
As a Partner to Operations Educating managers on cost realities
Supporting the monitoring function
(policing)
As a Strategic Advisor to the
Organization Being more agile and responsive to needs
Supporting data-driven decision making

Analytic Capability
Efficiency & Control
Scorekeeper
• Reporting
• Accuracy • Retrospective • Disconnected
Strategic Partner
• Advising • Growth focused • Risk aware • Present & future • Connected
Controller
• Gatekeeper • Expense
focused • Governance • Retrospective
Analyst
• Measuring • Planning • Calculating • Modeling • Past and future
The Changing Role of Finance
Quadrant 4
Embodies all the
characteristics of the
other three
quadrants plus
leadership and
outbound activities
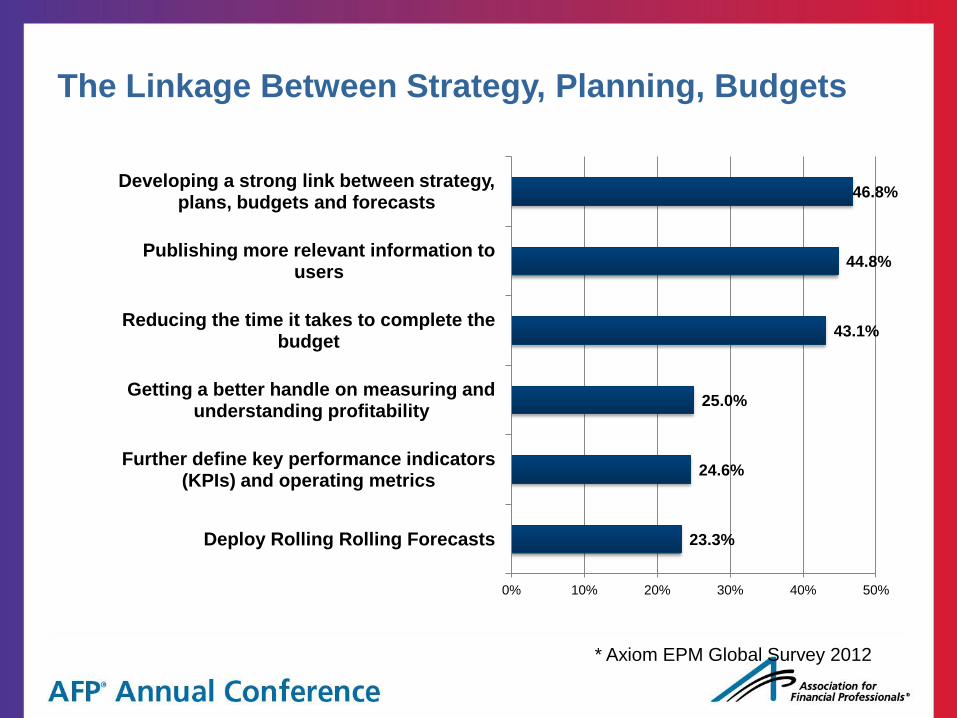
The Linkage Between Strategy, Planning, Budgets
23.3%
24.6%
25.0%
43.1%
44.8%
46.8%
0% 10% 20% 30% 40% 50%
Deploy Rolling Rolling Forecasts
Further define key performance indicators (KPIs) and operating metrics
Getting a better handle on measuring and understanding profitability
Reducing the time it takes to complete the budget
Publishing more relevant information to users
Developing a strong link between strategy, plans, budgets and forecasts
* Axiom EPM Global Survey 2012

Axiom Thought Leadership
Best Practices in Planning
Driver-based intelligent modeling
– Financials are outcomes and should be treated as
such
Scenario-based planning – sensitivity analysis
Initiative-based planning
Rolling forecasts
1
2
3
4

Key Drivers:
• Number of Agents
• Applications Per Agent
• Policies In Force
• Rate Changes
• Commission Rates
• Customer Retention
• Producer Retention
• Consumer/Producer Price Index
• Loss Frequency
• Loss Severity
• Claim Cycle Time
• # of Claims
• # of Adjusters
• # of Underwriters
• # of Customer Service Reps
• Adjuster/UW/CSR Productivity
• Attorneys Rates
• Medical Examination Rates
Driver-based Planning is the Key
Insurance Income Statement:
INVESTMENT INCOME
Net Investment Income Earned
Net Realized Capital Gains (Losses)
Net Investment Gain (Loss)
OTHER INCOME
Net Gain (Loss) from Agents’ or Premium Balances Charged Off
Finance and Service Fees Not Included in Premiums
Aggregate Write Ins for Miscellaneous Income
Total Other Income
Dividends to Policyholders
Net Income, after Dividends to Policyholders
Federal & Foreign Income Taxes Incurred
Net Income
ROA / ROE
UNDERWRITING INCOME
Written/Earned Premiums
Losses Incurred
Loss Expenses Incurred
Other UW Expenses Incurred
Aggregate Write Ins for Underwriting Deductions
Net Underwriting Gain (Loss)
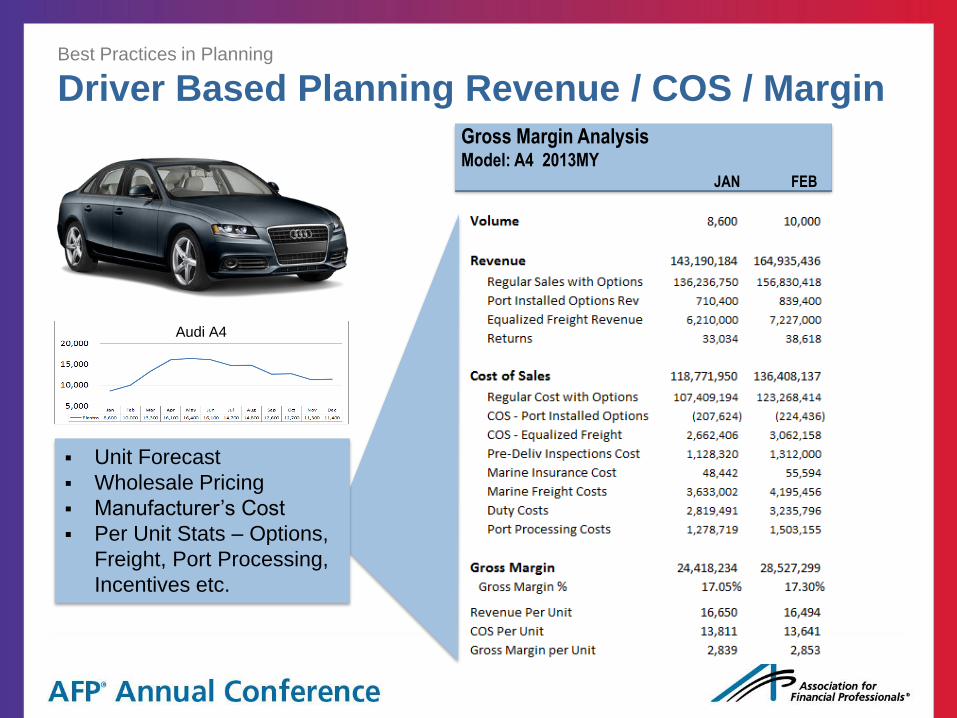
Best Practices in Planning
Driver Based Planning Revenue / COS / Margin Gross Margin Analysis Model: A4 2013MY
JAN FEB
Unit Forecast
Wholesale Pricing
Manufacturer’s Cost
Per Unit Stats – Options,
Freight, Port Processing,
Incentives etc.
Audi A4

Best Practices in Planning
Scenario Planning and Uncertainty
The notion of uncertainty is at the crux of both finance and risk
management domains
Even so when it comes to strategic planning, budgeting and forecasting,
most practitioners are content with completing the “the budget” or “the
forecast” without addressing the issue of uncertainty
There is false sense of security when underlying assumptions are treated
as facts vs. assumptions – masking both exposure and opportunity
90% 8% …Of the organizations surveyed
take at least 2 months to
complete a budget – many more
than 4 months
…Only 8% of organizations
surveyed do scenario planning
regularly.
Source: Business Finance, April 2012

Easiest to set up
and process
Useful in
quantifying the
impact of a
particular DV
Can be a great
educational tool
Primary criticism
is its simplicity –
market variables
seldom move on a
stand-alone basis
Best Practices in Planning
Single Variable Sensitivity Analysis
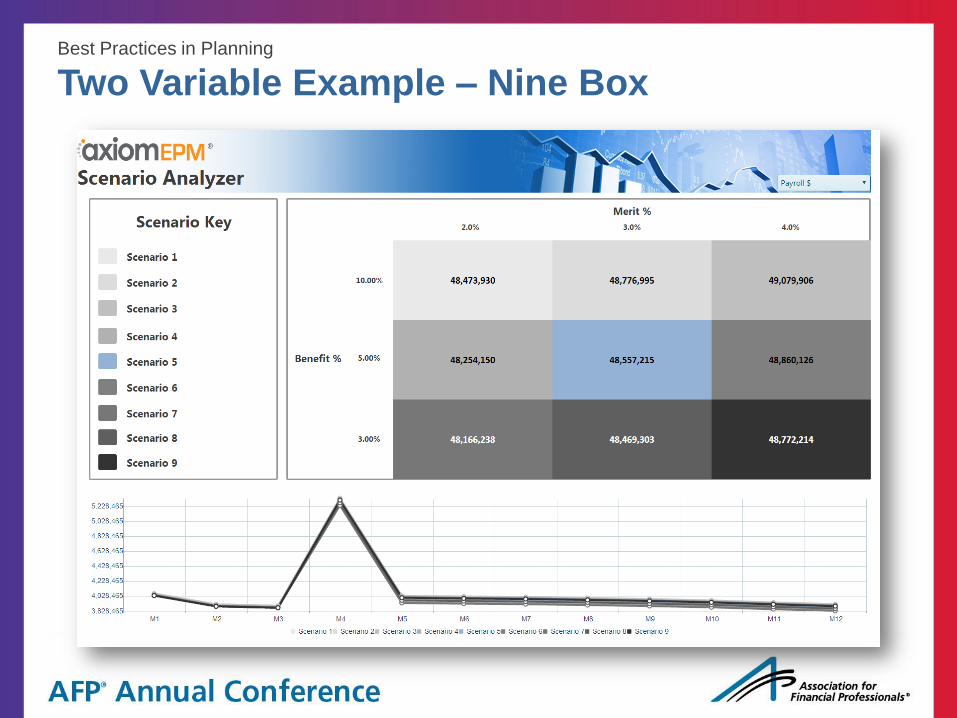
Best Practices in Planning
Two Variable Example – Nine Box

Best Practices in Planning
Initiative Based Scenario Planning
Forecasting Methods Include:
Examples:
• Statistically-Driven Modeling
• Payor Mix and Revenue Forecasting
• Labor Rate & Efficiency Targets
• Cost Modeling
• Re-Design ER, Flow Thru Implications
• Expand Cardiac Cath Lab
• Open an OP Urgent Care (Northside)
Analysis Contains:
1. Income Statement
2. Balance Sheet
3. Cash Flow
4. Key Ratios
Consolidated Results
Base Case
(Conservative)
Initiative #1
Initiative #3
Initiative #2
Initiative #4
Base Case Given current trends,
what is our financial
outlook 3-10 years?
Initiatives As we prioritize growth
or cost containment
initiatives, what is the
incremental impact?
Scenarios What is the impact on
our baseline projections
given the initiatives
we’ve proposed?
Q1
2013
Q2
2013
Q3
2013
Q4
2013
Q1
2014
Q2
2014
Q3
2014
Q4
2014
Feb
Forecast
May
Forecast
August
Forecast
Nov
Forecast
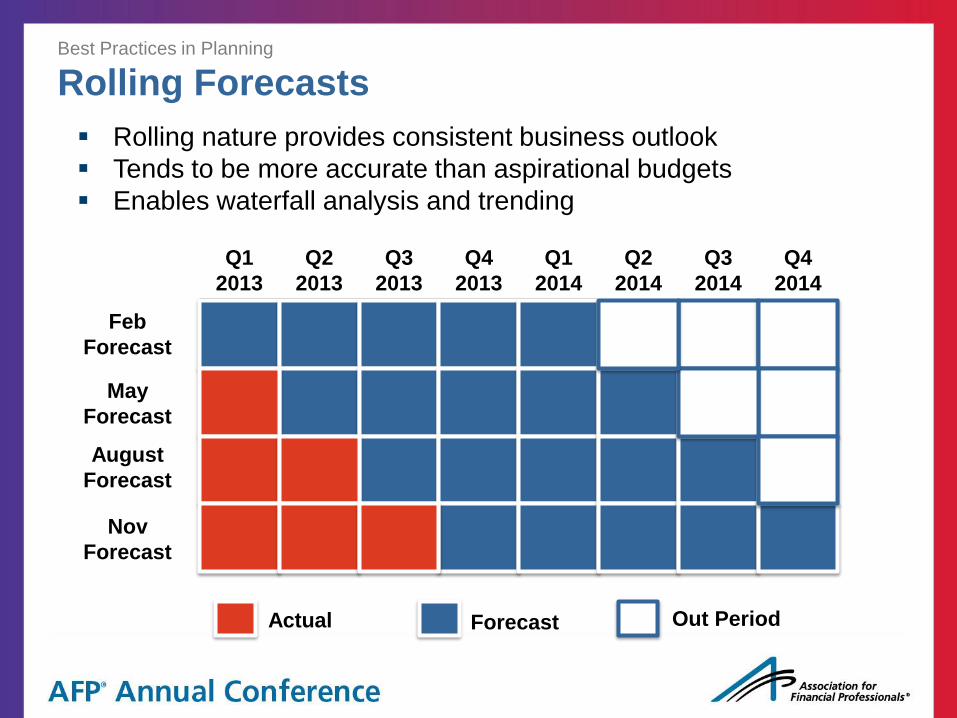
Actual Forecast Out Period
Rolling nature provides consistent business outlook
Tends to be more accurate than aspirational budgets
Enables waterfall analysis and trending
Best Practices in Planning
Rolling Forecasts
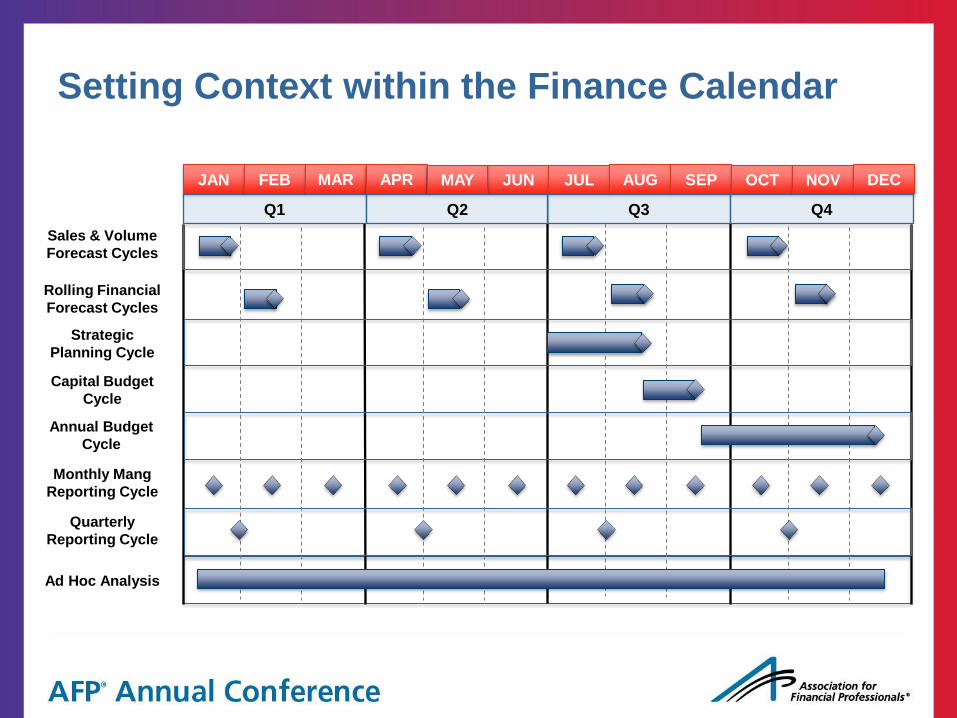
Setting Context within the Finance Calendar
JAN FEB MAR APR JUN JUL AUG SEP OCT NOV DEC MAY
Q1 Q2 Q3 Q4
Sales & Volume
Forecast Cycles
Capital Budget
Cycle
Strategic
Planning Cycle
Quarterly
Reporting Cycle
Ad Hoc Analysis
Annual Budget
Cycle
Monthly Mang
Reporting Cycle
Rolling Financial
Forecast Cycles

Setting a Context within Finance
Case Study – Sterling Bank
October 27th, 2013
Agenda
Laura Roberts SVP Financial Planning & Analysis

Key Statistics as of 6/30/13 (billions)
Total assets $9.9
Total deposits $6.6
Net loans $6.9
2013 Sterling Franchise at a Glance
Based in Spokane, Wash.,
Sterling is one of the largest
commercial banks
headquartered in the Pacific
Northwest (1)
Approximately 56,000
commercial transaction
accounts and 272,000 retail
transaction accounts
$6.6 billion of deposits with an
average cost of 0.37% (2)
Market cap of $1.5 billion (3)
175 branches in 4 states (4)
Source: SNL Financial, Company filings. Note: Financial data as of June 30, 2013.
(1) Pacific Northwest defined as Idaho, Oregon and Washington.
(2) For the quarter ended June 30, 2013.
(3) As of June 30, 2013.
(4) Source: SNL, as of June 30, 2012. Pro forma deposit market share data includes Borrego,
BPFH and CNBF.
Pro Forma Deposit Market Share (4)
State Branches Rank Market Share
Washington 83 7 3.13%
Oregon 58 9 2.77%
California 17 49 0.13%
Idaho 17 10 2.54%
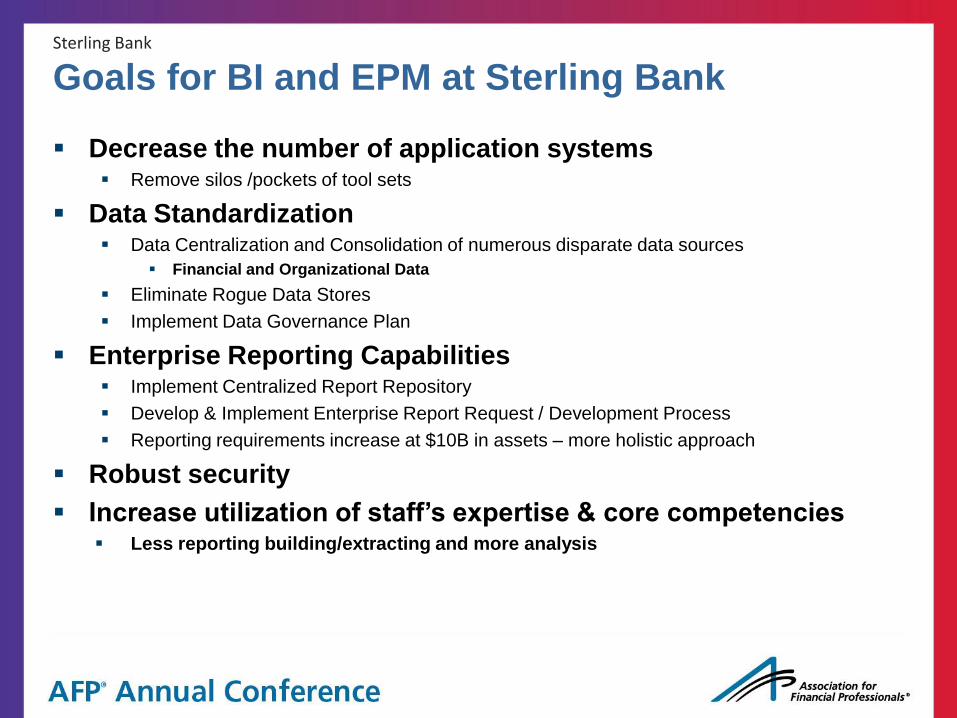
Sterling Bank
Goals for BI and EPM at Sterling Bank
Decrease the number of application systems Remove silos /pockets of tool sets
Data Standardization Data Centralization and Consolidation of numerous disparate data sources
Financial and Organizational Data
Eliminate Rogue Data Stores
Implement Data Governance Plan
Enterprise Reporting Capabilities Implement Centralized Report Repository
Develop & Implement Enterprise Report Request / Development Process
Reporting requirements increase at $10B in assets – more holistic approach
Robust security
Increase utilization of staff’s expertise & core competencies Less reporting building/extracting and more analysis
Sterling Bank
Project Approach
Reporting Workshops
Inventory of systems
RFP and Vendor selection
Pre-Road mapping with vendors
Road mapping with vendors
Coordinated touch points
Split project plans
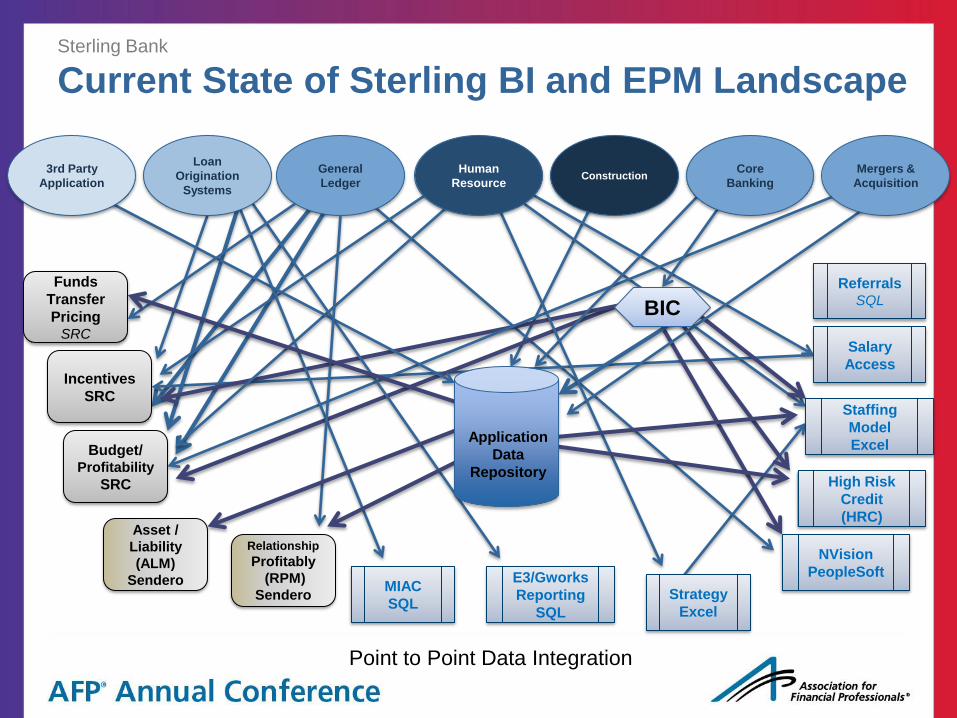
Sterling Bank
Current State of Sterling BI and EPM Landscape
Core
Banking Construction
General
Ledger
3rd Party
Application
Mergers &
Acquisition
Human
Resource
Loan
Origination
Systems
Budget/ Profitability
SRC
Incentives
SRC
Relationship
Profitably
(RPM)
Sendero
Funds
Transfer
Pricing SRC
Asset /
Liability
(ALM)
Sendero
High Risk
Credit
(HRC)
Strategy
Excel
Referrals SQL
NVision
PeopleSoft
Staffing
Model
Excel
MIAC
SQL
Salary
Access
E3/Gworks
Reporting
SQL
BIC
Point to Point Data Integration
Application
Data
Repository

EPM/BI
Business Intelligence
Master Data Layer
Budgeting &
Forecasting Incentive
Compensation
Management
Profitability
Measurement;
FTP,
Economic
Capital
Asset /
Liability
(ALM)
Sendero
MIAC
SQL
Loan Quality
Migration
Analysis
Strategy &
Capital
Management
Interactive
Reporting &
Analytics
Centralized Data Integration
Sterling Bank
Future State of our Finance BI and EPM Landscape
3rd Party
Applicatio
ns
Core
Banking
Constructi
on
General
Ledger
Mergers &
Acquisitio
ns
Human
Resource
Loan
Origination
Systems
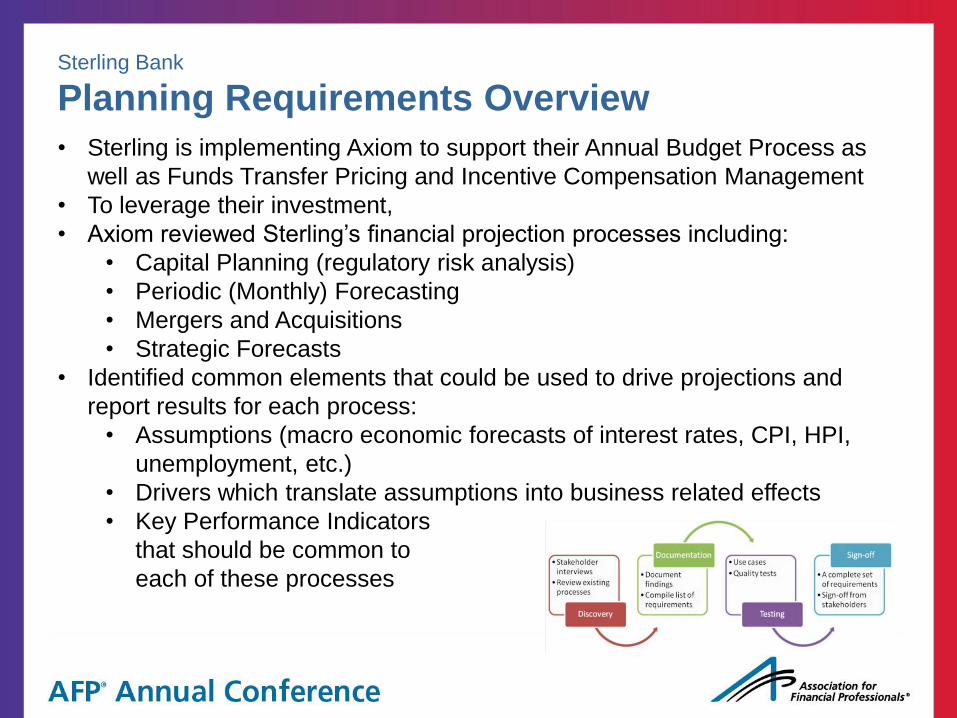
Sterling Bank
Planning Requirements Overview
• Sterling is implementing Axiom to support their Annual Budget Process as
well as Funds Transfer Pricing and Incentive Compensation Management
• To leverage their investment,
• Axiom reviewed Sterling’s financial projection processes including:
• Capital Planning (regulatory risk analysis)
• Periodic (Monthly) Forecasting
• Mergers and Acquisitions
• Strategic Forecasts
• Identified common elements that could be used to drive projections and
report results for each process:
• Assumptions (macro economic forecasts of interest rates, CPI, HPI,
unemployment, etc.)
• Drivers which translate assumptions into business related effects
• Key Performance Indicators
that should be common to
each of these processes
Sterling Bank
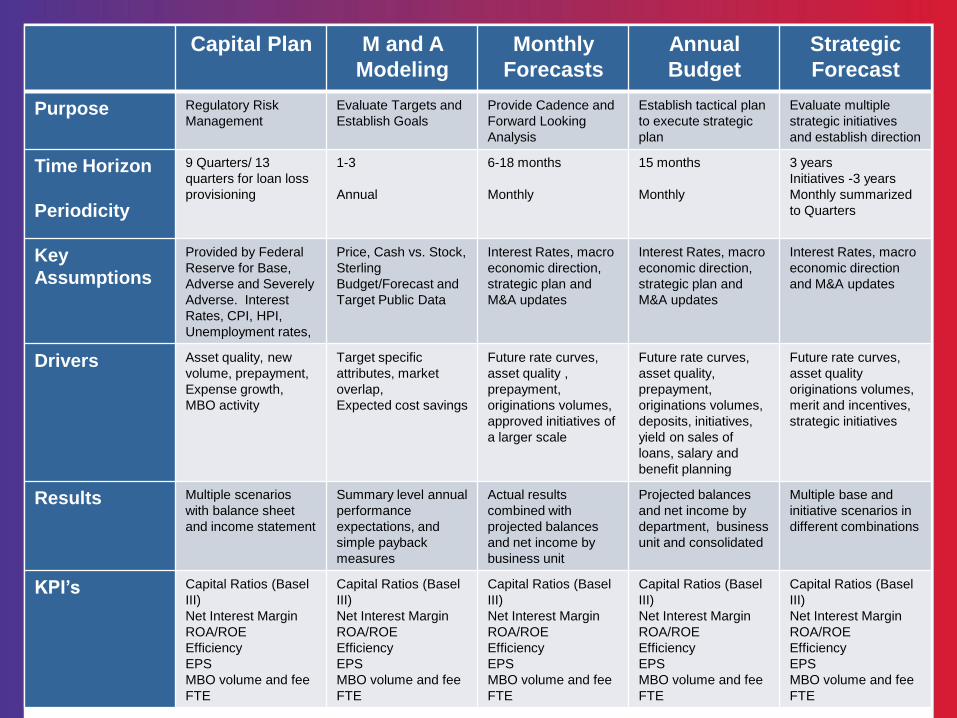
Financial Projection Processes
Capital Plan M and A
Modeling
Monthly
Forecasts
Annual
Budget
Strategic
Forecast
Purpose Regulatory Risk
Management
Evaluate Targets and
Establish Goals
Provide Cadence and
Forward Looking
Analysis
Establish tactical plan
to execute strategic
plan
Evaluate multiple
strategic initiatives
and establish direction
Time Horizon
Periodicity
9 Quarters/ 13
quarters for loan loss
provisioning
1-3
Annual
6-18 months
Monthly
15 months
Monthly
3 years
Initiatives -3 years
Monthly summarized
to Quarters
Key
Assumptions
Provided by Federal
Reserve for Base,
Adverse and Severely
Adverse. Interest
Rates, CPI, HPI,
Unemployment rates,
Price, Cash vs. Stock,
Sterling
Budget/Forecast and
Target Public Data
Interest Rates, macro
economic direction,
strategic plan and
M&A updates
Interest Rates, macro
economic direction,
strategic plan and
M&A updates
Interest Rates, macro
economic direction
and M&A updates
Drivers Asset quality, new
volume, prepayment,
Expense growth,
MBO activity
Target specific
attributes, market
overlap,
Expected cost savings
Future rate curves,
asset quality ,
prepayment,
originations volumes,
approved initiatives of
a larger scale
Future rate curves,
asset quality,
prepayment,
originations volumes,
deposits, initiatives,
yield on sales of
loans, salary and
benefit planning
Future rate curves,
asset quality
originations volumes,
merit and incentives,
strategic initiatives
Results Multiple scenarios
with balance sheet
and income statement
Summary level annual
performance
expectations, and
simple payback
measures
Actual results
combined with
projected balances
and net income by
business unit
Projected balances
and net income by
department, business
unit and consolidated
Multiple base and
initiative scenarios in
different combinations
KPI’s Capital Ratios (Basel
III)
Net Interest Margin
ROA/ROE
Efficiency
EPS
MBO volume and fee
FTE
Capital Ratios (Basel
III)
Net Interest Margin
ROA/ROE
Efficiency
EPS
MBO volume and fee
FTE
Capital Ratios (Basel
III)
Net Interest Margin
ROA/ROE
Efficiency
EPS
MBO volume and fee
FTE
Capital Ratios (Basel
III)
Net Interest Margin
ROA/ROE
Efficiency
EPS
MBO volume and fee
FTE
Capital Ratios (Basel
III)
Net Interest Margin
ROA/ROE
Efficiency
EPS
MBO volume and fee
FTE
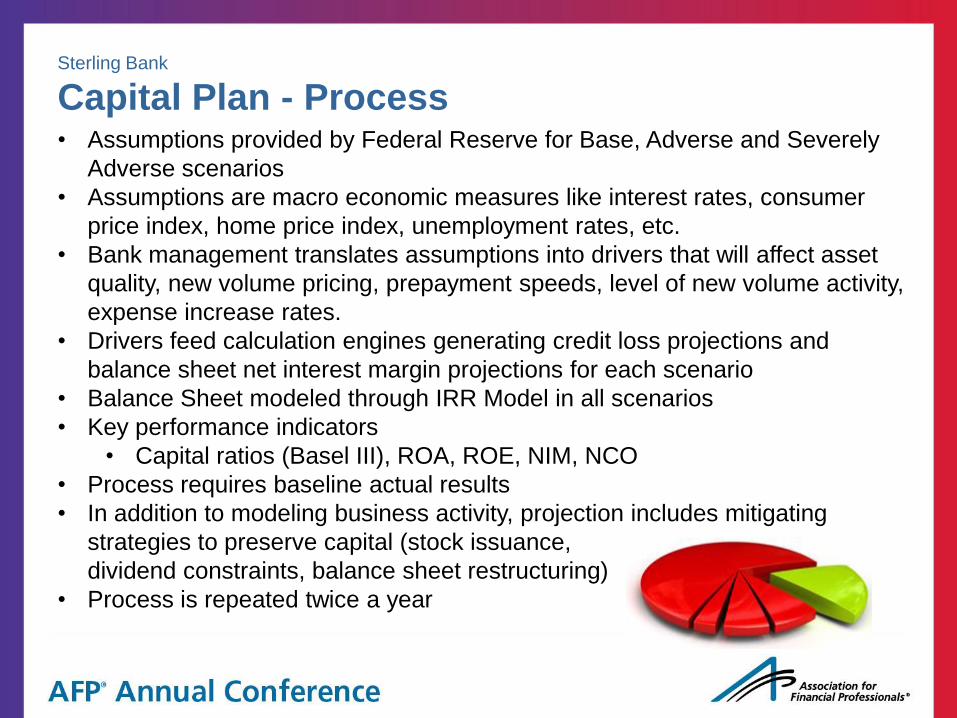
Sterling Bank
Capital Plan - Process • Assumptions provided by Federal Reserve for Base, Adverse and Severely
Adverse scenarios
• Assumptions are macro economic measures like interest rates, consumer
price index, home price index, unemployment rates, etc.
• Bank management translates assumptions into drivers that will affect asset
quality, new volume pricing, prepayment speeds, level of new volume activity,
expense increase rates.
• Drivers feed calculation engines generating credit loss projections and
balance sheet net interest margin projections for each scenario
• Balance Sheet modeled through IRR Model in all scenarios
• Key performance indicators
• Capital ratios (Basel III), ROA, ROE, NIM, NCO
• Process requires baseline actual results
• In addition to modeling business activity, projection includes mitigating
strategies to preserve capital (stock issuance,
dividend constraints, balance sheet restructuring)
• Process is repeated twice a year

Sterling Bank
Merger and Acquisition Modeling - Process • Many targets are evaluated, but only 10-20% become closed deals
• Confidentiality is critical
• Results driven more by deal structure and expected cost savings than macro
economic assumptions
• There is some variability between deals in terms of approach and drivers
• Analysis is focused on measuring return on investment metrics
• When deal goes through due diligence, adjustments to expectations may
become apparent from new details
• Once deal is negotiated and announced, target’s financial projections need to
be added to Corporation’s projections (forecasts, budgets and capital plans)
• Balances, income statement, drivers
• May occur at anytime of the year…unpredictable
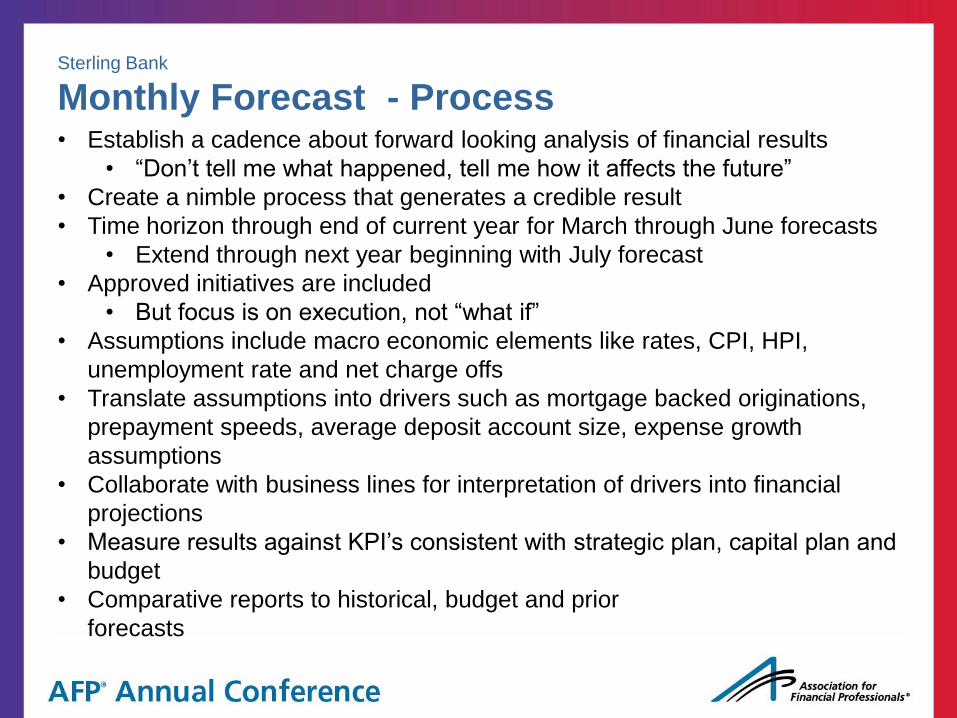
Sterling Bank
Monthly Forecast - Process • Establish a cadence about forward looking analysis of financial results
• “Don’t tell me what happened, tell me how it affects the future”
• Create a nimble process that generates a credible result
• Time horizon through end of current year for March through June forecasts
• Extend through next year beginning with July forecast
• Approved initiatives are included
• But focus is on execution, not “what if”
• Assumptions include macro economic elements like rates, CPI, HPI,
unemployment rate and net charge offs
• Translate assumptions into drivers such as mortgage backed originations,
prepayment speeds, average deposit account size, expense growth
assumptions
• Collaborate with business lines for interpretation of drivers into financial
projections
• Measure results against KPI’s consistent with strategic plan, capital plan and
budget
• Comparative reports to historical, budget and prior
forecasts
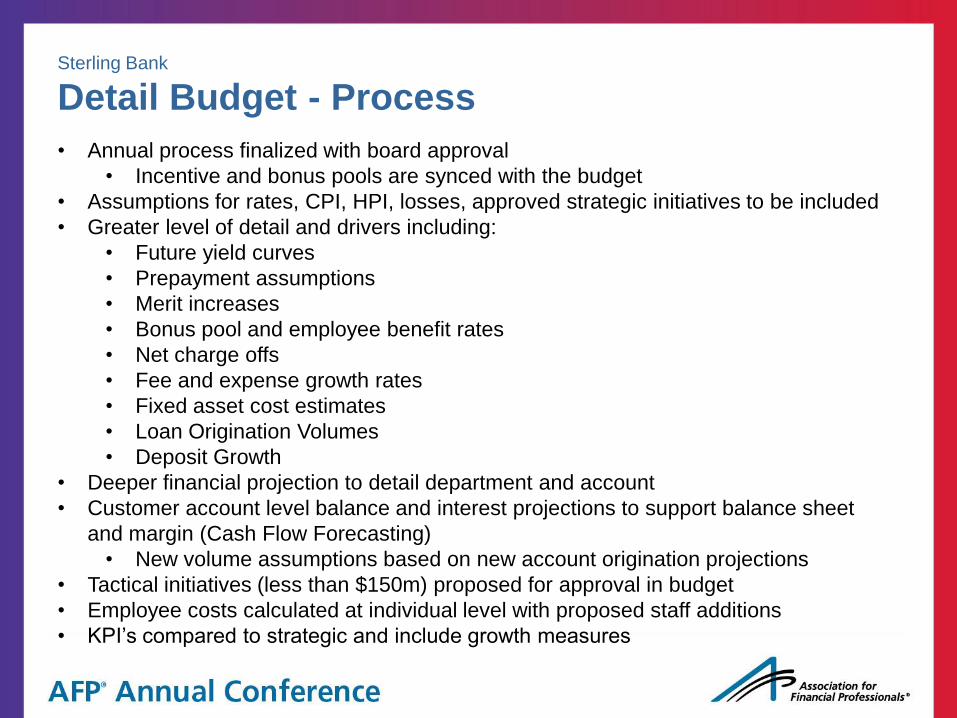
Sterling Bank
Detail Budget - Process
• Annual process finalized with board approval
• Incentive and bonus pools are synced with the budget
• Assumptions for rates, CPI, HPI, losses, approved strategic initiatives to be included
• Greater level of detail and drivers including:
• Future yield curves
• Prepayment assumptions
• Merit increases
• Bonus pool and employee benefit rates
• Net charge offs
• Fee and expense growth rates
• Fixed asset cost estimates
• Loan Origination Volumes
• Deposit Growth
• Deeper financial projection to detail department and account
• Customer account level balance and interest projections to support balance sheet
and margin (Cash Flow Forecasting)
• New volume assumptions based on new account origination projections
• Tactical initiatives (less than $150m) proposed for approval in budget
• Employee costs calculated at individual level with proposed staff additions
• KPI’s compared to strategic and include growth measures
Sterling Bank
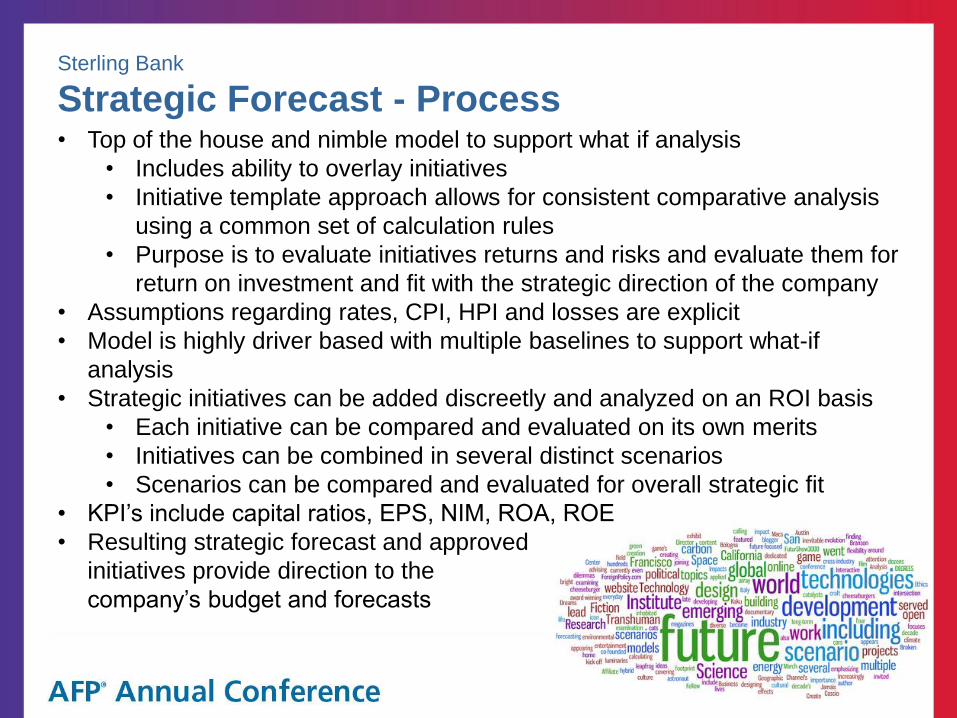
Strategic Forecast - Process • Top of the house and nimble model to support what if analysis
• Includes ability to overlay initiatives
• Initiative template approach allows for consistent comparative analysis
using a common set of calculation rules
• Purpose is to evaluate initiatives returns and risks and evaluate them for
return on investment and fit with the strategic direction of the company
• Assumptions regarding rates, CPI, HPI and losses are explicit
• Model is highly driver based with multiple baselines to support what-if
analysis
• Strategic initiatives can be added discreetly and analyzed on an ROI basis
• Each initiative can be compared and evaluated on its own merits
• Initiatives can be combined in several distinct scenarios
• Scenarios can be compared and evaluated for overall strategic fit
• KPI’s include capital ratios, EPS, NIM, ROA, ROE
• Resulting strategic forecast and approved
initiatives provide direction to the
company’s budget and forecasts

Sterling Bank
Financial Projection Cycle
• Unit costs x Volume • Expected Loss • Allocated Equity • Allocated Fee • Performance Tuned • Process Transactions
Strategic Forecast
• FTP for G/L • FTP for Member
Merger and Acquisitions
• FTP for G/L • FTP for Member
Capital Planning
• Unit costs x Volume • Expected Loss • Allocated Equity • Allocated Fee • Performance Tuned • Process Transactions
Monthly Forecast
• Unit costs x Volume • Expected Loss • Allocated Equity • Allocated Fee • Performance Tuned • Process Transactions
Detail Annual Budget
To Strategic Forecast
From M & A
Sterling Bank
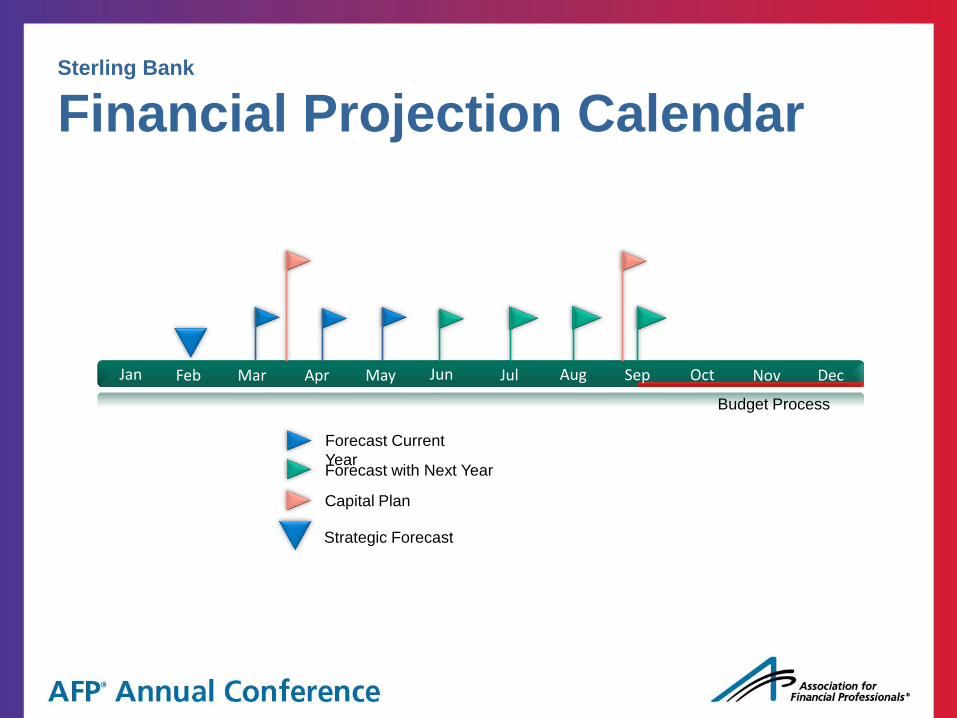
Financial Projection Calendar
Feb Mar Apr May Jul Aug Sep Oct Dec Nov Jan Jun
Capital Plan
Forecast with Next Year
Budget Process
Forecast Current
Year
Strategic Forecast

Setting a Context within Finance
Case Study – Sterling Bank
Closing Remarks
October 27th, 2013
Agenda

Company Overview
About Axiom EPM
Our Focus 1. Innovation in Enterprise Performance
Management Software
2. Superlative customer experience (sales, services, support)
3. Industry Specialization
Our Differentiators Our software is based on a
comprehensive all-in-one design where usability and ownership by the business users is paramount
Our service (implementation & support) is designed to be highly personalized where our success is measured by yours
Agile, Responsive, Intuitive.
Does this describe your performance
management solution?

More Information
Visit our website www.axiomepm.com
Learn more:
Peri Pierone, CEO, Axiom EPM
Laura Roberts, SVP Financial Planning & Analysis, Sterling Bank
Contact us: