us lng supply into europe - lsta.lt energy summit... · us lng supply into europe ... plan or any...
TRANSCRIPT

US LNG Supply into Europe
Baltic Energy Summit, VilniusNovember 25th, 2015Helena Wisden, Cheniere Marketing International

2
This presentation contains certain statements that are, or may be deemed to be, “forward‐looking statements” within the meaning of Section 27A of the Securities Act and Section 21E of the Securities Exchange Act of 1933, as amended. All statements, other than statements of historical facts, included herein are “forward‐looking statements.” Included among “forward‐looking statements” are, among other things:
Statements that we expect to commence or complete construction of a liquefaction facility by certain dates, or at all;
Statements that we expect to receive authorization from the Federal Energy Regulatory Commission, or FERC, or the Department of Energy, or DOE to construct and operate a proposed liquefaction facility by a certain date, or at all;
Statements regarding future levels of domestic or foreign natural gas production and consumption, or the future level of LNG imports into North America or exports from the U.S., or regarding projected future capacity of liquefaction or regasification facilities worldwide;
Statements regarding any financing transactions or arrangements, whether on the part of Cheniere or at the project level;
Statements regarding any commercial arrangements marketed or potential arrangements to be performed in the future, including any cash distributions and revenues anticipated to be received;
Statements regarding the commercial terms and potential revenues from activities described in this presentation;
Statements that our proposed liquefaction facility, when completed, will have certain characteristics, including a number of trains;
Statements regarding our business strategy, our business plan or any other plans, forecasts, examples, models, forecasts or objectives: any or all of which are subject to change;
Statements regarding estimated corporate overhead expenses; and
Any other statements that relate to non‐historical information.
These forward‐looking statements are often identified by the use of terms and phrases such as “achieve,” “anticipate,” “believe,” “estimate,” “example,” “expect,” “forecast,” “opportunities,” “plan,” “potential,” “project,” “propose,” “subject to,” and similar terms and phrases. Although we believe that the expectations reflected in these forward‐looking statements are reasonable, they do involve assumptions, risks and uncertainties, and these expectations may prove to be incorrect. You should not place undue reliance on these forward‐looking statements, which speak only as of the date of this presentation. Our actual results could differ materially from those anticipated in these forward‐looking statements as a result of a variety of factors, including those discussed in “Risk Factors” in the Cheniere Energy, Inc. and Cheniere Energy Partners, L.P. Current Reports on Form 8‐K filed with the Securities and Exchange Commission, which are incorporated by reference into this presentation. All forward‐looking statements attributable to us or persons acting on our behalf are expressly qualified in their entirety by these ”Risk Factors”. These forward‐looking statements are made as of the date of this presentation, and we undertake no obligation to publicly update or revise any forward‐looking statements.
Forward Looking Statements

Agenda
Introduction to Cheniere
US Unconventional Gas
US LNG Exports
Evolving Global LNG Trade
Impact on Europe
3

Cheniere LNG Platform
Sabine PassLiquefaction
TX LACreole Trail PL
Sabine Pass Liquefaction• 6 train development – 27 mtpa (~3.8 Bcf/d in export capacity)
• Trains 1‐5 are under construction; First LNG expected in late 2015
• Train 6 under development,FID expected 2015
Corpus Christi Liquefaction
4
Corpus Christi Liquefaction• 5 train development – 22.5 mtpa (~3.2 Bcf/d in export capacity)
• Trains 1‐2 are under construction; First LNG expected 2018
• Train 3 under development; FID expected 2015• Trains 4‐5 under development; Permitting process initiated June 2015
Live OakLNG
Live Oak LNG• 2 train development – 5.2 mtpa• (~0.7Bcf/d)• First LNG targeted in late 2021
Louisiana LNG• 2 train development – 5.2 mtpa• (~0.7Bcf/d)• First LNG targeted in late 2021
LouisianaLNG
Under Construction
Proposed
30 MT under Construction60 MT total under development

U.S. Shale Plays
5Source: EIA

Shale Revolution Reversed Trend in U.S. Gas Supply
6
Source: EIA
U.S. Dry Gas Production
0
10
20
30
40
50
60
70
80
2000 2001 2002 2003 2004 2005 2006 2007 2008 2009 2010 2011 2012 2013 2014 2015
Conventional Production Shale Production
Bcf/d
2005‐2015: + 50 %
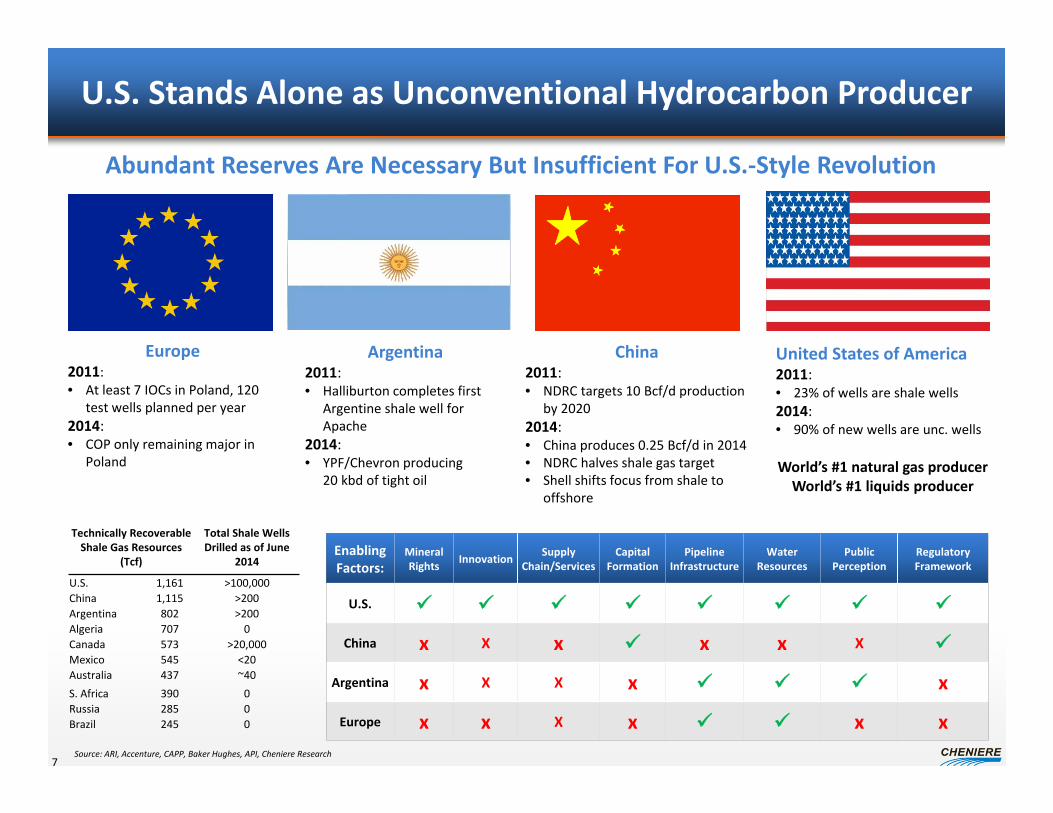
U.S. Stands Alone as Unconventional Hydrocarbon Producer
7
Technically Recoverable Shale Gas Resources
(Tcf)
Total Shale Wells Drilled as of June
2014
U.S. 1,161 >100,000China 1,115 >200Argentina 802 >200Algeria 707 0Canada 573 >20,000Mexico 545 <20Australia 437 ~40S. Africa 390 0Russia 285 0Brazil 245 0
Source: ARI, Accenture, CAPP, Baker Hughes, API, Cheniere Research
EnablingFactors:
MineralRights Innovation Supply
Chain/ServicesCapital
FormationPipeline
InfrastructureWater
ResourcesPublic
PerceptionRegulatory Framework
U.S.
China x X x x x X
Argentina x X X x x
Europe x x X x x x
Europe 2011: • At least 7 IOCs in Poland, 120
test wells planned per year2014: • COP only remaining major in
Poland
Argentina2011: • Halliburton completes first
Argentine shale well for Apache
2014: • YPF/Chevron producing
20 kbd of tight oil
China2011: • NDRC targets 10 Bcf/d production
by 20202014: • China produces 0.25 Bcf/d in 2014• NDRC halves shale gas target• Shell shifts focus from shale to
offshore
United States of America 2011: • 23% of wells are shale wells2014: • 90% of new wells are unc. wells
World’s #1 natural gas producer World’s #1 liquids producer
Abundant Reserves Are Necessary But Insufficient For U.S.‐Style Revolution

Source: Office of Oil and Gas Global Security and Supply, Office of Fossil Energy, U.S. Department of Energy; U.S. Federal Energy Regulatory Commission; Company releases
U.S. LNG Export Projects
8
Dominion Cove Point
Under Construction
Company Quantity(Bcf/d) DOE FERC
* Contracts
Cheniere Sabine Pass T1 – T4
2.2 Fully permitted Fully Subscribed
Freeport 1.8 Fully permitted Fully Subscribed
Lake Charles 2.0 FTA + NonFTA
Fully Subscribed
Dominion Cove Point
1.0 Fully permitted Fully Subscribed
Cameron LNG 1.7 Fully permitted Fully Subscribed
Jordan Cove 1.2/0.8 FTA + NonFTA
Oregon LNG 1.25 FTA + NonFTA
Cheniere Corpus Christi T1 – T3
2.1 Fully permitted Partially Subscribed
Cheniere Sabine Pass T5 – T6
1.3 Fully permittedT5
Subscribed
Southern LNG 0.5 FTA Fully
Subscribed
Magnolia LNG 0.5 FTA Partially
Subscribed
Golden Pass LNG 2 FTA Fully Subscribed
Gulf LNG 1.3 FTA
Freeport LNG
Corpus Christi
Plus other proposed LNG export projects that have not filed a FERC application.Excelerate has requested that FERC put on hold the review its application.
• Application filing = • FERC scheduling notice issued =
Filed FERC Application
Jordan Cove
Oregon LNG
Cameron LNG
Lake Charles
Sabine Pass
Southern LNG
Gulf LNGGolden Pass
Magnolia

U.S. To Become One of the Top Three LNG SuppliersProjected LNG Capacity
2014 Global LNG Capacity: ~37 Bcf/d
9
United States
77mtpa 68
mtpa
Qatar
Source: Wood Mackenzie Q3 2015Cheniere
2014 2025 2014 2025 2014 2025
MEG MEG Rest of WorldIncludes Existing and Under Construction Projects2014: 171 mtpa2025: 189 mtpa
AB
2014 2025
AB
AP AP
1.4mtpa 26
mtpa
81mtpa
AustraliaCheniereSabine Pass T1‐6Corpus Christi T1‐5Parallax
2025
64 mtpa underconst.
31.5 mtpa underconst.
94mtpa
60mtpa

Projected Global LNG Demand 436 mtpa by 2025
22 19 23
2015 2020 2025
2015 2020 2025
6 10 17
2015 2020 2025
2015 2020 2025
Americas
Asia
Middle East/N. Africa184
260305
31 78 92
Europe
Source: Wood MackenzieQ3 2015 LNG Tool(1) Assumes 85% utilization of nameplate capacity
Demand forecasted to increase by 193 mtpa to 2025, a 6% CAGR Average of 23 mtpa of new liquefaction capacity needed each year(1)
10

LNG Trade Today – A Snapshot
50 years old
240 mt (32 bcf/d)
19 exporting countries
31 importing countries
~400 ships
10% of all gas consumed worldwide
30% of internationally traded gas
11Source: BP Statistical Review of World Energy 2015, Cheniere interpretation of Wood Mackenzie data (Q3 2015)

0
50
100
150
200
250
1985 1990 1995 2000 2005 2010
mtpa
LNG: Changing Trade Characteristics
Over the past decade; Significant growth in flexible volumes• Supply tenders• Back‐stop markets• Re‐loads• Portfolio players / aggregators
• Traders
Growing cargo diversions
Increasing competition between markets
12
Source: Poten and Partners (2001), GIIGNL (2015)* Contract duration of 4 years or less (GIIGNL)
LNG trade by contract length
Spot and short‐term trade*
Mid & long‐term contract trade
29%
71%

Non Long‐Term LNG Trade Increasing
0%
5%
10%
15%
20%
25%
30%
35%
0
10
20
30
40
50
60
70
80
2000 2005 2010 2011 2012 2013 2014
Spot and Short‐Term LNG Trade % of Total LNG Trade (right axis)
13Source: GIIGNL 2015
MTPA % SHARE
U.S. Supplies to Create More Market Liquidity Flexible destination clauses New pricing index – Henry Hub Option to purchase – lifting not required
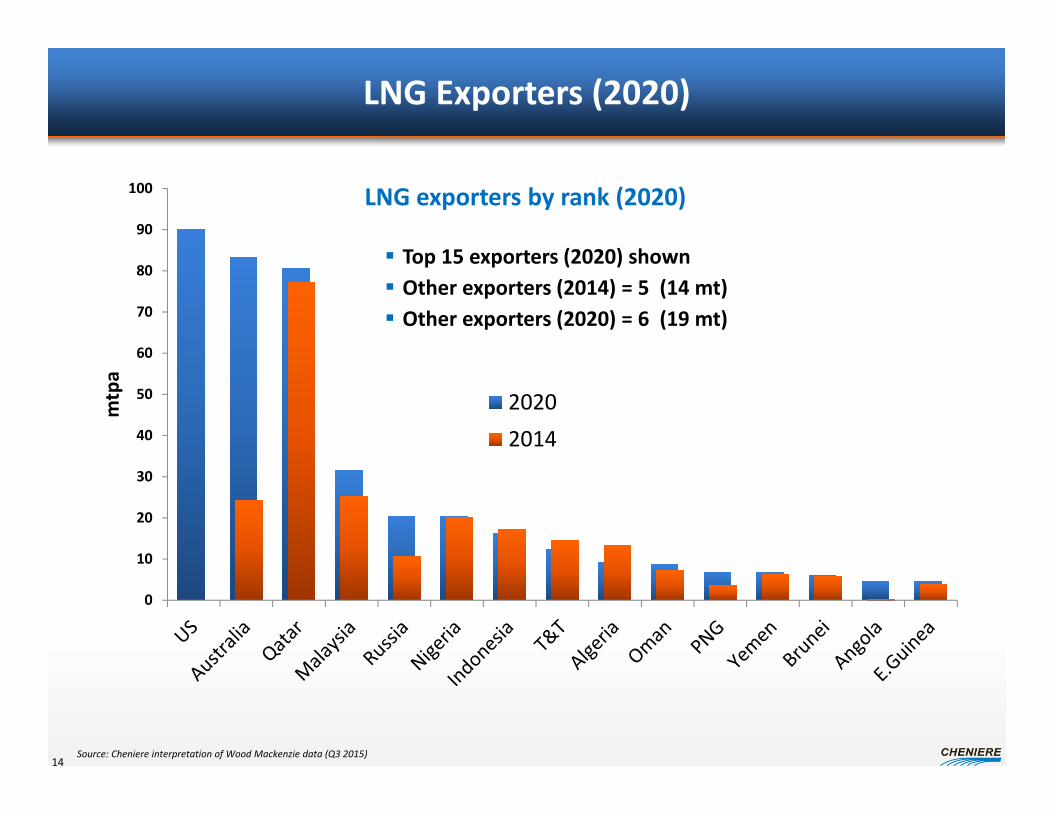
LNG Exporters (2020)
0
10
20
30
40
50
60
70
80
90
100
mtpa
20202014
14Source: Cheniere interpretation of Wood Mackenzie data (Q3 2015)
LNG exporters by rank (2020)
Top 15 exporters (2020) shown Other exporters (2014) = 5 (14 mt) Other exporters (2020) = 6 (19 mt)

0
5
10
15
20
25
2008 2009 2010 2011 2012 2013 2014 2015 2016 2017
$/m
mbt
uGas and LNG Prices (2008 – 2016)
15
Oil parity
NBP
HH
Asia LT proxy
Asia spot
Note: Asia long‐term proxy = 14.85% JCC(‐3) + 0.50Oil parity = JCC = Japanese average crude price
Source: Platts, Heren, Petroleum Association of Japan and Bloomberg (May 2015)

U.S. Can Deliver Gas Profitably…
Delivered Price To: (MMBtu)
Europe Asia
Gas $3.00 $3.00
Transportation 1.00 2.50
Regasification 0.40 0.00
Total Cost $4.40 $5.50
Landed Price $6.00 (TTF) $7.40 (JKM)
Margin $1.60 $1.90
16
Construction costs in the U.S. are between $600‐$800/tonne At $600/tonne of construction cost, $2.00 is a 16% return on capital US prices market oriented High flexibility (no TOP, no destination clause)

European LNG Import Capacity
0
10
20
30
40
50
Spain
UK
France
Italy
Nethe
rland
s
Belgium
Turkey
Portugal
Greece
Poland
Lithuania
mtpa
2025
2014
2014 imports
17
Source: Regas capacity : Wood Mackenzie (Q3 2015) (Existing and Under construction)2014 imports ‐ IHS Waterborne data (2015), delivered volumes*Turkey included as regional importer
European LNG import capacity* versus LNG imports (2014)

Cheniere Energy Global Customers
18
Supply Purchase Agreements
SpainGas Natural Fenosa
EndesaIberdrola
IndiaGAIL
South KoreaKogas
U.K.BGCentrica
8.6
France TotalEDF
IndonesiaPertamina
AustraliaWoodside
PortugalEDP

19

Cheniere: A Key LNG Supplier to Europe
With its LT contracts with Gas Natural Fenosa, Iberdrola, Endesa, Cheniere will supply 30% of the Spanish Market
Cheniere LT contracts in Europe16 MT/year5% of total European Gas Market
20

Key Points
Plentiful, low‐cost natural gas supply in the USA is not in question
The U.S. can build LNG infrastructure cheaper than competitorsand is poised to become one of the top global LNG suppliers
U.S. LNG is competitive with alternative energy sources
Existing regas infrastructure in Europe, but still additionalinvestments needed
Cheniere is well‐positioned to supply Europe with more LNG
21
The U.S. is a low‐cost natural gas producer even in a depressed commodity price environment, enabling it to become a competitive global LNG supplier for decades

Aerial View of SPL Construction – August 2015
Train 1
Train 3
Train 4
Propane Condenser Area
T2 Ethylene Cold Box
T2 Methane Cold Box
Train 2
Air Coolers
T1 Methane Cold Box
T1 Ethylene Cold Box
T3 Ethylene Cold Box
T3 Methane Cold Box
Train 5
T5 Soil Stabilization
Train 6 Under Development
