alkali-activation potential of biomass-coal co-fired …eprints.whiterose.ac.uk/103109/1/shearer...
TRANSCRIPT
This is a repository copy of Alkali-activation potential of biomass-coal co-fired fly ash.
White Rose Research Online URL for this paper:http://eprints.whiterose.ac.uk/103109/
Version: Accepted Version
Article:
Shearer, C.R., Provis, J.L. orcid.org/0000-0003-3372-8922, Bernal, S.A. et al. (1 more author) (2016) Alkali-activation potential of biomass-coal co-fired fly ash. Cement and Concrete Composites, 73. pp. 62-74. ISSN 0958-9465
https://doi.org/10.1016/j.cemconcomp.2016.06.014
[email protected]://eprints.whiterose.ac.uk/
Reuse
This article is distributed under the terms of the Creative Commons Attribution-NonCommercial-NoDerivs (CC BY-NC-ND) licence. This licence only allows you to download this work and share it with others as long as you credit the authors, but you can’t change the article in any way or use it commercially. More information and the full terms of the licence here: https://creativecommons.org/licenses/
Takedown
If you consider content in White Rose Research Online to be in breach of UK law, please notify us by emailing [email protected] including the URL of the record and the reason for the withdrawal request.

Accepted Manuscript
Alkali-activation potential of biomass-coal co-fired fly ash
Christopher R. Shearer, John L. Provis, Susan A. Bernal, Kimberly E. Kurtis
PII: S0958-9465(16)30288-8
DOI: 10.1016/j.cemconcomp.2016.06.014
Reference: CECO 2678
To appear in: Cement and Concrete Composites
Received Date: 15 December 2015
Revised Date: 15 May 2016
Accepted Date: 20 June 2016
Please cite this article as: C.R. Shearer, J.L. Provis, S.A. Bernal, K.E. Kurtis, Alkali-activationpotential of biomass-coal co-fired fly ash, Cement and Concrete Composites (2016), doi: 10.1016/j.cemconcomp.2016.06.014.
This is a PDF file of an unedited manuscript that has been accepted for publication. As a service toour customers we are providing this early version of the manuscript. The manuscript will undergocopyediting, typesetting, and review of the resulting proof before it is published in its final form. Pleasenote that during the production process errors may be discovered which could affect the content, and alllegal disclaimers that apply to the journal pertain.
MA
NU
SC
RIP
T
AC
CE
PTE
D
ACCEPTED MANUSCRIPT
1
Alkali-activation potential of biomass-coal co-fired fly ash
Christopher R. Shearer*,a,1, John L. Provisb, Susan A. Bernalc, Kimberly E. Kurtisa
aSchool of Civil and Environmental Engineering, Georgia Institute of Technology, 790 Atlantic Dr., Atlanta, GA 30332-0355, USA
bDepartment of Materials Science and Engineering, The University of Sheffield, Sir Robert
Hadfield Building, Mappin Street, Sheffield, S1 3JD, United Kingdom
cDepartment of Civil and Structural Engineering, The University of Sheffield, Sir Frederick Mappin Building, Mappin Street, Sheffield, S1 3JD, United Kingdom
Email addresses: C.R. Shearer ([email protected]), J.L. Provis ([email protected]), S.A. Bernal ([email protected]), K.E. Kurtis ([email protected]) *Corresponding author, Phone: +1 (605) 394-2268 1Present address: Department of Civil and Environmental Engineering, South Dakota School of Mines and Technology, 501 E. Saint Joseph St., Rapid City, SD 57701, USA
MA
NU
SC
RIP
T
AC
CE
PTE
D
ACCEPTED MANUSCRIPT
2
Abstract
Co-fired fly ash, derived from the co-combustion of coal and biomass, is examined as a
potential precursor for geopolymers. Compared to a coal fly ash, two co-fired fly ashes have a
lower vitreous content and higher carbon content, primarily due to differing combustion
processing variables. As a result, binders produced with these co-fired fly ashes have reduced
reaction potential. Nevertheless, compressive strengths are generally highest for all ashes
activated with solutions with a molar ratio of SiO2/(Na2O + K2O) = 1, and these mixes reach the
highest extent of reaction among those studied. Activation with sodium hydroxide solution forms
zeolitic phases for all ashes. The thermal and dilatometric behavior of the coal and co-fired fly
ash geopolymers is similar between equivalent mix designs. These results indicate that co-fired
fly ashes can be viably used to form alkali-activated geopolymers, which is a new beneficial end-
use for these emerging waste materials.
Keywords: Fly ash, Biomass, Geopolymer, Strength, Characterization, Microscopy
Introduction 1.
The practice of co-firing coal with biomass has increased worldwide as a result of stricter
emissions regulations and legislation, because biomass combustion can be considered a CO2-
neutral process when the amount of CO2 released into the atmosphere is less than or equal to the
amount of CO2 taken up by the plants during their lifetime [1]. In the U.S., biomass electricity
generation is expected to increase by an average of 3.1% each year through 2030, primarily by
co-firing biomass at existing coal power plants [2]. As more coal power plants convert to co-
firing, it is critical for industries that beneficially reuse coal fly ash to recognize and understand
the potential implications of these changing combustion practices on the quality of fly ash. The
MA
NU
SC
RIP
T
AC
CE
PTE
D
ACCEPTED MANUSCRIPT
3
concrete industry is currently the primary user of coal fly ash as a supplementary cementitious
material, but co-fired fly ash—which is the main by-product of the co-firing process—is not
currently addressed in the U.S. standard for fly ash use in concrete, ASTM C618-12a [3].
However, co-fired fly ash is permitted for use in concrete with additional restrictions under the
European standard (EN 450-1) [4]. Research to find other pathways to utilize this emerging
waste stream is undoubtedly warranted, given its projected increase in production in place of
pure coal fly ash in many countries [5].
One potential reuse application is to generate alkali-activated geopolymers, which are
sustainable binders that can be used as a cost-effective and durable alternative to portland cement
concrete [6]. Since coal fly ash is one of the main precursors used for alkali-activated
geopolymer production, this research examines the use of co-fired fly ash—which can have
comparable chemical compositions and physical properties to coal fly ash—for
geopolymerization. The influence of co-firing on geopolymer gel properties is relatively
unknown. One study examined the zeolitic formation in two alkali-activated co-fired fly ashes
(produced by firing coal with sunflower hulls and an unknown biomass) [7], while another study
geopolymerized co-fired fly ash derived from the combustion of a blend of coal, wood and palm
pits, with addition of blast furnace slag, to produce high strength mixes [8]. Pure biomass ash
from the combustion of eucalyptus forest waste was also successfully geopolymerized, but the
strengths of the resulting geopolymer products were relatively low [9].
Co-firing can yield fly ashes with reduced glassy phase content and higher phosphate,
alkali and magnesium levels compared to coal fly ash [10], depending on the biomass source and
combustion conditions. Biomass ash compositions are also more variable than coal fly ashes
(i.e., biomass ashes have a wider distribution of chemical and physical characteristics) [11]. This

MA
NU
SC
RIP
T
AC
CE
PTE
D
ACCEPTED MANUSCRIPT
4
is important because biomass ash constitutes part of the co-fired fly ash, and its variability may
present challenges when developing viable geopolymer mix designs. Moreover, many of the coal
power plants initially being converted to co-firing facilities in the U.S. are smaller and less
efficient, which could result in ashes with a higher unburned carbon content ultimately affecting
their suitability for alkali-activation. However, this may not be an issue when more efficient
processes are used during co-firing. Since the composition of the precursor material has a
significant impact on the reaction potential and formation of geopolymeric products [6], more
research is needed to understand the implications of co-firing on the properties of the resulting
geopolymer binders.
In this study, three ashes—one commercial-quality coal fly ash and two co-fired fly ashes
produced by burning coal with wood chips—were alkali-activated and examined using strength
testing, infrared spectroscopy, X-ray diffraction (XRD), thermogravimetric analysis (TGA),
dilatometry and scanning electron microscopy (SEM). Co-fired fly ash properties are linked to
binder properties to better understand how potential changes in their composition may impact the
fundamental characteristics of inorganic geopolymers. This research is necessary before co-fired
fly ashes can be utilized in future low-carbon infrastructure, and is important for understanding
the future of geopolymer technology as the U.S., Europe and other regions move increasingly to
biomass co-firing as a fuel source for electricity generation and as the availability of coal fly ash
decreases.
Experimental Methods 2.
2.1. Materials
Three different ash samples were alkali-activated in this study, one derived from ordinary
coal combustion and two derived from co-firing (i.e., produced from the co-combustion of coal

MA
NU
SC
RIP
T
AC
CE
PTE
D
ACCEPTED MANUSCRIPT
5
and biomass during full-scale trials). The sample names in Table 1 use the general notation “X-
YA-##”, where “X” is the plant at which the sample was produced, “YA” is the type of ash (i.e.,
FA is coal fly ash and CA is co-fired fly ash) and “##” indicates the replacement percentage (by
weight) of coal with biomass in the wet feedstock. B-CA-4 and C-CA-15 were produced by co-
firing bituminous coal with pine chips and coarse hardwood chips, respectively. A-FA-0 is a
commercially available coal fly ash produced by firing bituminous coal. The elemental
compositions of these ashes are listed in Table 2, and were measured by X-ray fluorescence
(XRF) on a Philips PW-2400 instrument. Loss on ignition (LOI) was determined gravimetrically
using a LECO TGA 601. The ash median particle sizes and particle size distributions shown in
Figure 1 were obtained by dry-dispersion laser diffraction (Sympatec RODOS T4.1 Particle Size
Analyzer). The Brunauer–Emmett–Teller specific surface area (BET SSA) of each ash was
measured by nitrogen adsorption at 77K using a Micromeritics ASAP 2020 Physisorption
Analyzer. XRD results measured with a Bruker D8 using an internal standard (rutile) were
quantified by the Rietveld method [12]. Total organic carbon content was measured with a
Shimadzu TOC analyzer. These properties are listed in Table 2.
All three ash samples are consistent with the category of Class F ashes under ASTM
C618 on the basis of their primary oxide contents (i.e., the sum of SiO2, Al2O3 and Fe2O3 is
greater than 70%). B-CA-4 has 4% CaO, which is the highest among these ashes. A-FA-0 has
the highest aluminosilicate and amorphous content, which indicates it is primarily composed of a
glassy phase. B-CA-4 and C-CA-15 have high carbon contents, which for C-CA-15 is above the
6% limit stipulated in ASTM C618. B-CA-4 and C-CA-15 also have a lower amorphous glassy
content compared to A-FA-0, after subtracting the amorphous phase associated with organic
carbon in these ashes. Previous work in characterization of these ashes found that the major
MA
NU
SC
RIP
T
AC
CE
PTE
D
ACCEPTED MANUSCRIPT
6
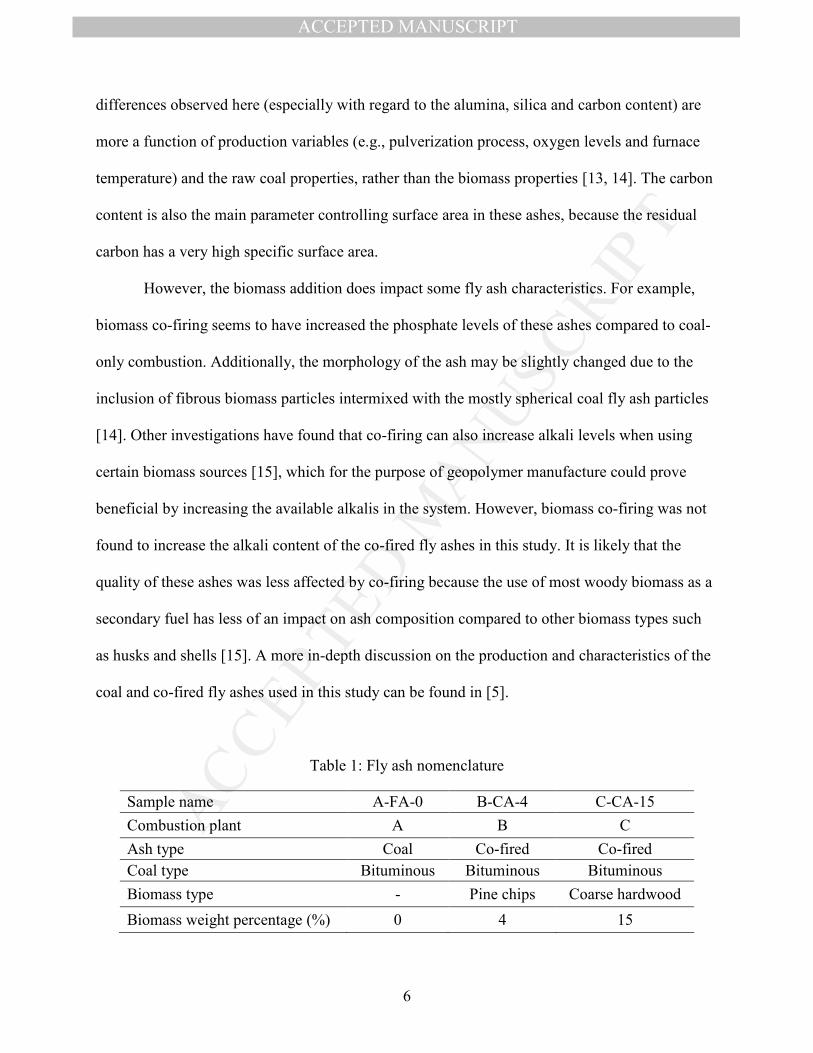
differences observed here (especially with regard to the alumina, silica and carbon content) are
more a function of production variables (e.g., pulverization process, oxygen levels and furnace
temperature) and the raw coal properties, rather than the biomass properties [13, 14]. The carbon
content is also the main parameter controlling surface area in these ashes, because the residual
carbon has a very high specific surface area.
However, the biomass addition does impact some fly ash characteristics. For example,
biomass co-firing seems to have increased the phosphate levels of these ashes compared to coal-
only combustion. Additionally, the morphology of the ash may be slightly changed due to the
inclusion of fibrous biomass particles intermixed with the mostly spherical coal fly ash particles
[14]. Other investigations have found that co-firing can also increase alkali levels when using
certain biomass sources [15], which for the purpose of geopolymer manufacture could prove
beneficial by increasing the available alkalis in the system. However, biomass co-firing was not
found to increase the alkali content of the co-fired fly ashes in this study. It is likely that the
quality of these ashes was less affected by co-firing because the use of most woody biomass as a
secondary fuel has less of an impact on ash composition compared to other biomass types such
as husks and shells [15]. A more in-depth discussion on the production and characteristics of the
coal and co-fired fly ashes used in this study can be found in [5].
Table 1: Fly ash nomenclature
Sample name A-FA-0 B-CA-4 C-CA-15 Combustion plant A B C Ash type Coal Co-fired Co-fired Coal type Bituminous Bituminous Bituminous Biomass type - Pine chips Coarse hardwood Biomass weight percentage (%) 0 4 15

MA
NU
SC
RIP
T
AC
CE
PTE
D
ACCEPTED MANUSCRIPT
7
Table 2: Fly ash properties
Composition (%) A-FA-0 B-CA-4 C-CA-15 Loss on ignition (LOI) 1.4 5.5 15.0 TOC 1.1 4.6 13.6 SiO2 55.3 42.8 47.1 Al2O3 27.2 26.2 23.1 Fe2O3 8.0 13.9 8.7 Σ(SiO2+Al2O3+Fe2O3) 90.5 82.9 78.8 CaO 1.3 4.0 0.8 MgO 1.2 1.2 0.8 SO3 0.1 0.4 0.1 Na2O 0.5 0.5 0.3 K2O 3.0 2.1 2.2 Na2Oeq 2.5 1.9 1.7 P2O5 0.2 0.7 0.5 TiO2 1.4 1.3 1.4 Mn2O3 0.1 0.1 0.0 Cr2O3 0.1 0.1 - Sum total of XRF 99.6 98.8 99.9 Moisture content 0.2 0.3 0.5 Median particle size (µm) 16.2 26.9 11.4 BET SSA (m2/g) 1.3 2.5 6.1
Rietveld quantification of XRD data (%) Quartz 14.1 10.5 10.6 Mullite 17.4 26.5 20.6 Iron oxide crystalline phases 1.1 6.1 2.5 Amorphous content (total) 67.5 56.9 66.3 Amorphous content (excluding carbon) 66.4 52.3 52.7
2.2. Mix Development
Geopolymer pastes were prepared by mixing three ashes (A-FA-0, B-CA-4 and C-CA-
15) with six types of alkaline activating solutions. These solutions represent a range of
MA
NU
SC
RIP
T
AC
CE
PTE
D
ACCEPTED MANUSCRIPT
8
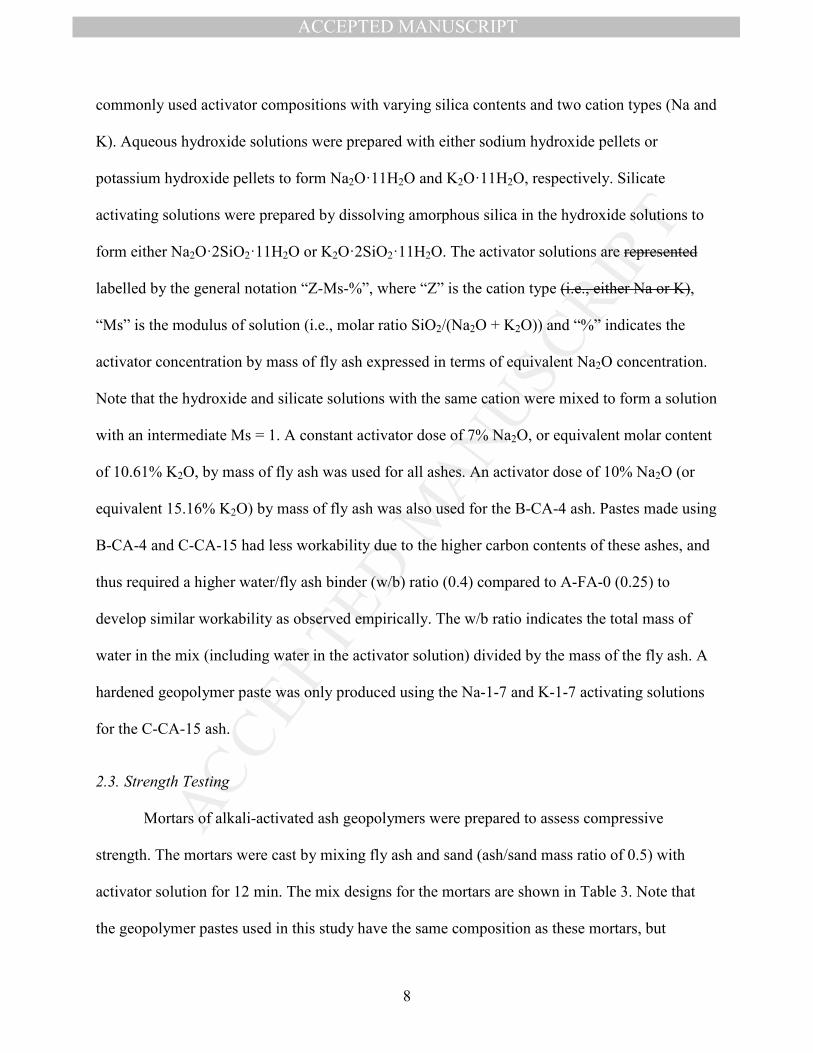
commonly used activator compositions with varying silica contents and two cation types (Na and
K). Aqueous hydroxide solutions were prepared with either sodium hydroxide pellets or
potassium hydroxide pellets to form Na2O:11H2O and K2O:11H2O, respectively. Silicate
activating solutions were prepared by dissolving amorphous silica in the hydroxide solutions to
form either Na2O:2SiO2:11H2O or K2O:2SiO2:11H2O. The activator solutions are represented
labelled by the general notation “Z-Ms-%”, where “Z” is the cation type (i.e., either Na or K),
“Ms” is the modulus of solution (i.e., molar ratio SiO2/(Na2O + K2O)) and “%” indicates the
activator concentration by mass of fly ash expressed in terms of equivalent Na2O concentration.
Note that the hydroxide and silicate solutions with the same cation were mixed to form a solution
with an intermediate Ms = 1. A constant activator dose of 7% Na2O, or equivalent molar content
of 10.61% K2O, by mass of fly ash was used for all ashes. An activator dose of 10% Na2O (or
equivalent 15.16% K2O) by mass of fly ash was also used for the B-CA-4 ash. Pastes made using
B-CA-4 and C-CA-15 had less workability due to the higher carbon contents of these ashes, and
thus required a higher water/fly ash binder (w/b) ratio (0.4) compared to A-FA-0 (0.25) to
develop similar workability as observed empirically. The w/b ratio indicates the total mass of
water in the mix (including water in the activator solution) divided by the mass of the fly ash. A
hardened geopolymer paste was only produced using the Na-1-7 and K-1-7 activating solutions
for the C-CA-15 ash.
2.3. Strength Testing
Mortars of alkali-activated ash geopolymers were prepared to assess compressive
strength. The mortars were cast by mixing fly ash and sand (ash/sand mass ratio of 0.5) with
activator solution for 12 min. The mix designs for the mortars are shown in Table 3. Note that
the geopolymer pastes used in this study have the same composition as these mortars, but
MA
NU
SC
RIP
T
AC
CE
PTE
D
ACCEPTED MANUSCRIPT
9
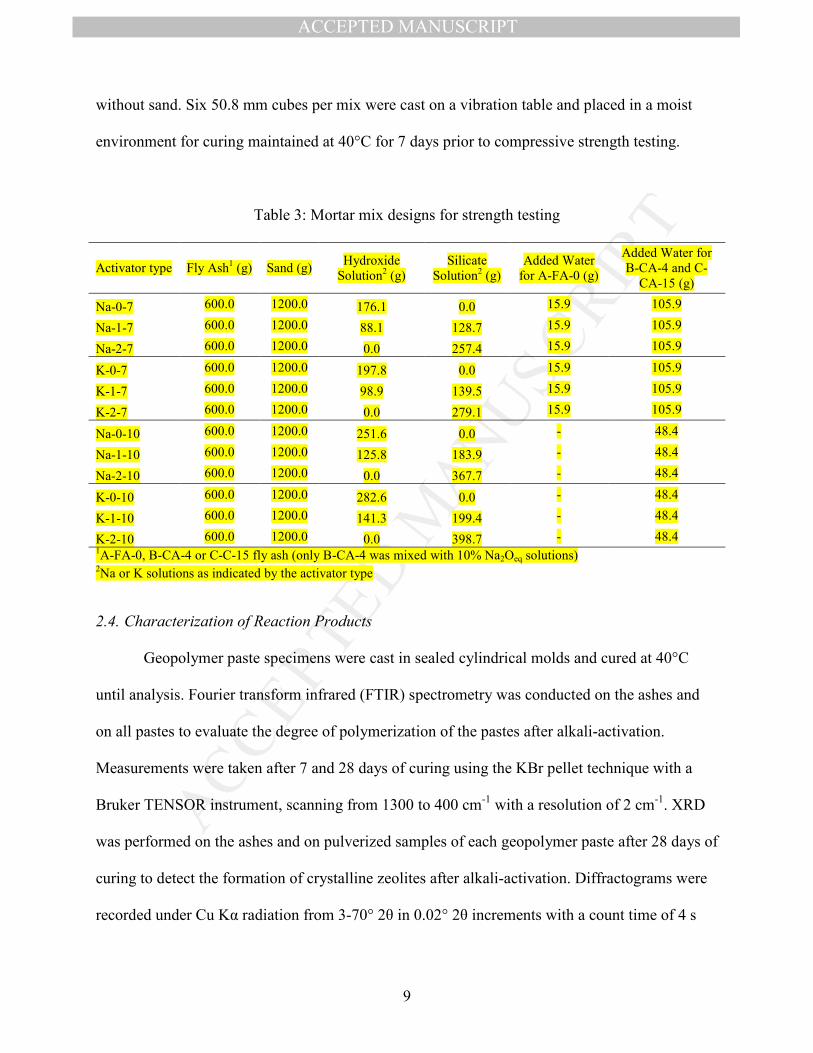
without sand. Six 50.8 mm cubes per mix were cast on a vibration table and placed in a moist
environment for curing maintained at 40°C for 7 days prior to compressive strength testing.
Table 3: Mortar mix designs for strength testing
Activator type Fly Ash1 (g) Sand (g) Hydroxide Solution2 (g)
Silicate Solution2 (g)
Added Water for A-FA-0 (g)
Added Water for B-CA-4 and C-
CA-15 (g)
Na-0-7 600.0 1200.0 176.1 0.0 15.9 105.9
Na-1-7 600.0 1200.0 88.1 128.7 15.9 105.9
Na-2-7 600.0 1200.0 0.0 257.4 15.9 105.9
K-0-7 600.0 1200.0 197.8 0.0 15.9 105.9
K-1-7 600.0 1200.0 98.9 139.5 15.9 105.9
K-2-7 600.0 1200.0 0.0 279.1 15.9 105.9
Na-0-10 600.0 1200.0 251.6 0.0 - 48.4
Na-1-10 600.0 1200.0 125.8 183.9 - 48.4
Na-2-10 600.0 1200.0 0.0 367.7 - 48.4
K-0-10 600.0 1200.0 282.6 0.0 - 48.4
K-1-10 600.0 1200.0 141.3 199.4 - 48.4
K-2-10 600.0 1200.0 0.0 398.7 - 48.4 1A-FA-0, B-CA-4 or C-C-15 fly ash (only B-CA-4 was mixed with 10% Na2Oeq solutions) 2Na or K solutions as indicated by the activator type
2.4. Characterization of Reaction Products
Geopolymer paste specimens were cast in sealed cylindrical molds and cured at 40°C
until analysis. Fourier transform infrared (FTIR) spectrometry was conducted on the ashes and
on all pastes to evaluate the degree of polymerization of the pastes after alkali-activation.
Measurements were taken after 7 and 28 days of curing using the KBr pellet technique with a
Bruker TENSOR instrument, scanning from 1300 to 400 cm-1 with a resolution of 2 cm-1. XRD
was performed on the ashes and on pulverized samples of each geopolymer paste after 28 days of
curing to detect the formation of crystalline zeolites after alkali-activation. Diffractograms were
recorded under Cu Kα radiation from 3-70° 2θ in 0.02° 2θ increments with a count time of 4 s

MA
NU
SC
RIP
T
AC
CE
PTE
D
ACCEPTED MANUSCRIPT
10
per step, using a Bruker D8 ADVANCE diffractometer. Gold-sputtered fly ash and geopolymer
pastes were examined in a Zeiss Ultra60 FE-SEM (field-emission scanning electron microscope)
at varying magnifications under high vacuum with an accelerating voltage of 5 kV to observe the
geopolymer binder development.
2.5. Thermogravimetric Analysis (TGA)
TGA was performed on geopolymer paste samples to assess the water environments
within these materials. Samples were cast in a sealed syringe and cured at 40°C for 7 days. A
fraction of each paste was pulverized into a fine powder after curing. Acetone was used to stop
the reaction, and then removed by filtration. The powder (10-20 mg) was placed in a platinum
pan in a Hitachi TG/DTA 7300 instrument under a constant flow of nitrogen gas. The sample
was heated from 25-1100ºC at a rate of 10ºC/min, and the change in mass was recorded as a
function of temperature.
2.6. Thermomechanical Analysis (TMA)
Dilatometry was performed on geopolymer paste samples to provide information
regarding their gel and pore structures. Samples were cast in a sealed syringe and cured at 40°C
for 7 days. Cylinders approximately 5 mm in diameter and 10 mm long were cut and tested in a
PerkinElmer Diamond Thermomechanical Analyzer. Each sample was held at 30°C for 10 min
and then heated to 1000°C at 10ºC/min under a nitrogen gas purge and a constant load of 50 mN
to hold the specimen in place. The longitudinal deformation of the specimen was recorded as a
function of temperature.
MA
NU
SC
RIP
T
AC
CE
PTE
D
ACCEPTED MANUSCRIPT
11
Results and Discussion 3.
3.1. Compressive Strength
Compressive strength values are plotted in Figure 2 as a function of the modulus of
solution for all alkali-activated mortars. The ash source and activator type both had a significant
impact on the mechanical properties of the formed geopolymers. The activators with Ms = 1
produced the strongest mixes overall for all ashes, and the high-quality coal fly ash (A-FA-0)
mixes had the highest strengths of any ash (up to 78 MPa) at this modulus. The impact of the ash
composition on strength was also most significant at Ms = 1. At Ms = 2, the co-fired fly ash B-
CA-4 actually had a higher strength than the coal fly ash A-FA-0, highlighting that achieving
optimal geopolymer mix performance requires the appropriate combination of ash and activator.
The variation in strengths between the alkali-activated ash mortars was likely affected by
the differing chemical and physical properties of the precursor. For example, A-FA-0 is finer
than B-CA-4, and has a lower unburned carbon content, which may have increased its reactivity
and strength at Ms = 1. However, the reactive amorphous content of the ashes was likely more
significant in determining strength. The higher glassy aluminosilicate content of A-FA-0
compared to both B-CA-4 and C-CA-15 contributed to its high strength after activation with
certain alkali solutions, since the vitreous silica- and alumina-rich phases in coal fly ash
contribute the most to the formation of geopolymer products [16]. As a result, C-CA-15
produced much weaker gels compared to A-FA-0 even though C-CA-15 is the finest ash. It is
likely that the differences in fineness and the lower vitreous content of the co-fired fly ashes are
more related to the composition of the parent coal and combustion conditions and less a result of
co-firing with wood, as indicated by the similar overall physical and chemical characteristics of
coal fly ashes produced at the same plant under similar processing conditions to the co-fired fly
MA
NU
SC
RIP
T
AC
CE
PTE
D
ACCEPTED MANUSCRIPT
12
ashes used in this study [13, 14]. The co-fired fly ashes used in this study are primarily
comprised of ash derived from the coal combustion with a much smaller quantity of ash derived
from the secondary wood fuel source. For both of these co-fired fly ashes, the biomass ash
constitutes at most around 1% as calculated from the ash contents of the biomass and coal fuels
[5].
The high unburned carbon content in the co-fired fly ashes reduced their reactive
potential and contributed to the higher water demand of these mixes. Additionally, the residual
carbon could have behaved like an alkali sink by adsorbing—and effectively removing—alkali
cations necessary for the geopolymeric reaction [17]. As a result, the ash with the highest carbon
content (C-CA-15) did not form a hardened geopolymer gel at Ms = 0 or 2 (plotted at zero
strength) even though it had a slightly higher glassy content than B-CA-4, which formed
hardened gels at all Ms values. Also, the higher calcium content of B-CA-4 may have
contributed to its higher strength at Ms = 2 (relative to both C-CA-15 and A-FA-0), because a
greater concentration of alkaline earth metals such as calcium in the precursor has been shown to
increase geopolymer strength [18].
For these ashes, Na-activated mixes were generally stronger than equivalent K-activated
mixes. The K-activators may have been less effective in breaking down the amorphous content
of the co-fired fly ashes and also retarded the reaction kinetics compared to the Na-activators for
some mixes, which is similar to their effect on coal fly ash during activation [19, 20]. Still, it
appears the silica content of the activation solution had a greater impact on strength than cation
type. For the coal and co-fired fly ashes the optimum modulus of solution for strength was 1
among the activator solutions tested. Geopolymers too poor or rich in silica tend to have low
strengths [21], which could explain why both the coal and co-fired fly ashes produced mixes

MA
NU
SC
RIP
T
AC
CE
PTE
D
ACCEPTED MANUSCRIPT
13
with similarly low strengths at Ms = 0 and 2 (although for B-CA-4 the difference in strength
between Ms values of 1 and 2 is much lower than for A-FA-0 and C-CA-15). Also, for B-CA-4
mixes an increase in activator concentration from 7% to 10% had the greatest effect on strength
at Ms = 1. B-CA-4 Na-1-10 was the strongest co-fired fly ash mix overall, with a binder strength
of 44 MPa, sufficient for many applications.
3.2. Infrared Spectroscopy
FTIR spectra are shown in Figure 3 for both the raw ashes and the geopolymer pastes
cured for 7 days. The peaks of key interest are the bending and stretching modes of the Si-O-T
bonds, where T is either Si or Al in tetrahedral coordination. All three ashes have a wide and
intense peak between 1069-1074 cm-1 associated with the asymmetric stretching of the Si-O-T
bonds (the main Si-O-T peak). There is also a shoulder visible between 1159-1167 cm-1 in these
ash spectra, linked to the asymmetric Si-O-Si stretching vibration. Quartz bands were detected as
a doublet at 793-797 and 777 cm-1, and peaks at 694-696 cm-1 and 453-461 cm-1, for all three raw
ashes, and a wide band representing mullite was observed between 550-554 cm-1 [22]. The bands
around the 450 cm-1 region are also associated with the internal deformation vibrations of the T-
O bonds, also known as the in-plane bending mode [23]. The similar locations of these bands for
all three ashes indicate that both co-fired fly ashes have a comparable aluminosilicate molecular
structure to the coal fly ash.
After alkali-activation, the main Si-O-T peak shifted to a lower wavenumber after 7 days
of curing for all coal and co-fired fly ashes due to the incorporation of Al and/or substitution of
the alkali metal cations into the network, and the higher concentration of non-bridging oxygen
atoms in the partially formed geopolymer compared to the raw ash [19, 24]. The original, glassy
tetrahedral silicate and/or aluminosilicate framework of the coal and co-fired fly ashes was
MA
NU
SC
RIP
T
AC
CE
PTE
D
ACCEPTED MANUSCRIPT
14
partially depolymerized, and a new aluminosilicate geopolymer gel was subsequently
polymerized. The quartz and mullite bands did not significantly shift after alkali-activation,
indicating that these crystalline phases remained unchanged.
The silica content of the activator solution had the most significant impact on the main
Si-O-T peak shift. Ms = 0 mixes underwent the largest shift to the lowest wavenumber, while the
silicate activators (both Ms = 1 and 2) produced more highly polymerized gels for all three ashes
as indicated by the higher wavenumbers in this region. For coal fly ash gels, the pH and silicate
speciation are responsible for controlling the degree of polymerization [25-27]. Speciation
appears to also control polymerization in co-fired fly ash gels. The higher wavenumber position
observed for this peak in the silicate-activated mixes is partly a result of their greater
repolymerized gel fraction, which correlates well with strength values (i.e., Ms = 1 mixes
produced the highest strengths for all three ashes).
The alkali ion type and activator dose also influenced the degree of polymerization of
these gels. For mixes with no or less added silica (i.e., Ms = 0 and 1), the potassium activators
tended to shift the primary asymmetric stretching band less than comparable sodium activators,
resulting in higher wavenumbers for both the coal and co-fired fly ash gels when using K-
activation. K-activation increases the condensation of aluminosilicate structures during their
formation due to the larger size of the K+ ion compared to the Na+ ion, which results in a more
polymerized (but not necessarily stronger) gel [28]. For B-CA-4, an increase in activator dose
promoted further dissolution of the original amorphous phase of the co-fired fly ash, which is
signified by the lower wavenumbers of the main stretching band for most of the 10%-activated
gels (Figure 3c) compared to equivalent 7%-activated gels (Figure 3b).
The ash composition also impacted the main peak location, but likely less than the
activator composition and concentration for these samples. The glass in the B-CA-4 ash may
have been depolymerized to a greater extent by some activating solutions due to its higher

MA
NU
SC
RIP
T
AC
CE
PTE
D
ACCEPTED MANUSCRIPT
15
content of alkaline earth metals (e.g., Ca2+), which are network modifiers and promote the
dissolution of aluminum [18]. However, the impact of the ash composition on the subsequent
repolymerization is less clear from these data. For both co-fired fly ashes, the higher carbon
content likely adsorbed some of the alkalis which are necessary for the reorganization and cross-
linking of the leached Si and Al species to form N-A-S-H or K-A-S-H gel. Perhaps as a
consequence of this and its lower vitreous content, B-CA-4 gels produced at Ms = 1 were less
polymerized after 7 days than corresponding A-FA-0 gels, and also had lower strengths. C-CA-
15 gels had higher wavenumbers at this band location compared to A-FA-0, but also produced
much lower strengths. For C-CA-15 gels, these higher wavenumbers are likely due to the lower
initial depolymerization of C-CA-15, and not due to a greater repolymerization.
Changes in the main stretching band directly related to biomass co-firing are more
difficult to identify. The increase in P2O5 content may have altered the depolymerization
potential for the co-fired fly ashes because it is a network former [29]. Crystallized phosphate
minerals can form within Si-K glass in pure biomass ash [30], but it is not clear whether the
additional phosphate from the biomass fuel is present in the glassy reactive phases in these co-
fired fly ashes. Regardless, the concentration of any impurities added to the ash as a result of co-
firing is small relative to the overall aluminosilicate content derived from the coal. It appears
from these data that the alkali-activation reaction mechanisms for co-fired fly ash are analogous
to those observed for coal fly ash, which is not unexpected given that the majority of the ash is
derived from coal combustion.
Figure 4 shows the main Si-O-T peak locations of the geopolymers after 28 days of
curing. In general, this wavenumber location was higher for gels with added silica, which was
also observed for many of these samples at 7 days. There were slight shifts in the main stretching
MA
NU
SC
RIP
T
AC
CE
PTE
D
ACCEPTED MANUSCRIPT
16
band between 7 and 28 days of curing for most of the gels indicating some change in the cross-
linking of their aluminosilicate structure with time. For alkali-activated coal fly ash, a gel that is
enriched in Al-containing bonds is initially formed, and eventually replaced with a gel containing
more Si-O linkages at later ages [31]. The data show that for most of the coal and co-fired fly ash
geopolymers, this secondary gel has likely formed by 7 days, as demonstrated by the relative
stabilization of this main band.
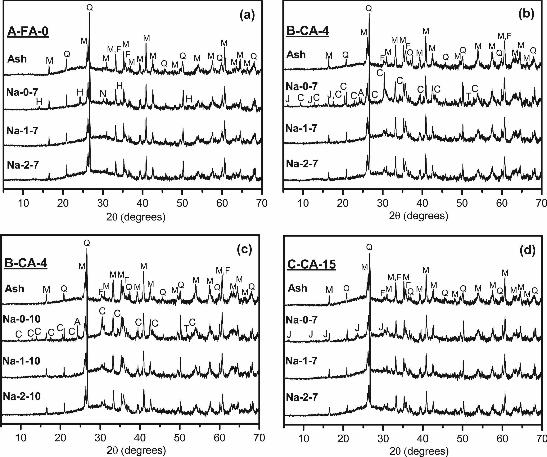
3.3. X-Ray Diffraction
The coal fly ash A-FA-0 (Figure 5a) primarily contains an X-ray amorphous phase with a
smaller quantity of quartz (SiO2, Powder Diffraction File (PDF) card 01-083-0539), mullite
(Al6Si2O13, PDF# 00-015-0776) and a combination of iron oxides. Multiple iron oxide phases
with overlapping peaks were observed in this diffractogram, which makes their identification
difficult. However, the iron content in the coal fly ash is mostly a ferrite spinel (with substitution
of various elements onto both the Fe2+ and Fe3+ sites as previously observed [32]), but may also
include some hematite (Fe2O3, PDF# 00-033-0664). The major phase in both B-CA-4 and C-CA-
15 (Figure 5b-5d) is also X-ray amorphous with similar crystalline phases to the coal fly ash:
quartz (SiO2, PDF# 01-083-0539 for both), mullite (Al6Si2O13, PDF# 00-015-0776 for both), a
ferrite spinel phase, and possibly maghemite (γ-Fe2O3, PDF# 00-089-5894) in B-CA-4, and
magnetite (Fe3O4, PDF# 01-078-3149) and hematite (Fe2O3, PDF# 00-033-0664) in C-CA-15.
The peaks associated with iron oxide phases are more intense in B-CA-4, which correlates well
with the quantitative XRD results in Table 2.
The similarity between the crystalline phases identified in the three raw ashes suggests
that the secondary fuel did not noticeably impact the crystalline composition of these co-fired fly
ashes. Wood ash typically contains crystalline phases that depend on the species type and

MA
NU
SC
RIP
T
AC
CE
PTE
D
ACCEPTED MANUSCRIPT
17
combustion temperature, but which normally contain calcium, potassium and other trace
elements such as phosphates [13, 30, 33]. No calcium, potassium or phosphate-containing
crystalline phases were detected in these co-fired fly ashes, which may indicate that the quantity
of crystalline phases potentially derived from the wood ash was too low to be detected by XRD.
Furthermore, wood ash can have a much lower amorphous content than coal fly ash [13], which
is a more important characteristic regarding the usefulness of co-fired fly ash as a precursor
material given that wood ash is a component. Still, all three ashes have an amorphous hump at
around 15-35° 2θ and centered around 25° 2θ. As previously discussed, the co-fired fly ashes
have lower glassy amorphous contents compared to the coal fly ash, however this is more likely
a result of differences in combustion processing variables than the inclusion of the wood ash.
After alkali-activation, an amorphous aluminosilicate geopolymer gel was formed that is
identifiable by a broad peak at a higher angle (around 15-40° 2θ and centered around 28° 2θ)
than the peak due to the vitreous phases in the fly ash. Crystalline zeolitic phases were also
formed after activation with Na-0 solutions for all three ashes. For A-FA-0, hydrosodalite
(1.08Na2O:Al2O3:1.68SiO2:1.8H2O, PDF# 00-031-1271) was identified, along with a hydrous
sodium silicate (Na2Si3O7�H2O, PDF# 01-072-6800). For B-CA-4, activation at 7% Na2O led to
the formation of chabazite-Na (NaAlSi2O6:3H2O, PDF# 00-019-1178), faujasite
(NaAlSi2O6:4H2O, PDF# 00-039-1380), analcime (NaAlSi2O6�H2O, PDF# 00-019-1180) and
potentially natron (Na2CO3�10H2O, PDF# 00-015-0800). When activating B-CA-4 at 10% Na2O,
all of the zeolites formed at 7% were again detected except for faujasite, and natron was also
detected. It appears that for B-CA-4, an increase in alkali content reduced zeolite formation.
Perhaps more of the species necessary for the formation of faujasite were incorporated into the
additional amorphous strength-giving gel, as strengths were slightly higher with 10% Na2O
MA
NU
SC
RIP
T
AC
CE
PTE
D
ACCEPTED MANUSCRIPT
18
activation. For C-CA-15, only faujasite was detected. The variation in zeolite formation between
binders with similar activators was a result of the different ash compositions, although the
chemical compositions of the formed zeolites were similar overall.
No zeolites were detected in any of the K-activated ashes, even at Ms = 0, because the
formation of potassium zeolite structures is not as favored as the formation of sodium zeolites
[20]. No additional crystalline phases were detected after activation with any solution with added
silica (both Na and K), suggesting that the added alkali ions have either been incorporated into
the amorphous gel phase or are still available in the pore solution. Also, an increase in soluble
silica has been shown to slow zeolite formation [27], which is consistent with these results.
3.4. Thermogravimetry
The thermogravimetric data for the ashes and geopolymer pastes are shown in Figure 6.
The bulk of the weight loss for all mixes occurred early in the heating process due to the
evaporation of easily accessible free water below 100°C in addition to the loss of free water from
the gel pores between 100-250°C. Given the higher water content of the B-CA-4 mixes
compared to A-FA-0 mixes (w/b = 0.4 vs. 0.25), evaporation in this region was expected to be
greater for B-CA-4 geopolymers due to presence of more available free water. However,
equivalent A-FA-0 and B-CA-4 mixes had similar weight loss up to 250°C. This may be a result
of the high residual carbon content of this ash, which can adsorb water on its surface and
effectively remove it from the pore system [34]. However, further investigation is needed to
better understand the potential of the carbon in these ashes to bind water.
Between 250-600°C, the weight loss for all pastes was due to dehydroxylation of the gel
and subsequent condensation of the bound silanol or aluminol groups [35]. At higher
temperatures, distinct weight loss events were likely caused by the decomposition of carbonated
MA
NU
SC
RIP
T
AC
CE
PTE
D
ACCEPTED MANUSCRIPT
19
phases or carbonate salts in the pore solution. Additionally, weight loss associated with the
decomposition of the unburned carbon in the raw ashes occurred mostly above 800°C. Carbon
oxidation can still occur in an inert N2 atmosphere, which was used to analyze these samples, due
to the reduction of iron oxides at these high temperatures [36]. Weight loss at 800°C for the raw
B-CA-4 and C-CA-15 ashes were 1.0% and 2.2%, respectively, which is still significantly lower
than their LOI values (5.5% and 15.0%, respectively) measured under normal atmospheric
conditions. The weight loss of the raw low-carbon A-FA-0 at 800°C is 0.8% which is similar to
that found for B-CA-4, and thus the direct comparison of the various geopolymer pastes using
TGA is warranted when comparing weight loss below 800°C.
The total weight loss at 800°C of B-CA-4 mixes was higher compared to all equivalent
A-FA-0 mixes, but a larger fraction of weight was lost before 250°C for A-FA-0 mixes.
Comparison of C-CA-15 TGA data with the A-FA-0 and B-CA-4 is more difficult because of the
overlapping decomposition of organics with geopolymer-related weight loss. Nevertheless, the
total weight losses for C-CA-15 mixes were within the range of those observed for the other two
ashes. Overall, the thermal behavior of the co-fired fly ash gels as measured by TGA was similar
to that of the coal fly ash gels, suggesting comparable gel and pore structures.
For all pastes, the total weight loss at 800°C was higher for Na-activated geopolymers
compared to equivalent K-activated geopolymers. This could be a result of the greater amount of
geopolymer gel in these binders, which was also evidenced by the higher strengths of the Na-
activated geopolymers in general. However, the majority of difference in weight loss between Na
and K geopolymers occured below 250°C, which suggests that differences in the availability of
free water also played a significant role. Also, total weight losses were higher for A-FA-0 mixes
MA
NU
SC
RIP
T
AC
CE
PTE
D
ACCEPTED MANUSCRIPT
20
with added silica (i.e., Ms = 1 and 2), perhaps due to the higher bound water contents of these
gels.
For B-CA-4, an increase in activator content from 7% to 10% also increased weight loss at
both 250°C (by 18-32%) and 800°C (by 10-24%). The geopolymers that exhibited an increased
strength due to an increased activator content also had a greater total weight loss. It is likely that
additional geopolymer gel products were formed in these pastes, resulting in this higher weight
loss. For mixes with no added silica (Ms = 0), the increase in total weight loss due to an
increased alkali content was lowest, and these mixes correspondingly had the least significant
changes in strength due to an increased activator dose.
3.5. Dilatometry
The dilatometric curves for the six alkali-activated coal fly ash (A-FA-0) mixes are
presented in Figure 7a. The thermal behavior of these pastes is consistent with those observed by
others for alkali-activated coal fly ash and metakaolin [35, 37-40]. As evidenced by the TGA
data, shrinkage occurred below 250°C due to the evaporation of water from the aluminosilicate
gel. For A-FA-0, the onset temperature of shrinkage in the 100-250°C region was highest for the
Ms = 1 mixes. The high mechanical strengths of these mixes likely provided greater resistance to
this initial shrinkage in a way analogous to metakaolin geopolymers with high elastic moduli,
which have been shown to better resist capillary strain forces due to pore shrinkage in this
temperature region [35]. Between 250-600°C there was a more gradual shrinkage in all samples
linked to dehydroxylation of the gel, which was also observed by TGA. In this region, the
thermal shrinkage was greatest for Ms = 1 mixes, suggesting that these gels had a higher bound
hydroxyl content due to a higher degree of reaction.
MA
NU
SC
RIP
T
AC
CE
PTE
D
ACCEPTED MANUSCRIPT
21
The thermal behavior of A-FA-0 samples was more varied above 600°C, which was
primarily a function of the activator type. Specifically, the Si content and cation type of the
initial solution significantly impacted expansion at higher temperatures. Typically,
aluminosilicate geopolymer gels densify due to viscous sintering above 600°C [41]. This
phenomenon was visible on both K-1 and Na-1 dilatometric traces, but less so in the other traces.
This may be due to the greater quantity of gel available for sintering in the Ms = 1 samples, but
also could be attributed to the overlapping expansion observed in this region for some activators,
which began around 400°C for the K-2 and Na-2 mixes and around 500°C for the K-0 mix. For
high silicate mixes, this low-temperature expansion has been linked to the foaming of loosely
bound water associated with the high amounts of unreacted silica in the gel [39]. A similar
phenomenon may have occurred in the K-0 activated gel; water might have foamed from the
release of hydroxyls bound on depolymerized Q3, Q2 or Q1 sites, which are more common in
less-polymerized geopolymers such as this one (as evidenced by its low main Si-O-T band
wavenumber detected by FTIR) [39, 42]. On the other hand, the Na-0 gel remained relatively
stable over this temperature range (i.e., no expansion was observed at lower temperatures)
indicating that it had a comparatively more cross-linked gel. Another expansion at even higher
temperatures was detected in all mixes, although this expansion peak was obscured for some
samples by a more pronounced concurrent shrinkage. This has been associated with the
liberation of chemically bound water from an undercoordinated silica-rich gel phase, and could
potentially be correlated to strength [37, 39], as will be further discussed later in this section.
Lastly, all of the mixes experienced significant shrinkage above 1000°C due to further melting of
the binder.

MA
NU
SC
RIP
T
AC
CE
PTE
D
ACCEPTED MANUSCRIPT
22
Co-fired fly ash (B-CA-4) gels exhibited a similar thermal behavior compared to
corresponding coal fly ash gels (Figure 7b). In the low-temperature region associated with the
dehydration of pores (up to 250°C), shrinkage was comparable depending on the activating mix,
which corresponds well with evaporation measured by TGA. These gels were produced with a
higher w/b ratio compared to A-FA-0 and thus might be expected to have greater shrinkage in
this region. However, shrinkage was largely unaffected because water in very large pores, which
will be more notable at higher w/b, will cause less shrinkage during evaporation. Also similar to
the coal fly ash gels, the onset shrinkage temperature in this region was highest for mixes with
the highest mechanical strength (i.e., Na-1-7 and K-1-7).
Within the dehydroxlation region, one high-silica mix (K-2-7) began expanding due to
the foaming of loosely bound water associated with the high-silica gel. However, compared to
the equivalent A-FA-0 mix, the expansion of this paste began at a higher temperature (~500°C)
and was less intense. Moreover, the B-CA-4 Na-2-7 mix did not expand at low temperatures,
unlike the equivalent A-FA-0 mix. This suggests that the B-CA-4 mixes contain less of the
expansive silica phase than the A-FA-0 mixes when activated at Ms = 2, as the additional silica
has been incorporated into further geopolymer formation. This is also substantiated by the
similar or higher strengths at Ms = 2 compared to Ms = 1 for this ash at the 7% activator dose.
Increasing the alkali content from 7% to 10% for B-CA-4 significantly affected the
dilatometric traces (Figure 7c). Overall, 10% activated pastes exhibited less dimensional stability
upon heating, in agreement with previous results for coal fly ash alkali-activation [37]. Na-1-10
appears to be the only mix in this series which was able to better resist the early pore collapse
caused by loss of the free water compared to corresponding 7% mixes. Na-1 was also the only
activator for B-CA-4 that resulted in a substantial increase in strength due to a higher alkali dose.
MA
NU
SC
RIP
T
AC
CE
PTE
D
ACCEPTED MANUSCRIPT
23
Shrinkage due to loss of bound hydroxyls was similar for both activator concentrations, but the
expansion and shrinkage features at higher temperatures were more exaggerated at the 10%
activator dose.
For both ashes, K-geopolymers had less thermal shrinkage than Na-geopolymers at each
respective Ms value. The lower shrinkage for K-geopolymers was particularly evident in the
dehydration region where K-activation also exhibited less weight loss compared to Na-
activation, but less evident during dehydroxylation. Cation type also had an impact on the
viscous sintering onset temperature for these mixes; sintering of K-geopolymers tended to take
place at higher temperatures compared to Na-geopolymers. This is most discernible in pastes
where expansion due to silica-rich phases is not superimposed on viscous sintering shrinkage.
Shrinkage can also be influenced by crystallization in the geopolymer gel at temperatures above
650°C [43]. For coal fly ash geopolymers, the decomposition of the gel can result in the
formation of Na and K feldspars at elevated temperatures, although crystallization is more
favored in Na-geopolymers due to the higher diffusion coefficient of Na compared to K upon
heating [44]. It is possible that crystallization in the Na-geopolymers (especially for B-CA-4)
could be responsible for some of the expansion observed over the thermal evolution due to
crystallization pressure cracking. However, for most of these mixes, it is likely that the overall
thermal behavior at these high temperatures is controlled more by the viscous flow of the
amorphous gel phase [43].
C-CA-15 had nearly identical dilatometric curves for K-1-7 and Na-1-7 (Figure 7d),
which was not observed for A-FA-0 and B-CA-4. Since C-CA-15 mixes had the least variation
in strength between cation types at Ms = 1 when comparing all three ashes (i.e, the strength of
Na-1-7 was only 19% more than K-1-7), the structure of the geopolymer gel may be more
MA
NU
SC
RIP
T
AC
CE
PTE
D
ACCEPTED MANUSCRIPT
24
similar for this ash when using these activators. This suggests that the alkali cation type had less
of an effect on gel formation for this ash. Regardless, both of the pastes formed with C-CA-15
had high dimensional stability, and pore shrinkage was greater than any expansive processes at
all temperatures.
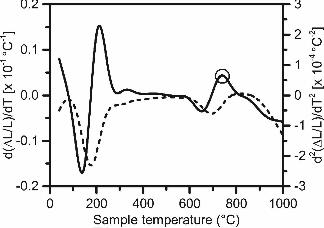
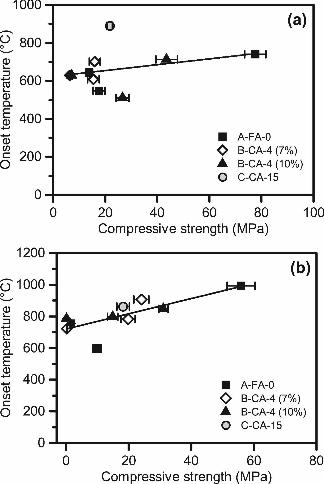
3.5.1. Relationship between expansion onset temperature and strength
Previous work has correlated the onset temperature of the primary high-silica gel
expansion peak to compressive strength for coal fly ash geopolymers, with higher onset
temperatures linked to stronger binders [37, 39]. To enable these comparisons, the first and
second derivatives of each dilatometric curve were plotted to easily detect the onset temperature
of this reaction for each gel (i.e., the second derivative has a maximum at the location of the
onset of this expansion peak). The derivative curves were determined using numerical
differentiation based on Tikhonov regularization [45], which incorporates smoothing techniques
to mitigate the inherent scatter in the numerical data upon differentiation. An example of the
derivative curves for the A-FA-0 Na-1-7 mix is shown in Figure 8, with the expansion peak of
interest marked.
The onset temperatures for this expansion peak are plotted vs. strength results for all Na-
activated gels in Figure 9a, and for all K-activated gels in Figure 9b. Generally, stronger
geopolymers exhibited higher onset temperatures for both cation types (as previously observed
[37, 39]), but the correlation is stronger for K-activated gels compared to Na-activated gels. This
could be due to the presence of discrete sodium silicate hydrates, such as those detected by XRD
for some mixes, which can crystallize in sodium silicate activator solutions with Ms values
similar to those used in these samples [46]. During heating, these unreacted crystalline
components may also foam, causing expansion at temperatures which are inconsistent with

MA
NU
SC
RIP
T
AC
CE
PTE
D
ACCEPTED MANUSCRIPT
25
expansion peak temperatures typically correlated to strength-giving gels. Conversely, K-
activation creates a more homogeneous gel (i.e., no discrete silicate crystals), and the primary
high-silica gel expansion peak is more clearly defined. Consequently, the correlation of these
peaks with strength is better for K than for Na. Regardless, these results confirm that this
technique can potentially be used as a quick screening tool to assess the viability of ashes for
alkali-activation, whether co-fired or derived from pure coal combustion.
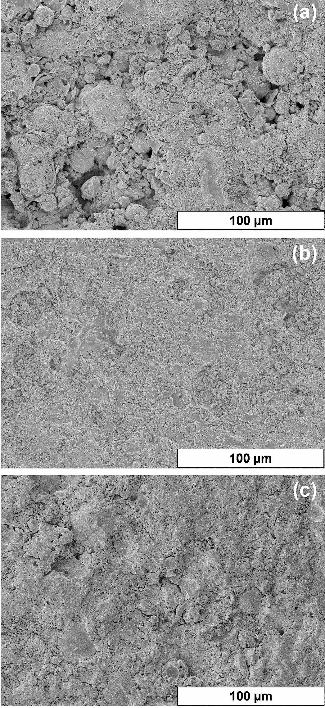
3.6. Geopolymer Gel Microstructure
SEM images of the three raw ashes used in this study are shown in Figure 10. A-FA-0
has mainly spherical particles, which is the characteristic morphology of the largely glassy
fraction of coal fly ash. Biomass ash produced from pure wood combustion has a significantly
different morphology compared to coal fly ash; it is mostly composed of fibrous particles with
intact cell wall structures and high aspect ratios in addition to agglomerated fused woody
particles [13]. In the B-CA-4 co-fired fly ash, an elongated particle can be seen intermixed with
spherical particles that are more typically observed in coal fly ash. This elongated particle has a
similar morphology to biomass ash and could be a result of co-firing, although unburned carbon
particles in coal fly ash can also be elongated [14]. In the C-CA-15 co-fired ash, both elongated
particles and amorphous unburned carbon particles were observed in addition to spherical
particles.
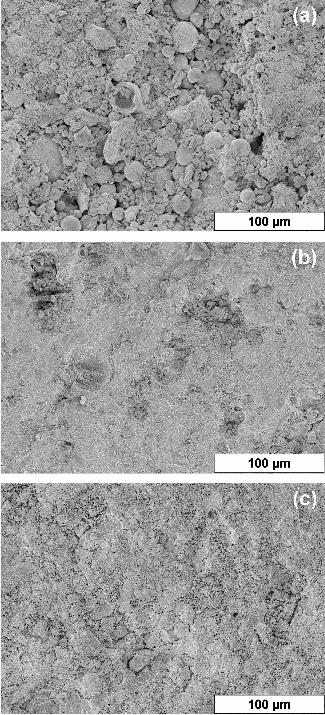
SEM images of Na-activated B-CA-4 pastes are shown in Figure 11. When activated with
Na-0-10, the paste had a porous microstructure that contained a large amount of unreacted or
partially-reacted particles (mostly spherical) embedded in the gel. Elongated particles were not
detected in the geopolymer gels imaged in this study, most likely because these particles are
scarce and thus not visible on these fractured surfaces. Regardless, B-CA-4 is predominantly

MA
NU
SC
RIP
T
AC
CE
PTE
D
ACCEPTED MANUSCRIPT
26
composed of amorphous aluminosilicates and Fe-rich particles, as evidenced by XRF and XRD.
The glassy phases of B-CA-4 reacted with Na-0-10 to form a visually heterogeneous gel.
Compared to Na-0-10 activation of this co-fired fly ash, Na-1-10 formed a more visually
homogenous gel structure with a denser, less porous matrix and fewer unreacted or partially-
reacted particles. Na-2-10 activation also produced a more homogeneous gel compared to Na-0-
10, but more unreacted particles remained embedded in the matrix compared to Na-1-10.
Silicate-activated coal fly ash geopolymers have also been shown to have a more homogeneous
microstructures compared to hydroxide-activated geopolymers as a result of the different
reaction mechanisms that occur during the gelation process when comparing the two types of
activators [47].
SEM images of K-activated B-CA-4 pastes are shown in Figure 12. The microstructures of
the K-1-10 and K-2-10 gels were similar to Na-1-10 and Na-2-10, respectively, on the same
length-scale. That is, K-1-10 had a mostly uniform microstructure whereas the microstructure of
K-2-10 was less homogeneous. K-0-10 activation formed much less gel product compared to
both Ms =1 and 2 activation, resulting in a more porous binder with a greater amount of
unreacted particles even compared to Na-0-10. The trends observed at these scales between
silicate and hydroxide activation were also evident at much lower magnifications (i.e., Ms = 1
and 2 activation formed denser binders than Ms = 0). Comparison of the observed
microstructures for the co-fired fly ash binders with the strength results presented in section 3.1
(where the strengths were ranked Na-1-10 > K-1-10 > Na-2-10 > K-2-10 > Na-0-10 > K-0-10)
indicates that more homogeneous and reacted gels had higher compressive strengths. The
microstructures are also consistent with FTIR results, which showed that silicate-activated
binders had a higher degree of polymerization.

MA
NU
SC
RIP
T
AC
CE
PTE
D
ACCEPTED MANUSCRIPT
27
Perspectives 4.
Additional research will be necessary to assess other performance criteria regarding the
use of co-fired fly ash as a precursor material. Different types of biomass with additional coal
replacement rates than those used in this study will also need to be tested. As a result, these ashes
may contain a larger percentage of the secondary fuel ash, and may have different physical or
chemical characteristics such as a reduced reactive aluminosilicate content or increased alkali
levels. These changes may in turn alter the gel properties in a more discernible way, especially if
there is a greater unreactive portion in the co-fired fly ash derived from the biomass combustion.
Beneficiation strategies to increase the reactivity of these ashes may be necessary to improve
their geopolymerization potential. Still, as demonstrated by this study, certain compositional
issues (e.g., high carbon, less vitreous content) can be overcome by tailoring the mix design with
particular focus on the activating solutions. Ultimately, the method for developing an optimum
mix design will be similar for co-fired fly ash sources as it is currently for coal fly ash sources,
and will require characterization and testing to determine the impact of the ash composition on
desired binder properties.
Conclusions 5.
Co-fired fly ashes derived from coal and wood co-combustion were successfully used as
precursors for geopolymerization. The coal and co-fired fly ashes used in this study were
primarily composed of a vitreous phase intermixed with a small amount of crystalline phases
including quartz, mullite and iron oxides. Both co-fired fly ashes had lower aluminosilicate
amorphous contents and higher unburned carbon contents compared to the coal fly ash, which
was primarily a result of differing combustion processing variables and parent coals, and likely
MA
NU
SC
RIP
T
AC
CE
PTE
D
ACCEPTED MANUSCRIPT
28
not a direct consequence of the use of the secondary biomass fuel. These factors limited the
compositional envelope within which these co-fired fly ashes could be alkali-activated to form a
hardened gel. Strengths were generally highest for all ashes when using activating solutions with
added silica especially with a molar ratio of Ms = 1. For the B-CA-4 co-fired fly ash, an increase
in the molar concentration of the activator content improved strengths, especially for Na-
activation at higher moduli of solution.
Infrared spectra revealed incorporation of Al and/or substitution of the alkali metal into
the gel network after activation of all three ashes. Co-firing appeared to increase the phosphate
content of the ash, but this had no discernible impact on gel formation. The shrinkage and
expansion features of co-fired fly ash geopolymers upon heating were similar to those observed
for the coal fly ash geopolymers. The thermal behavior of these samples was strongly influenced
by the free water and gel pore structure, which was primarily controlled by the modulus of
solution, the cation type, activation concentration and the ash composition (including the carbon
content). The activator type also impacted the microstructure of the co-fired fly ash geopolymers,
with Ms = 1 solutions forming the most homogeneous and densely polymerized gels. These
results indicate that co-fired fly ashes can be viably used to form alkali-activated geopolymers,
which is a new beneficial end-use for these emerging waste materials.
Acknowledgments
This research is supported in part by the Department of Energy Office of Science
Graduate Fellowship Program (DOE SCGF), made possible in part by the American Recovery
and Reinvestment Act of 2009, administered by ORISE-ORAU under contract no. DE-AC05-
06OR23100. NSF Award Number: 1107736 and the Australian Academy of Science. The

MA
NU
SC
RIP
T
AC
CE
PTE
D
ACCEPTED MANUSCRIPT
29
participation of JLP and SAB in this work was also supported in part by NERC Catalyst Grant
NE/K015680/1. We would like to thank Dr. Nortey Yeboah for providing the SEM image of the
A-FA-0 fly ash. We would also like to thank Thomas Dugan, Dr. Laura Gordon, Dr. Nortey
Yeboah, Mitchell Napolitano, Daniella Remolina, Pichet Sahachaiyunta and Suhandy Winata for
their help with this research.
References
[1] Hughes E. Biomass cofiring: economics, policy and opportunities. Biomass Bioenergy
2000;19(6):457-465.
[2] Annual energy outlook 2015. U.S. Energy Information Administration; 2015.
[3] ASTM C618-12a. Standard specification for coal fly ash and raw or calcined natural
pozzolan for use in concrete. ASTM International. West Conshohocken; 2012.
[4] EN 450-1:2012. Fly ash for concrete - Part 1: Definition, specifications and conformity
criteria. European Committee for Standardization; 2012.
[5] Shearer CR. The productive reuse of coal, biomass and co-fired fly ash. PhD thesis. Atlanta,
Georgia Institute of Technology, 2014.
[6] Provis JL, Van Deventer JSJ (Eds.). Alkali activated materials: State-of-the-art report,
RILEM TC 224-AAM: Springer/RILEM, Dordrecht; 2014.
[7] Dockter BA, Eylands KE. Development of management options for biomass combustion by-
products. In: Proceedings of the International Ash Utilization Symposium, Lexington, KY;
2003.
[8] Nugteren HW, Butselaar-Orthleib VCL, Izquierdo M. High strength geoolymers produced
from coal combustion fly ash. Global NEST J 2009;11(2):155-161.

MA
NU
SC
RIP
T
AC
CE
PTE
D
ACCEPTED MANUSCRIPT
30
[9] Rajamma R, Labrincha JA, Ferreira VM. Alkali activation of biomass fly ash-metakaolin
blends. Fuel 2012;98:265-271.
[10] CEN/TR 16443:2013. Backgrounds to the revision of EN 450-1:2005+A1:2007. Fly ash for
Concrete. European Committee for Standardization; 2013.
[11] Vassilev SV, Baxter D, Andersen LK, Vassileva CG. An overview of the chemical
composition of biomass. Fuel 2010;89(5):913-933.
[12] Rietveld H. A profile refinement method for nuclear and magnetic structures. J Appl
Crystallogr 1969;2(2):65-71.
[13] Yeboah NNN, Shearer CR, Burns SE, Kurtis KE. Characterization of biomass and high
carbon content coal ash for productive reuse applications. Fuel 2014;116:438-447.
[14] Shearer CR, Kurtis KE. Use of biomass and co-fired fly ash in concrete. ACI Mater J
2015;112(2):209-218.
[15] Saraber AJ. Background to the requirements: Report for discussion for evaluation of the EN
450. Arnhem: KEMA, 2006.
[16] Keyte LM. Fly ash glass chemistry and inorganic polymer cements. In: Provis JL, van
Deventer JSJ, editors. Geopolymers: Structure, processing, properties and industrial
applications. Cambridge: Woodhead, 2009. p. 15-36.
[17] Chiang H-L, Huang C, Chiang P. The surface characteristics of activated carbon as affected
by ozone and alkaline treatment. Chemosphere 2002;47(3):257-265.
[18] Duxson P, Provis JL. Designing precursors for geopolymer cements. J Am Ceram Soc
2008;91(12):3864-3869.
[19] Lee WKW, van Deventer JSJ. Use of infrared spectroscopy to study geopolymerization of
heterogeneous amorphous aluminosilicates. Langmuir 2003;19(21):8726-8734.

MA
NU
SC
RIP
T
AC
CE
PTE
D
ACCEPTED MANUSCRIPT
31
[20] Rodriguez ED, Bernal SA, Provis JL, Paya J, Monzo JM, Borrachero MV. Effect of
nanosilica-based activators on the performance of an alkali-activated fly ash binder. Cem
Concr Compos 2013;35(1):1-11.
[21] Duxson P, Provis JL, Lukey GC, van Deventer JSJ. The role of inorganic polymer
technology in the development of 'green concrete'. Cem Concr Res 2007;37(12):1590-1597.
[22] Gadsden JA. Infrared spectra of minerals and related inorganic compounds. London:
Butterworths, 1975.
[23] Rahier H, Simons W, van Mele B, Biesemans M. Low-temperature synthesized
aluminosilicate glasses: Part 3. Influence of the composition of the silicate solution on
production, structure and properties. J Mater Sci 1997;32(9):2237-2247.
[24] Rees CA, Provis JL, Lukey GC, van Deventer JSJ. In situ ATR-FTIR study of the early
stages of fly ash geopolymer gel formation. Langmuir 2007;23(17):9076-9082.
[25] Lee WKW, van Deventer JSJ. Structural reorganisation of class F fly ash in alkaline silicate
solutions. Colloids Surf A. 2002;211(1):49-66.
[26] Provis JL, Duxson P, Lukey GC, Separovic F, Kriven WM, van Deventer JSJ. Modeling
speciation in highly concentrated alkaline silicate solutions. Ind Eng Chem Res
2005;44(23):8899-8908.
[27] Criado M, Fernández-Jiménez A, Palomo A. Alkali activation of fly ash: Effect of the
SiO2/Na2O ratio Part I: FTIR study. Microporous Mesoporous Mater 2007;106(1-3):180-
191.
[28] McCormick AV, Bell AT. The solution chemistry of zeolite precursors. Catal Rev Sci Eng.
1989;31(1-2):97-127.
[29] Vogel W. Structure and crystallization of glasses. New York: Pergomon Press, 1971.
MA
NU
SC
RIP
T
AC
CE
PTE
D
ACCEPTED MANUSCRIPT
32
[30] Vassilev SV, Baxter D, Vassileva CG. An overview of the behaviour of biomass during
combustion: Part I. Phase-mineral transformations of organic and inorganic matter. Fuel
2013;112:391-449.
[31] Provis JL, Bernal SA. Geopolymers and related alkali-activated materials. Annu Rev Mater
Res 2014;44(1):299-327.
[32] Provis JL, Rose V, Bernal SA, van Deventer JSJ. High-resolution nanoprobe X-ray
fluorescence characterization of heterogeneous calcium and heavy metal distributions in
alkali-activated fly ash. Langmuir 2009;25(19):11897-11904.
[33] Misra MK, Ragland KW, Baker AJ. Wood ash composition as a function of furnace
temperature. Biomass Bioenergy 1993;4(2):103-116.
[34] Gao YM, Kulaots G, Chen X, Suuberg EM, Hurt RH, Veranth JM. The effect of solid fuel
type and combustion conditions on residual carbon properties and fly ash quality. Proc
Combus Inst 2002;29:475-483.
[35] Duxson P, Lukey GC, van Deventer JSJ. Physical evolution of Na-geopolymer derived
from metakaolin up to 1000 °C. J Mater Sci 2007;42(9):3044-3054.
[36] Paya J, Monzo J, Borrachero MV, Amahjour F, Peris-Mora E. Loss on ignition and carbon
content in pulverized fuel ashes (PFA): Two crucial parameters for quality control. J Chem
Technol Biotechnol 2002;77(3):251-255.
[37] Provis JL, Yong CZ, Duxson P, van Deventer JSJ. Correlating mechanical and thermal
properties of sodium silicate-fly ash geopolymers. Colloids Surf A 2009;336(1-3):57-63.
[38] Rickard WDA, van Riessen A, Walls P. Thermal character of geopolymers synthesized
from Class F fly ash containing high concentrations of iron and α-quartz. Int J Appl Ceram
Technol 2010;7(1):81-88.
MA
NU
SC
RIP
T
AC
CE
PTE
D
ACCEPTED MANUSCRIPT
33
[39] Provis JL, Harrex RM, Bernal SA, Duxson P, van Deventer JSJ. Dilatometry of
geopolymers as a means of selecting desirable fly ash sources. J Non-Cryst Solids
2012;358(16):1930-1937.
[40] Rickard WDA, Temuujin J, van Riessen A. Thermal analysis of geopolymer pastes
synthesised from five fly ashes of variable composition. J Non-Cryst Solids
2012;358(15):1830-1839.
[41] Rahier H, van Mele B, Wastiels J. Low-temperature synthesized aluminosilicate glasses:
Part 2. Rheological transformations during low-temperature cure and high-temperature
properties of a model compound. J Mater Sci 1996;31(1):80-85.
[42] Duxson P, Lukey GC, Separovic F, van Deventer JSJ. Effect of alkali cations on aluminum
incorporation in geopolymeric gels. Ind Eng Chem Res 2005;44(4):832-839.
[43] Duxson P, Lukey GC, van Deventer JSJ. The thermal evolution of metakaolin geopolymers:
Part 2. Phase stability and structural development. J Non-Cryst Solids 2007;353(22-
23):2186-2200.
[44] Duxson P, Lukey GC, van Deventer JSJ. Evolution of gel structure during thermal
processing of Na-geopolymer gels. Langmuir 2006;22(21):8750-8757.
[45] Lubansky AS, Yeow YL, Leong YK, Wickramasinghe SR, Han BB. A general method of
computing the derivative of experimental data. AIChE J 2006;52(1):323-332.
[46] Provis JL, Kilcullen A, Duxson P, Brice DG, van Deventer JSJ. Stabilization of low-
modulus sodium silicate solutions by alkali substitution. Ind Eng Chem Res
2012;51(5):2483-2486.
[47] Lloyd RR, Provis JL, van Deventer JSJ. Microscopy and microanalysis of inorganic
polymer cements. 2: The gel binder. J Mater Sci 2009;44(2):620-631.
MA
NU
SC
RIP
T
AC
CE
PTE
D
ACCEPTED MANUSCRIPT
34
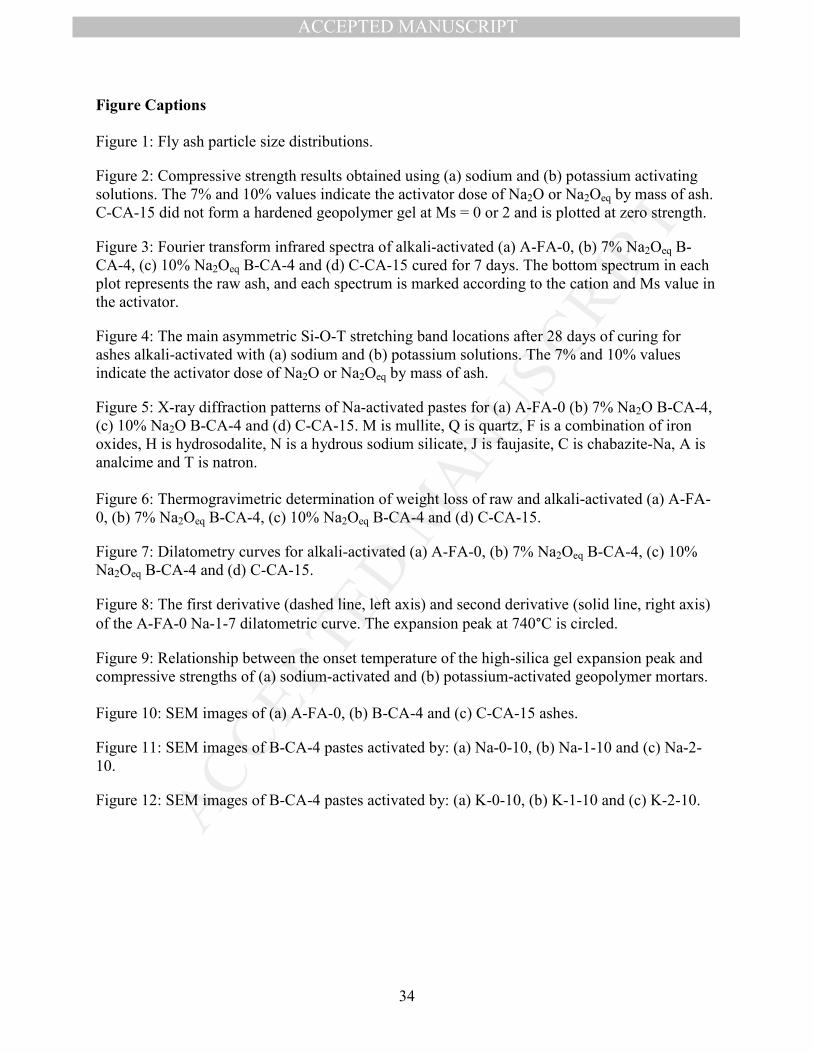
Figure Captions
Figure 1: Fly ash particle size distributions.
Figure 2: Compressive strength results obtained using (a) sodium and (b) potassium activating solutions. The 7% and 10% values indicate the activator dose of Na2O or Na2Oeq by mass of ash. C-CA-15 did not form a hardened geopolymer gel at Ms = 0 or 2 and is plotted at zero strength.
Figure 3: Fourier transform infrared spectra of alkali-activated (a) A-FA-0, (b) 7% Na2Oeq B-CA-4, (c) 10% Na2Oeq B-CA-4 and (d) C-CA-15 cured for 7 days. The bottom spectrum in each plot represents the raw ash, and each spectrum is marked according to the cation and Ms value in the activator.
Figure 4: The main asymmetric Si-O-T stretching band locations after 28 days of curing for ashes alkali-activated with (a) sodium and (b) potassium solutions. The 7% and 10% values indicate the activator dose of Na2O or Na2Oeq by mass of ash.
Figure 5: X-ray diffraction patterns of Na-activated pastes for (a) A-FA-0 (b) 7% Na2O B-CA-4, (c) 10% Na2O B-CA-4 and (d) C-CA-15. M is mullite, Q is quartz, F is a combination of iron oxides, H is hydrosodalite, N is a hydrous sodium silicate, J is faujasite, C is chabazite-Na, A is analcime and T is natron. Figure 6: Thermogravimetric determination of weight loss of raw and alkali-activated (a) A-FA-0, (b) 7% Na2Oeq B-CA-4, (c) 10% Na2Oeq B-CA-4 and (d) C-CA-15.
Figure 7: Dilatometry curves for alkali-activated (a) A-FA-0, (b) 7% Na2Oeq B-CA-4, (c) 10% Na2Oeq B-CA-4 and (d) C-CA-15.
Figure 8: The first derivative (dashed line, left axis) and second derivative (solid line, right axis) of the A-FA-0 Na-1-7 dilatometric curve. The expansion peak at 740°C is circled.
Figure 9: Relationship between the onset temperature of the high-silica gel expansion peak and compressive strengths of (a) sodium-activated and (b) potassium-activated geopolymer mortars. Figure 10: SEM images of (a) A-FA-0, (b) B-CA-4 and (c) C-CA-15 ashes.
Figure 11: SEM images of B-CA-4 pastes activated by: (a) Na-0-10, (b) Na-1-10 and (c) Na-2-10.
Figure 12: SEM images of B-CA-4 pastes activated by: (a) K-0-10, (b) K-1-10 and (c) K-2-10.

MA
NU
S
EP
TE
D

MA
NU
SC
RIP
AC
CE
PTE
D

MA
NU
SC
R
CE
PTE
D

MA
NU
SC
RIP
AC
CE
PTE
D
MA
NU
SC
RIP
AC
CE
PTE
D

MA
NU
SC
R
CE
PTE
D

MA
NU
SC
R
CE
PTE
D
MA
NU
S
EP
TE
D
MA
NU
SC
RIP
AC
CE
PTE
D

MA
NU
SC
RIP
AC
CE
PTE
D
MA
NU
SC
RIP
AC
CE
PTE
D
MA
NU
SC
RIP
AC
CE
PTE
D