all indstrial activites dragged down by personal services after the tax increase
Post on 26-Jul-2015
265 views
TRANSCRIPT

All industrial activities dragged down by personal services after the tax increase
Released on November 27, 2014Economic Analysis Office
URL of the Analysis of All Industrial Activities :(ENGLISH) http://www.meti.go.jp/english/statistics/bunseki/index.html(JAPANESE) http://www.meti.go.jp/statistics/toppage/report/bunseki/index.html
-1.5 -2.94
-2.3
-3.1
-3.8
-5
-4
-3
-2
-1
0
1
2
3
└I II2008
III IV┘ └I II2009
III IV┘ └I II2010
III IV┘ └I II2011
III IV┘ └I II2012
III IV┘ └I II2013
III IV┘ └I II2014
(%, % points)
Broad-ranging business servicesBroad-ranging personal servicesTertiary industry activity(overall)

Analysis Objectives of This ReportAfter consumption tax rate was increased to 8% from 5% in
April in 2014, Japan’s overall industrial activities floundered. In this analysis, we will confirm the trends of the “Service
Industry” whose downturn was outstanding during the second quarter of 2014 after the tax increase, by comparing the first quarter of 2009, which was the bottom after the Lehman crisis.
Also, we will additionally consider how changes in price after the tax increase affected the “Service Industry”.
1
(Note)“Business services” and “personal services” used in this report are the words replaced in simpler terms from “broad-ranging business services” and “ broad-ranging personal services”, and they do not designate the same “business services” and “personal services” of released components in the Indices of Tertiary Industry Activity.

Changes in the indices of all industrial activities (Compared to the previous quarter, contribution ratio to growth rate) - Before and after the tax increase - The indices of all industrial activities decreased by 3.4% from the previous quarter after the tax
increase (the second quarter of 2014). Looking at the components of the decrease, the contribution of the indices of tertiary industry
activity to the change from the previous quarter was -2.51% points, accounting for approximately 70% of the decrease in the indices of all industrial activities.
2
(Note) Since the indices of Agriculture, Forestry & Fisheries Production contain no data corresponding to the Indices of All Industrial Activities (for quarters), these figures in the above graph were calculated without them.
Source: Created based on “METI: Indices of All Industrial Activities”
(2005=100, seasonally adjusted)
-0.69
-2.51
-3.4
III2013
IV┘
I└
II2014
-4
-3
-2
-1
0
1
2
(%, % points)
Indices of Government Services, etc.
Indices of Tertiary Industry Activity
Indices of Industrial Production
Indices of Construction Industry Activity
Indices of All Industrial Activities

Changes in the indices of all industrial activities (Compared to the previous quarter, contribution ratio to growth rate) - After the Lehman crisis - Meanwhile, the indices of all industrial activities decreased by 6.3% from the previous quarter after the Lehman crisis (the
first quarter of 2009). Looking at the components, industrial production made a contribution of -3.52% points to the change from the previous
quarter, and tertiary industry activity made a contribution of -2.03% points. The largest contribution to the decrease was observed in industrial production, while the contribution of tertiary industry activity to the decrease remained approximately 30% of the total.
After the tax increase (the second quarter of 2014), all industrial activities did not decrease as much as in the aftermath of the Lehman crisis, but we can see the negative impact by tertiary industry activity was relatively large compared to the overall decrease.
3
(Note) Since the indices of Agriculture, Forestry & Fisheries Production contain no data corresponding to the Indices of All Industrial Activities (for quarters), these figures in the above graph were calculated without them.
Source: Created based on “METI: Indices of All Industrial Activities”
(2005=100, seasonally adjusted)
-3.52
-2.03
-6.3
III2008
IV┘
I└
II2009
-8
-7
-6
-5
-4
-3
-2
-1
0
1
2(%, % points)
Indices of Government Service, etc.
Indices of Tertiary Industry Activity
Indices of Industrial Production
Indices of Construction Industry Activity
Indices of All Industry Activities
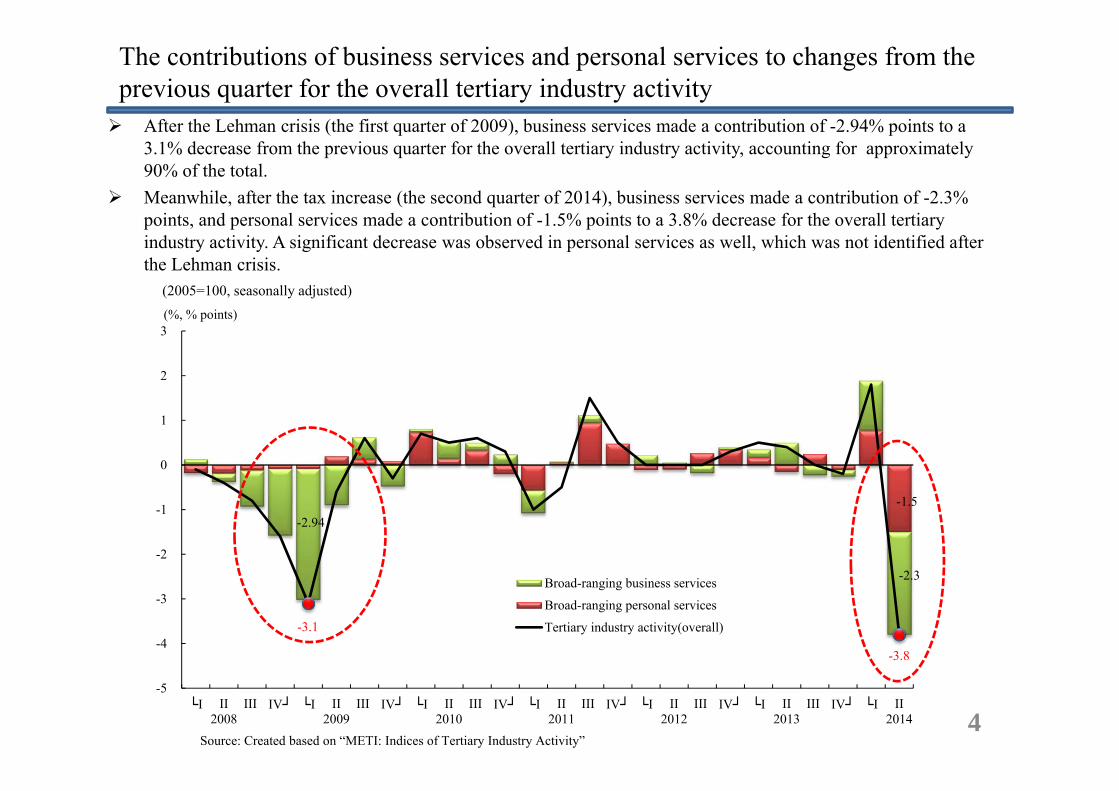
The contributions of business services and personal services to changes from the previous quarter for the overall tertiary industry activity After the Lehman crisis (the first quarter of 2009), business services made a contribution of -2.94% points to a
3.1% decrease from the previous quarter for the overall tertiary industry activity, accounting for approximately 90% of the total.
Meanwhile, after the tax increase (the second quarter of 2014), business services made a contribution of -2.3% points, and personal services made a contribution of -1.5% points to a 3.8% decrease for the overall tertiary industry activity. A significant decrease was observed in personal services as well, which was not identified after the Lehman crisis.
4
(2005=100, seasonally adjusted)
Source: Created based on “METI: Indices of Tertiary Industry Activity”
-1.5 -2.94
-2.3
-3.1
-3.8
-5
-4
-3
-2
-1
0
1
2
3
└I II2008
III IV┘ └I II2009
III IV┘ └I II2010
III IV┘ └I II2011
III IV┘ └I II2012
III IV┘ └I II2013
III IV┘ └I II2014
(%, % points)
Broad-ranging business services
Broad-ranging personal services
Tertiary industry activity(overall)

Factorial analysis on contributions of broad-ranging personal services(Contribution to % change from the previous quarter) After the Lehman crisis (the first quarter of 2009), a decrease was observed in “Accommodations, Eating and Drinking Services”,
while the overall personal services decreased by 0.2% from the previous quarter, remaining in the proximity of zero. Meanwhile, the overall personal services substantially decreased by 3.4% after the tax increase (the second quarter of 2014). Looking
at the details of the decrease, “Retail Trade” made a contribution of -2.12% points, accounting for approximately 60% of the total decrease and largely depressing the total.
5(Note) The components of the above graph were seasonally adjusted by direct adjustment after creating the original indices by
accumulating final components of each industry sector “for individual customers”. Therefore, the total accumulated figures of the components may not match the overall figures.
Source: Created based on “METI: Indices of Tertiary Industry Activity” (estimates)
(2005=100, seasonally adjusted)
-2.12 -0.2
-3.4
-6
-5
-4
-3
-2
-1
0
1
2
3
└I II2008
III IV┘ └I II2009
III IV┘ └I II2010
III IV┘ └I II2011
III IV┘ └I II2012
III IV┘ └I II2013
III IV┘ └I II2014
(%, % points)
Retail TradeMiscellaneous Services (Except Government Services, etc.)Compound ServicesMedical, Health Care & WelfareLearning SupportLiving-Related and Personal Services & Amusement ServicesAccommodations, Eating and Drinking ServicesReal Estate & Goods Rental and LeasingFinance & InsuranceTransport & Postal ActivitiesInformation & CommunicationsElectricity, Gas, Heat Supply & WaterBroad-ranging personal services

Changes in the indices of “Broad-ranging personal services” and “Services except Retail Trade”
However, when looking at changes in the indices excluding “Retail Trade”, the indices also decreased by 1.0% from the previous quarter after the tax increase (the second quarter of 2014).
We can see the tax increase affected not only “goods”, but also “services” on which we cannot stock up.
6
Source: Created based on “METI: Indices of Tertiary Industry Activity”
(2005=100, seasonally adjusted)
R² = 0.9168
R² = 0.9387
90
92
94
96
98
100
102
104
106
108
└I II2008
III IV┘ └I II2009
III IV┘ └I II2010
III IV┘ └I II2011
III IV┘ └I II2012
III IV┘ └I II2013
III IV┘ └I II2014
Broad-ranging personal services
Services except Retail Trade
Polynomial (Broad-ranging personalservices)
Polynomial (Services except Retail Trade)

Changes in the indices of “Broad-ranging personal services” and “Services except Retail Trade” When drawing an approximate line of polynomial of degree six averaging the indices trends of “Broad-
ranging personal services” and “ Services except Retail Trade” (Broad-ranging personal services: R2=0.9168, Services except Retail Trade: R2=0.9387)(Note), the lines gradually curve downward from 2014 after peaking in the second half of 2013.
The rise before the tax increase (the first quarter of 2014) and the drop after the tax increase (the second quarter of 2014) had as great an impact as the curve shown by the approximate lines.
7
(Note) 1. An approximate line of polynomial is a regression line which tries explaining the trend variation (trends) of given data. Polynomial of higher degree assumedly raise the interpretability of the approximate line by capturing more given data for the line (R2 designated in the following sentence tends to close to 1.)
2. R2 represents the coefficient which measures the degree of interpretability which the regression-estimated values (the approximate line) have, without deviating from the original data, showing 0 ≤ R2 ≤ 1. When the values with higher interpretability, the figure of R2 is closer to 1.
Source: Created based on “METI: Indices of Tertiary Industry Activity”
(2005=100, seasonally adjusted)
R² = 0.9168
R² = 0.9387
90
92
94
96
98
100
102
104
106
108
└I II2008
III IV┘ └I II2009
III IV┘ └I II2010
III IV┘ └I II2011
III IV┘ └I II2012
III IV┘ └I II2013
III IV┘ └I II2014
Broad-ranging personal services
Services except Retail Trade
Polynomial (Broad-ranging personalservices)Polynomial (Services except Retail Trade)

Factorial analysis of “Broad-ranging personal services (except Retail Trade)” (Contribution to % change from the previous quarter) When looking closely at the trends of “Services except Retail Trade”, the indices decreased by 0.5%
from the previous quarter after the Lehman crisis (the first quarter of 2009), and decreased by 1.0% from the previous quarter after the tax increase (the second quarter of 2014). The width of decrease expanded more than that after the Lehman crisis.
8
(2005=100, seasonally adjusted)
(Note) The components of the above graph were seasonally adjusted by direct adjustment after creating the original indices by accumulating final components of each industry sector “for individual customers”. Therefore, the total accumulated figures of the components may not match the overall figures.
Source: Created based on “METI: Indices of Tertiary Industry Activity” (estimates)
-0.5 -1.0
-6
-5
-4
-3
-2
-1
0
1
2
3
└I II2008
III IV┘ └I II2009
III IV┘ └I II2010
III IV┘ └I II2011
III IV┘ └I II2012
III IV┘ └I II2013
III IV┘ └I II2014
(%, % points)
Miscellaneous Services (Except Government Services, etc.) Compound Services
Medical, Health Care & Welfare Learning Support
Living-Related and Personal Services & Amusement Services Accommodations, Eating and Drinking Services
Real Estate & Goods Rental and Leasing Finance & Insurance
Transport & Postal Activities Information & Communications
Electricity, Gas, Heat Supply & Water Broad-ranging personal services (Except Retail Trade)

Comparison of contributions of broad-ranging personal services (except Retail Trade) “After the Lehman crisis (the first quarter of 2009)” and “After the tax increase (the second quarter of 2014)” (Contribution to % change from the previous quarter) After the Lehman crisis (the first quarter of 2009), “Accommodation, Eating and Drinking Services” made a
contribution of -0.34% points to the change from the previous quarter, accounting for nearly 70% of the decrease of the overall “Services except Retail Trade”.
Meanwhile, after the tax increase (the second quarter of 2014), decreases in contributions to the change from the previous quarter were observed in various industry sectors, including “Living-Related and Personal Services & Amusement Services” (-0.34% points), and “Transport & Postal Activities” (-0.21% points).
9
(2005=100, seasonally adjusted)(%, % point)
(Note) The components of the above graph were seasonally adjusted by direct adjustment after creating the original indices by accumulating final components of each industry sector “for individual customers”. Therefore, the total accumulated figures of the components may not match the overall figures.
Source: Created based on “METI: Indices of Tertiary Industry Activity” (estimates)
-0.34
-0.21
-0.28 -0.16
-0.34 -0.5
-1.0
-1.5
-1.0
-0.5
0.0
0.5
The First Quarter of 2009[After the Lehman crisis]
The Second Quarter of 2014[After the tax increase]
Living-Related & Personal Services& Amusement ServicesMiscellaneous Services (ExceptGovernment Services, etc.)Transport & Postal Activities
Electricity, Gas, Heat Supply &WaterReal Estate & Goods Rental andLeasingInformation & Communications
Learning Support
Accommodations, Eating andDrinking ServicesCompound Services
Finance & Insurance
Medical, Health Care & Welfare
Broad-ranging Personal Services(Except Retail Trade)

Factorial analysis on contributions of broad-ranging business services(Contribution to % change from the previous quarter) The indices decreased by 5.0% from the previous quarter after the Lehman crisis (the first quarter of 2009). Looking at
the components, a significant decrease was observed in “Wholesale Trade” whose contribution to the change from the previous quarter was -3.67 % points, accounting for approximately 70% of the overall business services.
Meanwhile, the indices decreased by 4.2% from the previous quarter after the tax increase (the second quarter of 2014). Decrease remained less than that after the Lehman crisis. Looking at the components, as was expected, “Wholesale Trade” made a contribution of -2.2% points, which accounts for approximately 50% of the overall business services, largely depressing the total.
10(Note) The components of the above graph were seasonally adjusted by direct adjustment after creating the original indices by
accumulating final components of each industry sector “for businesses”. Therefore, the total accumulated figures of the components may not match the overall figures.
Source: Created based on “METI: Indices of Tertiary Industry Activity” (estimates)
(2005=100, seasonally adjusted)
-3.67 -2.2
-5.0
-4.2
-6
-5
-4
-3
-2
-1
0
1
2
3
└I II2008
III IV┘ └I II2009
III IV┘ └I II2010
III IV┘ └I II2011
III IV┘ └I II2012
III IV┘ └I II2013
III IV┘ └I II2014
(%, % points)
Wholesale TradeMiscellaneous Services (Except Government Services, etc.)Compound ServicesLiving-Related and Personal Services & Amusement ServicesAccommodations, Eating and Drinking ServicesScientific Research, Professional and Technical ServicesReal Estate & Goods Rental and LeasingFinance & InsuranceTransport & Postal ActivitiesInformation & CommunicationsElectricity, Gas, Heat Supply & Water

Changes in the indices of “Broad-ranging business services” and “Services except Wholesale Trade” When looking at the changes in the indices of “Broad-ranging business services”
excluding “Wholesale Trade”, the indices decreased by 1.7% after the tax increase (the second quarter of 2014).
Also in business services, we can see the tax increase affected not only “goods”, but also “services”.
11Source: Created based on “METI: Indices of Tertiary Industry Activity”
(2005=100, seasonally adjusted)

Changes in the indices of “Broad-ranging business services” and “Services except Wholesale Trade” When drawing an approximate line of polynomial of degree six averaging the indices trends of
“Broad-ranging business services” and “ Services except Wholesale Trade” (Broad-ranging business services: R2=0.9373, Services except Wholesale Trade: R2=0.928)(Note), the lines gradually curve downward from 2014 after peaking in the fourth quarter of 2013.
Also in business services, the rise before the tax increase (the first quarter of 2014) and the drop after the tax increase (the second quarter of 2014) had as great an impact as the curve shown by the approximate lines.
12(Note) Refer to the note on page slide 7.Source: Created based on “METI: Indices of Tertiary Industry Activity”
(2005=100, seasonally adjusted)

Factorial analysis on contributions of “Broad-ranging business services (excluding Wholesale Trade)” (Contribution to % change from the previous quarter) When closely looking at the trends of “Services except Wholesale Trade”, the indices decreased by
2.2% from the previous quarter after the Lehman crisis (the first quarter of 2009), while the indices decreased by 1.7% from the previous quarter after the tax increase (the second quarter of 2014). The width of decrease remained smaller than that after the Lehman crisis.
13
(2005=100, seasonally adjusted)
(Note) The components of the above graph were seasonally adjusted by direct adjustment after creating the original indices by accumulating final components of each industry sector “for businesses”. Therefore, the total accumulated figures of the components may not match the overall figures.
Source: Created based on “METI: Indices of Tertiary Industry Activity” (estimates)
-2.2 -1.7
-6
-5
-4
-3
-2
-1
0
1
2
3
└I II2008
III IV┘ └I II2009
III IV┘ └I II2010
III IV┘ └I II2011
III IV┘ └I II2012
III IV┘ └I II2013
III IV┘ └I II2014
(%, % points)
Miscellaneous Services (Except Government Services, etc.) Compound Services
Living-Related and Personal Services & Amusement Services Accommodations, Eating and Drinking Services
Scientific Research, Professional and Technical Services Real Estate & Goods Rental and Leasing
Finance & Insurance Transport & Postal Activities
Information & Communications Electricity, Gas, Heat Supply & Water
Broad-ranging Business Services(Except Wholesale Trade)

Comparison of contributions of broad-ranging business services (except Wholesale Trade) “After the Lehman crisis (the first quarter of 2009)” and “After the tax increase (the second quarter of 2014)” (Contribution to % change from the previous quarter) After the Lehman crisis (the first quarter of 2009), “Transport & Postal Activities” made a contribution of
-0.75% points to the change from the previous quarter, “Electricity, Gas, Heat Supply & Water” made a contribution of -0.41% points, and “Finance & Insurance” made a contribution of -0.36% points. These three industry sectors account for nearly 70% of the decrease of the overall services excluding Wholesale Trade.
14
(2005=100, seasonally adjusted)
(Note) The components of the above graph were seasonally adjusted by direct adjustment after creating the original indices by accumulating final components of each industry sector “for businesses”. Therefore, the total accumulated figures of the components may not match the overall figures.
Source: Created based on “METI: Indices of Tertiary Industry Activity” (estimates)
-0.41
-0.09
-0.06
-0.26
-0.44
-0.30
-0.75
-0.45
-0.36
-0.49
-2.2
-1.7
-2.5
-2.0
-1.5
-1.0
-0.5
0.0
0.5
The First Quarter of 2009[After the Lehman crisis]
The Second Quarter of 2014[After the tax increase]
(%, % points) Finance & Insurance
Transport & Postal Activities
Miscellaneous Services (ExceptGovernment Services, etc.)
Information & Communications
Electricity, Gas, Heat Supply &Water
Real Estate & Goods Rental andLeasing
Living-Related and PersonalServices & Amusement Services
Compound Services
Accommodations, Eating andDrinking Services
Scientific Research, Professionaland Technical Services
Broad-ranging BusinessServices(Except Wholesale Trade)

Comparison of contributions of broad-ranging business services (except Wholesale Trade) “After the Lehman crisis (the first quarter of 2009)” and “After the tax increase (the second quarter of 2014)” (Contribution ratio to % change from the previous quarter) Meanwhile, after the tax increase (the second quarter of 2014), “Finance & Insurance” made a contribution
of -0.49% points to the change from the previous quarter, which contributed to the decrease more than after the Lehman crisis, while the decreases in the other two industry sectors remained smaller, -0.45% points made by “Transport & Postal Activities” and -0.09% points made by “Electricity, Gas, Heat Supply & Water”.
15
(2005=100, seasonally adjusted)
(Note) The components of the above graph were seasonally adjusted by direct adjustment after creating the original indices by accumulating final components of each industry sector “for businesses”. Therefore, the total accumulated figures of the components may not match the overall figures.
Source: Created based on “METI: Indices of Tertiary Industry Activity” (estimates)
-0.41
-0.09
-0.06
-0.26
-0.44
-0.30
-0.75
-0.45
-0.36
-0.49
-2.2
-1.7
-2.5
-2.0
-1.5
-1.0
-0.5
0.0
0.5
The First Quarter of 2009[After the Lehman crisis]
The Second Quarter of 2014[After the tax increase]
(%, % points) Finance & Insurance
Transport & Postal Activities
Miscellaneous Services (ExceptGovernment Services, etc.)
Information & Communications
Electricity, Gas, Heat Supply &Water
Real Estate & Goods Rental andLeasing
Living-Related and PersonalServices & Amusement Services
Compound Services
Accommodations, Eating andDrinking Services
Scientific Research, Professionaland Technical Services
Broad-ranging BusinessServices(Except Wholesale Trade)

The indices of tertiary industry activity in the third quarter of 2014(Provisional values) During the third quarter of 2014, the indices increased slightly, but did not recover enough to
compensate the decrease width of the second quarter of 2014 after the tax increase. However, comparing September with several months after the tax increase, an increase in the
number of the components which showed a positive change from the previous month gives an impression of recovery.
16
Source: Created based on “Indices of Tertiary Industry Activity” (Partly, estimates)
(Seasonally adjusted)
Index(%) changes from
the previousmonth (quarter)
Index(%) changes from
the previousmonth (quarter)
Index(%) changes from
the previousmonth (quarter)
Index(%) changes from
the previousmonth (quarter)
Index
(%) changesfrom the
previous month(quarter)
Index(%) changes from
the previousmonth (quarter)
Q1 101.8 1.8 106.4 1.7 98.4 2.1 112.2 4.4 90.3 1.0 103.2 2.4Q2 97.9 -3.8 102.8 -3.4 94.3 -4.2 101 -10.0 88 -2.5 99.7 -3.4Q3 98.2 0.3 103.4 0.6 94.4 0.1 103.8 2.8 87.7 -0.3 100.5 0.8Jan. 101.5 1.5 106 1.0 98.2 1.9 108.7 1.7 91 1.0 101.1 0.2Feb 100.6 -0.9 104.7 -1.2 97.6 -0.6 108.6 -0.1 88.1 -3.2 100.9 -0.2Mar 103.2 2.6 108.5 3.6 99.3 1.7 119.3 9.9 91.7 4.1 107.7 6.7Apr 97.3 -5.7 102 -6.0 93.7 -5.6 98.1 -17.8 87.7 -4.4 98.6 -8.4May 98.2 0.9 103.3 1.3 94.8 1.2 102.1 4.1 88.6 1.0 100.6 2.0Jun 98.2 0.0 103 -0.3 94.5 -0.3 102.8 0.7 87.5 -1.2 99.8 -0.8Jul 97.9 -0.3 102.7 -0.3 94.4 -0.1 101.8 -1.0 87 -0.6 100.5 0.7
Aug 97.8 -0.1 103.4 0.7 93.9 -0.5 103.5 1.7 88.1 1.3 100.4 -0.1Sep 98.8 1.0 104.2 0.8 94.9 1.1 106.1 2.5 88 -0.1 100.7 0.3
2014
2014
Transport & Postal Activities(for individual)
(2005=100)
Tertiary IndustryBroad-ranging Personal
ServicesBroad-ranging Business
ServicesRetail Trade
Living-Related and PersonalServices & Amusement Services
(for individual)

Decrease in service demand caused by cost-push price increase
17

Correlation between “Broad-ranging personal services” and “Consumer price index”
Comparing the distribution including realizations after the tax increase with the distribution which does not include them, there is a difference in the correlation coefficient, but both of them have an “inverse” correlation between the amount of service activity and consumer price.
In “Personal services”, the amount of service activities decreases when consumer price increases.
18
(Note) 1. The “Consumer price index” used in the above diagram is a weighted index created by extracting items corresponding to the survey scope of “Broad-ranging personal services”.
2. Targeted period of the data is from Jan. 2010 to Sep. 2014. However, Mar. and Apr. in 2011 when the earthquake occurred, Mar. and Apr. in the following year, 2012 when the reaction of the earthquake was received, and Mar. 2014 when the last-minute demand before the tax increase was observed, are excluded as outliers.
Source: Created based on “METI: Indices of Tertiary Industry Activity” (ITA, 2005=100) and “MIC: Consumer Price Index” (CPI, 2010=100).(estimates)
[Including realizations after the tax increase (after Apr. 2014) ]
Correlation coefficient = -0.74
[Not-including realization after the tax increase (after Apr. 2014) ]
Correlation coefficient = -0.35
y = -0.888x + 1.6466R² = 0.5484
-2
-1
0
1
2
3
4
5
-3 -2 -1 0 1 2 3 4
CPI
W
eigh
ted
inde
x of
cor
resp
ondi
ng it
ems
(%) c
hang
e fr
om th
e sa
me
mon
th o
f the
pr
evio
us y
ear
ITA Broad-ranging personal services(%) change from the same month of the previous year
y = -0.2946x + 0.5333R² = 0.1199
-2
-1
0
1
2
3
4
5
-3 -2 -1 0 1 2 3 4
CPI
W
eigh
ted
inde
x of
cor
resp
ondi
ng it
ems
(%) c
hang
e fr
om th
e sa
me
mon
th o
f the
pr
evio
us y
ear
ITA Broad-ranging personal services (%) change from the same month of the previous year
Both of them show a negative correlation

Correlation between “Broad-ranging personal services” and “Consumer price index”
Realizations after the tax increase (after Apr. 2014) exist on the upper left of the scatter diagram (in the circle in red dotted line), but they do not specifically deviate from the distribution of the targeted period of analysis.
A downturn of “Personal services” after the tax increase is a “natural” move occurring in connection with the price increase.
19
[Including realizations after the tax increase (after Apr. in 2014) ]Correlation coefficient = -0.74
y = -0.888x + 1.6466R² = 0.5484
-2
-1
0
1
2
3
4
5
-3 -2 -1 0 1 2 3 4
CPI
Wei
ghte
d in
dex
of c
orre
spon
ding
item
s(%
) cha
nge
from
the
sam
e m
onth
of t
he p
revi
ous
year
ITA Broad-ranging personal services (%) change from the same month of the previous month
Max. distribution
width is 6.2
The distribution width after the tax
increase is
1.1 ~ 3.9
(Note) 1. The “Consumer price index” used in the above diagram is a weighted index created by extracting items corresponding to the survey scope of “Broad-ranging personal services”.
2. Targeted period of the data is from Jan. 2010 to Sep. 2014. However, Mar. and Apr. in 2011 when the earthquake occurred, Mar. and Apr. in the following year, 2012 when the reaction of the earthquake was received, and Mar. 2014 when the last-minute demand before the tax increase was observed, are excluded as outliers.
Source: Created based on “METI: Indices of Tertiary Industry Activity” (ITA, 2005=100) and “MIC: Consumer Price Index” (CPI, 2010=100). (estimates)

Correlation between “Broad-ranging personal services” and “Consumer price index”
However, we can see the realizations significantly shifted to the upper left after the tax increase. As the realizations in the scatter diagram are an intersection point of demand and supply, there is a
possibility that supply functions which are expected to shift to the upper right significantly shifted to the upper left after the tax increase.
20
[Including realizations after the tax increase (after Apr. in 2014) ]Correlation coefficient = -0.74
y = -0.888x + 1.6466R² = 0.5484
-2
-1
0
1
2
3
4
5
-3 -2 -1 0 1 2 3 4
CPI
Wei
ghte
d in
dex
of c
orre
spon
ding
item
s(%
) cha
nge
from
the
sam
e m
onth
of t
he p
revi
ous
year
ITA Broad-ranging personal services(%) change from the same month of the previous year
[Before the tax increase]Set of supply functions
[After the tax increase]Set of supply functions
Demand function
Supply function
(Note) 1. The “Consumer price index” used in the above diagram is a weighted index created by extracting items corresponding to the survey scope of “Broad-ranging personal services”.
2. Targeted period of the data is from Jan. 2010 to Sep. 2014. However, Mar. and Apr. in 2011 when the earthquake occurred, Mar. and Apr. in the following year, 2012 when the reaction of the earthquake was received, and Mar. 2014 when the last-minute demand before the tax increase was observed, are excluded as outliers.
Source: Created based on “METI: Indices of Tertiary Industry Activity” (ITA, 2005=100) and “MIC: Consumer Price Index” (CPI, 2010=100). (estimates)

Correlation between “Broad-ranging personal services” and “Consumer price index”
It is commonly considered that the upper shift of supply functions is caused by an “increase in supply cost”.
In addition to the increase in consumption tax, an increase in supply-side cost caused by weak yen and the increase in wages is considered to significantly raise the distribution of realizations for “Personal services” to the upper left.
21
[ Including realizations after the tax increase (after Apr. in 2014) ]Correlation coefficient = -0.74
y = -0.888x + 1.6466R² = 0.5484
-2
-1
0
1
2
3
4
5
-3 -2 -1 0 1 2 3 4
CPI
Wei
ghte
d in
dex
of c
orre
spon
ding
item
s(%
) cha
nge
from
the
sam
e m
onth
of t
he p
revi
ous
year
ITA Broad-ranging personal services (%) change from the same month of the previous year
[Before the tax increase]Set of supply functions
[After the tax increase]Set of supply functions
(Note) 1. The “Consumer price index” used in the above diagram is a weighted index created by extracting items corresponding to the survey scope of “Broad-ranging personal services”.
2. Targeted period of the data is from Jan. 2010 to Sep. 2014. However, Mar. and Apr. in 2011 when the earthquake occurred, Mar. and Apr. in the following year, 2012 when the reaction of the earthquake was received, and Mar. 2014 when the last-minute demand before the tax increase was observed, are excluded as outliers.
Source: Created based on “METI: Indices of Tertiary Industry Activity” (ITA, 2005=100) and “MIC: Consumer Price Index” (CPI, 2010=100). (estimates)
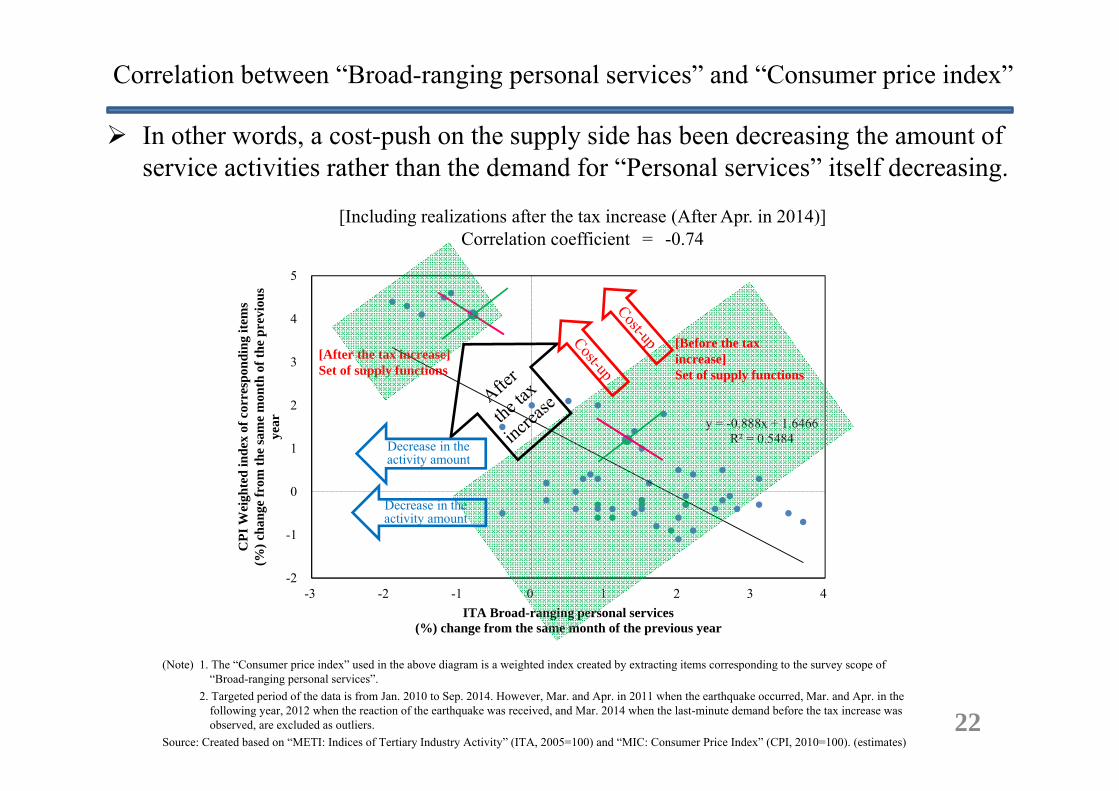
Correlation between “Broad-ranging personal services” and “Consumer price index”
In other words, a cost-push on the supply side has been decreasing the amount of service activities rather than the demand for “Personal services” itself decreasing.
22
[Including realizations after the tax increase (After Apr. in 2014)]Correlation coefficient = -0.74
y = -0.888x + 1.6466R² = 0.5484
-2
-1
0
1
2
3
4
5
-3 -2 -1 0 1 2 3 4
CPI
Wei
ghte
d in
dex
of c
orre
spon
ding
item
s(%
) cha
nge
from
the
sam
e m
onth
of t
he p
revi
ous
year
ITA Broad-ranging personal services (%) change from the same month of the previous year
[Before the tax increase]Set of supply functions
[After the tax increase]Set of supply functions
Decrease in the activity amount
Decrease in the activity amount
(Note) 1. The “Consumer price index” used in the above diagram is a weighted index created by extracting items corresponding to the survey scope of “Broad-ranging personal services”.
2. Targeted period of the data is from Jan. 2010 to Sep. 2014. However, Mar. and Apr. in 2011 when the earthquake occurred, Mar. and Apr. in the following year, 2012 when the reaction of the earthquake was received, and Mar. 2014 when the last-minute demand before the tax increase was observed, are excluded as outliers.
Source: Created based on “METI: Indices of Tertiary Industry Activity” (ITA, 2005=100) and “MIC: Consumer Price Index” (CPI, 2010=100). (estimates)

Correlation between “Broad-ranging personal services” and “Consumer price index”
When comparing (a) the approximate line in the distribution including realizations in the ten months before the tax increase with (b) the approximate line in the distribution including all realizations before the tax increase, (a) the approximate line in the distribution in the ten months before the tax increase is located higher.
Since being “a type of demand function” representing a negative correlation between price and the activity amount, both approximate lines, (a) and (b), indicate a demand increase in the ten months before the tax increase.
23
[Not-including realizations after the tax increase (After Apr. in 2014) ]Comparison with the approximate line in the ten months before the tax increase
y = -0.2946x + 0.5333R² = 0.1199
y = -0.4245x + 1.689R² = 0.1398
-2
-1
0
1
2
3
4
5
-3 -2 -1 0 1 2 3 4
CPI
Wei
ghte
d in
dex
of c
orre
spon
ding
item
s(%
) cha
nge
from
the
sam
e m
onth
of t
he p
revi
ous
year
ITA Broad-ranging personal services (%) change from the same month of the previous year
(a)
(b)
Demand functions shift upward
(Note) 1. The “Consumer price index” used in the above diagram is a weighted index created by extracting items corresponding to the survey scope of “Broad-ranging personal services”.
2. Targeted period of the data is from Jan. 2010 to Sep. 2014. However, Mar. and Apr. in 2011 when the earthquake occurred, Mar. and Apr. in the following year, 2012 when the reaction of the earthquake was received, and Mar. 2014 when the last-minute demand before the tax increase was observed, are excluded as outliers.
Source: Created based on “METI: Indices of Tertiary Industry Activity” (ITA, 2005=100) and “MIC: Consumer Price Index” (CPI, 2010=100). (estimates)

Correlation between “Broad-ranging personal services” and “Consumer price index”
Comparing (d) the approximate line in the distribution including all realizations during the analysis period with (c) the approximate line in the distribution including the realizations after the tax increase and realizations in the ten months before the tax increase, (c) the approximate line in the distribution including realizations after the tax increase and realizations in the ten months before the tax increase is located higher.
In other words, the demand still continues increasing after the tax increase as it did in the ten months before the tax increase.
24
[Including realizations after the tax increase (After Apr. in 2014) ]Comparison with the distribution in the ten months before the tax increase and that after the tax increase
y = -0.888x + 1.6466R² = 0.5484
y = -1.1154x + 2.5149R² = 0.7726
-2
-1
0
1
2
3
4
5
-3 -2 -1 0 1 2 3 4
CPI
Wei
ghte
d in
dex
of c
orre
spon
ding
item
s(%
) cha
nge
from
the
sam
e m
onth
of t
he p
revi
ous
year
ITA Broad-ranging personal services (%) change from the same month of the previous year
Demand functions shift upward
(d)
(c)
(Note) 1. The “Consumer price index” used in the above diagram is a weighted index created by extracting items corresponding to the survey scope of “Broad-ranging personal services”.
2. Targeted period of the data is from Jan. 2010 to Sep. 2014. However, Mar. and Apr. in 2011 when the earthquake occurred, Mar. and Apr. in the following year, 2012 when the reaction of the earthquake was received, and Mar. 2014 when the last-minute demand before the tax increase was observed, are excluded as outliers.
Source: Created based on “METI: Indices of Tertiary Industry Activity” (ITA, 2005=100) and “MIC: Consumer Price Index” (CPI, 2010=100). (estimates)

Correlation between “Broad-ranging personal services” and “Consumer price index”
From the point that demand functions continued shifting upward from the ten months before the tax increase to after the tax increase, “continuity” can be seen before and after the tax increase.
It means that the demand for “personal services” increased from around ten months before the tax increase, and there was no substantial change in consumer sentiment after the tax increase.
25
[Including realizations after the tax increase (After Apr. in 2014) ]
Comparison with the approximate line in the ten months before the tax increase and that after the tax increase
-2
-1
0
1
2
3
4
5
-3 -2 -1 0 1 2 3 4
CPI
Wei
ghte
d in
dex
of c
orre
spon
ding
item
s(%
) cha
nge
from
the
sam
e m
onth
of t
he
prev
ious
yea
r
ITA Broad-ranging personal services(%) change from the same month of the previous year
Demand functions of all realizations in the targeted period of analysis
-2
-1
0
1
2
3
4
5
-3 -2 -1 0 1 2 3 4C
PI W
eigh
ted
inde
x of
cor
resp
ondi
ng it
ems
(%) c
hang
e fr
om th
e sa
me
mon
th o
f the
pr
evio
us y
ear
ITA Broad-ranging personal services(%) change from the same month of the previous year
[Not-including realizations after the tax increase(After Apr. in 2014) ]
Comparison with the approximate line in the ten months before the tax increase
Demand functions in the ten months before the tax increase and those after the tax increase
Demand functions in the ten months before the tax increase
Demand functions of all realizations before the tax increase
(Note) 1. The “Consumer price index” used in the above diagram is a weighted index created by extracting items corresponding to the survey scope of “Broad-ranging personal services”.
2. Targeted period of the data is from Jan. 2010 to Sep. 2014. However, Mar. and Apr. in 2011 when the earthquake occurred, Mar. and Apr. in the following year, 2012 when the reaction of the earthquake was received, and Mar. 2014 when the last-minute demand before the tax increase was observed, are excluded as outliers.
Source: Created based on “METI: Indices of Tertiary Industry Activity” (ITA, 2005=100) and “MIC: Consumer Price Index” (CPI, 2010=100). (estimates)

Correlation between “Broad-ranging personal services” and “Consumer price index”
In “Personal services” after the tax increase, the upper shift of supply functions occurred due to cost-push, and the amount of service activity decreased along with the price increase.
However, after considering that strengthened consumer sentiment and an increase in demand functions were observed in the ten months right before the tax increase, “Personal services” did not decrease more than the upper shift of supply functions.
26
[Including realizations after the tax increase (After Apr. in 2014) ]
-2
-1
0
1
2
3
4
5
-3 -2 -1 0 1 2 3 4
CPI
Wei
ghte
d in
dex
of c
orre
spon
ding
item
s(%
) cha
nge
from
the
sam
e m
onth
of t
he p
revi
ous
year
ITA Broad-ranging personal services(%) change from the same month of the previous year
Upper shift of demand functions
Upper shift of supply functions
(Note) 1. The “Consumer price index” used in the above diagram is a weighted index created by extracting items corresponding to the survey scope of “Broad-ranging personal services”.
2. Targeted period of the data is from Jan. 2010 to Sep. 2014. However, Mar. and Apr. in 2011 when the earthquake occurred, Mar. and Apr. in the following year, 2012 when the reaction of the earthquake was received, and Mar. 2014 when the last-minute demand before the tax increase was observed, are excluded as outliers.
Source: Created based on “METI: Indices of Tertiary Industry Activity” (ITA, 2005=100) and “MIC: Consumer Price Index” (CPI, 2010=100). (estimates)

Correlation between “Broad-ranging business services” and “Services producer price index” The distribution including realizations after the tax increase (after Apr. 2014) shows a negative
correlation shifting slightly to the lower right, while the correlation coefficient is low. Meanwhile, the distribution which does not include realizations after the tax increase shows a
slightly positive correlation.
27
(Note) 1. “Overall average” of the Services Producer Price Index (2010 Average) does not include the index for wholesale trade. Therefore the correlation with changes from the same month of the previous year for the indices of “Broad-ranging business services” excluding “Wholesale Trade” (seasonally adjusted) is observed.
2. Targeted period of the data is from Jan. 2010 to Sep. 2014. However, Mar. and Apr. in 2011 when the earthquake occurred, Mar. and Apr. in the following year, 2012 when the reaction of the earthquake was received, and Mar. 2014 when the last-minute demand before the tax increase was observed, are excluded as outliers.
Source: Created based on “METI: Indices of Tertiary Industry Activity” (ITA, 2005=100) and “Bank of Japan: Services Producer Price Index” (SPPI, 2010=100). (estimates)
[Including realizations after the tax increase (After Apr. in 2014) ]
Correlation coefficient = -0.42
[Not-including realizations after the tax increase (After Apr. in 2014) ]
Correlation coefficient = 0.58
y = -0.4115x + 0.1625R² = 0.1767
-3
-2
-1
0
1
2
3
4
-4 -2 0 2 4 6
SPPI
Ove
rall
aver
age
(%) c
hang
e fr
om th
e sa
me
mon
th o
f the
pr
evio
us y
ear
ITA Broad-ranging business services(except Wholesale Trade)(%) change from the same month of the previous year
y = 0.3241x - 0.946R² = 0.3338
-3
-2
-1
0
1
2
3
4
-4 -2 0 2 4 6
SPPI
Ove
rall
aver
age
(%) c
hang
e fr
om th
e sa
me
mon
th o
f the
pr
evio
us y
ear
ITA Broad-ranging business services(except Wholesale Trade) (%) change from the same month of the previous year
Correlations are different!

Correlation between “Broad-ranging business services” and “Services producer price index”
The correlation in the distribution including realizations after the tax increase shows negative after being pulled by realizations of six points of time (Apr. - Sep. 2014) after the tax increase, so a genuine correlation between services producer price and the amount of service activity in “Business services” is shown in the diagram on the right.
28
[Including realizations after the tax increase(After Apr. in 2014) ]
Correlation coefficient = -0.42
[Not-including realizations after the tax increase (After Apr. In 2014) ]
Correlation coefficient = 0.58
y = -0.4115x + 0.1625R² = 0.1767
-3
-2
-1
0
1
2
3
4
-4 -2 0 2 4 6
SPPI
Ove
rall
aver
age
(%) c
hang
e fr
om th
e sa
me
mon
th o
f the
pr
evio
us y
ear
ITA Broad-ranging business services(except Wholesale Trade)(%) change from the same month from the previous year
y = 0.3241x - 0.946R² = 0.3338
-3
-2
-1
0
1
2
3
4
-4 -2 0 2 4 6
SPPI
Ove
rall
aver
age
(%) c
hang
e fr
om th
e sa
me
mon
th o
f the
pr
evio
us y
ear
ITA Broad-ranging business services(except Wholesale Trade)(%) change from the same month of the previous year
Pulled by realizations after the tax increase
Genuine correlation
(Note) 1. “Overall average” of the Services Producer Price Index (2010 Average) does not include the index for wholesale trade. Therefore the correlation with changes from the same month of the previous year for the indices of “Broad-ranging business services” excluding “Wholesale Trade” (seasonally adjusted) is observed.
2. Targeted period of the data is from Jan. 2010 to Sep. 2014. However, Mar. and Apr. in 2011 when the earthquake occurred, Mar. and Apr. in the following year, 2012 when the reaction of the earthquake was received, and Mar. 2014 when the last-minute demand before the tax increase was observed, are excluded as outliers.
Source: Created based on “METI: Indices of Tertiary Industry Activity” (ITA, 2005=100) and “Bank of Japan: Services Producer Price Index” (SPPI, 2010=100). (estimates)

Correlation between “Broad-ranging business services” and “Services producer price index” The realizations showing the correlation between the price and the activity amount of “Business
services” are found in the vicinity of supply functions which are assumed to shift to upper right. However, the realizations after the tax increase (in the red dotted circle) are positioned at the upper
left from the distribution before the tax increase, so it is considered that supply functions shifted upward.
29
[Including realizations after the tax increase(After Apr. in 2014) ]
Correlation coefficient = -0.42
[Not-including realizations after the tax increase (After Apr. in 2014) ]
Correlation coefficient = 0.58
-3
-2
-1
0
1
2
3
4
-4 -2 0 2 4 6
SPPI
Ove
rall
aver
age
(%) c
hang
e fr
om th
e sa
me
mon
th o
f the
pr
evio
us y
ear
ITA Broad-ranging business services(except Wholesale Trade)(%) change from the same month of the previous year
y = 0.3241x - 0.946R² = 0.3338
-3
-2
-1
0
1
2
3
4
-4 -2 0 2 4 6
SPPI
Ove
rall
aver
age
(%) c
hang
e fr
om th
e sa
me
mon
th o
f the
pr
evio
us y
ear
ITA Broad-ranging business services(except Wholesale Trade) (%) change from the same month of the previous year
Distribution after the tax increaseShifted to upper left
Genuine correlation
Before the tax increase
Supply functions
(Note) 1. “Overall average” of the Services Producer Price Index (2010 Average) does not include the index for wholesale trade. Therefore the correlation with changes from the same month of the previous year for the indices of “Broad-ranging business services” excluding “Wholesale Trade” (seasonally adjusted) is observed.
2. Targeted period of the data is from Jan. 2010 to Sep. 2014. However, Mar. and Apr. in 2011 when the earthquake occurred, Mar. and Apr. in the following year, 2012 when the reaction of the earthquake was received, and Mar. 2014 when the last-minute demand before the tax increase was observed, are excluded as outliers.
Source: Created based on “METI: Indices of Tertiary Industry Activity” (ITA, 2005=100) and “ Bank of Japan: Services Producer Price Index” (SPPI, 2010=100). (estimates)

Correlation between “Broad-ranging business services” and “Services producer price index” Unlike “Personal services”, the upper shift of demand functions is not observed in “Business
services”, so “Business services” is directly affected by the upper shift of supply functions. These are considered as factors of weaker recovery in “Business services” during the third quarter of
2014, compared with “Personal services”.
30
[Including realizations after the tax increase (After Apr. 2014) ]
Correlation coefficient = -0.42
[Not-including realizations after the tax increase (After Apr. 2014) ]
Correlation coefficient = 0.58
-3
-2
-1
0
1
2
3
4
-4 -2 0 2 4 6
SPPI
Ove
rall
Ave
rage
(%) c
hang
e fr
om th
e sa
me
mon
th o
f the
pr
evio
us y
ear
ITA Broad-ranging business service(except Wholesale Trade)(%) change form the same month of the previous year
Decrease in the activity amount
y = 0.3241x - 0.946R² = 0.3338
-3
-2
-1
0
1
2
3
4
-4 -2 0 2 4 6SP
PI O
vera
ll av
erag
e(%
) cha
nge
from
the
sam
e m
onth
of t
he
prev
ious
yea
rITA Broad-ranging business services(except Wholesale Trade)
(%) change from the same month of the previous year
Supply functions
Distribution after the tax increaseShifts upper left
Genuine correlation
(Note) 1. “Overall average” of the Services Producer Price Index (2010 Average) does not include the index for wholesale trade. Therefore the correlation with changes from the same month of the previous year for the indices of “Broad-ranging business services” excluding “Wholesale Trade” (seasonally adjusted) is observed.
2. Targeted period of the data is from Jan. 2010 to Sep. 2014. However, Mar. and Apr. in 2011 when the earthquake occurred, Mar. and Apr. in the following year, 2012 when the reaction of the earthquake was received, and Mar. 2014 when the last-minute demand before the tax increase was observed, are excluded as outliers.
Source: Created based on “METI: Indices of Tertiary Industry Activity” (ITA, 2005=100) and “Bank of Japan: Services Producer Price Index” (SPPI, 2010=100). (estimates)

Summery of this report (1)
During the second quarter of 2014 after the increase in consumption tax, a significant decrease was observed in all industrial activities, and a decrease in the “Tertiary Industry Activity” explained most of the factors of the decrease.
In the background, having characteristics of weakness in “Personal services” which was not observed after the Lehman crisis, decreases were seen mainly in the services related to individual consumption such as “Retail Trade” and “Living-Related and Personal Services & Amusement Services”.
31

Summery of this report (2) Also, this downturn of “Personal services” has a background of cost-
push on the supply side after the tax increase, and it is confirmed that the price increase caused by the upper shift of supply functions affected the activity amount.
However, in “Personal services”, the upward shift of demand functions and strengthened consumer sentiment were confirmed in the ten months right before the tax increase, and they continued after the tax increase. Therefore, there is a possibility that the decrease of the activity amount caused by the upper shift of supply functions becomes slightly moderate.
Meanwhile, “Business services” after the tax increase, unlike “Personal services”, were directly affected by the upper shift of supply functions, and it is assumed that this difference would be apparent in the delayed recovery in the third quarter of 2014.
32