allergies across america: the largest study of allergy ... · pdf filethe largest study of...
TRANSCRIPT

The Largest Study of Allergy Testing in the United States
Allergies Across America™
Quest Diagnostics Health Trends™
Allergy Report 2011

Quest Diagnostics
The largest study of allergy testing in the United States
I am pleased to present to you the first Quest Diagnostics Health Trends™ allergy report, Allergies Across America™. This report is the largest analysis of allergy testing of patients in the United States under evaluation for medical symptoms associated with allergies.
Allergies are a major public health concern, affecting the healthcare system, employers, and, indeed, patients. By the time you finish reading this report, you may be surprised by the dynamic nature of allergies in the United States. We found evidence that allergen sensitization is increasing, and that the type of allergens affecting Americans evolved during the 4 years we examined. We also found that allergens have a disproportionate negative effect on children. A novel finding is that men experience higher rates of sensitization to allergens than women. Even the way allergies are diagnosed is changing, with a clear shift towards greater allergy testing by pediatricians and other primary care physicians.
We found evidence supporting the pattern of allergy progression known as the “allergy march,” in which allergen sensitization often evolves from food to environmental allergens. Our analysis identified a connection between allergies and asthma, building on prior research, but using our much larger data set. In addition, we revealed disparities in our healthcare system that should be cause for alarm for any policy maker, physician, or parent.
Our allergy report adds to our collection of Quest Diagnostics Health Trends reports developed in recent years on health concerns affecting large numbers of patients in the United States. Based on analyses of our national database – consisting of more than 1.5 billion patient encounters since January 2000 – previous reports have focused on chronic kidney disease, diabetes, heart disease, H1N1 (2009) Influenza A, and rotavirus. I encourage you to read these reports, which can be found at QuestDiagnostics.com/HealthTrends.
With mounting demands on our healthcare system, our nation must devise new, innovative methods of providing high quality services. Greater knowledge of the patient impact and clinical management of chronic diseases, such as allergies, will be increasingly vital to the ability of healthcare professionals to deliver the best possible care.
Best regards,
Surya N. Mohapatra, Ph.D.Chairman and Chief Executive OfficerQuest Diagnostics
P.S. A PDF of this report and additional content about allergies and IgE testing are available at QuestDiagnostics.com/HealthTrends.
Health Trends Allergy Report 2011
3
Health TrendsAllergy Report 2011
Table of Contents
SUMMARY 4
AboUT AlleRgieS 7
Allergies and Their Symptoms 7Impact of Allergies 7Diagnosing Allergies 8Treating Allergies 9The Allergy March 10
AMeRicA’S AlleRgY PRobleM 12
Allergies are Increasing 12Ragweed and Mold Increasing the Fastest 13Worst Cities for Allergies 16
genDeR: DoeS iT MAke A DiffeRence? 19
HigH iMPAcT of AlleRgieS on cHilDRen 21
THe AlleRgY MARcH 24
Food Allergies in Children 24Evolution from Food to Environmental Allergens 27
link beTween AlleRgieS AnD ASTHMA 28
DiSADvAnTAgeD cHilDRen: DelAYeD DiAgnoSiS 30
cHAnging PHYSiciAn TeSTing PATTeRnS 32
Primary Care Physicians Play a Larger Role in Diagnosing Allergies 32 Adoption of Blood-Based Allergy Testing Varies by Region 33
ReSeARcH MeTHoDologY 35
conTRibUToRS 37
RefeRenceS 38
LEARN MORE: Double click the tables or figures to view an enlarged image.

Quest Diagnostics
4
“The Quest Diagnostics
Health Trends Report studies
the effect of allergies on a
uniquely massive scale. It
represents people across the
United States using a highly
respected and standardized
laboratory methodology.”— Andrew H. liu, M.D.
Associate Professor Allergy and Clinical Immunology
National Jewish Health Denver, Colorado
Health TrendsAllergy Report 2011
SUMMARY
Allergies are one of the most common health conditions, affecting 1 in 5 Americans. Allergies account for more than 17 million physician office visits, 30,000 emergency room visits, and several hundred deaths each year.1 Individuals with allergies are at heightened risk for other diseases, including asthma.
As the world’s leading diagnostic testing company, Quest Diagnostics is uniquely positioned to analyze the largest national database of allergy blood tests and derive insights into the impact of allergies on the health of Americans.
For this Quest Diagnostics Health Trends report, we analyzed de-identified test results from more than 2 million patient encounters over a 4-year period. Our analysis included results from patients of both genders, from infants to the elderly, residing in every U.S. state and the District of Columbia.
Allergies are clinically diagnosed based on factors that include medical examination, patient history, laboratory testing, and, as appropriate, allergen exposure testing. Our study is based on testing using the ImmunoCAP® specific immunoglobulin E (IgE) blood test (ImmunoCAP), the “gold standard” of allergy blood tests.2,3 Each test result identified sensitization to 1 or more of 11 common allergens. Sensitization refers to a test result that indicates a patient has an allergen-specific IgE, which is important for diagnosing an allergy but may not by itself be sufficient to prompt symptoms. The allergens we evaluated were 5 foods (egg white, milk, peanut, soybean, and wheat), common ragweed, mold, 2 types of house dust mites, cat epithelia (skin), and dog dander.
Our study is the largest study of laboratory test results from a nationally representative U.S. population seeking medical care for symptoms associated with allergies. In addition to size, our study’s advantages include the use of validated quantitative laboratory test results of allergy sensitization, rather than survey responses from physicians or patients. As the vast majority of the patients in our study likely presented with new or changing allergy signs and symptoms, our analysis does not measure the prevalence of allergies in the general population.
our findings include:
• America’s allergy problem is increasing. Our analysis found that the overall allergen-sensitization rate increased by 5.8% over the 4-year study period. In addition, the number of patients tested for these 11 allergens increased 19%, significantly faster than growth in laboratory testing in general (see page 12).

5
Health TrendsAllergy Report 2011
Quest Diagnostics
• Sensitization to 2 common environmental allergens is increasing, consistent with prior climate change research. Sensitization to common ragweed grew 15% – more than any other allergen we analyzed – with the Southwest, Mountain, and Plains States experiencing the highest sensitization rates. These findings are consistent with other research suggesting climate change may contribute to an increase in certain environmental allergens, such as ragweed. Mold sensitization grew 12%, a finding that is potentially clinically important given other research showing that molds may trigger allergic sensitization and aggravate asthma (see page 13).
• Allergies are prevalent throughout the U.S., occurring in each of the country’s 30 largest cities. Yet, some cities demonstrated higher rates of sensitization than others, with Dallas, Phoenix, Baltimore, Washington, D.C., and Boston experiencing the greatest burden (see page 16).
• Men had higher sensitization rates than women at all ages, a novel and potentially clinically significant finding. This novel finding differs from other studies that suggest that allergies are more prevalent among women. While additional research is required, we hypothesize that the criteria for positive specific-IgE allergic response may differ between males and females, a finding of potential clinical significance. We provide 3 hypotheses for why our research differs from prior studies, including the possibility that the criteria for positive specific-IgE allergic response may differ between males and females, and possibly at different ages (see page 19).
• children had higher sensitization rates than adults. Of children tested between 2 and 17 years of age, 53% showed sensitization to 1 or more allergens. Nearly 1 in 5 children with sensitization showed a high degree of IgE sensitization, compared to about 1 in 10 adults (see page 21).
• Allergies progress along a pattern known as the allergy march. The allergy march is a well-documented phenomenon by which sensitization to foods early in life may heighten a child’s likelihood of developing more severe allergic disease, including asthma, later in life. Our cross-sectional study is the largest to reveal a pattern of allergen sensitization consistent with the allergy march, with high rates of food-allergen sensitization most commonly found in early childhood and high rates of sensitization to other allergens occurring more frequently with age. To better control the allergy march, physicians may periodically evaluate patients with allergies to assess changes in allergen sensitization (see page 24).
The largest allergy
study ever conducted
found America’s allergy
problem is both pervasive
and increasing.

Quest Diagnostics
6
Health TrendsAllergy Report 2011
• Peanut sensitization was high in children. Peanuts were the most common source of food sensitization in children 6 to 18 years of age, affecting nearly 1 in 4 school-aged children tested. Yet, peanut sensitization is even more prevalent in children 5 years of age and younger, affecting about 30% of children in this age group. Our data suggest peanut allergies remain an important source of concern in children (see page 25).
• Patients with asthma had more allergies. On average, patients with asthma who were also found to have IgE sensitization were sensitive to 4.1 allergens compared to 3.4 allergens in patients who were not identified as having asthma. The link with asthma was strongest for indoor allergens such as mold, cats and dogs, and house dust mites. Our findings support medical guidelines recommending that clinicians and patients with asthma identify and minimize exposure to allergens that may aggravate asthma (see page 28).
• economically disadvantaged children were 18% less likely to be tested by the age of 5 than economically advantaged children. This novel finding suggests that economically disadvantaged children may be less likely to have their allergies diagnosed in early disease stages, when treatment may help prevent the onset of the allergy march leading to more severe allergy-related conditions, including asthma (see page 30).
• The widespread availability of blood-based allergy testing is changing clinical practice. Allergies are increasingly being diagnosed by pediatricians and other primary care physicians, whose ordering of ImmunoCAP from Quest Diagnostics grew 46% and 49%, respectively, over the 4-year period. Ordering from allergists, in contrast, grew by only 23% over the same time period. The states of New York and New Jersey, as well as the Pacific Northwest, led the country in the adoption of blood-based allergy testing, while the mid-Atlantic, Great Lakes, and Midwestern regions lagged behind (see page 32).
The widespread
availability of
blood-based allergy
testing is changing
clinical practice.

7
Health TrendsAllergy Report 2011
Quest Diagnostics
AboUT AlleRgieS
Allergies and Their Symptoms
Allergies occur when a person’s immune system overreacts to contact with certain foods, plants, insects, animals, and drugs. A healthy immune system produces proteins known as IgE antibodies that protect individuals from exposure to external substances that could cause illness, infection, and disease. In patients with allergies, the immune system makes specific-IgE antibodies that mistakenly identify an allergen as something harmful. This triggers the release of histamines and other substances in the body to “counteract” that exposure, causing allergy symptoms.
Most allergies are subtle and barely manifest. Others cause mild symptoms such as sneezing, itchy or watery eyes, a scratchy throat, cough, and annoying rashes. Some allergies lead to more severe reactions such as low blood pressure (hypotension), difficulty breathing, asthma, hives, and eczema. In rare cases, very severe reactions can cause death without prompt medical intervention.
Some people are extremely sensitive to an allergen and will experience symptoms with trace exposure. Other people have a high allergen threshold. They may experience symptoms only after heavy, repeated, or continuous exposure to the offending allergen. For people who are sensitive to multiple allergens, symptoms sometimes occur only after the combined cumulative exposure exceeds an individual’s symptom threshold.
There is a strong relationship between allergies and asthma.4,5 Current guidelines for asthma diagnosis suggest screening children with recurrent, moderate/severe diseases for allergies.6 Asthma can be triggered by exposure to allergens such as pollen, household dust, and mold.
Impact of Allergies
Allergic disease is the most common chronic medical condition affecting children.7 In 2008, the U.S. Centers for Disease Control and Prevention (CDC) reported that approximately 3 million children under the age of 18 years have food or digestive allergies.8 The Pediatric Allergies in America survey looked at the burden of allergic rhinitis among children ages 4 to 17 years.9 This survey found that healthcare providers typically overestimate patients’ and parents’ satisfaction with disease management and the benefit of medications used for the treatment of nasal allergies in children.
Allergic disease is
the most common
chronic medical
condition affecting
children.

Quest Diagnostics
8
Health Trends Allergy Report 2011
Allergies affect adults as well.10 Illness associated with allergies can lower worker productivity. People with allergies miss an average of 1.7 workdays per year due to allergies, and experience symptoms for an average of 69 days (nearly 10 weeks) annually. Compared with workers without allergies, employees with allergies who reported using no medication showed a 10% decrease in productivity.11 In the U.S., allergy is a major cause of work absenteeism and “presenteeism” (when workers show up for work, but are less productive), resulting in nearly 4 million missed or lost workdays each year and over $700 million in lost productivity.12
Diagnosing Allergies
Patients with allergy-like symptoms should receive a proper medical diagnosis. Some patients may attempt to self-diagnose and treat self-identified allergies based on factors that include symptoms consistent with allergies. However, allergy-like symptoms may also be caused by conditions ranging from the common cold (for environmental allergens) to food or lactose intolerance and celiac disease (for food allergies) to skin reactions caused by certain drugs (for animal allergies).
Without a proper diagnosis, a patient may try to self medicate with over-the-counter medications or unnecessarily avoid exposure to perceived “triggers.” In such cases, the patient will fail to receive treatment for the underlying medical condition.
A medical history can help identify an allergy when identical symptoms are consistently linked to repeat exposure. Physicians may use skin prick tests, IgE-specific blood tests, and food challenges to diagnose allergies. Skin-prick tests and IgE blood tests appear to have similar sensitivity when compared to food challenge.13
Skin Prick Test
The skin prick test is typically administered by an allergist who exposes the skin to small amounts of suspected allergens. Liquid solutions containing potential allergens are applied to the skin, along with tiny needle pricks to allow the allergens to enter the skin. Skin tests can also be performed by injecting allergens directly into the skin, or by affixing a patch containing allergens to the skin for 24 to 72 hours to see if a reaction occurs. If the skin reacts, a red, raised area (called a wheal) can be observed, indicating sensitization to that allergen.
Only a thorough
medical evaluation
by a physician can
diagnose an allergy.

9
Health TrendsAllergy Report 2011
Quest Diagnostics
food challenge
Physicians may give patients with suspected food allergies small amounts of a suspect food to assess sensitivity. These food challenges are the “gold standard” for diagnosing food allergies, but carry some risk of a severe reaction. Results from skin and blood tests are often sufficient for diagnosis, and a food challenge may not be necessary.14,15
ige blood Test
Allergy blood tests look for specific immunoglobulin E (IgE) antibodies in the blood that are produced by the body’s immune system when an allergen is present. Quest Diagnostics uses ImmunoCAP, considered the “gold standard” of allergy blood tests.16,17 ImmunoCAP is manufactured by Phadia AB in Uppsala, Sweden and has been cleared by the U.S. Food and Drug Administration.
ImmunoCAP improves upon first-generation blood tests (RAST®), and is intended for the quantitative measurement of circulating IgE in human blood samples.18 A negative IgE blood test result can help a physician rule out allergies so as to consider, diagnose, and ultimately treat causes of non-IgE mediated symptoms.
ImmunoCAP’s positive quantitative results are categorized into classes, with class 1 as the lowest and class 6 as the highest. At each age, higher classes correlate with increasing severity of allergy symptoms and asthma. ImmunoCAP test results can be used to detect sensitization to specific allergens and to help guide treatment decisions.19,20 ImmunoCAP assays can be performed on hundreds of allergens, such as common ragweed, trees, pollens, mold, food, and animal dander.
IgE blood tests can be
used to help diagnose
sensitization for specific
allergens, as well as to
help guide treatment
decisions.
immunoglobulin e (ige) is an antibody that binds to the surface of a mast cell, which is a special cell that helps the body react to injury or to invading substances. The binding releases histamine and other substances that trigger sneezing, wheezing, congestion, as well as a watery and itchy nose and eyes. In severe cases, anaphylaxis may occur – a rapid, systemic reaction that can cause constriction of the air pipe leading to suffocation, or hypotension (low blood pressure) caused by leakiness of the body’s blood vessels.

Quest Diagnostics
10
Health Trends Allergy Report 2011
Treating Allergies
The best treatment for food allergies is avoidance. Although there is no cure for environmental allergies, numerous prescription and over-the-counter treatments may alleviate symptoms and decrease the frequency and severity of reactions.21
Treatments include:
• Antihistamines and decongestants are the most common drug treatments for allergies. Antihistamines block the histamine receptors on mast cells that if activated cause blood vessels to expand leading to swelling, redness, and itchiness. Decongestants relieve congestion and are often prescribed along with antihistamines for allergies.
• IgE inhibitors are a new class of medications available to treat allergy-related asthma.
• Steroids are highly effective at decreasing inflammation; however, because of their side effects, they are reserved for severe episodes of allergy symptoms.
• Allergen-desensitization therapies include treatment that exposes the patient to small amounts of an offending allergen in order to minimize the immune reaction. They also include recently introduced immunotherapies utilizing engineered proteins and strategic immunomodulators.21
The consequences of inadequate treatment can range from a runny and stuffy nose (allergic rhinitis) to acute and chronic sinusitis. Chronic sinusitis is associated with more severe outcomes including otitis media (middle ear infection), nasal congestion, sleep apnea, nasal polyps (abnormal growth in the lining of the nasal passages), and asthma. For example, approximately 30% of patients with nasal polyps test positive for environmental allergies.22 Thirty-six percent of children with recurrent otitis media with effusion (fluid behind the eardrum of the middle ear) also test positive for allergies.23
The American Academy of Allergy, Asthma & Immunology (AAAAI) and the American College of Allergy, Asthma and Immunology (ACAAI) have jointly published guidelines that recommend patients with severe or recurrent sinusitis be considered for allergy testing.24 Other studies have confirmed the link between childhood allergies and the development of asthma.25–27
Published medical
guidelines recommend
patients with severe or
recurrent sinusitis be
considered for allergy
testing.

11
Health TrendsAllergy Report 2011
Quest Diagnostics
The Allergy March
The allergy march is a well-documented disease progression in which sensitivity to certain allergens in childhood may lead to more severe allergic disease with age. While not all patients follow the same course, the allergy march follows a typical pattern. It often begins with sensitization to 1 or more food allergens, followed by sensitization to environmental agents, sometimes culminating in more severe allergic disease, including asthma. Because allergies and their effects on the individual are dynamic, physicians may periodically evaluate patients with an allergy to assess changes in allergen sensitization.
In addition, given the connection between allergies and asthma, the National Asthma Education and Prevention Program (NAEPP) published its landmark “Guidelines for the Diagnosis and Management of Asthma” in 2007.6 These guidelines highlight the usefulness of both skin and blood-based testing as aids to determine if asthmatic patients are sensitive to environmental allergens. The guidelines also indicate that identifying environmental allergen risks, taking steps to minimize exposure, and using targeted immunotherapy treatments may help reduce the likelihood of asthma complications. Moreover, the NAEPP guidelines highlight the role of food allergy testing in children 4 years of age and younger. Likewise, a National Institute of Allergy and Infectious Diseases (NIAID)-sponsored expert panel developed guidelines for the diagnosis and management of food allergies that supports the use of allergen-specific IgE tests for identifying foods that potentially provoke IgE-mediated, food-induced allergic reactions while recognizing that the tests by themselves are not diagnostic of food allergy.28
The allergy march is a
well-documented disease
progression in which
sensitivity to certain
allergens in childhood
may lead to more severe
allergic disease with age.

Quest Diagnostics
12
Health Trends Allergy Report 2011
AMeRicA’S AlleRgY PRobleM
Allergies are Increasing
key findings:
• Theoverallsensitizationrategrewby5.8%.• Thenumberofpatientstestedincreasedby19%.• Approximately4outof9patientstestedshowedsensitizationtoatleast
1 of the 11 common allergens. Our analysis found that the overall allergen-sensitization rate increased 5.8% over the 4-year study period (Figure 1). In addition, the number of patients tested for these 11 allergens increased 19%, significantly faster than growth in laboratory testing in general.
Positivity rates for a laboratory test typically decline as the proportion that gets tested from an overall population increases. Our findings that sensitization rates increased at the same time our IgE testing volumes grew strongly suggests that the prevalence of allergies increased in our study population during the 4-years examined. These findings are consistent with other studies that find allergy prevalence is increasing.8,30 However, we believe enhancements in testing methodologies, most notably the growing use of IgE specific blood tests, were the primary drivers of our observed increase in testing volumes.
Of all the patients tested, approximately 4 out of 9 showed sensitization to at least 1 of the 11 common allergens. These findings suggest that a large percentage of patients who are under evaluation for allergies did not exhibit IgE sensitization when tested. We hypothesize that many of these patients exhibited sensitization to allergens beyond the 11 we examined for our study. It is also possible that a large number of these patients had symptoms of allergies for which they were IgE tested, but their symptoms were caused by a non-allergy related condition.
FIgUre 1. OverALL Ige SeNSITIzATION rATe
Source: Quest Diagnostics Health Trends™
40
42
44
46
48
Year 4Year 3Year 2Year 1
OV
ERA
LL IG
E SE
NSI
TIZA
TIO
N R
ATE
(%)
42.7
43.9
45.0 45.1
“More Americans than
ever before say they are
suffering from allergies.
It is among the country’s
most common, yet often
overlooked, diseases.” 29
— Asthma and Allergy Foundation of America

13
Health TrendsAllergy Report 2011
Quest Diagnostics
Ragweed and Mold Increasing the Fastest
key findings:
• Sensitizationtocommonragweedgrew15%overthe4years–morethananyother allergen we analyzed. These findings are consistent with other research suggesting climate change may contribute to increasing development of certain environmental allergens.
• TheSouthwest,GreatLakes,Mountain,andPlainsStateshadthehighestsensitization rates to common ragweed.
• Moldsensitizationgrew12%,afindingthatisparticularlyimportantgivenotherresearch showing that molds are an important trigger of allergic sensitization and may aggravate asthma.
Sensitization rates to common ragweed and mold increased dramatically during the 4 years we examined. These findings are noteworthy in light of other research that suggests climate change, by promoting longer blooming seasons, may increase both the prevalence of certain environmental allergens and length of the year during which people are exposed to them. Increased exposure to ragweed may increase the risk of developing allergy sensitization or of experiencing more severe allergy symptoms.31 While a smaller body of research has been conducted on the possible effects of climate change on mold32 than on ragweed, we hypothesize that the same climate changes driving greater ragweed prevalence may also contribute to greater prevalence of mold.
Although more research is needed, our data raises the prospect that climate change, by increasing the prevalence of ragweed and mold, may have contributed to the increased rates of ragweed and mold IgE sensitization observed in our data.
“The Quest Diagnostics
Report hits on a current hot
topic in allergy research:
the possible effect of
climate change on higher
aeroallergen levels and
longer pollen seasons.” —Andrew H. liu, M.D
Associate Professor Allergy and Clinical Immunology
National Jewish Health Denver, Colorado
FIgUre 2. PerCeNT CHANge IN Ige SeNSITIzATION rATeS IN eNvIrONmeNTAL ALLergeNS Over 4 YeArS
CHA
NG
E IN
IGE
SEN
SITI
ZATI
ON
RAT
ES (%
)
-5
0
5
10
15
20
Common Ragweed Mold House Dust Mites
-3.3
11.6
14.8
Source: Quest Diagnostics Health Trends™

Quest Diagnostics
14
Health Trends Allergy Report 2011
FIgUre 3. regIONAL Ige SeNSITIzATION rATeS FOr COmmON rAgweeD*
REGION X14%
REGION IX21%
REGION VIII21%
REGION VII20%
REGION V21%
REGION VI20%
REGION IV15%
REGION III20%
REGION II20%
REGION I18%
High
Low*Alaska and Hawaii not shown
We also found that sensitization to house dust mites declined the most over the 4-year period. We found striking geographical patterns, with the Northeast and Southeast showing the highest rates of sensitization to house dust mites. The reasons for these patterns are unclear.
Additional research into environmental and social differences may yield insights that explain these geographic patterns.
common Ragweed
Sensitization to common ragweed showed a dramatic increase of 15% during the 4-year period (Figure 2). We found that the Southwest, Great Lakes, Mountain, and Plains States had the highest sensitization rates to common ragweed. The lowest sensitization rates were in the Southeast and Northwest (Figure 3).
geographicCategory
U.S. Health andHuman Servicesgeographic regions
States
Northeast Region I CT, MA, ME, NH, RI, VTNortheast Region II NJ, NYMid-Atlantic Region III DC, DE, MD, PA, VA, WVSoutheast Region IV AL, FL, GA, KY, MS, NC, SC, TNGreat Lakes Region V IL, IN, MI, MN, OH, WISouthwest Region VI AR, LA, NM, OK, TXPlains States Region VII IA, KS, MO, NEMountain States Region VIII CO, MT, ND, SD, UT, WYSouthwest Region IX AZ, CA, HI, NVPacific Northwest Region X AK, ID, OR, WA
The rapid rise in
common ragweed and
mold is consistent with
other research linking
climate change to greater
sesitization to select
environmental allergens.
Source: Quest Diagnostics Health Trends™

15
Health TrendsAllergy Report 2011
Quest Diagnostics
Mold
A 12% increase in sensitization to mold was seen over the 4-year period (Figure 2). This finding is potentially clinically important, as mold has been implicated as a cause of increased risk of upper respiratory tract symptoms, cough, and wheezing in otherwise healthy individuals, and with asthma symptoms in people with asthma.33,34 Unlike ragweed sensitization, mold sensitization did not vary significantly across geographies.
House Dust Mites
Our analysis found that the sensitization rate for house dust mites declined by 3.3% over the 4 years we examined. We found striking geographical patterns, with states in the Northeast and Southeast showing the highest rates of sensitization. As shown in Figure 4, nearly 1 in 3 patients tested in the Northeast states of Connecticut, Massachusetts, Maine, New Hampshire, Rhode Island, and Vermont were positive for house dust mite sensitization. By contrast, only 1 in 10 patients tested living in the Mountain States of Colorado, Montana, the Dakotas, Utah, and Wyoming demonstrated sensitization to house dust mites.
Our analysis found that
the sensitization rate for
house dust mites declined
by 3.3% over the 4 years
we examined.FIgUre 4. regIONAL Ige SeNSITIzATION rATeS FOr HOUSe DUST mITeS*
REGION X18%
REGION IX20%
REGION VIII10%
REGION VII16%
REGION V20%
REGION VI22%
REGION IV27%
REGION III23%
REGION II27%
REGION I30%
High
Low*Alaska and Hawaii not shown
Source: Quest Diagnostics Health Trends™

Quest DiagnosticsHealth Trends Allergy Report 2011
Worst Cities for Allergies
key findings:
• The5worstcitiesforoverallallergensensitizationareDallas,Phoenix,Baltimore, Washington, D.C., and Boston.
• Southwesterncitiesdominatedragweedandmoldsensitization,makingup 4 of the 5 worst cities for both allergens.
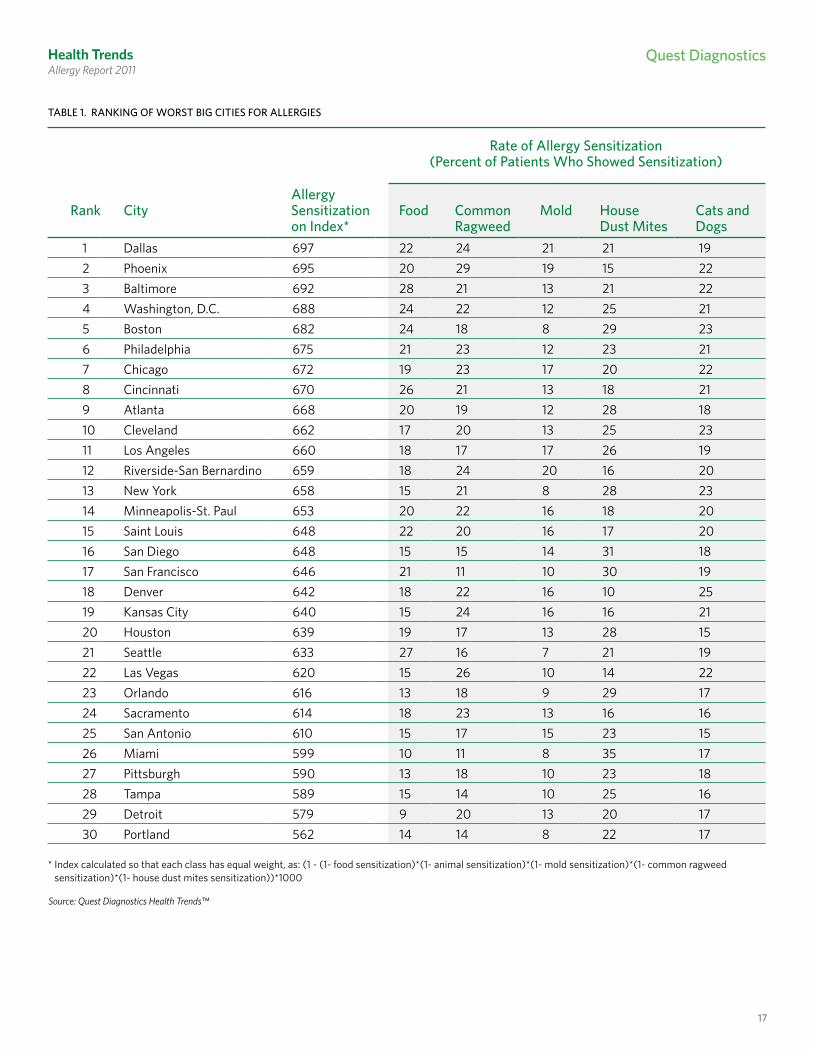
We evaluated allergen sensitization in the most populous 30 metropolitan statistical areas (“MSAs” or “cities”), as defined by the United States Office of Management and Budget in 2009. We evaluated these cities based on their rate of sensitization over the 4-year study period to each of the 5 allergen categories: food, common ragweed, mold, house dust mites, and cats and dogs.
We also developed an “Allergen Sensitization Index” that measured the overall burden of allergies based on the combined sensitization levels across the 5 categories. Higher values indicate higher overall sensitization across these 5 allergen categories, ranging from a low of 562 (Portland) to a high of 697 (Dallas) (Table 1).
We found that allergen sensitization is a problem in all 30 cities. While sensitization rates varied widely, even in those cities at the low end our ranking, roughly 1 out of 5 people tested showed sensitization in 1 or more of the 5 allergen categories (Table 1). Dallas, Phoenix, Baltimore, Washington, D.C., and Boston were the worst cities for allergies.
Our findings regarding the highest rates of IgE sensitization by city differ from other well-known allergy rankings. These include the “Allergy Capitals,” a research project of the Asthma and Allergy Foundation of America (AAFA), which identifies “the 100 most challenging places to live with allergies,” based on pollen levels, allergy prescriptions, and other data, and the National Allergy Bureau™ (NAB™), part of the AAAAI Aeroallergen Network, which provides pollen and mold level rankings around the United States. Given the differences in the methodology and types of allergens evaluated in these reports, their data may be inconsistent with our Worst Cities for Allergies ranking. Nonetheless, our data supports the AAFA’s conclusion: “There is no place safe from allergies in America.”
“The Quest Diagnostics
Health Trends report
demonstrates that regardless
of geography, chances are
allergies are a major health
problem in a city near you.”
— Jon R. cohen, M.D. Senior vice President Chief medical Officer
Quest Diagnostics
16
17
Health TrendsAllergy Report 2011
Quest Diagnostics
Allergy rank City Sensitization Food Common mold House Cats and on Index* ragweed Dust mites Dogs
1 Dallas 697 22 24 21 21 192 Phoenix 695 20 29 19 15 223 Baltimore 692 28 21 13 21 224 Washington, D.C. 688 24 22 12 25 215 Boston 682 24 18 8 29 236 Philadelphia 675 21 23 12 23 217 Chicago 672 19 23 17 20 228 Cincinnati 670 26 21 13 18 219 Atlanta 668 20 19 12 28 1810 Cleveland 662 17 20 13 25 2311 Los Angeles 660 18 17 17 26 1912 Riverside-San Bernardino 659 18 24 20 16 2013 New York 658 15 21 8 28 2314 Minneapolis-St. Paul 653 20 22 16 18 2015 Saint Louis 648 22 20 16 17 2016 San Diego 648 15 15 14 31 1817 San Francisco 646 21 11 10 30 1918 Denver 642 18 22 16 10 2519 Kansas City 640 15 24 16 16 2120 Houston 639 19 17 13 28 1521 Seattle 633 27 16 7 21 1922 Las Vegas 620 15 26 10 14 2223 Orlando 616 13 18 9 29 1724 Sacramento 614 18 23 13 16 1625 San Antonio 610 15 17 15 23 1526 Miami 599 10 11 8 35 1727 Pittsburgh 590 13 18 10 23 1828 Tampa 589 15 14 10 25 1629 Detroit 579 9 20 13 20 1730 Portland 562 14 14 8 22 17
rate of Allergy Sensitization(Percent of Patients who Showed Sensitization)
* Index calculated so that each class has equal weight, as: (1 - (1- food sensitization)*(1- animal sensitization)*(1- mold sensitization)*(1- common ragweed sensitization)*(1- house dust mites sensitization))*1000
TAbLe 1. rANKINg OF wOrST bIg CITIeS FOr ALLergIeS
Source: Quest Diagnostics Health Trends™

Quest Diagnostics
18
Health Trends Allergy Report 2011
rank Food Commonragweed
mold House Dust mites
Animal
1 Baltimore Phoenix Dallas Miami Denver2 Seattle Las Vegas Riverside-San Bernardino San Diego New York3 Cincinnati Kansas City Phoenix San Francisco Boston4 Washington, D.C. Riverside-San Bernardino Los Angeles Orlando Cleveland5 Boston Dallas Chicago Boston Las Vegas
TAbLe 2. rANKINg OF wOrST CITIeS bY ALLergeN CATegOrY
The cities that exhibited the highest rates of sensitization in each of the 5 allergen categories are reported in Table 2. We found that Southwestern states lead in sensitization to common environmental allergens.
Four of the 5 cities with the highest sensitization rates to common ragweed are in the Southwest (Phoenix, Las Vegas, Riverside-San Bernardino, and Dallas) (Table 2). Similarly, 4 of the 5 cities with the highest sensitization to mold are in the Southwest (Dallas, Riverside-San Bernardino, Phoenix, and Los Angeles). Notably, Dallas, Phoenix, and Riverside-San Bernardino are among the worst cities for both common ragweed and mold.
Our uniquely large study has identified clear differences in allergen sensitization across major cities in the U.S. However, the reasons behind these differences are not always apparent. Additional research into environmental, social and other factors (including patient and physician behaviors) is needed to explain the observed differences across cities.
Source: Quest Diagnostics Health Trends™

19
Health TrendsAllergy Report 2011
Quest Diagnostics
Men had higher
sensitization rates
than women at all
ages, a novel and
potentially clinically
significant finding.
genDeR: DoeS iT MAke A DiffeRence?
Sensitization is Higher Among Males
key findings:
• Maleshadahigheroverallallergensensitizationrateatallages.• Thisnovelfindingdiffersfrompreviousstudiessuggestingthatadultallergies
are more prevalent among women. • Ourfindingsareconsistentwithotherstudiesshowinghigherratesof
sensitization in boys compared to girls.
Our analysis revealed a novel finding concerning the gender difference in the allergen-specific IgE sensitization: Males had a higher overall allergen sensitization rate at all ages (Figure 5). This finding differs from previous studies that suggested adult allergies are more prevalent among women.35 A meta-analysis of allergy prevalence that reviewed 591 studies found that males made up 64% of people 18 years of age or younger identified with allergies, but women made up 65% of adults identified with allergies after age 18.36
Three hypotheses may explain the reason for our novel finding:
• First, there may be a gender-based selection bias that affects which patients are tested. This bias may be due to patient or provider behaviors. A physician’s decision to offer allergen-specific IgE testing may be influenced by different perceptions of the symptoms described by boys versus girls, a bias that may also exist with adult patients.37 In general, males have lower outpatient physician visit rates than females in all settings except emergency departments and surgical outpatient centers.38,39
• Second, it is possible that allergen specific-IgE sensitization among men has been previously underestimated relative to allergen specific-IgE sensitization among women. If this hypothesis is accurate, men may be at greater risk for undertreatment of allergies. Physicians and male patients should regard their allergy-like symptoms seriously so that they may receive proper evaluation, diagnosis, and treatment.

Quest Diagnostics
20
Health TrendsAllergy Report 2011
Further study is required
to determine if there is
a need for sex-specific
criteria in interpreting IgE
test results.
• Finally, the criteria for a positive specific-IgE allergic response may differ between males and females, and possibly at different ages. If this third hypothesis proves true on further research, it could have clinically significant implications for assessing allergen sensitization according to gender. Further study is required to determine whether separate sex-specific criteria are appropriate in the interpretation of IgE test results.
OV
ERA
LL IG
E SE
NSI
TIZA
TIO
N R
ATE
(%)
AGE (YEARS)0 10 20 30 40 50 60 70
0
10
20
30
40
50
60
70
FMFIgUre 5. OverALL Ige SeNSITIzATION rATe bY Age AND geNDer
Source: Quest Diagnostics Health Trends™

21
Health TrendsAllergy Report 2011
Quest Diagnostics
HigH iMPAcT of AlleRgieS on cHilDRen
Children Have Higher Sensitization Rates Than Adults
key findings:
• Ofchildrentestedbetween2and17yearsofage,53%percentshowed sensitization to 1 or more allergens, but sensitization among adults was only 37%.
• Nearly1in5childrenwhoexhibitedsensitizationshowedahighdegreeof IgE allergen sensitization, compared to about 1 in 10 adults. Higher IgE allergen sensitization levels at each age generally correlate with more severe allergy symptoms.
Our analysis determined that children are far more likely to show sensitization to allergens than adults (Figure 5).
More than half (53%) of children tested between the ages of 2 and 17 demonstrated sensitization to 1 or more allergens. From the age of 18 onward, the sensitization rate steadily declined, with 37% of those tested showing sensitization to 1 or more allergens.
In addition to having higher sensitization rates, children are also more likely to test at higher classes of allergen-specific IgE sensitization (Figure 6). Positive quantitative results from ImmunoCAP are translated into 6 classes, with class 1 having the lowest sensitization-specific IgE response and class 6 having the highest response.
In our study, 18% of children (nearly 1 out of 5) under the age of 18 who demonstrated sensitization to an allergen were in high severity classes (class 4 or higher), whereas only 11% of adults were categorized as class 4 or higher. This suggests that children were almost twice as likely to have very high IgE allergen sensitization as adults.
While it is difficult to predict the severity of allergy symptoms for any individual patient based on IgE sensitization levels, higher IgE levels at each age generally correlate with both a higher likelihood of having allergy symptoms and increased clinical severity.40
More than half of
children tested
between the ages of
2 and 17 demonstrated
sensitization to 1 or
more allergens.

Quest Diagnostics
22
Health Trends Allergy Report 2011
We did not investigate the reasons that children experienced higher rates of IgE sensitization than adults. Many physicians refer to class scores to aid their interpretation of IgE test results in order to evaluate their patients.41 Further research is needed to determine if physicians should evaluate patients differently based on age when considering IgE classes.
Nearly 1 out of 5
children with allergen
sensitization had a high
severity classification.
FIgUre 6. DISTrIbUTION OF PATIeNTS wITH SeNSITIzATION bY Ige QUANTITATION CLASS
0
20
40
60
80
100
Class 6 (>100 Very High)Class 5 (51 - 100 Very High)Class 4 (17.6 - 50 Very High)
Class 3 (3.51 - 17.5 High)Class 2 (0.71 - 3.5 Moderate)Class 1 (0.35 - 0.7 Low)
AGE (YEARS)
0 10 20 30 40 50 60 70
PERC
ENT
Source: Quest Diagnostics Health Trends™
23
Health TrendsAllergy Report 2011
Quest Diagnostics
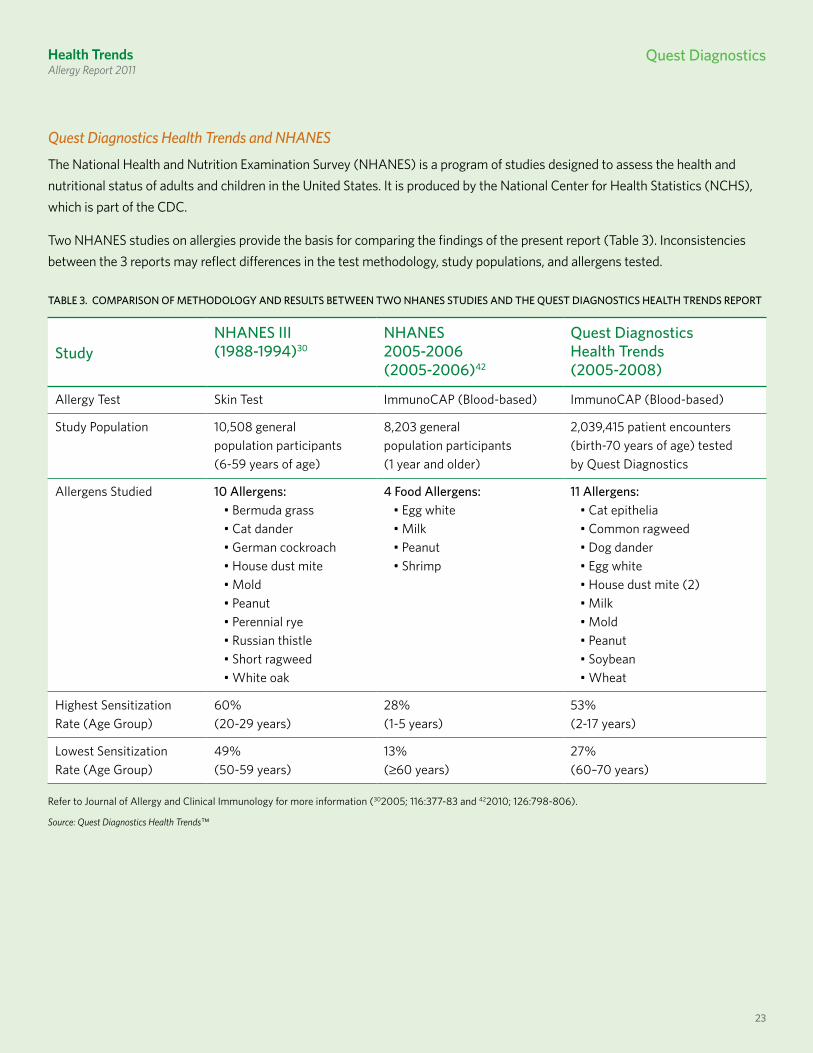
TAbLe 3. COmPArISON OF meTHODOLOgY AND reSULTS beTweeN TwO NHANeS STUDIeS AND THe QUeST DIAgNOSTICS HeALTH TreNDS rePOrT
StudyNHANeS III(1988-1994)30
NHANeS2005-2006(2005-2006)42
Quest Diagnostics Health Trends(2005-2008)
Allergy Test Skin Test ImmunoCAP (Blood-based) ImmunoCAP (Blood-based)
Study Population 10,508 general population participants (6-59 years of age)
8,203 general population participants (1 year and older)
2,039,415 patient encounters (birth-70 years of age) tested by Quest Diagnostics
Allergens Studied 10 Allergens:•Bermudagrass•Catdander•Germancockroach•Housedustmite•Mold•Peanut•Perennialrye•Russianthistle•Shortragweed•Whiteoak
4 Food Allergens:•Eggwhite•Milk•Peanut•Shrimp
11 Allergens:•Catepithelia•Commonragweed•Dogdander•Eggwhite•Housedustmite(2)•Milk•Mold•Peanut•Soybean•Wheat
Highest Sensitization Rate (Age Group)
60%(20-29 years)
28%(1-5 years)
53%(2-17 years)
Lowest Sensitization Rate (Age Group)
49%(50-59 years)
13% (≥60 years)
27%(60–70 years)
Quest Diagnostics Health Trends and NHANES
The National Health and Nutrition Examination Survey (NHANES) is a program of studies designed to assess the health and nutritional status of adults and children in the United States. It is produced by the National Center for Health Statistics (NCHS), which is part of the CDC.
Two NHANES studies on allergies provide the basis for comparing the findings of the present report (Table 3). Inconsistencies between the 3 reports may reflect differences in the test methodology, study populations, and allergens tested.
23
Refer to Journal of Allergy and Clinical Immunology for more information (302005; 116:377-83 and 422010; 126:798-806).
Source: Quest Diagnostics Health Trends™
Health Trends Allergy Report 2011
Quest Diagnostics

Quest Diagnostics
24
Health Trends Allergy Report 2011
THe AlleRgY MARcH
key findings:
• Ourcross-sectionalstudyisthelargesttorevealapatternofallergensensitization consistent with the allergy march.
• Childrenthroughtheageof8weremostlikelytoexperiencehighsensitizationto foods, with declines in food sensitization after that age.
• Sensitizationtoallotherallergenswasmuchmorecommoninchildren9to12years of age.
• Moldsensitizationsteadilydeclinedinpatientsaftertheageof12.• Sensitizationtohousedustmites,catsanddogs,andcommonragweed
remained at high levels through the age of 40.
The allergy march describes the progression from childhood allergies to other manifestations of allergic diseases, including asthma, later in life.42,43 The allergy march typically begins with sensitization to food allergens in young children, and then progresses to reactions to environmental allergens.
Awareness of the allergy march can promote diagnosis and treatment of children at earlier ages. Early intervention can minimize the likelihood of progression to more severe allergic diseases, including asthma.44 We analyzed our data for patterns in food and environmental allergen sensitization that may yield insights leading to improved diagnosis and treatment. While our analysis does not track individual patients over time, our large cross-sectional analysis revealed a pattern of allergen sensitization consistent with the allergy march. Because allergies are dynamic, physicians may consider periodically evaluating patients who have been previously diagnosed with an allergy to assess changes in allergen sensitization.
Food Allergies in Children
Food allergies are typically the first allergies to develop in children, but children sometimes outgrow these allergies as the immune system develops tolerance. Research suggests a strong link between eczema, a skin disorder, in childhood and food sensitization, especially to egg, milk, and peanut. Eczema and food allergies often appear between the third and twelfth month of life, with peak prevalence during the first 2 years of life. Other studies have shown that between 33% and 81% of children with early eczema have evidence of food allergies.45,46 Some affected children progress and develop otitis media (infection of the middle inner ear) and rhino-conjunctivitis (hay fever).
“It has recently been
demonstrated that strong
infantile IgE antibody
responses to food proteins
must be considered
as markers for atopic
reactivity in general and
are predictors of
subsequent sensitization
to aeroallergens.”
— From “Strategies for Atopy Prevention,” Journal of Nutrition.
2008;138:1770S-1772S

25
Health TrendsAllergy Report 2011
Quest Diagnostics
As Figure 7 illustrates, our analysis found that the first food allergies to appear are often egg and milk. Other studies demonstrate that allergies to wheat and soy become more prevalent later, at 5 to 6 years of age.47,48
Our analysis found that
the first food allergies
to appear are often
egg white and milk,
affecting up to 37% of
infants and toddlers.
egg white: Our analysis found that up to 37% of infants and toddlers who presented to their physician for allergy testing had sensitization to egg white. After the age of 3, however, the rate plummeted. This data is consistent with other research that suggests most young children outgrow egg white allergies.49
Milk: Milk sensitization increased sharply in the early years of life, affecting about 36% of the 3-year-olds tested, then declined markedly, perhaps as children’s bodies adjusted to the introduction of cow’s milk into the diet.
Peanuts: In the U.S., peanuts and tree nuts are the most common cause of fatal and near-fatal allergic reactions to food.50,51 As our data illustrates, approximately 30% of children 5 years or younger had peanut sensitization. Peanuts were the most common source of food sensitization in children 6 to 18 years of age, affecting nearly 1 in 4 children. Yet, peanut sensitization is even more prevalent in children 5 years of age and younger, affecting about 30% of children in this age group. Our data suggests peanut allergies remain an important health concern for children.
FIgUre 7. Ige SeNSITIzATION rATe FOr FOOD ALLergIeS IN CHILDHOOD
0
5
10
15
20
25
30
35
40SoybeanPeanut WheatMilkEgg White
0 1 2 3 4 5 6 7 8 9 10 11 12 13 14 15 16 17 18
IGE
SEN
SITI
ZATI
ON
RAT
E
AGE (YEARS)Source: Quest Diagnostics Health Trends™

Quest Diagnostics
26
Health Trends Allergy Report 2011
Our analysis also suggests that peanut sensitization among children grew during the 4 years we examined. Among children from birth to 8 years, the sensitization rate increased slightly, by 1.8%. Among those 9 to 18 years, the sensitization rate rose 1.0%. These findings complement observations made by telephone surveys over an 11-year period (1997-2008) that suggest peanut allergies are rising among children.52
While we primarily focused on children, we also observed that peanut sensitization among adults 19 to 70 years declined by 7.6% over the same period. This finding contrasts with telephone studies that showed peanut allergies are stable among adults.52
wheat: The sensitization rate for wheat increased slowly and steadily in patients tested through the age of 10 years, when nearly 1 in 4 (23%) children tested demonstrated sensitization. Thereafter, the sensitization rate gradually declined. A study that followed children found a resolution rate (sensitivity to the allergen declined to a non-allergic level) of 65% by age 12 years.53 By comparison, many of the children in our data set may have been newly diagnosed after early childhood.
Soybeans: Soybean sensitization was the least affected by age, hovering around 16% to 18% through age 12. Soybean sensitization dropped in patients during the teen years, but at a modest pace relative to that observed for the other foods analyzed.
Nearly 1 in 4 children
tested 6 to 18 years of age
demonstrated allergen
sensitization to peanuts.
Surprising Trends in food Sensitization in Adults
While children sometimes outgrow food allergies before reaching adulthood, many individuals suffer from food allergies as adults. We found evidence that sensitization to certain foods may be increasing more rapidly among adults than children.
Over the 4 years we examined, the rate of sensitization to milk grew by about 25% in patients 19 to 70 years of age (from 4.1% to 5.1%).
In the case of egg white, the sensitization rate increased 19% among adults 19 to 70 years of age (from 3.8% to 4.5%).

27
Health TrendsAllergy Report 2011
Quest Diagnostics
Evolution from Food to Environmental Allergens
As the allergy march progresses, a child’s sensitization to foods often evolves to include sensitization to environmental and other allergens. Our analysis suggests a distinct pattern emerges with age, with young patients showing greater likelihood of sensitization to foods than adults. Adults, in contrast, were more likely to test positive to environmental allergens than children (Figure. 8).
Specifically, while food sensitization declined after the age of 8, sensitization to all other allergens strongly increased in children 9 to 12 years of age. Sensitization to house dust mites, cats and dogs, and common ragweed allergens remained at high levels through the age of 40, while mold sensitization steadily declined in patients after the age of 12 years (Figure. 8). These data are consistent with other research suggesting environmental allergen sensitization is more common in older children and adults.
As the allergy march
progresses, a child’s
sensitization to foods
often evolves to
include sensitization to
environmental and other
allergies.
FIgUre 8. Ige SeNSITIzATION rATe bY ALLergeN grOUP
0
5
10
15
20
25
30
35
40
45
Common Ragweed Mold House Dust MitesFood Cats and Dogs
0–2 3–8 9–12 13–18 19–29 30–39 40–49 50–59 60–70
IGE
SEN
SITI
ZATI
ON
RAT
E (%
)
AGE GROUP
Source: Quest Diagnostics Health Trends™

Quest Diagnostics
28
Health Trends Allergy Report 2011
link beTween AlleRgieS AnD ASTHMA
key findings:
• OurfindingssupporttheNAEPPrecommendationsthatcliniciansand patients identify and minimize exposure to environmental allergens that may aggravate asthma.
• Patientswithasthmawere20%morelikelytoshowsensitizationto1or more allergens than patients who were not identified as having asthma.
• Ourstudyfoundastrongerlinkbetweenasthmaandindoorallergens, such as mold, cats and dogs, and house dust mites, compared to food and ragweed allergens.
• Patientswithasthmahadmoreallergies.Onaverage,patientswithasthmawere sensitive to 4.1 allergens as compared to 3.4 for patients who were not identified as having asthma.
For many patients, the final phase of the allergy march is the development of asthma.54 Asthma is a respiratory disease marked by acute and chronic inflammation causing swelling and narrowing throughout the respiratory system. Reactions can trigger coughing, wheezing, chest tightness, and shortness of breath.
An estimated 24.6 million Americans suffer from asthma (1 in 12 Americans).55 It is the most common chronic childhood disease,56 affecting nearly 1 in 10 children.55
Allergy-induced asthma is the most common type of asthma in the United States. The same mechanisms in the body that activate allergy symptoms can also cause inflammation of the lungs, leading to asthma symptoms. Recurrent exposure to airborne allergens can trigger additional inflammatory responses in the lungs, contributing to a more chronic form of inflammation in the airway, leading to chronic asthma.
To explore the link between allergies and asthma, we compared sensitization rates of provider-reported asthmatic patients to those of patients who were not reported to have asthma. When ordering laboratory testing, physicians typically report associated or suspected medical conditions as classified by ICD-9 diagnostic codes. Approximately 6% of the patients tested for allergies were identified by their physicians as having asthma.
Our analysis reinforces the strong association between allergies, especially indoor allergies, and asthma.57 We found that 53% of patients with asthma were positive for 1 or more of the allergens studied as compared to 44% for patients who were not identified as having asthma. This suggests that asthmatic patients who were tested for allergies were 20% more likely to have allergen sensitization than patients who did not have asthma.
Allergy and asthma go
hand-in-hand. Allergy
is linked to asthma
development in childhood
via the allergy march.
Allergies are also
associated with
asthma severity.
— Harvey w. kaufman, M.D. Senior medical Director
Quest Diagnosticsmadison, NJ
29
Health TrendsAllergy Report 2011
Quest Diagnostics
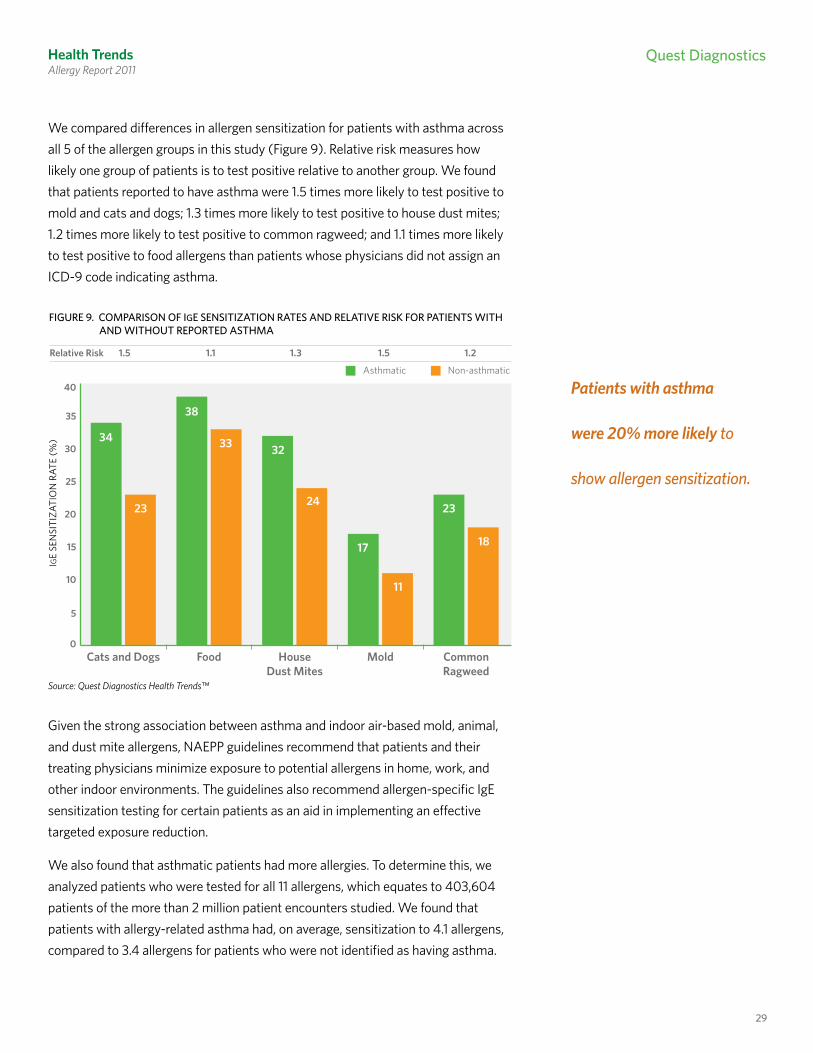
We compared differences in allergen sensitization for patients with asthma across all 5 of the allergen groups in this study (Figure 9). Relative risk measures how likely one group of patients is to test positive relative to another group. We found that patients reported to have asthma were 1.5 times more likely to test positive to mold and cats and dogs; 1.3 times more likely to test positive to house dust mites; 1.2 times more likely to test positive to common ragweed; and 1.1 times more likely to test positive to food allergens than patients whose physicians did not assign an ICD-9 code indicating asthma.
Patients with asthma
were 20% more likely to
show allergen sensitization.
Given the strong association between asthma and indoor air-based mold, animal, and dust mite allergens, NAEPP guidelines recommend that patients and their treating physicians minimize exposure to potential allergens in home, work, and other indoor environments. The guidelines also recommend allergen-specific IgE sensitization testing for certain patients as an aid in implementing an effective targeted exposure reduction.
We also found that asthmatic patients had more allergies. To determine this, we analyzed patients who were tested for all 11 allergens, which equates to 403,604 patients of the more than 2 million patient encounters studied. We found that patients with allergy-related asthma had, on average, sensitization to 4.1 allergens, compared to 3.4 allergens for patients who were not identified as having asthma.
FIgUre 9. COmPArISON OF Ige SeNSITIzATION rATeS AND reLATIve rISK FOr PATIeNTS wITH AND wITHOUT rePOrTeD ASTHmA
IGE
SEN
SITI
ZATI
ON
RAT
E (%
)
1.5Relative Risk 1.1 1.3 1.5 1.2
0
5
10
15
20
25
30
35
40
Non-asthmaticAsthmatic
CommonRagweed
MoldHouseDust Mites
FoodCats and Dogs
34
23
38
33 32
17
11
23
18
24
Source: Quest Diagnostics Health Trends™

Quest Diagnostics
30
Health Trends Allergy Report 2011
DiSADvAnTAgeD cHilDRen: DelAYeD DiAgnoSiS
key findings:
• Children5yearsofageandyoungerenrolledinMedicaidwere18%lesslikelytobetested than children of the same age group covered by private health insurance.
• Children6to12yearsofageenrolledinMedicaidwere20%morelikelytobetested than children in the same age group covered by private health insurance.
• The observed delay in testing for younger children in Medicaid suggests that disadvantaged children may be less likely to be tested at early ages when prompt diagnosis and treatment may offset the potential for the allergy march.
Given the importance of early diagnosis and treatment for arresting the allergy march, we were interested in discerning if there are disparities in the diagnosis of allergies among children from birth to 12 years of age.
We compared testing rates for children with private health insurance and government-administered Medicaid plans. Enrollment in Medicaid, which provides health coverage for low-income patients, has grown in recent years, reaching about 50 million enrollees in 2010.58
While we found that the likelihood of testing positive to an allergen was roughly equivalent across the 2 types of health insurance, children from birth to 5 years of age enrolled in Medicaid were 18% less likely to be tested than children of the same age group enrolled in a private health insurance plan (117 tests per 1,000 total Medicaid patient encounters versus 142 tests per 1,000 for private insurance) (Figure 10).
At older ages, the pattern reversed. Children 6 to 12 years of age covered by Medicaid were tested about 20% more than children in the same age group covered by a private health insurance plan (125 tests per 1,000 total Medicaid patient encounters versus 104 tests per 1,000 for private insurance).
This novel finding suggests that testing may be delayed for economically disadvantaged children during the critical early years of life. Delayed testing may have important long-term consequences for the health of children and a significant impact on the healthcare system.
Economically
disadvantaged children
were less likely to be
tested by the age of
5 than economically
advantaged children.

31
Health TrendsAllergy Report 2011
Quest Diagnostics
“Quest Diagnostics’s
findings provide compelling
evidence that economically
disadvantaged children
are less likely to receive the
level of health care that can
promote favorable outcomes.
This research should prompt
policy makers, physicians,
and, of course, parents to
consider how different types
of health plans may impact
the quality of the health
services our children receive.” — gary Puckrein, Ph.D.,
executive Director, Alliance of minority medical Associations, washington, D.C.
Children with a delayed allergy diagnosis may be more likely to advance along the allergy march and develop allergy-related complications that include asthma. Moreover, research suggests that interventions, when implemented early, can reduce the risk that a child with allergies will develop asthma.59
Our data provides compelling evidence of disparities in testing between those who are enrolled in a private health plan and those enrolled in Medicaid. These findings align with other research that suggests minority children suffer disproportionately higher rates of asthma. Access to care is hampered by socioeconomic disparities, shortages of primary care physicians in minority communities, and language and literacy barriers, among other factors.60
Additional research is needed to determine if the disparities observed in our study are due to differences in the quality of healthcare available through government and private health insurance carriers, or to behaviors attributed to patients’ social or economic conditions. Until such research is performed, healthcare providers and policy makers should be aware of the potential for adverse short- and long-term health effects caused by testing disparities for children in Medicaid.
FIgUre 10. COmPArISON OF ImmUNOCAP TeSTINg rATe FOr meDICAID AND PrIvATe INSUrANCe
TEST
ING
RAT
E(IM
MU
NO
CAP
TEST
S PE
R 1,0
00 Q
UES
T D
IAG
NO
STIC
PAT
IEN
TS)
0
20
40
60
80
100
120
140
160
Private InsuranceMedicaid
Patients 6–12 yrsPatients 0–5 yrs
117
142
125
104
Source: Quest Diagnostics Health Trends™

Quest Diagnostics
32
Health Trends Allergy Report 2011
cHAnging PHYSiciAn TeSTing PATTeRnS
Primary Care Physicians Play a Larger Role in Diagnosing Allergies
key findings:
• Increasingly,allergiesarebeingdiagnosedbypediatriciansandotherprimarycare physicians, whose ordering of ImmunoCAP grew 46% and 49%, respectively, over the 4-year period.
• NewYork,NewJersey,Washington,Oregon,andIdaholedthecountryintheadoption of blood-based allergy testing, while the mid-Atlantic, Great Lakes, Mountain, and Plains States lagged behind.
• ThesefindingssuggestthatadvancesinreliableIgEbloodtestsarechangingclinical practice by enabling pediatricians and other primary care physicians to test patients suspected of having allergies, rather than referring these patients to allergists. However, significant regional differences exist in testing practices.
Early detection of allergies can facilitate early treatment – a step that may help to prevent the allergy march and avoid potentially severe complications, including asthma.61–65
Our data indicates that the number of pediatricians ordering allergen-specific IgE blood-based tests through our laboratories grew by 46% during the 4-year period (Figure 11). By the end of our study, 1 in 3 pediatricians was using the test (Figure 12).
Early detection of
allergies can facilitate
early treatment – a step
that may help to prevent
the allergy march and
avoid potentially
severe complications,
including asthma.
FIgUre 11. grOwTH IN NUmber OF PHYSICIANS OrDerINg ImmUNOCAP
PERC
ENT
GRO
WTH
0
10
20
30
40
50
60
AllergistsPediatriciansPrimary Care Physicians
4946
23
Source: Quest Diagnostics Health Trends™
33
Health TrendsAllergy Report 2011
Quest Diagnostics
Advances in
diagnostics are
allowing pediatricians
and other primary
care physicians to
increasingly test their
patients for allergies.
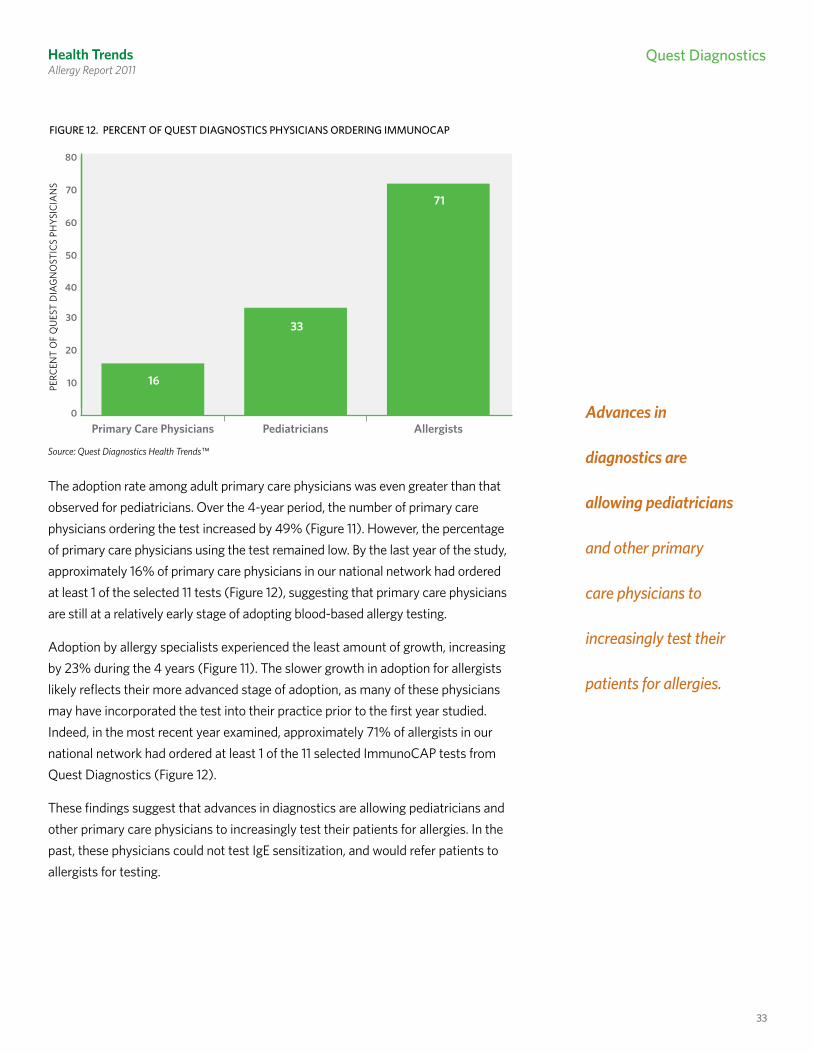
The adoption rate among adult primary care physicians was even greater than that observed for pediatricians. Over the 4-year period, the number of primary care physicians ordering the test increased by 49% (Figure 11). However, the percentage of primary care physicians using the test remained low. By the last year of the study, approximately 16% of primary care physicians in our national network had ordered at least 1 of the selected 11 tests (Figure 12), suggesting that primary care physicians are still at a relatively early stage of adopting blood-based allergy testing.
Adoption by allergy specialists experienced the least amount of growth, increasing by 23% during the 4 years (Figure 11). The slower growth in adoption for allergists likely reflects their more advanced stage of adoption, as many of these physicians may have incorporated the test into their practice prior to the first year studied. Indeed, in the most recent year examined, approximately 71% of allergists in our national network had ordered at least 1 of the 11 selected ImmunoCAP tests from Quest Diagnostics (Figure 12).
These findings suggest that advances in diagnostics are allowing pediatricians and other primary care physicians to increasingly test their patients for allergies. In the past, these physicians could not test IgE sensitization, and would refer patients to allergists for testing.
FIgUre 12. PerCeNT OF QUeST DIAgNOSTICS PHYSICIANS OrDerINg ImmUNOCAP
PERC
ENT
OF
QU
EST
DIA
GN
OST
ICS
PHYS
ICIA
NS
0
10
20
30
40
50
60
70
80
AllergistsPediatriciansPrimary Care Physicians
16
33
71
Source: Quest Diagnostics Health Trends™

Quest Diagnostics
34
Health Trends Allergy Report 2011
Adoption of Blood-Based Allergy Testing Varies by Region
Our analysis found significant geographical differences in the adoption of blood-based allergy testing. We developed an adoption index that compares the testing rates for ImmunoCAP ordered through our laboratories across different geographic regions (Figure 13). Specifically, we analyzed the total number of tests ordered in each region while controlling for differences in the sensitization rates for each region. A value of 50 is equivalent to the average rate of testing for the U.S. Values above 50 indicate physicians in a region are more likely to order the test than the national average; values below 50 indicate less frequent use of the test than the national average.
As Figure 13 indicates, the New York-New Jersey and Pacific Northwest regions (Region II and X) led the country in the adoption of blood-based allergy testing, with adoption scores of 83 and 81, respectively. Western states, including Arizona, California, Hawaii, and Nevada, were above the national average, but at a much lower score of 67.
The mid-Atlantic, Great Lakes, Plains States, and Mountain regions (Regions III, V, VII and VIII) lagged far behind the rest of the country in the use of ImmunoCAP testing. All other regions were near the national average.
The New York-New Jersey
and Pacific Northwest
regions led the country in
the adoption of blood-based
allergy testing.FIgUre 13. QUeST DIAgNOSTICS ADOPTION INDex* bY regION**
High
Low
REGION X81
REGION IX67
REGION VIII27
REGION VII20
REGION V24
REGION VI49
REGION IV51
REGION III23
REGION II83
REGION I56
*Quest Diagnostics Adoption Index =
where Z is a standard normal random variable measuring the ratio of the ImmunoCAP testing rate to the ImmunoCAP allergen sensitization rate in the defined HHS regions.
** Alaska and Hawaii not shown. See page 14 for definitions of geographical regions.
100 × Prob(Z≤x) = 100√2π
x∫ e0
–—12
t2
dt, ∈(0,100),
Source: Quest Diagnostics Health Trends™

35
Health TrendsAllergy Report 2011
Quest Diagnostics
ReSeARcH MeTHoDologY
Study ObjectiveOur objective was to identify patterns and trends in allergen sensitization that may improve the diagnosis, treatment, and management of patients with allergies.
We assessed:1. The prevalence of sensitization to 11 allergens by geographic region and in 30
major metropolitan areas of the U.S. 2. Trends over time in allergen sensitization.3. Differences in allergen sensitization by age and gender.4. The effects of allergies on children, including insights into the “allergy march,”
an insidious pattern of disease whereby allergic sensitization can increase a child’s risk of developing other allergies and asthma later in life.
5. The link between allergen sensitization and asthma.6. The impact of socioeconomic status on testing of children.7. How the widespread availability of blood-based testing is changing the way
allergies are diagnosed.
Quest Diagnostics Health Trends Reports
Quest Diagnostics maintains the largest private clinical laboratory data warehouse in the United States. Consisting of data on more than 1.5 billion patient encounters since January 2000, the database provides laboratory information on the vast majority of conditions and diseases affecting Americans today. Quest Diagnostics Health Trends reports are designed to identify and track disease and wellness benchmarks to inform patients, healthcare professionals, and policy makers about the current status of the nation’s health.
Allergies Across America - Study Population
In this study, we analyzed nearly 13.9 million de-identified test results from more than 2 million patient encounters between 2005 and 2008. A patient encounter refers to any instance where an individual patient was tested at least once for 1 or more of the 11 common allergens by Quest Diagnostics. Our analysis included patients of both genders from birth to 70 years of age residing in every U.S. state and the District of Columbia. The procedures used to de-identify the test results were approved by the Western Institutional Review Board.
We analyzed nearly 13.9
million de-identified test
results from more than
2 million patient encounters
over a 4-year period.

Quest Diagnostics
36
Health TrendsAllergy Report 2011
Each test result identified sensitization to 1 or more of 11 common allergens. These were 5 foods (egg white, milk, peanut, soybean, and wheat), common ragweed, mold, 2 types of house dust mites (Dermatophagoides pteronyssinus and D. farinae), cat epithelia (skin), and dog dander. We did not include in our analysis hundreds of less common allergens, including certain region-specific allergens.
Some of the test results we analyzed were ordered as part of an allergy panel, while others were specifically selected by the ordering physician. As a result, not all patients had the same set of tests. On average, 6.4 allergen-specific tests were performed on each patient. In addition, some patients may have been tested for more than the 11 allergens included in this study, and the results of these other allergen-specific tests were excluded from our analysis.
Since the study does not track individual patients longitudinally, any age- related patterns are only observed for a cross-section of the population and do not necessarily imply that sensitization of specific individuals changed over the study period.
The study population is broadly representative of the overall population of patients seeking medical care for allergy-like symptoms from healthcare professionals in the U.S. No adjustments were made to reflect the U.S. population overall. The composition of the study population did not change significantly by age, gender, geography, and physician-reported diagnosis code during the 4 years. Our observations may have been affected by other changes in the study population, including ethnicity, education, and income, that we were unable to evaluate. No clinical data other than the provider-reported diagnoses (ICD-9 diagnostic codes) were included in the study.
37
Health TrendsAllergy Report 2011
Quest Diagnostics
conTRibUToRS
This report was developed by a team of Quest Diagnostics medical and informatics experts and writers, including Harvey W. Kaufman, M.D., Mouneer A. Odeh, Wendy H. Bost, and Pradeep Ragothaman, Ph.D.
We also wish to acknowledge the contributions of certain Quest Diagnostics colleagues, most notably Jon R. Cohen, M.D., Stanley J. Naides, M.D., Xiaohua X. Huang, and Robert W. Jones.
In addition, we wish to extend our sincere gratitude to our outside contributors* who helped inform the direction of our analysis:
• Paul Ehrlich, M.D., Assistant Clinical Professor, Pediatrics, New York University, New York, New York.
• Andrew H. Liu, M.D., Associate Professor, Allergy and Clinical Immunology, National Jewish Health, Denver, Colorado.
• Gary Puckrein, Ph.D., Executive Director, Alliance of Minority Medical Associations, Washington, D.C.
• Julie Wang, M.D., Assistant Professor, Pediatrics, Allergy and Immunology, Mount Sinai School of Medicine, New York, New York.
* These experts or their designated institutions were provided consulting fees in recognition of their contributions to this report.
for more information on immunocAP:QuestDiagnostics.com/ImmunoCAP IsItAllergy.com Phadia.com
for other Quest Diagnostics Health Trends Reports: QuestDiagnostics.com/HealthTrends
Quest, Quest Diagnostics, any associated logos and all associated Quest Diagnostics registered and unregistered trademarks are the property of Quest Diagnostics. All third party marks – ® and ™ – are the property of their respective owners. © 2011 Quest Diagnostics Incorporated. All rights reserved.

38
Health Trends Allergy Report 2011
RefeRenceS
1 CDC Fast Facts A-Z, Vital Health Statistics, 2003. Asthma and Allergy Foundation of America website aafa.org. Accessed April 15, 2011.
2 Williams PB, Barnes JH, Steinbach SL, Sullivan T. Analytical precision and accuracy of commercial immunoassays for specific IgE: establishing a standard. J Allergy Clin Immunol. 2000;105:1221-30.
3 Johansson SGO. ImmunoCAP® specific IgE test: an objective tool for research and routine allergy diagnosis. Expert Rev Mol Diagn. 2004;4:273-79.
4 Sears MR, Herbison GP, Holdaway MD, Hewitt CJ, Flannery EM, Silva PA. The relative risk of sensitivity to grass pollen, house dust mite and cat dander in the development of childhood asthma. Clin Exp Allergy. 1989;19:19-24.
5 Gergen PJ, Turkeltaub PC. The association of individual allergen reactivity with respiratory disease in a national sample: data from the second National Health and Nutrition Examination Survey, 1976-1980 (NHANES II). J Allergy Clin Immunol. 1992;90:579-88.
6 Expert Panel Report 3: Guidelines for the Diagnosis and Management of Asthma. The National Asthma Education and Prevention Program (NAEPP), National Heart Lung and Blood Institute, 2007.
7 American College of Allergy, Asthma & Immunology website acaai.org. Accessed April 15, 2011.
8 Branum AM, Lukacs SL. Food allergy among U.S. children: Trends in prevalence and hospitalizations. NCHS data brief number 10. Hyattsville, MD: National Center for Health Statistics, 2008.
9 Meltzer EO, Blaiss MS, Derebery MJ, et al. Burden of allergic rhinitis: results from the Pediatric Allergies in America survey. J Allergy Clin Immunol. 2009;124(Suppl 1):S43-70.
10 Diesner SC, Untersmay E, Pietschmann P, Jensen-Jarolim E. Food allergy: only a pediatric disease? Gerontology. 2011;57:28-32.
11 Burton WN, Conti DJ, Chen CY, Schultz AB, Edington DW. The impact of allergies and allergy treatment on worker productivity. J Occup Environ Med. 2001;43:64-71.
12 Chronic Conditions: A Challenge for the 21st Century. National Academy on an Aging Society, 1999.
13 Chafen JJ, Newberry SJ, Riedl MA, et al. Diagnosing and managing common food allergies: a systematic review. JAMA. 2010;303:1848-56.
14 Sampson H, Ho DG. Relationship between food-specific IgE concentrations and the risk of positive food challenges in children and adolescents. J Allergy Clin Immunol. 1997;100:444-51.
15 Sampson H. Utility of food-specific IgE concentrations in predicting symptomatic food allergy. J Allergy Clin Immunol. 2001;107:891-6.
16 Dolen WK. IgE antibody in the serum – detection and diagnostic significance. Allergy. 2003;58:717-23.
17 Yunginger JW, Ahlstedt S, Eggleston PA, et al. Quantitative IgE antibody assays in allergic diseases. J Allergy Clin Immunol. 2000;105:1077-84.
18 ImmunoCAP IgE package insert. Phadia, Inc.: Kalamazoo, MI. Issued November 2004. Revised May 2005.
19 Johansson SG, Yman L. In vitro Assays for Immunoglobulin E. Methodology, indications, and interpretation. Clin Rev Allergy. 1988;6:93-139.
20 Wang J, Godbold JH, Sampson HA. Correlation of serum allergy (IgE) tests performed by different assay systems. J Allergy Clin Immunol. 2008;121:1219-24.
21 Sicherer SH, Sampson HA. Food allergy: recent advances in pathophysiology and treatment. Annual Rev Med. 2009;60:261-77.
22 Bernstein JM, Gorfien J, Noble B. Role of allergy in nasal polyposis: a review. Otolaryngol Head Neck Surg. 1995;113:724-32.
23 Döner F, Yariktas M, Demirci M. The role of allergy in recurrent otitis media with effusion. J Invest Allergy Clin Immunol. 2004;14:154-58.
24 Wallace DV, Dykewicz MS, Bernstein DI, et al. The diagnosis and management of rhinitis: an updated practice parameter. J Allergy Clin Immunol. 2008;122:S1-84.
25 Rhodes HL, Sporik R, Thomas P, et al. Early life risk factors for adult asthma: a birth cohort study of subjects at risk. J Allergy Clin Immunol. 2001;108:720-25.
26 Woods RK, Thien F, Raven J, et al. Prevalence of food allergies in young adults and their relationship to asthma, nasal allergies, and eczema. Ann Allergy Asthma Immunol. 2002;88:183-89.
27 Beausoleil JL, Fiedler J, Spergel JM. Food intolerance and childhood asthma: what is the link? Paediatr Drugs. 2007;9:157-63.
28 Boyce JA, Assa’ad A, Burks AW, Jones SM, Sampson HA, Wood RA, Plaut M, Cooper SF, Fenton MJ. Guidelines for the diagnosis and management of food allergy in the United States: summary of the NIAID-sponsored expert panel report. J Asthma Clin Immunol. 2010;126:1105-18.
29 Asthma and Allergy Foundation of America website www.aafa.org, Accessed April 15, 2011.
30 Arbes SJ Jr, Gergen PJ, Elliott L, Zeldin DC. Prevalences of positive skin test responses to 10 common allergens in the US population: results from the Third National Health and Nutrition Examination Survey. J Allergy Clin Immunol. 2005;116:377-83.
31 Ziska L, Knowlton K, Rogers C, et al. Recent warming by latitude associated with increased length of ragweed pollen season in central North America. PNAS. 2011;108:4248-4251.
32 Gautrin D, Vandenplas O, DeWitte JD, et al. Allergenic exposure, IgE-mediated sensitization, and related symptoms in lawn cutters. J Allergy Clin Immunol. 1994 Feb;93(2):437-45.

Quest Diagnostics
Des
ign:
Reg
ardi
ngx.
com
33 National Center for Environmental Health, cited on CDC.gov/nceh. Updated February 8, 2010.
34 Arshad SH, Tariq SM, Matthews S, Hakim E. Sensitization to common allergens and its association with allergic disorders at age 4 years: a whole population birth cohort study. Pediatrics. 2001;108;E33.
35 De Swert LF. Risk factors for allergy. Eur J Pediatr. 1999;158: 89-94.
36 Kelly C, Gangur V. Sex Disparity in Food Allergy: Evidence from the PubMed Database. J Allergy (Cairo). 2009;2009:1-7.
37 Bernzweig J, Takayama JI, Phibbs CS, Lewis C, Pantell RH. Gender differences in physician-patient communication: evidence from pediatric visits. Arch Ped Adolesc Med. 1997;151:586-91.
38 Xu KT, Borders TF. Gender, health, and physician visits in the United States. Am J Public Health. 2003;93:1076-79.
39 Schappert SM, Burt CW. Vital Health Stat 13. Ambulatory care visits to physician offices, hospital outpatient departments, and emergency departments: United States, 2001-02. Vital Health Stat. Series 13, Data from the National Health Survey. 2006;159:1-66.
40 Rolinck-Werninghaus C, Keil T, Kopp M, et al. Specific IgE serum concentration is associated with symptom severity in children with seasonal allergic rhinitis. Allergy. 2008;63:1339-44.
41 Nalebuff DJ, Fadal RG, and Ali M. The study of IgE in the diagnosis of allergic disorders in an otolaryngology practice. Otolaryngol Head Neck Surg. 1978;87:351-58.
42 Liu AH, Jaramillo R, Sichere SH, et al. National prevalence and risk factors for food allergy and relationship to asthma: results from the National Health and Nutrition Examination Survey 2005-2006. J Allergy Clin Immunol. 2010;126:798-806.
43 Kjellman NI, Nisson L. From food allergy and atopic dermatitis to respiratory allergy. Pediatr Allergy Immunol. 1998;9(Suppl 11):13-17.
44 Liu AH. The allergic march of childhood. Med Sci Update. 2006;23:1-7.
45 Sampson HA, Eigenmann PS, Sicherer SH, Borkowski TA, Cohen BA. Prevalence of IgE-mediated food allergy among children with atopic dermatitis. Pediatrics. 1988;101:e8.
46 Eigenmann PA, Calza AM. Diagnosis of IgE-mediated food allergy among Swiss children with atopic dermatitis. Pediatr Allergy Immunol. 2000;11:95-100.
47 Liu AH, Taussig LM. Natural history of allergic diseases and asthma. In: Leung DYM, Sampson H, Geha R, eds. Pediatric Allergy: Principles and Practice. 1st Edition. St. Louis, MO: Mosby; 2003:10-22.
48 Wahn U. What drives the allergic march? Allergy. 2000;55:591-99.
49 Boyano Martinez T, García-Ara C, Díaz-Pena JM, Muñoz FM, García Sánchez G, Esteban MM. Validity of specific IgE antibodies in children with egg allergy. Clin Exp Allergy. 2001;31:1464-69.
50 Sicherer S, Sampson SA. Peanut allergy: emerging concepts and approaches for an apparent epidemic. J Allergy Clin Immunol. 2007;120:491-503.
51 Pansare M, Kamat D. Peanut allergies in children – a review. Clin Ped. 2009;48:709-14.
52 Sicherer SH, Muñoz-Furlong A, Goldbold JH, Sampson SA. US prevalence of self-reported peanut, tree nut, and sesame allergy: 11-year follow up. J Allergy Clin Immunol. 2010;125:1322-26.
53 Keet CA, Matsui EC, Dhillon G, Lenehan P, Paterakis M, Wood RA. The natural history of wheat allergy. Ann Allergy Asthma Immunol. 2009;102:410-15.
54 Spergel JM. From atopic dermatitis to asthma: the atopic march. Ann Allergy Asthma Immunol. 2010;105:99-106.
55 Asthma Prevalence, Disease Characteristics, and Self-Management Education - United States, 2001--2009. CDC, Morbidity and Mortality Weekly Report (MMWR). 2011;60(17);547-52.
56 Morbidity and Mortality Report, NCHS, U.S. CDC, 2003. Referenced on the Asthma and Allergy Foundation of America website aafa.org. Accessed April 15, 2011.
57 Peden D, Reed CE. Environmental and occupational allergies. J Allergy Clin Immunol. 2010;125(Suppl 2):S150-60.
58 Medicaid Enrollment: June 2010 Data Snapshot. The Kaiser Commission on Medicaid Facts, February 2011.
59 Chan-Yeung M, Ferguson A, Watson W, et al. The Canadian Childhood Asthma Primary Prevention Study: outcomes at 7 years of age. J Allergy Clin Immunol. 2005; 116;49-56.
60 Ethnic Disparities in the Burden and Treatment of Asthma, The Asthma and Allergy Foundation of America and The National Pharmaceutical Council, January 2005.
61 Johnstone D, Dutton A. The value of hyposensitization therapy for bronchial asthma in children—a 14-year study. Pediatrics. 1968;42:793-802.
62 Moller C, Dreborg S, Ferdousi HA, et al. Pollen immunotherapy reduces the development of asthma in children with seasonal rhinoconjunctivitis (the PAT-study). J Allergy Clin Immunol. 2002;109:251-256.
63 Niggemann B, Jacobsen L, Dreborg S, et al. Five-year follow-up on the PAT study: specific immunotherapy and long-term prevention of asthma in children. Allergy. 2006;61:855-9.
64 Adams RJ, Fuhlbrigge AL, Finkelstein JA, Weiss ST. Intranasal steroids and the risk of emergency department visits for asthma. J Allergy Clin Immunol. 2002;109:636-642.
65 Baena-Cagnani CE, Passalacqua G, Baena-Cagnani RC, Croce VH, Canonica WG. Sublingual immunotherapy in pediatric patients: beyond clinical efficacy. Curr Opin Allergy Clin Immunol. 2005;5:173-77.

Quest Diagnostics Health Trends™
Allergy Report 2011
“The Quest Diagnostics Health Trends Report studies the
effect of allergies on a uniquely massive scale. It represents
people across the United States using a highly respected and
standardized laboratory methodology.”— Andrew H. liu, M.D.
Associate Professor Allergy and Clinical Immunology
National Jewish Health Denver, Colorado
For more information, visit www.QuestDiagnostics.com/HealthTrends
©2011 Quest Diagnostics Incorporated. All rights reserved. MI2863 05/2011


Health TrendsAllergy Report 2011
Quest Diagnostics
bACK
FIgUre 1. OverALL Ige SeNSITIzATION rATe
40
42
44
46
48
Year 4Year 3Year 2Year 1
OV
ERA
LL IG
E SE
NSI
TIZA
TIO
N R
ATE
(%)
42.7
43.9
45.0 45.1
Source: Quest Diagnostics Health Trends™ Quest Diagnostics Health Trends® © 2011 Quest Diagnostics

Health TrendsAllergy Report 2011
Quest Diagnostics
FIgUre 2. PerCeNT CHANge IN Ige SeNSITIzATION rATeS IN eNvIrONmeNTAL ALLergeNS Over 4 YeArS
CHA
NG
E IN
IGE
SEN
SITI
ZATI
ON
RAT
ES (%
)
-5
0
5
10
15
20
Common Ragweed Mold House Dust Mites
-3.3
11.6
14.8
bACK
Source: Quest Diagnostics Health Trends™ Quest Diagnostics Health Trends® © 2011 Quest Diagnostics

Health TrendsAllergy Report 2011
Quest Diagnostics
geographicCategory
U.S. Health andHuman Servicesgeographic regions
States
Northeast Region I CT, MA, ME, NH, RI, VTNortheast Region II NJ, NYMid-Atlantic Region III DC, DE, MD, PA, VA, WVSoutheast Region IV AL, FL, GA, KY, MS, NC, SC, TNGreat Lakes Region V IL, IN, MI, MN, OH, WISouthwest Region VI AR, LA, NM, OK, TXPlains States Region VII IA, KS, MO, NEMountain States Region VIII CO, MT, ND, SD, UT, WYSouthwest Region IX AZ, CA, HI, NVPacific Northwest Region X AK, ID, OR, WA
FIgUre 3. regIONAL Ige SeNSITIzATION rATeS FOr COmmON rAgweeD*
REGION X14%
REGION IX21%
REGION VIII21%
REGION VII20%
REGION V21%
REGION VI20%
REGION IV15%
REGION III20%
REGION II20%
REGION I18%
High
Low*Alaska and Hawaii not shown
bACK
Source: Quest Diagnostics Health Trends™ Quest Diagnostics Health Trends® © 2011 Quest Diagnostics

Health TrendsAllergy Report 2011
Quest Diagnostics
FIgUre 4. regIONAL Ige SeNSITIzATION rATeS FOr HOUSe DUST mITeS*
REGION X18%
REGION IX20%
REGION VIII10%
REGION VII16%
REGION V20%
REGION VI22%
REGION IV27%
REGION III23%
REGION II27%
REGION I30%
High
Low*Alaska and Hawaii not shown
geographicCategory
U.S. Health andHuman Servicesgeographic regions
States
Northeast Region I CT, MA, ME, NH, RI, VTNortheast Region II NJ, NYMid-Atlantic Region III DC, DE, MD, PA, VA, WVSoutheast Region IV AL, FL, GA, KY, MS, NC, SC, TNGreat Lakes Region V IL, IN, MI, MN, OH, WISouthwest Region VI AR, LA, NM, OK, TXPlains States Region VII IA, KS, MO, NEMountain States Region VIII CO, MT, ND, SD, UT, WYSouthwest Region IX AZ, CA, HI, NVPacific Northwest Region X AK, ID, OR, WA
bACK
Source: Quest Diagnostics Health Trends™ Quest Diagnostics Health Trends® © 2011 Quest Diagnostics

Health TrendsAllergy Report 2011
Quest DiagnosticsO
VER
ALL
IGE
SEN
SITI
ZATI
ON
RAT
E (%
)
AGE (YEARS)0 10 20 30 40 50 60 70
0
10
20
30
40
50
60
70
FMFIgUre 5. OverALL Ige SeNSITIzATION rATe bY Age AND geNDer
bACK
Source: Quest Diagnostics Health Trends™ Quest Diagnostics Health Trends® © 2011 Quest Diagnostics

Health TrendsAllergy Report 2011
Quest Diagnostics
FIgUre 6. DISTrIbUTION OF PATIeNTS wITH SeNSITIzATION bY Ige QUANTITATION CLASS
0
20
40
60
80
100
Class 6 (>100 Very High)Class 5 (51 - 100 Very High)Class 4 (17.6 - 50 Very High)
Class 3 (3.51 - 17.5 High)Class 2 (0.71 - 3.5 Moderate)Class 1 (0.35 - 0.7 Low)
AGE (YEARS)
0 10 20 30 40 50 60 70
PERC
ENT
bACK
Source: Quest Diagnostics Health Trends™ Quest Diagnostics Health Trends® © 2011 Quest Diagnostics
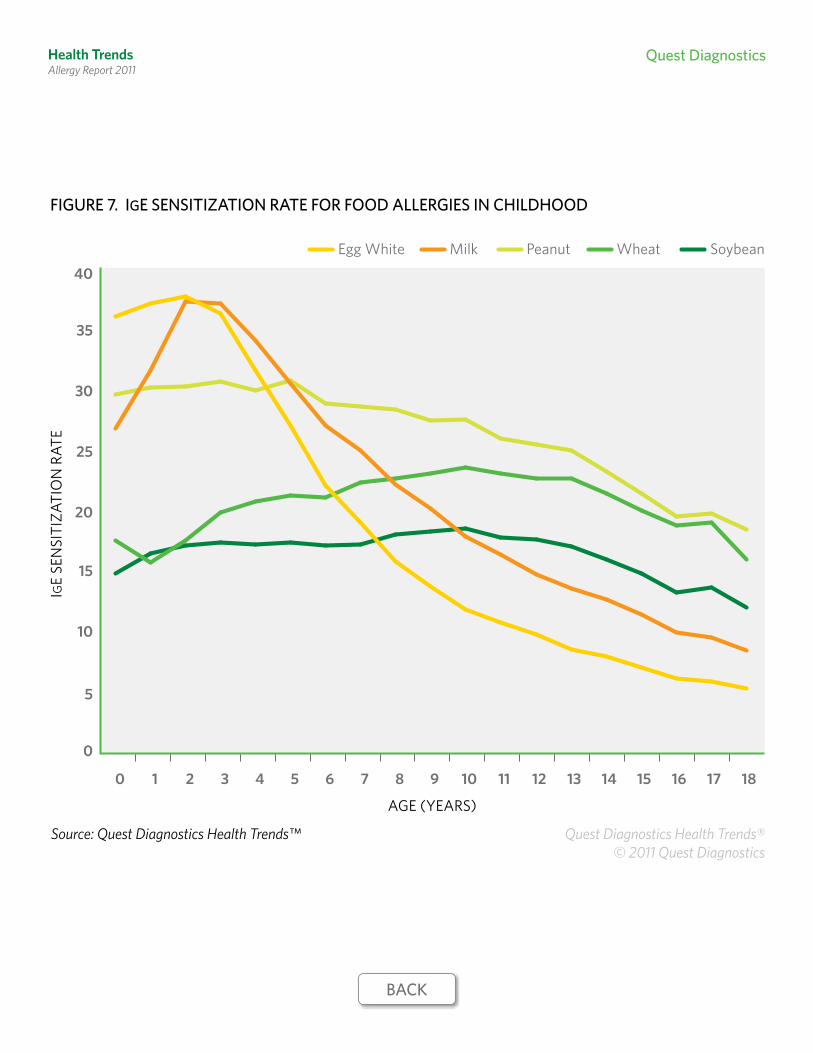
Health TrendsAllergy Report 2011
Quest Diagnostics
FIgUre 7. Ige SeNSITIzATION rATe FOr FOOD ALLergIeS IN CHILDHOOD
0
5
10
15
20
25
30
35
40SoybeanPeanut WheatMilkEgg White
0 1 2 3 4 5 6 7 8 9 10 11 12 13 14 15 16 17 18
IGE
SEN
SITI
ZATI
ON
RAT
E
AGE (YEARS)
bACK
Source: Quest Diagnostics Health Trends™ Quest Diagnostics Health Trends® © 2011 Quest Diagnostics
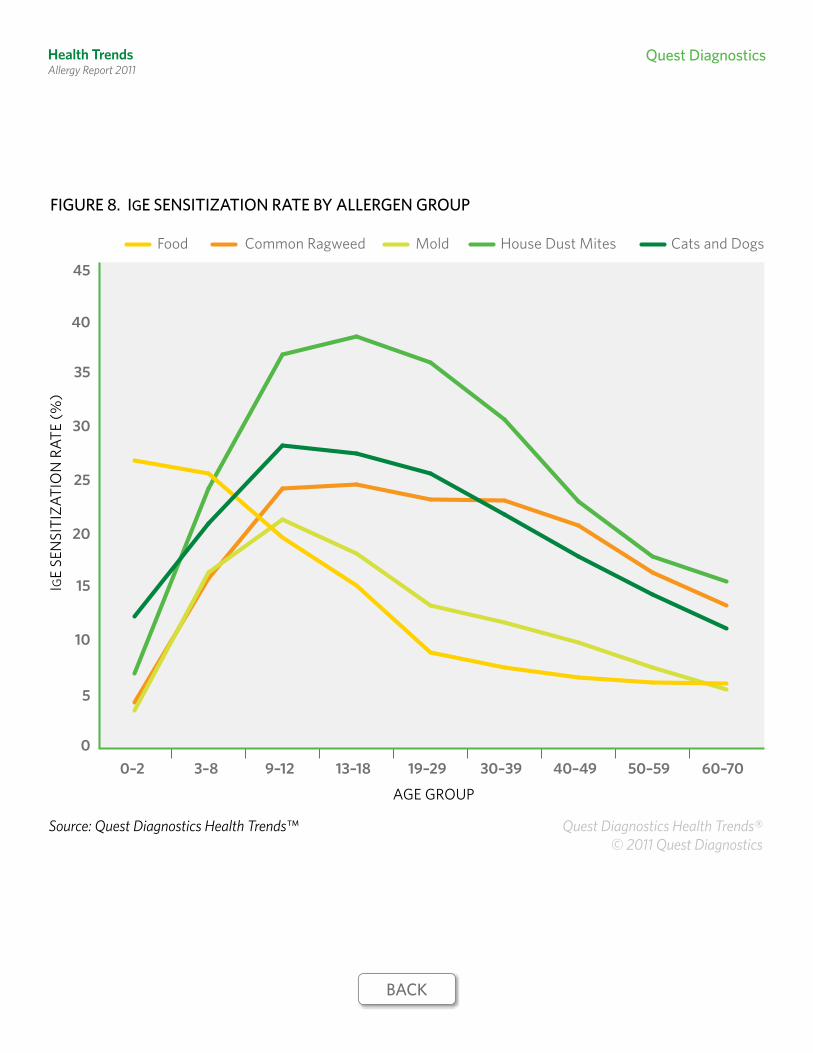
Health TrendsAllergy Report 2011
Quest Diagnostics
FIgUre 8. Ige SeNSITIzATION rATe bY ALLergeN grOUP
0
5
10
15
20
25
30
35
40
45
Common Ragweed Mold House Dust MitesFood Cats and Dogs
0–2 3–8 9–12 13–18 19–29 30–39 40–49 50–59 60–70
IGE
SEN
SITI
ZATI
ON
RAT
E (%
)
AGE GROUP
bACK
Source: Quest Diagnostics Health Trends™ Quest Diagnostics Health Trends® © 2011 Quest Diagnostics

Health TrendsAllergy Report 2011
Quest Diagnostics
FIgUre 9. COmPArISON OF Ige SeNSITIzATION rATeS AND reLATIve rISK FOr PATIeNTS wITH AND wITHOUT rePOrTeD ASTHmA
IGE
SEN
SITI
ZATI
ON
RAT
E (%
)
1.5Relative Risk 1.1 1.3 1.5 1.2
0
5
10
15
20
25
30
35
40
Non-asthmaticAsthmatic
CommonRagweed
MoldHouseDust Mites
FoodCats and Dogs
34
23
38
33 32
17
11
23
18
24
bACK
Source: Quest Diagnostics Health Trends™ Quest Diagnostics Health Trends® © 2011 Quest Diagnostics
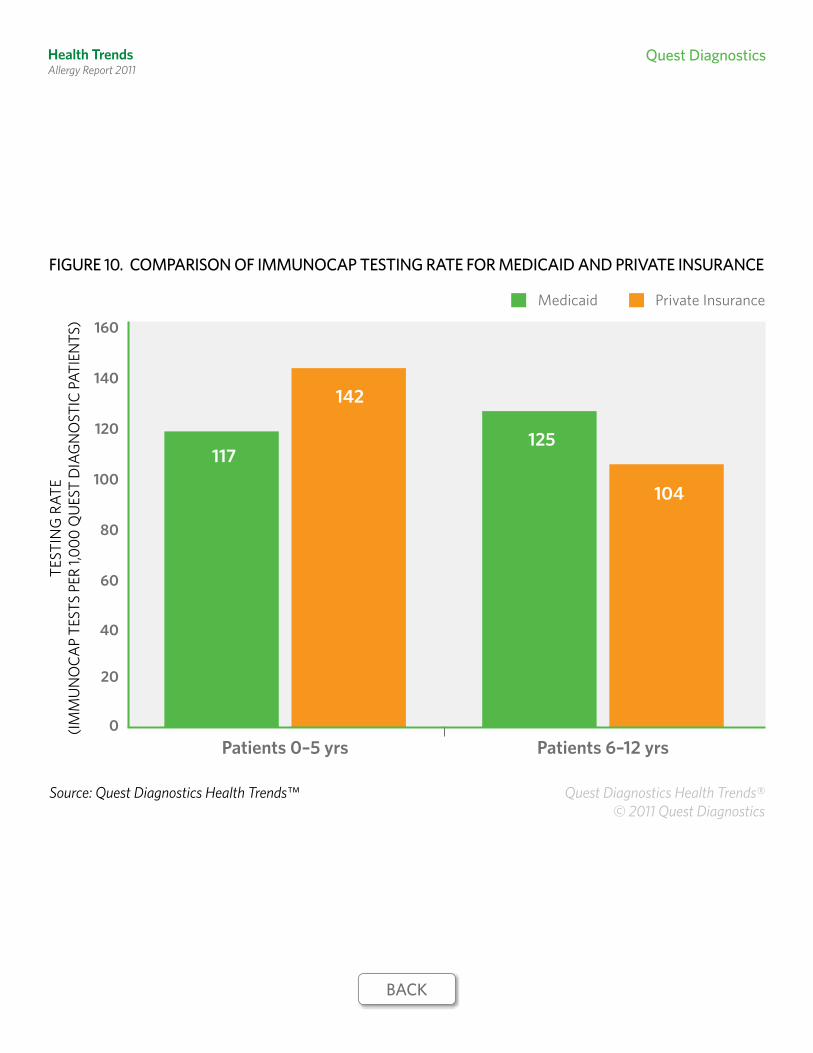
Health TrendsAllergy Report 2011
Quest Diagnostics
FIgUre 10. COmPArISON OF ImmUNOCAP TeSTINg rATe FOr meDICAID AND PrIvATe INSUrANCe
TEST
ING
RAT
E(IM
MU
NO
CAP
TEST
S PE
R 1,0
00 Q
UES
T D
IAG
NO
STIC
PAT
IEN
TS)
0
20
40
60
80
100
120
140
160
Private InsuranceMedicaid
Patients 6–12 yrsPatients 0–5 yrs
117
142
125
104
bACK
Source: Quest Diagnostics Health Trends™ Quest Diagnostics Health Trends® © 2011 Quest Diagnostics

Health TrendsAllergy Report 2011
Quest Diagnostics
FIgUre 11. grOwTH IN NUmber OF PHYSICIANS OrDerINg ImmUNOCAP
PERC
ENT
GRO
WTH
0
10
20
30
40
50
60
AllergistsPediatriciansPrimary Care Physicians
4946
23
bACK
Source: Quest Diagnostics Health Trends™ Quest Diagnostics Health Trends® © 2011 Quest Diagnostics

Health TrendsAllergy Report 2011
Quest Diagnostics
FIgUre 12. PerCeNT OF QUeST DIAgNOSTICS PHYSICIANS OrDerINg ImmUNOCAP
PERC
ENT
OF
QU
EST
DIA
GN
OST
ICS
PHYS
ICIA
NS
0
10
20
30
40
50
60
70
80
AllergistsPediatriciansPrimary Care Physicians
16
33
71
bACK
Source: Quest Diagnostics Health Trends™ Quest Diagnostics Health Trends® © 2011 Quest Diagnostics

Health TrendsAllergy Report 2011
Quest Diagnostics
FIgUre 13. QUeST DIAgNOSTICS ADOPTION INDex* bY regION**
High
Low
REGION X81
REGION IX67
REGION VIII27
REGION VII20
REGION V24
REGION VI49
REGION IV51
REGION III23
REGION II83
REGION I56
*Quest Diagnostics Adoption Index =
where Z is a standard normal random variable measuring the ratio of the ImmunoCAP testing rate to the ImmunoCAP allergen sensitization rate in the defined HHS regions.
** Alaska and Hawaii not shown. See page 14 for definitions of geographical regions.
100 × Prob(Z≤x) = 100√2π
x∫ e0
–—12 t2
dt, ∈(0,100),
bACK
Source: Quest Diagnostics Health Trends™ Quest Diagnostics Health Trends® © 2011 Quest Diagnostics