alonso, william. 1975. location theory. receional ~folic
TRANSCRIPT
REFERENCES
Abramowitz, Milton and Irene A. Stegun {eds.!. 1964.Handbook of Mathematical Functions with Formulas~Gra hs and Mathematical Tables. Washington D. C.:U. S. Government Printing Office.
Alonso, William. 1975. Location Theory. Receional ~FolicReadinces in theory and A lications. John Friedmannand William Alonso eds.!. Cambridge, Massachusetts:The NIT Press.
American Association of Port Authorities. 1984.Unpublished financial survey. Alexandria, Virginia.
Amundsen, Paul A., 1978. Current Trends in PortPricincr Washington, D.C.: C.B. Department of Commerce.
Arlt, Wolfhard H. 1987. Information Requirements inStrategic Planning in the Ports Industry: Specificationand Management of a Data Base. Maritime ~Polic and
Calibrations Predictions. Cambridge: CambridgeUniversity Press.
Bauchet, P. 1983. Financing and charging for seaport andairport infrastructures in France, Maritime ~Polic andMana ement 10, 2: 93-102.
Baumol, William J., John C. Panzar, and Robert D. Willig.1982. Contestable Markets and the ~Theo of IndustrialStructure. New York: Harcourt Brace Jovanovich, Inc.
Bennathan, Ersa and ,A.A. Walters. 1979. Port ~Pricin
Oxford University Press.
Bird, James. 1982a. Transport decision-makers speak'.the Seaport Development in the European CommunitiesResearch Project--Part I. Maritime ~polic and
1982b. Transport. decision-makers speak: theSeaport Development in the European CommunitiesResearch Project--Part II. Maritime ~Polic and
117
1984. Seaport Development: Some Questions ofScale. ~Sea crt ~Seteea and ~Satial Chanche edited byB.S. Hoyle and D. Hilling. New York: John Wiley 6Sons, Ltd.
Blackley, Paul R. 1984. A Hedonic Approach to theDecentralization of Manufacturing Activity. Journal ofReceional Science 24, 4: 541-557.
Blumenhagen, Dietmar. 1981. Containerization and
3: 197-206.
Bobrovitch, Dov. 1982. Decentralised Planning andCompetition in a National Multi-Port System. Journal of
Borcherding, Thomas E. 1985. The Causes of GovernmentExpenditure Growth: A Survey of the U.S. Evidence,Journal of Public Economics 28: 359-382.
Bragaw, Louis K., Henry S. Marcus, Gary C. Raffaele, and
Terminals. Lexington, Massachusetts: Lexington Books.
Branch, Alan E. 1982. Economics of Shi~in~ Practice and
Buchanan, James N. and Gordon Tullock. 1977. TheExpanding Public Sector: Wagner Squared, Public Choice31 Fall!: 147-150.
Button, K.J. 1979. The Economics of Port Pricing.
Caponiti, James E., Chief, Division of Ship OperatingCosts, Maritime Administration, Department ofTransportation. Nay 19, 1988. Telephone conversation.Washington, D. C.
Chang, Semoon, 1978. In Defense of Port Economic ImpactStudies. Trans ortation Journal 17, 3 Spring!: 79-85.
1978. Production Function, Productivities, and,Capacity Utilization of the Port of Mobile. Naritime
Chiang, Alpha C. 1974. Fundamental Methods ofMathematical Economics. New York: NcGraw-Hill BookCompany.
118
Cesario, Frank J., and Jack L. Knetsch. 1985. EconomicBenefits of Developing and Improving Small BoatHarbors. Water Resources Research 21, 9 September!:1303-1306.
Chu, D. K. Y. 1979. The Foreign Non-Fuel Cargo-TrafficDemand of the Major British Seaports in 1980 and 1985,A Narkov Chain Approach. Maritime ~Polic and
Connolly, James J. 1984. Port Pricing; Trend Leans/
35.
Constitution of the United States of America. 1789.
Crandall, Robert W. 1984. Port Pricing--The State ofthe Art. unpublished panel discussion, New Orleans,Louisiana, January 31 � February 2.
~Stud of Port Affairs. London: Sir Isaac Pitman & Sons,Ltd.
Dagenais, Marcel G. and Fernand Martin. 1987.Forecasting Container Traffic for the Port ofMontreal �981-1985!. Trans ortation Research A 21A,1: 1-16.
Davis, H. Craig. 1984. Regional Port Impact Studies: ACritique and Suggested Methodolgy. Trans ortationJournal 23, 2 Winter!: 61-69.
de Borger, B. and W. Nonneman. 1981. Statistical Cost
Economics and ~Polic 15,2 Nay!: 155-155.
de Neufville, Richard, and Koji Tsunokawa. 1981.Productivity and Returns to Scale of Container Ports.
Devanney, J. W. and L. H. Tan. 1975. The Relationshipbetween Short-Run Pricing and Investment Timing: ThePort. Pricing and Expansion Example. Trans ortationResearch 9: 329-337.
Dowd, Thomas J. 1984. Leasing Strategy. 'Economic Effects""' /
September!: 13-22.
119

1984. U.S. Container Terminal Leasing and
288.
Zdmond, E. D., and R. P. Maggs. 1976. Container ShipTurnaround Times at DK Ports. Maritime ~Polic and
Ffrench, Rudolph A. 1979. Competition among SelectedEastern Canadian Ports for Foreign Cargos. ~ar time~Polio and M 6, 1: 5-13.
Figura, Roger S. 1979. Pubilic Seaport Operations: aDynamic Cost- Benefit Model. Maritime ~polio and
6, 3: 217-228.
Finch, Robert A. and Mark S. Henry. 1985. AnInterindustry Approach to Financing Small PortDevelopment and Maintenance. Growth and Chancre 15, 2 April!: 26-33.
Fleming, Douglas K. 1983. Port rivalry, co-operation.Maritime ~polio and M 10, 3: 207-210.
Frankel, Zrnst G. 1980. US Shipping Policy underConditions of a New World Economic and Political
36. 1983. Shipping--Choice of Technology. MaritimeJohn Cooper, Yoo Whan Chang, and George
Tharakan. 1985. Bulk Sh~i gin~ and Terminal LWashington, D.C.: The World Bank.
Friesz, Terry L., Philip A. Vinton, and Roger L. Tobin.1985. Economic and Computational Aspects of FreightNetwork Equilibrium Models: A Synthesis. Journal ofReceional Science 25, 1: 29-43.
Gemmell, Andrew W., Ihn H. Uhm, and Gordon C. Shaw.1983. Economics of Canadian Water Carriers on the GreatLakes and St. Lawrence Seaway System. Journal of
120

Gilman, Sidney. 1978. Pricing Policy and OperationalControls in Container Terminals. Maritime ~polic ande"'
1980. Editorial: A critique of the super-port
and G.F. Williams. 1975. Ship Size and PortLocation on Deepsea Container Routes. The Dock and
1976. The Economies of Multi-PortItineraries for Large Container Ships. Journal of
Gladwell, David N. 1980. The Barge Freight Call Sessionof the Merchants Exchange of St. Louis: An Innovationin Transportation Pricing, Trans ortation Journal 20, 1 Fall!: 5-14.
Goodman, Allen C., David L. Puryear, and David Lenz.1983. Studies in Port Facilities and Urban EconomicDevelo ment. Springfield, Virginia: NationalTechnicalInformation Service.
Goodman, Alien C. 1984. Port Planning and Financing for
~polic 18, 3 Septemher!: 237-252.
Goss, R.O. 1967. Toward an Economic Appraisal of Port
September!: 249-272.
1968 Studies in Maritime Economics. Cambridge:Cambridge University Press.
ed.! 1977 Advances in Maritime Economics.Cambridge: Cambridge University Press.
1981. The Public and Private Sectors in Ports.
1982. Competition in Cargo-handling: SomeExperience from Australia. Maritime ~polic and
1984. Economics and the International Regimefor Shipping. Maritime ~polio and Mana ement 11, 2:135-145.

Hanappe, Paul and Michael Savy. 1980. Industrial Portsand Economic Transformations. Tokyo, Japan: The IAPHHead Office Maintenance Foundation.
Haynes, Zingsley E. and A. Stewart Fotheringham. 1984.~Gravit and ~satia1 interaction Nodal s. Beverly Hills:Sage Publications, inc.
Hayuth, Yehuda. 1980. Inland Container Terminal--Function"' '"' ' IL'� ''"'
283-289.
1981. Containerization and the Load Center
1982. The Port-Urban Interface: an Area intransit.ion. Area 14, 3: 219-224.
1982. Intermodal Transportat.ion and the
Hazard, John L. 1979. The National Role in World Port.Development: United States and Western Europe. Maritime
Heggie, Ian G. 1969. Are gravity and interactance modelsa valid technique for planning regional transportat.ion
Il
1974. Charging for Port Facilities. Journal of
Hershman, Narc, Robert Goodwin, Andrew Ruotsala, Maureen
Seattle: University of Washington Press.
Hochstein, Anatoly, David Veshosky, and Alan Cella,Modelling Small Port Terminals. Unpublished and undatedpaper.
New York: McGraw-Hill Book Company, Inc.
Hoyle, B.S. 1993. ~sea orts and Develo ment New York:Gordon and Breach Science Publishers.
and D.Hilling editors. 1994. ~sea ort ~S stems and~S atial ~h~nche New York: John Wiley 9 Sons.
122
lntriligator, Nichael D. 1978. Econometric ModelsTechni es and A lications. Englewood Cliffs, NewJersey: Prentice-Hall, Inc.
Zsard, Walter. 1956. Location and ~S ace ~Econom . New York:John Wiley & Sons, Inc.
and Merton J. Peck. 1954. Location Theory ando""
Journal of Economics 68: 305-320.
Jansson, Jan Owen and Dan Shneerson. 1982. PortEconomics. Cambridge, Massachussetts: The MIT Press.
1982. The design of Liner ShippingServices: the Problem of Feeder Services versus Multi-
188.
1985. Economies of Trade Density in Liner
Economics and ~Nolle January!: 7-22.
1984. A Model of Scheduled Liner FreightServices: Balancing Inventory Cost Against Shipowners'
195-215.
Jara-Diaz, Sergio R. 1986. On the Relation Between Users'Benefits and the Economic Effects of TransportationActivities. Journal of RecCional Science 26, 2: 379-391.
Johnson, J. 1960. Statistical Cost ~Anal sis. New York:McGraw-Hill Book Company, Inc.
Kellman, Mitchell and Dan Schneerson. 1977. The Economicsof Conventional Liner Break-Bulk Cargo-Handling
201.
Kendall, Lane C. 1983. The Business of ~Shi ~inCenterville, Maryland: Cornell Maritime Press'
Kenyon, James B. 1970. Elements in Inter-Port Competition
January!: 1-24.
Kerr Steamship Company, Inc. 1987. Schedule & Movementfor Liner Service. Tokyo: "K" Line.
123

Lamb, Robert. 1984. Financing; A Port Improvement/"
Laing, E.T. 1977. The Distribution of Benefits from141-154.
Lotus Development Corp. 1967. Lotus 1 g 3. Cambridge,Massachusetts.
Lundy, C.C. 1982. Small Ports in Northern Ireland: A
273 277 ~
Magnet, Myron. 1981. Mighty Sea-Land had to Attack thePacific Shipping Conference to Save it. Fortune June1!: 83-86.
Mann, H. A. 1972. The Port as a Unit in Intermodal
March!: 456-458.
Marcus, Henry S., James E. Short, John C. Kuypers, andPaul 0. Roberts. 1976. Federal Port ~Folic in theUnited States. Cambridge, Massachusetts: The M1T Press.
Marlow, Peter B. 1976. The Indirect Benefits of Shipping4, 2 117-119.
York: The MacMillan Company.
Marti, Bruce E. 1981. Patterns of United States-CanadianNaritime Container Flows. Naritime ~Folic andMana ement 8, 4: 253-259.
1982. Shift-Share Analysis and Port Geography: a4: 241-250.
McCalla, Robert J. 1979 ' Specialization and EconomicImpact of the Ports of Montreal, Quebec, Saint John,292.
Morgan, F. W. revised by James Bird!. 1958. Ports andHarbours. London: Hutchinson University Library.
124

National Research Council. 1976. Port Develo ment in theUnited States, Washington, D.C. National Academy ofSciences.
Niskanen, W.A. 1971. Bureaucrac and Re resentativeGovernment. Chicago: Aldine-Atherton.
O'Loughlin, Carleen. 1967. The Economics of Sea
Orcutt, Guy H. 1952. Actions, Consequences, and CausalRelations. The Review of Economics and Statistics 34,3 305-313.
Osleeb, Jeffrey P. and Samuel J. Ratick. 1983. TheImpact of Coal Conversions on the Ports of New
Patton, D. J. 1958. General cargo hinterlands of New York,Philadelphia, Baltimore and New Orleans. Annals of the
Paul, Jose, The Impact of Port Charges on Shipping
March!: 256-259.
1987. Port Policy of Sweden--a Critical
January!: 208-214.
Pigou, A.C. 1960. The Economics of Welfare. London:MacMillan & Co., Ltd.
and A lications. Boston: Martinus Nijhoff Publishing.
Portland's Complaint; The Impact of ContainerizedShipping on Inter-Port Competition. Lay and ~Polic inInternational Business 4, 1: 65-109.
Price, Willard. 1981. Seaports as Public Enterprises:Some Policy Implicationa. in ~Nakin Cvcean ~polio : The
W. Hoole, R.L. Friedheim, and T. M. Hennessey eds.!.Boulder, Colorado: Westview Press.
1984. Unpublished interviews with West Coastport managers. Stockton, California.
125

Ray, William W. 1970 Selections of Si nificance to theUrban and Recelonai Planner of ports and Hinterlands.Nonticello, Illinois: The Council of PlanningLibrarians.
Richardson, Harry W. 1977a. ~eceional Growth The~o . NewYork: The NacNillan Press Ltd.
1977b. The New Urban Economics: andAlternatives. London: Pion Limited.
Rimmer, Peter J. 1966. The Problem of Comparing and
2 March!: 83-91.
Robinson, Ross. 1976. Modelling the Port as an OperationalSystem: A Perspective for Research. Economic
1978. Size of Vessels and Turnround Time.
161-178.
Rowe, R. P. 1977. The Port of Preston. The Dock and
1979. Kobe, japan's Primier Port. The Dock and
Ryder, S. C., and D. Chappell. 1980. Optimal Speed and ShipSize for the Liner Trades. Haritiste ~Polio and
Sherman, Rex. 1986. America's Seaports--The Dynamics ofChange. Maritime Re orter En ineerin News August!: 16-22.
Shneerson, Dan. 1977. On the Measurement of Benefits from
277-280.
1983. Short Term Planning for a Port System.
Sinclare, P. H. 1976. The Study Plan. The Dock ~a d Harbour
1977. The Long Term Port Plan. The Dock and
126

Slack, Brian. 1985. Containerization, Inter-PortCompetition, and Port Selection. Maritime P~olic and
Soffer, Amon. 1982. Illusion as a factor in determiningpolicy in development of a port: the case of Haifa.
152 .
Stevens, Barrie. 1979. Scottish Ports. The Dock andHarbour A thorit 60, 708 November!:.
Stevens, B. H., G. I. Treyz, and J. K. Kindahl ~ 1981.Cojoining an Input-Output Model and a Policy AnalysisModel: A case study of the regional economic effects ofexpanding a port facility. Environment and ~plannin A13: 1029-1038.
Stonham, Paul E. 1980. New directions for research in
3 October-December!: 185-191.
Sun, N. C. and M. C. Bunamo. 1973. Competition forhandling U. S. foreign trade cargo: The Port of New
Suykens, F. 1983. A Few Observations on Productivity in
Taafe, E. J., R. L. Morrill, and P.R. Gould. 1963.Transport expansion in underdeveloped countries.Geo ra hical Review 53: 502-529 '
Talley, Wayne K., Vinod B.Agarwal, and James W.Breakfield. 1986. Economies of density of ocean tanker
91-99.
Tarr, G. and G. Crook. 1979. Numerical Aids to thePlanning of Berth Capacity. The Dock and Harbour
Thomas, B.J. 1978. Port Charging Practices. Maritime
United Nations, Conference on Trade and Development{UNCTAD! . 1975. Port ~Pricin . Nev York: United Nations publication number E.75.1I.D.7!.
127

U S. Army Corps of Engineers. 1977. Waterborne Commerceof the United States, Parts 1-5. New Orleans: U. S.Army Engineer District.
1978. Waterborne Commerce of the United States,Parts 1-5. New Orleans: U. S. Army Engineer District.
1979. Waterborne Commerce of the United States,Parts 1-5. New Orleans: U. S. Army Engineer District.
1980. Waterborne Commerce of the United States,Parts 1-5. New Orleans: U. S. Army Engineer District.
1981. Waterborne Commerce of the United States,Parts 1-5. New Orleans: U. S. Army Engineer District.
1982. Waterborne Commerce of the United States,Parts 1-5. New Orleans: U. S. Army Engineer District.
1983. Waterborne Commerce of the United States,Parts 1-5. New Orleans: U. S. Army Engineer District.
1984. Waterborne Commerce of the United States,Parts 1-5. New Orleans: U. S. Army Engineer District.
1985. Waterborne Commerce of the United States,Parts 1-5. New Orleans: U. S. Army Engineer District.
U.S. Department of Commerce Maritime Administration!.
C.: U.S. Government Printing Office.
1977. ~Plannin Criteria for U.S. PortDevelo ment. Washingto, D. C.: U.S. Department ofCommerce.
1978. What U.S. Ports Mean to the ~SconomWashington, D. C.: U.S. Government Printing Office.
1976. Domestic and International Trans ortationof U.S. Foreiccn Trade: 1976 Part A: ~Ex orts Part ib;~Im orts. Washington, U. C.: U. S. Government PrintingOffice.
U.S. Department of Transportation. 1980. NationalTrans ortation Statistics: Annual R~e ort Wash.ington,D. C.: U.S. Government Printing Office.
U.S. Department of Transportation. 1984. NationalTrans ortation Statistics: Annual R~e crt Wash.ington,D. C.: U.S. Government Printing Office.
128

Verhoeff, J. M. 1981. Seaport Competiton: SomeFundamental and Political Aspects. Maritime ~polic and
Wanhill, Stephen R. C. 1974. Further Analysis of Optimum
November!: 377-383.
Walters, A.A. 1963. Production and Cost Funtions: AnEconometric Survey. Econometrica 31, 1-2 January-April!: 1-65.
1976. Impact Studies and the Evaluation ofpublic projects. Annals of ~eceional Science March!:98-103.
Waters, Robert C. 1977. Port Economic Impact Studies:Practice and Assessment. Trans ortation Journal 16, 3 Spring!: 14-18.
Weigend, G.C. 1956. The problem of hinterland andforeland as illustrated by the Port of Hamburg.
Wilder, Ronald, P. and David R. Pender. 1979. EconomicBehaviour of Public Ports in the United States. Journal
Willingale, M. C. 1981. The Port-Routing Behaviour ofShip Operators; Theory and Practice. Maritime ~Polic
Wingo, Lowdon. 1961. Trans ortation and Urban Land.Washington, D.C.: Resources for the Future, Inc.
Winston, Clifford. 1981. A Multinomial Probit Predictionof the Demand for Domestic Ocean Container Service.
243-252.
States: An Economic and Environmental ~lm act ~Stud . NewYork: Praeger Publishers.
Wood, Thomas W. 1982. The Economics of Mixed Cargo and
Economics and ~Folic 16, 1 January!: 43-54.
129

Wright, A. J. 1980. Shorter Sea Routes as a, Result of7, 2: 79-84.
130

Appendix A
RZDEFINING THE HINTERLAND
"Unless there is a favourable 'hinterland' to a portit cannot prosper." Cunningham, 1926!
The seaport and its hinterland...the traditional
approach has been to evaluate the potential activity of a
seaport in terms of the economic health of its hinterland
or inland market area Ffrench 1979!. Geographers over
the last 60 years or so have had a substantial interest
in the extent of the hinterland served by particular
seaports. Once the extent of the hinterland is
delineated the inference is that one should be able to
evaluated whether it will generate increasing or
decreasing flows of cargo through the port in question.
However, by identifying a structural difference between
captive local demand for port and shipping services and a
more competitive market for inland transshipment
Bennathan and Walters �979! depart from the traditional
concept of the hinterland. They argue, theoretically,
that. the hinterland of a port can be divided into two
parts, the captive local market and the inland market in
which more than one port may compete for customers.
Thus, there are qualitative differences within a port's
hinterland. Because this argument has not been
empirically tested, and because the distinction is used
131

in this study, it is important to support it with some
statistical evidence.
Numerous geographers have contributed to the
development of the concept of the hinterland. Sargent
�938! recognized that the area serviced by a particular
seaport may depend on the structure of the landside
transportation system and is, therefore, limited by the
extent of investment in landside transportation,
geological barriers, political boundaries, and the
proximity of other ports. He also identified the
influence of the weight and value characteristics of the
cargo. Morgan revised by Bird 1950! elaborated on the
concept that heavier, lower value cargos ores, gravels,
grains! which tend to be much more economically moved on
water, are moved through the closest port, giving the
ports relatively small compact hinterlands with respect
to these cargos. The higher value, lower weight cargos
machinery, consumer goods! can be transported overland
for substantially less cost relative to their values.
Thus, the shippers of these cargos are more sensitive to
time factors and the hinterlands for these goods tend to
be more extensive and, possibly, even overlapping.
Similarly, Hoyle and Hilling �984! noted that. goods
shipped in large quantities to or from a limited number
of points in the hinterland are most economically moved
132

by rail and, thus, their hinterland is dependent on the
configuration of the rail system. In contrast, goods
shipped in relatively small quantities to or from many
dispersed points are more economically shipped by truck
and their hinterland is strongly influenced by road
network limitations. Kenyon �970! used the definition
of one night's truck travel to delineate the extent of a
seaport's hinterland.
Given these basic parameters, the hinterlands of
numerous ports have been delineated Weigend 1956,
Patton 1958, Hoyle 1968, Hilling 1969, Kenyon 1970, Bird
1984! for various cargos, during various historic
periods, and when subjected to political and technolical
changes. But once these hinterlands are identified,
there is little evidence in the literature of any effort
to assign values and predict the implications for the
respective seaports. In the applied seaport literature
market. research reports make use of the hinterland
concept, but this research has a large subjective
component. Apparently, both the applied and academic
efforts in this area are severly limited by the
difficulty in obtaining sub-national data Patton 1958!.
The difficulties in operationalizing the hinterland
concept have been further exacerbated by the
technological change to containerization. Although
overlapping hinterlands and variations in extent for
133
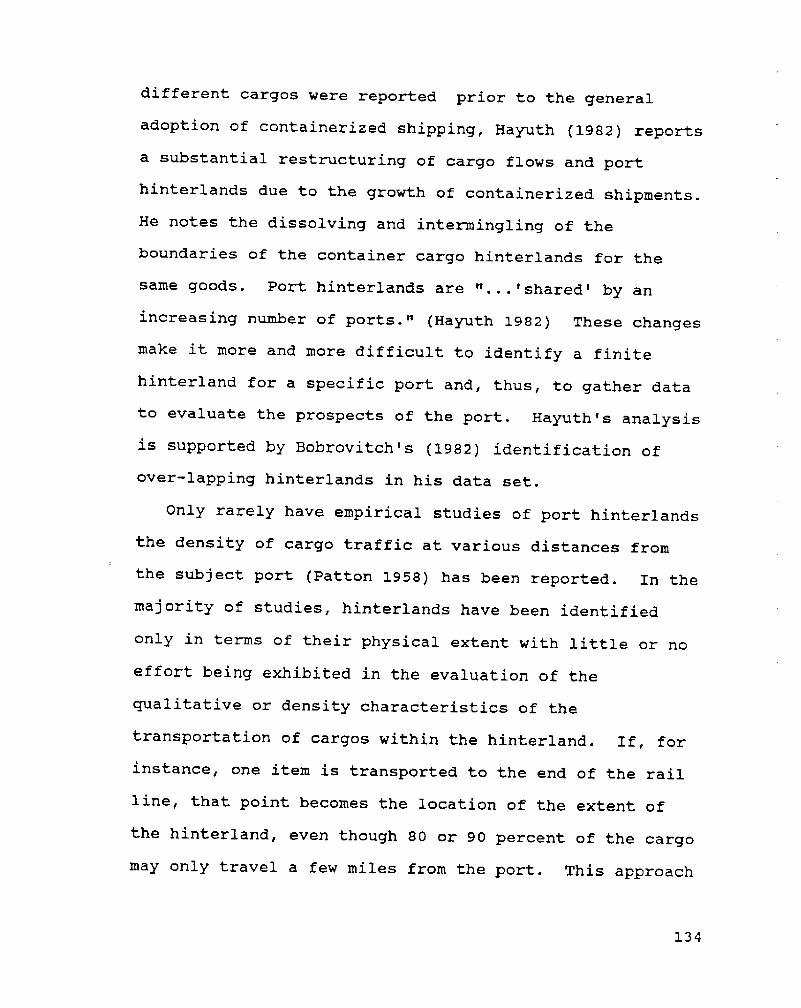
different cargos were reported prior to the general
adoption of containerized shipping, Hayuth �982! reports
a substantial restructuring of cargo flows and port
hinterlands due to the growth of containerized shipments.
He notes the dissolving and intermingling of the
boundaries of the container cargo hinterlands for the
same goods. Port hinterlands are "...'shared' by an
increasing number of ports." Hayuth 1982! These changes
make it more and more difficult to identify a finite
hinterland for a specific port and, thus, to gather data
to evaluate the prospects of the port. Hayuth's analysis
is supported by Bobrovitch's �982! identification of
over-lapping hinterlands in his data set.
Only rarely have empirical studies of port hinterlands
the density of cargo traffic at various distances from
the subject port Patton 1958! has been reported. In the
majority of studies, hinterlands have been identified
only in terms of their physical extent with little or no
effort being exhibited in the evaluation of the
qualitative or density characteristics of the
transportation of cargos within the hinterland. If, for
instance, one item is transported to the end of the rail
line, that point becomes the location of the extent of
the hinterland, even though 80 or 90 percent of the cargo
may only travel a few miles from the port. This approach
134

has probably been due to the interest in the extensive
boundaries as foci of competition between ports and to
the lack of accessible data.
Although Bird �982! mentions the possible
significance of the local market, only Kenyon �972!
attempts to empirically identify the local market.
Wilder and Pender �979! show a significant concentration
of cargo movements within the first 25 miles of a port,
but they do include any distinction between markets in
their list of port demand factors. It is only in
Bennathan and Walters �979! that one sees a theoretical
distinction.
If it can shown that in the United States ports and
ship operators face two different markets and that most
cargo movements are associated with one market or the
other then this distinction should be incorporated in
cargo distributions for the United States. In addition,
if most cargo originates from or is destine to the local
city economy then data from the local economy might be
considered as a significant proxy for the larger, less
distinct traditionally identified hinterland and this
data might be used to more accurately evaluate the
prospects for port growth.
Data on the domestic origins of export cargos and
destinations of imports in the United States can be
obtained from the cargo manifests filed with U.S.
135

Customs, but it is not regularly compiled or published.
This severely limits academic research in this area.
However, in 1970 and again in 1976 the Bureau of the
Census conducted and published special studies, Domestic
Trans ortation Part A and Part B, on the domestic
transportation---origin, destination, and transport
mode---of international cargos. Although this data is
now somewhat dated, it provides the most substantial
statistical insight into the density distribution issue.
And, as data gathering efforts go, this one appears to be
a particularly high quality effort.
For the 1976 study a sample of 72,DOO shipments
through ports within the 4S contiguous states was
selected from the customs manifest population. The
weight and value data for the shipments was taken
directly from the manifests. Detailed information on the
domestic origin or destination of the cargo as well as
the mode and cost of the domestic transportation was
solicited by questionaire. The response rate on the
questionaires was an impressive 76 percent. It is
important to note that these data were aggregated bycustoms districts. Thus, while the transportation data
are based on the specific port through which the cargo
actually move, the data for several ports within a
customs district. was combined. It is tempting to read
136
the data as representing a specific port, but. it must be
read as representing regional aggregates.
The series of graphs at the end of this appendix,
figures A-1 to A-20, present data drawn from Domestic
Trans ortation Part A and Part B, but it has been
modified to focus on the port hinterland issue rather
than on the national transportation demand. The
statistics have been converted from national percentages
to actual values and then from the actual values to
district percentages for the nine customs districts. If
P equals the percent of national shipments transported a
specific distance to or from district ports; N, the
actual national value; D, the actual district value
transported a specific distance; T, the district total;
and Z, the percent of cargo passing through ports in the
district that is transported the specified distance,
then:
PN = D and D/T = Z.
In addition, the first two mileage categories, less than
25 miles and 25-49 miles have been combined to conform
more closely to the extent of the Standard Metropolitan
Statistical Area SMSA!, which is the most readily
available statistical representation of the local
metropolitan economy.
l37

The first pair of graphs figures A-1 and A-2!
illustrates the distribution of the national totals.
They are followed by a pair of graphs for each customs
district. The first graph in each pair provides a
comparison of general cargos, imports and exports, by
value and by weight. The general cargo classification
was chosen because it most closely coincides with the
flows of containerized cargos. The second graph in each
pair compares imports only for all vessel shipments with
those for bulk cargos by value and by weight. This data
set was complete only for imports, but it is most likely
that it is closely paralleled by export patterns. It is
important to note that the vertical axis on the graphsare calibrated in percentages not in absolute values.
So where distributions appear similar the actual tons of
cargo moved may vary substantially.
Clearly different patterns emerge from the different
regions, reflecting variations in the development
patterns of the port hinterlands. However, for all
regions general cargo distributions tend to be flatter
reflecting higher value to weight ratios and the
particular advantages of containerization in the
transshipment of these cargos. In some instances
irregularities in the distribution can easily be
identified as specific origin or destination cities. For
the Los Angeles region the hump 150 miles from the port
138

Figure A-1
139

Figure A-2
140

Figure A-3
141

Figure A-4
142
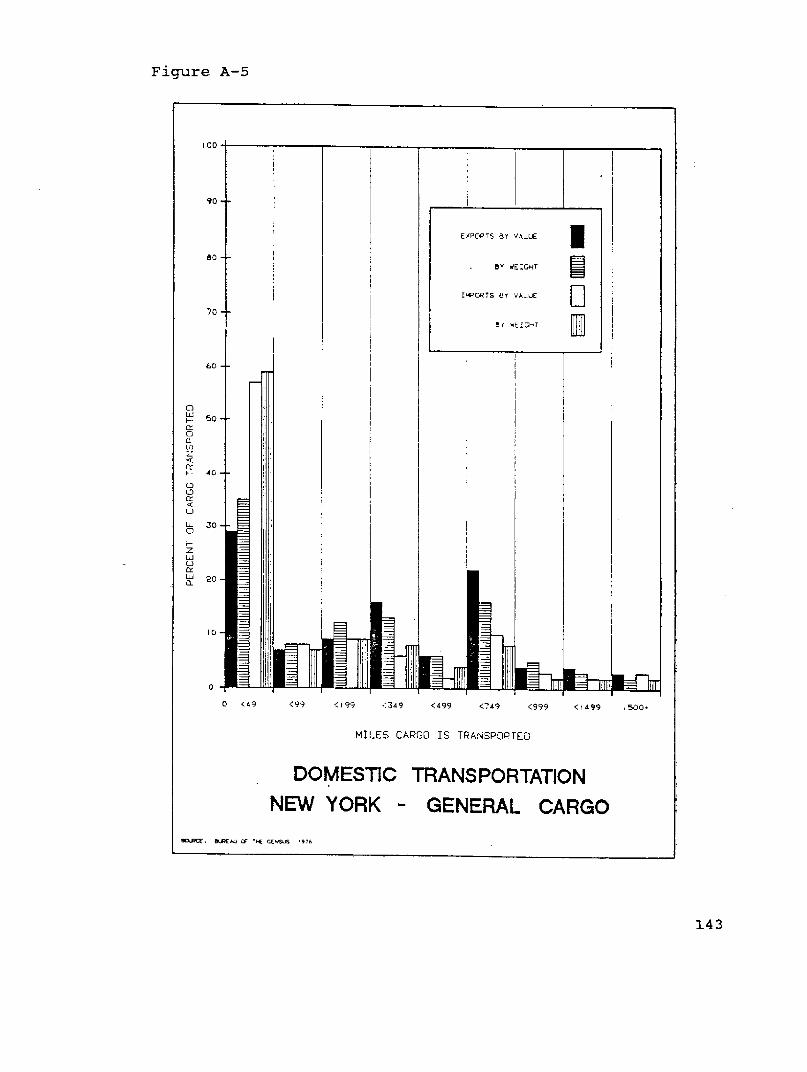
Figure A-5
143

Figure A-6
144

Figure A-7

Figure A-8
146

Figure A-9
l47

Figure A-10
148

Figure A-11
149

Figure A-l2
150

Figure A-13
151
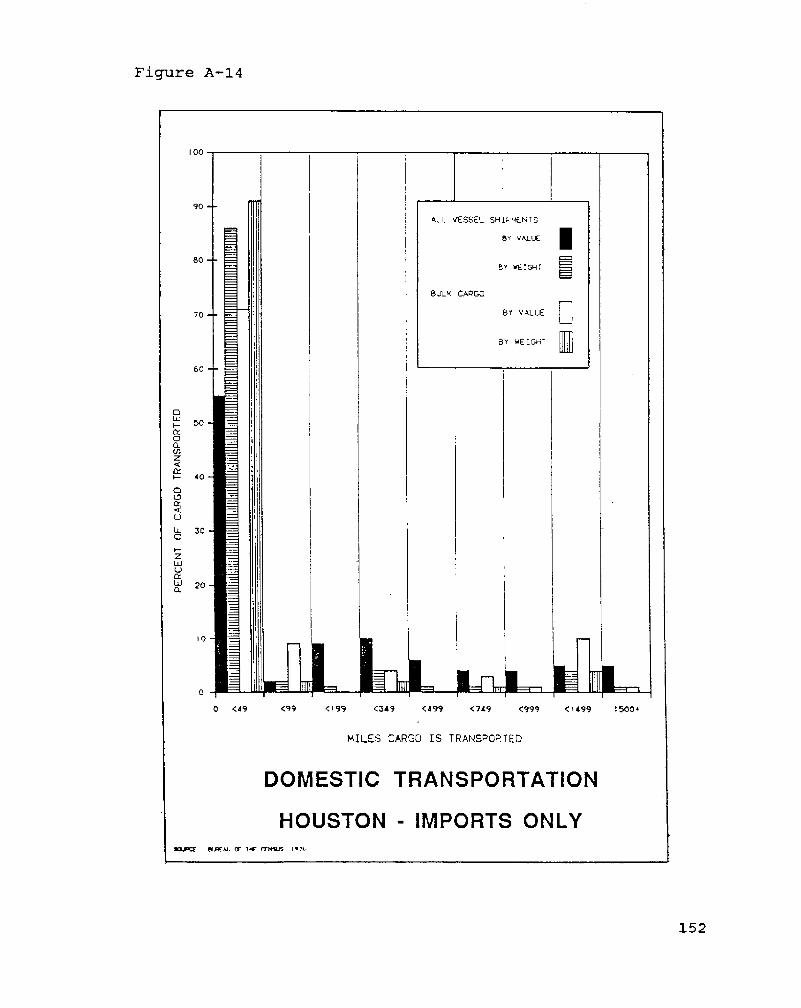
Figure A-14
152

Figure A-15
153

Figure A-16
154

Figure A-17
155

Figure A-l8
156

Figure A-19
157

Figure A-20
158

can be related to the cities of Santa Barbara, San
Bernardino, and San Diego similarly distant from the
ports of Los Angeles and Long Beach although in different
directions!. Several regions have a secondary high point
mid-range {20-749 miles distant! that can often be
related to the distance to a specific inland city, but it
is always substantially lover than the local less-than-49
mile peak. While the inland cities served in this way
may be as large or larger than the port cities, they are
probably located in the overlapping hinterlands of more
than one port and, therefore, in the competitive market
sector identified by Bennathan and Walter �979! ~ If one
reconsiders the diagram from Bobrovitch's �982! model
see chapter 2! one would expect the actual density of
the generation of demand for cargo movements to be
associated with clear concentrations of economic
activity. Thus, figure A-21 shows a hypothetical pattern
Figure A-21
C
o
Q
Inland City
Distance
Port City 1 Port City 2
159
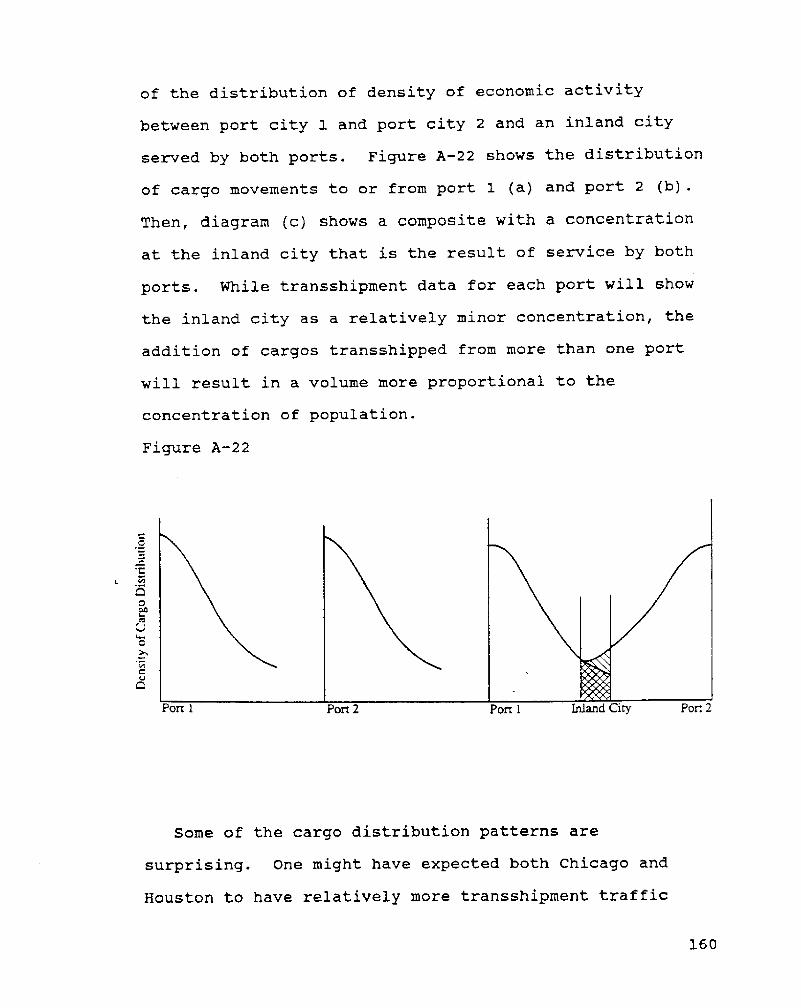
of the distribution of density of economic activity
between port city 1 and port city 2 and an inland city
served by both ports. Figure A-22 shows the distribution
of cargo movements to or from port 1 a! and port 2 b!.
Then, diagram c! shows a composite with a concentration
at the inland city that is the result of service by both
ports. While transshipment data for each port will show
the inland city as a relatively minor concentration, the
addition of cargos transshipped from more than one port
will result in a volume more proportional to the
concentration of population.
Figure A-22
0
V3CIO CO
4Q
C
Pott I Port 2 Inland City Patt 2Potr. I
Some of the cargo distribution patterns are
surprising. One might have expected both Chicago and
Houston to have relatively more transshipment traffic
160

connections with the mid-west heartland, but that is not
substantiated by the data. The concentrations in the
Miami Customs District, which includes the states of
Florida, Georgia, South Carolina and North Carolina,
portray a surprising amount of transshipment. This may
reflect cargo specialization of the smaller ports in the
region in order to capture the economies of scale, and
then general distribution through out the region. With
small port cargo specialization, one would expect a
substantial amount of cross-hauling of cargos. lt may
also reflect the transshipment of fresh fruits and
vegetables from Latin America to the Northeast.
The concentrations within the first 49 miles from the
ports may reflect the wholesale collection and
distribution networks or the location of import dependent
industries near the port as suggested by Alonso �973!.
Imports only, especially bulk--clearly delivered to the
port closest to the destination. Bulk cargo by value is
surprisingly slightly more concentrated than by weight in
several instances.
Generally, however, this series of graphs supports the
expectation of more transshipment of high value, low
weight cargos and less transshipment of high weight, low
value cargos. They also show a substantial difference in
the volume of cargo generated within 50 miles of the
ports and the volume generated beyond that boundary.
161

While it is quite likely that this concentration reflects
the concentration of port related industries as well as
the structure of the distributional networks, it does
provide evidence of variations in the nature of the port,
hinterland as suggested by Bennathan and Walters �979!.
Et is not incompatible with the overlapping of
hinterlands in the service of inland cities.
162

Appendix B
SPREADSHEET CELL-FORNULA PRINTOUT
163

A4; [W45]A6: [W45]B6: ' B
C6; ' C
D6: ' D
E6: ' E
F6: ' F
G6; ' G
A9: [W45] 'Market for SeapoA12: [W45] 'COMMENTARY ANDA15: W45] 'Demand for ShipA17: [W45] ' FunctionalB17: 'pl-al-blqC17: '1
D17; 'p2-a2-b2qE17: '2
F17: 'p3-a3-b3qG17: '2
E18: 'and
F18: 'p2+p3-A-BG18: 'q2A19; [W45 JB19: ' al - B20
C19: 'bl - C20
D19: 'A - D20
E19: 'B - E20
F19: 'ql - F20G19; 'q2 - G20
A20; [W45]B20: 80
C20: 2
D20: 75
E20: 0.5
F20: 20
G20: 21.5
A22: [W45]B22: 'pl � C22C22; +B20- C20*C10!D22: 'p2+p3-E22E22: tD20- E20*E10!A24: [W45] 'Ship Operator'sB24: 'TR - alqlC24: ' - blql"2D24: ' + Aq2E24: 'Bq2"2A26: [W45] 'Ship Operator'sB26: 'MR1-al-bl
C26: 'ql andD26: 'MR2-A-Bq2A28: [W45J 'Ship Operator'sA30: [W45] ' Functional
B30: 'TC - C+gC30: ' where
D30; 'Q- ql+q2!
rt Services
NOTES
Services: local�!, inland�!relationships
Variables introduced
Estimated value of variables
Total Revenue TR!
Marginal Revenue
Cost
relationship
Functional relationship in cell ID's

Functional relationship in cell 1D's
165
E30: ' and
F30: 'C - Cs+P
A32: [W45] ' Variables introducedB32: 'C - 333
C32: 'Q - C33D32: 'Cs - D33
E32: 'P - E33
A33; [W45] ' Estimated value of variables333: +$D$33+$E$33C33: +$3$44+$D$44D33: 40
E33: 3
A35; [W45]B35; 'TC � C35
C35: +$3$33*$C$33A37: [W45] 'Profit Maximizing Condition for ShipA38: [W45] ' Operator: MC � MR338; 'when
C38: 'C - al-2b
D38: 'lql andE38: 'C - A-23qF38: '2
A40: [W45] 'If * denotes an optimum value, solvingA41: [W45] ' for ql+ and q2*341.' 'ql* - alC41. '-C!/2blD41: 'and q2*E41: '- A-C!/2F41: 'B
A43.' [W45] ' Variables introducedB43; 'ql* - B44D43: 'q2* - D44A44: [W45] ' Estimated value of variablesB44: $B$20-$B$33!/�*$C$20!D44: $D$20-$3$33!/�*$E$20!A46: [W45] 'Ship Operator Demand for Port ServiceA48: [W45] ' Functional relationshipB48: 'P k4+k5
C48: 'QD48: 'dP/dQ-k5A50: [W45] ' Variables introduced350: 'k4 - B51
C50: 'k5 - C51
A51: [W45] ' Estimated value of variablesB51: $E$20*$B$20!- $E$20*$D$33!+ $C$20*$D$20!- $C$20*$D$33!!/ $C$20C51: -�+$C$20*$E$20!/ $C$20+$E$20! +$E$20!A53: [W45] ' Functional relationship in cell ID'sB53: 'P 354,C53: 'C54, D54D53: 'dp/dQ-E53E53: +$C$51A54: [W45] ' Estimated values of P given values of QB54: +$3$51+ $C$51*$C$113!C54: +$3$51+ $C$51*$C$137!

Functional relationship in cell ID's
Functional relationship in cell ID's
Functional relationship in cell ID's
D54: +$B$51+ $C$51*$C$163!A56; [W45] 'Supply of Port ServicesA58: [W45] 'Port's Total RevenueA60: [W45] ' Functional relationshipB60: 'TRp - P*QC60: ' for Qp,D60: ' Qt,E60: ' 6 QwA62: [W45]B62: 'TRp-C62; +$B$54*$C$113D62: +$C$54*$C$137E62: +$D$54*$C$163A65: [W45] 'Port's Marginal Revenue, derived fromA66: [W45] ship operators' demandA68: [W45] ' Functional relationshipB68: 'HRp � P +C68: ' dP/dQ*QD68; ' for Qp,E68: ' Qt,F68: ' 46: QwA70: [W45]B70: 'MRp-D70: +$B$54+ $C$51*$C$113!E70: +$C$54+ $C$51*$C$137!F70: +$D$54+ $C$51*$C$163!A72: [W45] 'Port's Total CostA74; [W45] ' Functional relationshipB74: 'TCp - k3QC74: '*3 + k2Q"D74: '2 + klQ +E74: ' ko
F74: 'where; kO
G74: '>0, k1>0,H74: ' k2�, K3I74: '>0, k2 2�k3klA76: [W45] ' Variables introducedB76: 'k3 - B77
C76: 'k2 - C77
D76: 'kl - D77
E76: 'kO - E77
F76: +E77
G76: +D77H76: +C77
I76: +B77
Z76: +$C$77"2K76: 3*$B$77*$D$77A77: ['W45] ' Estimated value of variablesB77: 0.0026
C77; -0.225
D77; 6.63
E77: 3.596
A78: [W45]B78; 'TCp- l66

C78
D78
E78
A79
B79
C79
D79
K79
A81
A83
B83
C83
D83
K83
A85
B85
C85
D85
E85
A87
A89
B89
c89
D89
A91
B91
C91
D91
E91
A93
A95
A97
B97
A99
B99
C99
D99
$B$77*$C$113 3!+ $C$77*$C$113*2!+ $D$77*$C$113!+$E$77 $B$77*$C$137 3!+ $C$77*$C$137 2!+ $D$77*$C$137!+$E$77 $B$77*$C$163"3!+ $C$77*$C$163 2!+ $D$77*$C$163!+$E$77[W45] 'Port profit TR - TC'TRp-TCp+$C$62-$C$78+$D$62-$D$78+$E$62-$E$78[W45] 'Port's Average Cost[W45] ' Functional relationship'AVCp- k3Q'"2 + k2Q'+kl + k0
'!Q
[W45] ' Functional relationship in cell ID's'AVCp
$B$77*$C$113"2!+ $C$77*$C$113!+ $D$77!+ $E$77/$C$113! $B$77*$C$137"2!+{$C$77*$C$137!+ $D$77!+{$E$77/$C$137! $B$77*$C$163"2!+ $C$77*$C$163!+ $D$77!+ $E$77/$C$163![W45] 'Port's Marginal Cost[W45] ' Functional relationship'MCp - 3k3Q'Q"2 + 2k2Q"'Q + kl
[W45] ' Functional relationship in cell ID's'NCp-
�*$B$77*$D$113"2!+�*$C$77*$D$113!+ $D$77!�*$B$77*$C$137*2!+�*$C$77*$C$137!+ $D$77!�*$B$77*$C$163"2!+�*$C$77+$C$163!+ $D$77![W45] 'Pricing Strategies[W45] 'a. Maximize profit MR - MC![W45] ' Functional relationship'MC - MR
[W45] ' Functional relationship in cell ID's�*$B$77*$C$113*2!+{2*$C$77*$C$113!+ $D$77!
+$B$51+�+$C$51*$C$113!A101: [W45] ' Arranged in terms of Q 6 set - 0B101: ' 0-
C101: �"$B$77*$C$113 2!+�* $C$77-$C$51!*$C$113!+ $D$77-$B$51!hl03: [W45] ' To solve the quadraticA104: [W45 ] slQ"2 + s2Q + s3 - 0 where:B105: 'sl - C105C105: 3*$B$77B106: 's2 - C106
C106: �*$C$77!-�*$C$51!B107: 's3 - C107
C107: +$D$77-$B$51B108; 's4 - C108
C108; +$C$106"2-�*$C$105*$C$107!A109: [W45] ' Solution of the quadratic a!B110: 'if s4
C110: +$C$106"2-�*$C$105*$C$107!D110: '>0*
167

E110: QSQRT $C$106*2-�*$C$105*$C$107!!Bill.: 'if s4
Clll: +$C$106 2-�*$C$105*$C$107!Dill: '-0*+
B112: 'if s4
C112: +$C$106"2-�*$C$105*$C$107!D112: '<0+**
B113; 'QlC113: -$C$106+$E$110!/�*$C$105!B114: 'Q2C114: -$C$106-$E$110!/�*$C$105!A115: [W45] 'b. Maximize throughput P � AVC!A117; [W45! ' Functional relationshipB117: 'P - AVC
A119: [W45! ' Functional relationship in cell ID'sB119: +$8$51+ $C$51*$C$137!C119:
D119; {$B$77*$C$33"2!+ $C$77*$C$33!+ $D$77!+{$E$77/$C$33!A121: [W45] ' Arranged in terms of Q, multiply by QA122: [W451 and set - 0B122: $B$77*$C$137*3!+ $C$77-$C$51!*$C$137"2!+ $D$77-$B$51!*$C$137!+$EC122: '- 0
A124; [W45] ' To sol~e the cubicA125; [W45I tlQ"3 + t2Q"2 + t3Q + t4 - 0A126: [W45I where:B126: 'tl - C126
C126: +$B$77B127: 't2 - C127
C127: $C$77-$C$51!/$B$77B128: 't3 - C128
C128: $D$77-$B$51!/$B$77B129: 't4 - C129
C129: +$E$77/$B$77B130: 't5 - C130
C130: $C$128/3!- $C$127"2!/9!B131: 't6 - C131
C131: $C$128*$C$127!-�*$C$129!!/6!- $C$127"3!/27!B132: 't7 - C132
C132: +$C$130"3+$C$131"2D132; ' if
E132: +$C$132F132: '>0, one rG132: 'eal root
H132: '6 pair ofI132: ' complexJ132: 'conjugateK132: ' roots,B133: 't8 - C133
C133: ISQRT $C$131~SQRT $C$132!!D133: ' if
E133: +$C$132F133; '-0, all rG133: 'oots real 168H133: ' 6 at lea

I133: ' st two arJ133: 'e equal,B134: 't9 � C134
C134; QSQRT $C$131+QSQRT $C$132!!D134; ' if
K134; +$C$132F134; '�, all rG134: 'oots realH134; ' irreducI134: 'ible caseJ134: '!
A136: [W45] ' Solution of the cubic b!B137: 'Ql - C137C137: 42.691
D137; $C$133+$C$134!- $C$127/3!B138.' 'Q2 - C138
C138: - $C$133+$C$134!/2!- $C$127/3!+ gSQRT�!/2!* $C$1B139: 'Q3 - C139
C139: - $C$133+$C$134!/2!- $C$127/3!- QSQRT�!/2!* $C$1A141: [W45] ' Test of roots of cubicB141: +$D$137+$C$138+$C$139C141:
D141; -$C$127
B142: $D$137*$C$138!+ $D$137*$C$139!+ $C$138*$C$139!C142:
D142: +$C$128B143: +$D$137*$C$138*$C$139C143:
D143: -$C$129
A145: [W45] 'c. Maximize Social Welfare P - MC!A147: [W45] ' Functional relationshipB147: 'P - MC
A149: [W45] ' Functional relationship in cell ID'sB149; +$B$51+ $C$51*$C$164!C149:
D149: �*$B$77*$C$164"2!+�*$C$77*$C$164!+ $D$77!A151: [W45] ' Arranged in terms of Q 6 set - 0B151: ' 0
C151: �*$B$77*$C$164"2!+ �*$C$77!-$C$51!*$C$164!+ $D$A153: [W45] 'To solve the quadraticA154: [W45] ' vlQ"2 + v2Q + v3 - 0B155: 'vl - C155C155: 3*$B$77B156: 'v2 - C156
C156: �*$C$77!-$C$51B157: 'v3 - C157C157; +$D$77-$B$51B158; 'v4 - C158
C158: +$C$156"2-�*$C$155*$C$157!A159: [W45] 'Solution of the quadratic c!B160: 'if v4-
C160: +$C$156"2-�*$C$155*$C$157!D160: '�*
K160: ISQRT $C$156"2-�*$C$155+$C$1.57!!
33-$C$134!
33-$C$134!
77-$B$51!
B161: 'if v4
C161: +$C$156"2-�*$C$155*$C$157!D161; '-0**
3162: 'if v4-
C162; +$C$156 2-�+$C$155*$C$157!~<0***
B163: 'Q1C163; -$C$156+$E$160!/�*$C$155!B164: 'Q2
$C$156-$E$160}/�*$C$155!
170

Appendix C
SOLUT1ON OF FOUR SINULTANEOUS EQUATIONS
171

n
0
I0~ 92
D +
g 0+!ID8t+e t D'OSD $ I0Sr"
+
0
+
4+ 4 ~~ ~ 0
I0»
D0 »I ~ I
OO0nam
L L L000
000
»
0
0 O
I
0C
4
ID 0
D
I ~0
r C 0I
I
~ IC
0
C 0 C
0 0
0 I
8
I
~ g+
gOI0 LIw 0 0»
!I0 »»
»~ t ~2 C
172
0 0Orl0'4 D DD ++
U 0UD + +++ O D
DOOU 0 l0 e+
+D ~+g8$
~ ~ » PlI ~ I ~ ~
0 nil0
C»4IIIr0»
IIW
U
0 I00 Or e
I
n~ e I0»0»
IoC U
»0
'0 '0
h ' R~ .
D I4C ' 80
I +r ~ o
4 0 IC» V0 3
00 +
gU
I
I
I0
L 0
C 0
0 4 C0 0
I0 00 ~I
~ 6 8I C
g
R
3~I~ ~ 0O 0

Appendix D
IMPACT MATRIX CELL-FORMULA PRINTOUT
173

L50: ' S trategyM50: 'Profit Mx
050: 'Thrput NxQ50: 'Velfr MaxL52: 'ResultingL54: 'Profit
M54: +C79
054: +D79
Q54: +E79L56: 'ThrputM56: +C113
056: +C137
Q56: +C163L58: 'welfare
M58: $B$51-$B$54!*$C$113!/2058: $B$51-$C$54!*$C$137!/2Q58: {$B$51-$D$54!e$C$163!/2L60: 'Mat CostL61: 'x 1000M61: +$B$54*2000000061: +$C$54*2000000Q61: +$D$54*2000000Q62: 7.13*2000000Q63: +Q61+Q62
174