alteration of gold nuggets enriched with platinum group
TRANSCRIPT

1 | P a g e
Alteration of Gold Nuggets
Enriched with Platinum Group
Elements (PGEs)
By: Sophie E. Sperring
A thesis submitted in partial fulfilment of the requirements of an Engineering
Honours (BE(Hons)) in Chemical and Metallurgical Engineering Degree
Murdoch University, Western Australia
School of Engineering and Information Technology
December 2017
Word Count: 17, 260

2 | P a g e
1 | P a g e
Abstract
Understanding the mechanisms of incorporation, the form, and the solid-state solubility
of Platinum Group Elements (PGEs) in gold nuggets at the nanoscale is critical to future
works in gold (Au) nanoscale crystallography. Current works looking at similar samples
include Mineral company research into extraction methods of similar samples and
research in progress at the University of Western Austral using the alloy of the Au
samples for medical purposes.
The work completed by this this used Au nugget samples that were taken from Ruby
Creek, British Columbia, Canada. The geology specific to the Au samples used is a sub
type of the placer alluvial is: Atlin gold placers, which are known for hosting a variety
of metals, specific to the Atlin region.
Traditional thought for Au nuggets for monocrystalline structures. This steams from
research completed by the minerals industry to extract the gold that lent into
mineralogical studies. The gold rich rim consists of spherical particles that do not
display the silver rich core parallel lamellae texture. The core structure is truncated
where it meets the rim of the particle. No PGE particles within the sample area observed.
As seen with previous studies the Au samples display a rim that is silver (Ag) enriched.
The rim could be a leaching mechanism experience by the gold in the presence of
aqueous material. The relationship between the Au and the Ag was established as
inversely proportional. The PGEs accumulated in the rounded, poly crystalline
nanoparticulate Au-rich rim. The rim exhibited greater porosity within this rim area.
Majority of gain boundaries in the silver rich core of gold particles show a pile up of
dislocations which result in multiplication of the diffraction maxima. The rim observed
on the Au nugget samples were shown to have a PGE accumulation of between 10 to 20
µm.
The presence of the PGEs in solid solution is likely due to their relatively low
concentrations and/or association with other trace elements such as Arsenic (As),
Selenium (Se) and Sulphur (S), which may help to dissolve PGEs in the gold structure.
The distribution seen of the PGEs suggests that during alteration of gold particles under
supergene conditions, PGEs are subjected to the enrichment process due to a selective

2 | P a g e
dissolution of Ag. Homogeneous distribution of Ru, Rh and Pd in the gold matrix and
lack of PGEs nanoparticles in the pores support this postulation.
The irrefutable evidence obtained from this study is that the PGEs are in solid solution
in crystal structure in this sample. Exsolution does not occur at the nanoscale. It can also
be said that during the process of alteration, the PGE accumulate in the Ag removed
area.
The interest in this project will extend into Nano-SIMS academic activity to have a
closer look at the isotopic complexity and to look at the distribution of isotopes of PGEs
in gold sample. Looking for exsolution at absolute nanoscales and to see if the isotopes
of the PGEs fractionate in the gold formation are also main features of the future work
in this area of mineralogy.

3 | P a g e
Acknowledgements
This thesis submission acknowledges the financial support from School of
Engineering and Information Technology, Murdoch University. The support from
the faculty members; Dr. Malcolm P. Roberts, Dr. Aaron Dodd, and Dr. Alexandra
Suvorova, and Dr. Martin Sounders at the Centre for Microscopy, Characterisation
and Analysis, University of Western Australia is also acknowledged as invaluable.
Finally, the ongoing support of supervisors to the project from Dr. Artur P. Deditius
of The School of Engineering and Information Technology, Murdoch University and
Dr.Fernando Barra of the Department of Geology and Andean Geothermal Center
of Excellence (CEGA), Universidad de Chile, is appreciated greatly.

4 | P a g e
Contents
Abstract ....................................................................................................................... 1
Acknowledgements ..................................................................................................... 3
Chapter 1: Introduction............................................................................................ 7
1.1 Scope ........................................................................................................... 7
1.2 Objectives .................................................................................................... 8
Chapter 2: Literature review .................................................................................... 9
2.1 Types of Gold Deposits ................................................................................ 9
2.2 Transport and Deposition of Gold ...............................................................11
2.3 Content of PGEs in Gold Geology ...............................................................13
2.4 Gold and PGE Crystallography ...................................................................13
2.5 Miscibility in Au-Ag-PGE system ...............................................................16
2.6 Alteration of Au Nuggets – Previous literature on Ag Depleted Rims ..........17
2.7 Mobilisation of Gold ...................................................................................18
Chapter 3: Analytical Methods .............................................................................. 20
Chapter 4: Results ................................................................................................. 22
4.1 Location and Description of Samples ..........................................................22
4.2 Paragenisis and Composition .......................................................................22
4.3 Silver Depleted Rim ....................................................................................23
4.4 Structure and Composition of Gold at the Nanoscale ...................................26
Chapter 5: Discussion ............................................................................................ 30
5.1 Structure of Au in Sample and Predictions ..................................................30
5.2 Formation in Sample using Thermodynamics Error! Bookmark not defined.
Chapter 6: Conclusions.......................................................................................... 33
6.1 Future work .................................................................................................33
References ................................................................................................................. 34
Appendix................................................................................................................... 38
1. Paragenisis and surrounding mineralogy graphs ..............................................38
2. FIB Sample Preparation ..................................................................................39
3. EMPA Microprobe Analysis Table: ................................................................40

5 | P a g e
List of Figures
Figure.1: (a) Monocrystalline: Black lines mark grain boundaries and the red lines are
twin planes 60° (111). X–Y marks location of electron microprobe transect; (b)
Kikuchi lines obtained during orientation mapping of sample; (c) Atomic
number contrast image of area mapped in (a) showing bright zones at grain
boundaries representative of Ag depletion in the alloy. (Hough et al. 2007). 14
Figure 2. Phase diagram in Au-Cu-Ag system at temperature less than 100ºC (Knight
and Leitch 2001) .......................................................................................... 15
Figure 3: Phase diagram in Au-Ag-(Pt+Pd) system from literature. ........................... 16
Figure 4: Binary System of Au and Rh (Guha 1985). ................................................. 17
Figure 5: (a) Edge of the gold particle with aluminosilicates; (b) Gold particles in the
silicate matrix is highlighted in the red......................................................... 23
Figure 6. Boundary between Ag depleted rim and Ag rich core (blue dotted line)
associated with EDS elemental Maps. .......................................................... 24
Figure 7. (a) Back-scattered electron (BSE) image of gold nugget and rim area (inset).
Note the alternate sequence of Ag-rich core, Au-rich rim, and Ag-rich rim.
Porosity in rim; (b) Plot of Ag vs. Au showing variation of the chemical
composition of Au nuggets (groups 1, 2, and 3); (c) Plot showing and positive
correlation of Pd and Rh vs. Ru; (d) EPMA traverse through the rim of Au
nugget. Note the increase in the concentration of Pd, Rh, Ru, Se, S and Hg
towards the in rim of nugget. ....................................................................... 24
Figure 8. (a) Change in the relative concentration of Ag & PGE along traverse, A to B;
(b) Graph of concentration. .......................................................................... 26
Figure 9. (a): HAADF-STEM image of the contact between Au-rich rim and Ag-rich
core associated with TEM-EDS elemental mappings. Note: core structure is
truncated where it meets the rim of the particle, core individual lamellae 50 –
700 nm separated into nanodomains caused by strain, lack of porosity in TEM:
(i) inverse relationship between Au and Ag; and (ii) homogeneous distribution
of Ru and Pd, which document lack of (Ru, Pd) nanoparticles; (b) Fragment of
the EDS spectrum of documenting presence of Ru in the matrix of Au nuggets.
.................................................................................................................... 27
Figure 10. Low-magnification BFTEM image showing polycrystalline lamellar texture
of the Ag-rich core of the Au nugget, No PGE particles within the sample area
observed; (b) TEM of Grain boundaries between (Au,Ag)-lamellae. The white
markers indicate the position of HR-TEM images. (c-e) HR-TEM images of
“corrosion” like grain boundary; (c) Looks like replacement reaction boundary,
however is a single crystal of gold with accumulated stain, diffraction pattern;
(d) Fast Fourier Transform (FFT) analysis of the HR-TEM image revealed the
presence of twinning; (e) Periodic array of edge dislocations associated with
FFT of the HRTEM images. Note the multiple, diffused diffraction maxima
(right corner) from a pile up of dislocations which result in multiplication of

6 | P a g e
the diffraction maxima; (f) BFTEM image of the dislocated grain boundaries
between individual domains of gold............................................................. 28
Figure 11. (a) Crystal growth in core; (b) lamellae gold crystallography in gold rich core
High resolution TEM (HRTEM) with defined diffraction pattern SAED for the
overlapping, Ag-rich core and Au-rich rim. ................................................. 29
Figure 12. a); Mineralogy Composition (At%) Spectrum 15, Orthoclase (KAlSi₃O₈); (b)
Mineralogy Composition (At%) Spectrum 16, Plagioclase (Albite)
(NaAlSi3O8); (c) Mineralogy Composition (At%) Spectrum 17, Biotite
(K(Mg,Fe)3(AlSi3O10)(F,OH)2); (d) Mineralogy Composition (At%)
Spectrum 18, Chlorite ((Mg,Fe)3(Si,Al)4O10(OH)2·(Mg,Fe)3(OH)6); (e)
Mineralogy Composition (At%) Spectrum 19 Possible Garnet (X3Y2(SiO4)3)
or Chlorites; (f) Mineralogy Composition (At%) Spectrum 20, Hornblende,
((Ca,Na)2-3(Mg,Fe,Al)5(Si,Al)8O22(OH,F)2); (g) Mineralogy Composition
(At%) Spectrum 21, Quartz, (SiO2); (h) Mineralogy Composition (At%)
Spectrum 22, Hornblende. ........................................................................... 38
Figure 13. (a) BSE Image, Au/Ag boundary; (b)BSE Image, Au/Ag Boundary Sample
Zone; (c) SE Image Carbon top, initial trenching, (d) SE Image Finished
trenching (e) SE Image, U cut and welded on needle; (f) SE Image, , Welded
onto pin; (g) SE Image,, Prior to Thinning; (h) SE Image, Final Thin Section
for TEM. ..................................................................................................... 39
List of Tables
Table 1: Crystallographic information of Au, Ag, and PGE ....................................... 15
Table 2: EMPA Microprobe Analysis ........................................................................ 40

CHAPTER 1: INTRODUCTION
7 | P a g e
Chapter 1: Introduction
Deposits that contain gold have often been subjected to rigorous extraction due to
the valuation of gold by society (Butt and Hough 2009). This value has scarcely
evolved beyond a decorative element, but as technological advances continue, the
value of gold is being placed in its nanoscale characteristics for biomedical and
mechatronics applications. To utilise gold for economical and efficient extraction
of gold for use in these applications reasons it is important to understand where the
gold originates from, and the forms and associations it has with other elements
during formation. Gold can form via either primary or secondary mechanisms.
Gold most often occurs at various areas of geomorphologic movement (Boyles
1979). Primary (hypogene) gold is gold that has been deposited from high-
temperature hydrothermal fluids. Ore bodies that support gold formed from these
systems, or the placers derived from them, are the most commonly mined deposits.
Most primary gold consist of an alloy of Au and Ag, with the Au/Ag ratio >1. The
gold typically contains 5–20 wt. % Ag, but in some deposits, it is essentially pure
whereas, in others, the Ag content may exceed 50%.
1.1 Scope
The scope of this project was understanding and clarifying the mineralogical
form of Platinum Group Elements (PGEs) at both a micro and nanoscale within
gold nuggets from Ruby Creek, British Columbia, Canada. These samples have
been generously supplied by Dr. Artur P. Deditius and Dr.Fernando Barra as
part of a mineralogical series on the area. For this work, a set of microscopic
techniques was utilized. The Ruby Creek deposit is a placer deposit often the
source of gold, silver and PGEs samples due to the alluvial nature of the noble
metal accumulation deposit (deposit of dense particles) (Hora, Pivec, and
Langrova 2011, Mihalynuk et al. 2017). PGEs are a specific group of noble
metals that display similar chemical and physical characteristics to one another.
They include: platinum (Pt), palladium (Pd), osmium (Os), ruthenium (Ru),
rhodium (Rh) and iridium (Ir). However, PGEs have a strong affinity towards

CHAPTER 1: INTRODUCTION
8 | P a g e
arsenic (As), sulphur (S), selenium (Se) and tellurium (Te) which result in
complex mineralogy. So far, 144 minerals of PGE were identified (Smith and
Nickel 2007).
There are two possible formations of these elements in gold: (i) solid solution
and (ii) mineral nanoparticles separated from the Au structure. Complete solid
solution can occur between the Au-Ag system. However, current binary
diagrams between individual PGEs and Au (Ag) show no or very limited solid
solution (Okamoto and Massalski 1984). In the presence of intermediate
compounds such as the Au-Cu system; i.e. Auricupride (Cu3Au) limited solid
solution can occur with Au-Ag-PGE systems. Limited research has been
completed in this area of mineralogy.
1.2 Objectives
This project attempts were made to elucidate the mechanisms of incorporation,
the form, and the solid-state solubility of Platinum Group Elements (PGEs) in
gold nuggets at the nanoscale. In addition, the fate of PGE during alteration of
Ag-bearing gold nuggets were evaluated. This research is the foundation of
multiple scientific papers, as part of a mineralogy series on the supplied Ag
nugget samples.

CHAPTER 2: LITERATURE REVIEW
9 | P a g e
Chapter 2: Literature review
The literature review incorporates strong elements of high level geology and
mineralogy to assist in the understanding of the research completed. Too little work
has been completed in this area of Nano mineralogy of gold geochemistry and
crystallisation to analyse what has been completed and assess the gaps. This is the
start of research in this area of mineralogy.
2.1 Types of Gold Deposits
Gold is often associated with a wide variety of minerals, with the highest
occurring association being quartz, but this varies greatly on each individual
deposit. Deposits of Au occur in the following time periods: Late Archean
(for greenstone-hosted organic Au deposits), Paleoproterozoic (for iron
oxide–copper–gold and lode gold deposits), and the Phanerozoic (for
porphyry and epithermal deposits, Carlin-type Au deposits,) (Boyles 1979).
Formation of gold deposits often corresponds with phases of new crustal
growth, although these deposits are not necessarily at newly formed crustal
areas (Sun et al. 2010).
Majority of gold containing deposits are porphyry deposits. They are formed
from converging tectonic plates at subducting zones where the oceanic crust
is depressed under the continental plate. This causes the upper mantle to melt
partially and forces magmatic material to the surface. Fluidisation of the
magmatic material disperses through various sized fissure areas. As the
material cools, the metal precipitates from solution and migrates from the
starting place. Typically, they are large with low grade dominant minerals
associated with gold being Cu and Mo-bearing phases. These types of
deposits contain ~20% of the world’s gold (Palacios et al. 2001).
When formation occurs at lower temperatures to porphyry deposits,
epithermal deposits occur. Deposits often have a combination of both
formations within the regional area. Epithermal deposition is the formation
from subaerial hydrothermal systems initiated by heat emanating from
magmatic material and occasionally subterranean ground water at basin
bounding faults (Tosdal, Dilles, and Cooke 2009). This deposition can be

CHAPTER 2: LITERATURE REVIEW
10 | P a g e
subdivided into two groups based on mineralogical compositions: (1) quartz
± calcite ± adularia ± illite and (2) quartz + alunite ± pyrophyllite ± dickite ±
kaolinite (Simmons, White, and John 2005). For group one the mineralogical
composition is formed to the environmental conditions being at neutral pH
and low sulphurisation to moderate sulphurisation (Sillitoe and Hedenquist
2003). Geothermal system is often volcanic rifting with meteoric water
circulated within the zone (Tosdal, Dilles, and Cooke 2009). Deeper the
water is generally chloride dominate with less of a sulphide content. The
mineralogical composition of group two has formation that occurs in mid to
high pH environments within largely sulphide based deposits (White and
Hedenquist 1995); Although usually more associated with close surface
magmatic-hydrothermal systems that are often highly acidic in nature
(Tosdal, Dilles, and Cooke 2009). This type of deposit is potentially able to
transport extremely large amounts of precious and base metals (Williams-
Jones and Heinrich 2005). Despite the size of the deposits they are often
formed within 1000s or even 100s of years. This is almost geologically
instantaneous.
Both porphyry and epithermal deposits are sources for gold. Both instances
have significant lithospherical geological profiles revolving around
metamorphism in the mantle layer with hydrothermal fluidisation exolving
oxidised magmatic material that penetrates the crustal layer where the
physiochemical properties of the fluid cause precipitation of the precious and
base metals. (Walshe and Cleverley 2009).
The continuum model (Phillips and Powell 2009) is used to attempt to
understand Archaean gold forming deposits (Phillips and Powell 2009).
Often this is the orogenic Au deposits (gold-only) and is a type of deposit
that has formed over a 3-billion-year period (from as early as the Middle
Archean in the Precambrian to the current day). Characteristics of the
orogenic Au deposits are metamorphosed mid crustal blocks that are often
deformed. (Goldfarb, Groves, and Gardoll 2001) such as the Archaean
greenstone belts (Phillips and Powell 2009). The model projects that the
hydrothermal Au deposits are formed at temperatures either above 700οC or

CHAPTER 2: LITERATURE REVIEW
11 | P a g e
below 180οC, and in a 20-25 km upright, crustal profile. However, the
continuum model however does not sufficiently cover why the orogenic Au
formations occur as they do. These mechanisms of formation, although well
documented, is not comprehended but the continuum model. Further research
is still needed to understand formation of gold deposits at a mineralogical
and geochemical level.
Post igneous formation of deposits, many are subjected to sedimentary
processing to produce placer alluvial deposits. Majority of gold nuggets are
formed in alluvial deposits and regions where the surrounding area is deeply
weathered residual regolith as the gold erodes from the hosting rock and is
transported, most often down streams and rivers (Hough, Butt, and Fischer-
Bühner 2009). Previous work has found that the Au, Ag and Cu contents of
alluvial gold grains in Chile could be traced to their potential host formation
(Townley et al. 2003). Silver-rich (5 At %) grains with low Cu (0.1%) were
found to come from epithermal systems and grains even richer in Ag (8%)
but with low Cu (0.1%) were from Au-rich porphyries. Grains richer in Cu
(up to 0.75%) with variable Ag contents, not surprisingly represented Au-
rich Cu porphyries. Previous work found that alluvial gold grains in SW
England contained appreciable Pd (3.1%), similar to the local primary
mineralization (Chapman, Leake, and Moles 2000).
Clear geological understanding is the foundation of mineralogy. By
understanding the origin and formation of the original samples and gold
itself, estimations can be made on the mechanisms that produced the samples.
2.2 Deposition and Transport of Gold
Gold is effectively insoluble in water (Williams-Jones, Bowell, and
Migdisov 2009) and commonly occurs in colloidal form. Colloids, are
defined as the “particles that occupy the size range between true solutions
and suspensions” (Eby 2016). In this form, Au precipitates in its physio-
chemical properties. Au’s furthest outer electron cloud is readily delocalised
because of weak bonding between individual Au ions (Eby 2016). This

CHAPTER 2: LITERATURE REVIEW
12 | P a g e
causes formation of small Au clusters with charged outer surfaces (usually
negative) that repeal each other to form colloids (collections of gold
nanoscale particles) (Cobley and Xia 2009). This phenomenon frequently
occurs during abrupt decrease of temperature that causes precipitation of
gold. This suggests that colloidal gold may remain in suspension for extended
periods. As such, it can be transported in low temperature environments,
often accompanied by super saturation and polymerization of silica (Eby
2016).
Due to gold being a noble metal, it is less to almost no reactive at the surface
when in contact with aquatic/aqueous environments as well as sulphide and
chloride depleted gases. This causes gold to commonly occur in its native
form. Gold dissolution and deposition is controlled by a hydrogen / sulphide
/ oxygen reaction at temperatures up to 350oC and can be promoted by
decreasing the activities of the other species and increasing the pH of the
reaction (Hough, Butt, and Fischer-Bühner 2009). Sulphidation of wall rock
is a process that can decrease the sulphur content of the mineralizing fluid.
The sulphurisation of hosting iron mineral rocks occurs for example can
cause the sulphur in solution with gold is significantly reduced. This is often
why gold deposits are found in very close proximately to iron sulphides.
The oxidation reaction reduces the activity of the oxygen species that causes
the Au precipitation to be minimalised as Au solubility in solution is
increased. This oxidation could occur through interaction of the ore-bearing
fluid with a hematite-bearing host rock or mixing with oxygenated meteoric
water (Hough, Butt, and Fischer-Bühner 2009). Lastly the deposition of gold
(e.g. As dendrites in amorphous silica) that occurs as a result of flocculation
due to changes in the fluid chemistry. Such as increases in salinity or pH,
both of which may occur as a result of boiling or fluid mixing (Williams-
Jones, Bowell, and Migdisov 2009).

CHAPTER 2: LITERATURE REVIEW
13 | P a g e
2.3 Content of PGEs in Gold Geology
Some Au/Ag deposits contain PGEs in the form of platinum group minerals
(elements being distinctly different to mineralogical compounds (minerals)).
One geological instance of this is in Catalonia, Spain within sulphide-rich
shales that are closely linked to arsenic (Canet et al. 2003). These PGE
minerals are found for: platinum, as sperrylite (PtAs2), and palladium, as Pd-
bearing löllingite (FePd)As2, although native palladium and stibiopalladinite,
Pd5Sb2 can also be found in small quantities (Canet et al. 2003).
Other deposits, such as volcanogenic massive sulphides (VMS), also contain
minor quantities of PGEs. Specifically, Pt (188 ppb), Pd (318 ppb) and Rh
(21 ppb), in selective areas of the Uzelginsk Deposit, Russia (Vikentyev et
al. 2004). Under SEM this sample exhibited actual grains of native rhenium
within the Au/Ag area of formation. Also seen within this deposit is a
relationship between the Au/Ag content (Au at 1.8 ppm and Ag at 35 ppm).
The Au and Ag proportionally increase with each other throughout the
sample, and were uniformly distributed across the micro scale samples
examined (20 -50 µm scales) (Vikentyev et al. 2004). Authors suggested that
mineralogical features, i.e. presence of PGEs, tellurides and arsenides,
implies precipitation of PGEs from Te and As rich hydrothermal solutions
(Vikentyev et al. 2004). This can then lead to an enrichment of PGE in the
mineralogy of the sample even in environments that are unsaturated in PGE.
2.4 Gold and PGE Crystallography
Previous work completed at a microscale on gold nuggets suggest a
monocrystalline structure using EBSD to establish that the crystallographic
orientation has no variation to it (Kikuchi – See Fig.1) (Hough et al. 2007).
Kikuchi lines are used to diagnose monocrystalline structure but at a large
scale. It was perceived that there was no nucleation of new grains within the
core of the sample (Fairbrother et al. 2012).

CHAPTER 2: LITERATURE REVIEW
14 | P a g e
Fig.1: (a) Monocrystalline: Black lines mark grain boundaries and the red lines are twin planes 60° (111). X–Y marks location of electron microprobe transect; (b) Kikuchi lines obtained during orientation mapping of sample; (c) Atomic number contrast image of area mapped in (a) showing bright zones at grain boundaries
representative of Ag depletion in the alloy. (Hough et al. 2007).
Most often to understand relationships of native gold with other elements
occurring in native form is to study their crystal-chemical properties. Table
1 summarizes structural properties of Au and PGEs. With the exceptions of
Rh and Os, the crystal structure of all minerals is isometric hexoctahedral.
All the elements of interest occur within the same region of the periodic table.
One of the possible approaches is to investigate crystal-chemistry of Au and
metals as a function of temperature using binary and ternary diagrams.
The best known binary system is Au-Ag (White, Orr, and Hultgren 1957,
Dowdell et al. 1943). However, there is a limited amount of information on
Au-platinum group elements (PGE) relation. Fig. 1 shows an Au-Ag-Cu
system that attempts to provide a framework for a discussion of the formation
of these rare alloy compositions (Knight and Leitch 2001).

CHAPTER 2: LITERATURE REVIEW
15 | P a g e
It is near impossible to replicate synthetically the equilibrium of Au alloys.
The (Knight and Leitch 2001) research studied over 80 samples of naturally
occuring Au-Ag-Cu nuggets to determine the percentages needed to estimate
the system (Fig. 1).
Figure 2. Phase diagram in Au-Cu-Ag system at temperature less than 100ºC (Knight and
Leitch 2001)
Table 1: Crystallographic information of Au, Ag, and PGE
Element Cell Dimensions Crystal System X-ray Diffraction
Au A = 4.0786, Z = 4; V =
67.85 Den(Calc)= 19.28
Isometric - Hexoctahedral H-M
Symbol (4/m 3 2/m) Space
Group: F m3m
By Intensity(I/Io): 2.355(1),
2.039(0.52), 1.23(0.36),
Ag A = 4.0862, Z = 4;V =
68.23 Den(Calc)= 10.50
Isometric - Hexoctahedral H-M
Symbol (4/m 3 2/m) Space
Group: F m3m
By Intensity(I/Io): 2.359(1),
2.044(0.4), 1.231(0.26),
Pt A = 3.9231, Z = 4;V =
60.38 Den(Calc)= 21.46
Isometric - Hexoctahedral H-M
Symbol (4/m 3 2/m) Space
Group: F m3m
By Intensity(I/Io): 2.265(1),
1.962(0.53), 1.1826(0.33),
Pd A = 3.8824, Z = 4; V =
58.52 Den(Calc)= 12.19
Isometric - Hexoctahedral H-M
Symbol (4/m 3 2/m) Space Group: F m3m
By Intensity(I/Io): 2.246(1),
1.945(0.42), 1.376(0.25),
Ru A = 2.704, c = 4.326, Z
= 2; V = 27.39
Den(Calc)= 16.65
Hexagonal – Dihexagonal
Dipyramidal H-M Symbol (6/m
2/m 2/m) Space Group: P
By Intensity(I/Io): 2.056(1),
2.343(0.4), 2.142(0.35),
Rh A = 3.856, Z = 4; V =
57.33 Den(Calc)= 14.59
Isometric – Hexoctahedral H-M
Symbol (4/m 3 2/m) Space
Group: F m3m
By Intensity(I/Io):
0.7874(1), 0.8623(0.8),
0.8847(0.7),
Os A = 2.714, c = 4.314, Z
= 2; V = 27.52
Den(Calc)= 23.01
Hexagonal – Dihexagonal
Dipyramidal H-M Symbol (6/m
2/m 2/m) Space Group: P 63/mmc
By Intensity(I/Io): 1.22(1),
2.13(1), 1.35(0.6),
Ir A = 3.8394, Z = 4; V =
56.60 Den(Calc)= 21.45
Isometric - Hexoctahedral H-M
Symbol (4/m 3 2/m) Space
Group: F m3m
By Intensity(I/Io): 2.217(1),
1.9197(0.5), 1.1574(0.45),

CHAPTER 2: LITERATURE REVIEW
16 | P a g e
The system takes into account limits set on exsolution growth from the study
by (Murzin et al. 1983) for the concentrations of Ag in Au–Cu alloy and the
amount of Cu in Au–Ag alloy beyond which exsolution occurs. Within the
study the sample values for Cu in Au–Ag alloy are below 100°C and the Cu
practically non-existent in other samples (Knight and Leitch 2001).
However, in cases of extremely low Cu content were not used in the diagram
created (Figure 3).
2.5 Miscibility in Au-Ag-PGE system
A published phase diagram for Au-Ag-PGE systems does not exist in
published literature. The diagram created for this document in Fig. 2 is an
accumulation of published work done on gold samples that contain Ag (0-
63%) and the PGEs, Pt and Pd (0-15% cumulatively) set as weight percent.
There is a very limited amount of information on this particular ternary
system. However, one early conclusion is derived from the similarity to
Fig.1, is the ratios of Au-Ag-Cu being very similar to the Au-Ag-(Pt+Pd).
Figure 3: Phase diagram in Au-Ag-(Pt+Pd) system from literature.(174 separate articles
listed in refernces)
CHAPTER 2: LITERATURE REVIEW
17 | P a g e
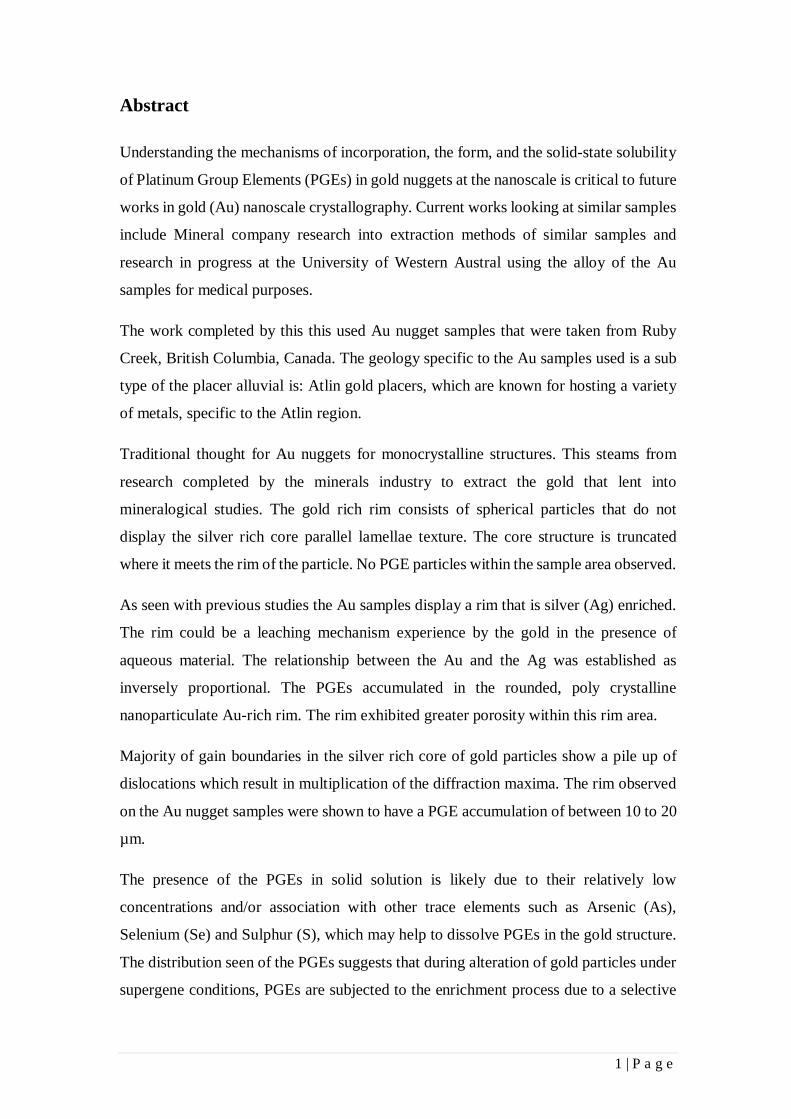
There has been efforts to understand through phase diagrams of various
binary Au systems with singular PGEs, such as in (Okamoto and Massalski
1984) where the diagram between Au and Os was attempted. In (Guha 1985)
there are binary systems of Au-Pt, Au-Pd, and Au-Rh (see Figure ##). These
binary systems exist at high temperature ranges (600 -2200οC) with large
exclusion zones of formation where high percentages of PGE were unlikely
to occur below the higher temperature range (>1500οC) (Guha 1985).
Figure 4: Binary System of Au and Rh (Guha 1985).
2.6 Alteration of Au Nuggets – Previous literature on Ag Depleted Rims
Previously mentioned, Au and Ag are geologically commonly associated.
This is only currently confirmed at the macro scale. Both Au and Ag have
the same atomic radius and crystal systems, so they can form a continuous
alloy series (See Table 1). When the Ag content exceeds 20 wt.%, the alloy
is termed electrum (Hough, Butt, and Fischer-Bühner 2009). It was noted that
gold nuggets altered under near-surface conditions exhibit the core rim
texture. Rimming is a common feature on gold nuggets enriched with Ag and
being exposed to weathering under Earth surface conditions; i.e. critical
zone.

CHAPTER 2: LITERATURE REVIEW
18 | P a g e
The external layer of Au nuggets are usually a few microns thick, is enriched
with Au and depleted in Ag and other metals if present (Groen, Craig, and
Rimstidt 1990). In the instance of Ag depletion, the structure of gold rim has
a lack of inclusions of Ag. The boundary between Ag-rich and Ag-depleted
areas follows distinctive crystal boundaries. This suggests that silver
depletion is a result of interaction with altering fluids (Aqueous based) than
dissolution and re-precipitation of Au.
This depletion is cause by preferential leaching of the silver in alluvial
settings. This is because the silver is more readably soluble than Au (Hough
et al. 2007). Although the crystalline nature of the grains specifically is
limited, it justifies the observation of the internal veining of the material.
However, there is a limited knowledge on the geochemical behaviour of
PGEs during alteration of Au nuggets.
For example, the Kondyor PGE placer deposit, Khabarovskiy Kray, Russia
is one deposit that exhibits a gold-rich rim, with four groups of gold alloy
present: tetra-auricupride, Au–Ag ratio (98–54 wt. % Au, to relevant Ag %),
Au–Ag–Cu–Pd and Au–Pd–Cu alloys (Shcheka et al. 2004). The inner
portion contains a host of PGE elements with a proportionally different
Au/Ag ratio. Although shown to exist, the focus of the paper remained on
macro crystals of Pt-Fe alloys over Au/Ag ratios or the Au rich rim itself.
Studied samples from Ruby and Wright creeks (BC, CAD) display a similar
rim pattern that is linked to the depletion of Ag, Hg and Cu from the gold
nuggets. This is displayed within the sample as small pitting (Hora, Pivec,
and Langrova 2011). For Atlin gold samples the rims are linked to the
identified bedrock source in Klondike District, Yukon (Knight, Morison, and
Mortensen 1999).
2.7 Mobilisation of Gold
Under surface conditions, gold occurs in aqueous solution in colloidal form
[Au(0)] and in aurous [Au(I)] and auric [Au(III)] complexes; the standard

CHAPTER 2: LITERATURE REVIEW
19 | P a g e
reduction/ oxidation potentials of Au+ (1.68 V) and Au3+ (1.50 V) exceed
that of water (1.23 V), which makes the sustainability of free gold ions
thermodynamically unfavourable (Boyles 1979) (Southam et al. 2009). This
Ag depleted rim could to be due to supergene gold mobility within a
thiosulphate complex under alkaline to neutral pH.
In this instance, the thiosulphate is attached to the flexible extended chain of
a humic acid as smaller molecules. A humic substance is a type “of naturally
occurring, biogenic heterogeneous organic substance that can generally be
categorised as being ... of high molecular weight and refractory” (Eby 2016,
Groen, Craig, and Rimstidt 1990). Specifically, a humic acid is a humic
substance that is soluble in water at pH greater than 2. Humic acids in the
presence of dense vegetation allow for Au mobility in subsurface waters.
This mobility can affect older Au grains, detrital organics or newly formed
iron sulphides (Eyles and Kocsis 1988, Eyles 1990, Groen, Craig, and
Rimstidt 1990, Bakos et al. 2004).
Bacteria can also be a mechanism of metallic mobility. The metallophillic
bacteria Cupriavidus metallidurans CH34 (C. Metallidurans) is able to
biomineralise Au nanoparticles due to an Au-regulated gene that causes
energy dependent reductive precipitation of Au (III) auric complexes. (Reith
et al. 2009). These bacteria are essential to biogeochemical recycling of Au,
PGEs and other precious metals that share geochemical properties similar to
Au (Rauch and Morrison 2008). This nanoscale bacterial mobility could also
be a factor in the gold rim formation
Bacterial Biofilms associated with the Ralstonia metallidurans show an
aerated network of budding spherical particles as small as 3 µm (Reith et al.
2006).

CHAPTER 3: ANALYTICAL METHODS
20 | P a g e
Chapter 3: Analytical Methods
Scanning Electron Microscopy imaging and elemental mapping was completed on
the FEI Verios 460 SEM. Compositional analyses were acquired on a JEOL 8530F
electron microprobe equipped with five tuneable wavelength dispersive
spectrometers.
Operating conditions were 40 degrees take-off angle, an electron beam energy of
25 kev, and a 40 na beam current. The beam was fully focussed. Elements were
acquired using analysing crystals lif for Fe K, Au L, Te L, Cu K, Ni K, Co
K, Cr K, Hg L, Re L, Os L, Ir L, Pt L, V K, Mn K, PETH for Pb M,
Sb L, Bi M, Ti K, PETJ for S K, Ag L, Pd L, Ru L, Rh L, and TAP for
As L, Se L and Si K.
The standards used for X-ray intensity calibration were a selection of elements,
synthetic and natural minerals: synthetic Cr2O3 for Cr K, galena for Pb M, S K,
pyrite for Fe K, rutile for Ti K, Bi2Se3 for Se L, Ag for Ag K, Cu for Cu K,
Ni for Ni K, V for V K, wollastonite for Si K, Co for Co K, Bi for Bi M, Pt
for Pt L, Sb for Sb L, arsenopyrite (Asp200) for As L, Mn for Mn K, Au for
Au L, Ru for Ru L, Rh for Rh L, Pd for Pd L, Os for Os L, Ir for Ir L, Re
for Re L, Te metal for Te L, and synthetic hgte (coloradoite) for Hg L.
The on-peak counting time was 20 seconds for V K, Mn K, Ti K, and 30
seconds for Fe K, Se L, Au L, Te L, Cu K, Pb M, Ni K, Co K, Ag L,
Bi M, Si K, Pd L, Ru L, Rh L, Cr K, Hg L, Re L, Os L, Ir L, Pt L,
S K, As L, Sb L. Mean atomic number (MAN) background intensity was used
throughout (Donovan and Tingle 1996, Donovan, Singer, and Armstrong 2016).
Unknown and standard intensities were corrected for deadtime. Interference
corrections were applied to S for interference by Co, and to As for interference by
Sb, and to Sb for interference by Bi, and to Fe for interference by Pb, and to Se for
interference by As, Co, and to Te for interference by Co, and to Bi for interference
by S (Donovan, Snyder, and Rivers 1992). The matrix correction method was the
ZAF algorithm of Armstrong/Love Scott (Armstrong 1988)

CHAPTER 3: ANALYTICAL METHODS
21 | P a g e
The thin-foil were cut perpendicular to the boundary between Au-rich rim and Ag-
rich core. Samples were prepared by using FEI Helios nanolab G3 CX dualbeam
and focused ion beam (FIB) at CMCA in UWA. Sections were extracted from the
sample surface by in-situ lift-out, welded onto a copper grid, thinned to electron
transparency with a 30kv ion beam where the beam current was progressively
reduced from 2.5na to 0.23na, and then finally polished with a 5kv beam with a
41pa current (See appendix 1 through 3). Subsequently, the samples were analysed
by using a Titan G2 80-2090 TEM/STEM with chemistem technology at 200kv.

CHAPTER 4: RESULTS
22 | P a g e
Chapter 4: Results
4.1 Location and Description of Samples
The geology specific to the Au samples used is a sub type of the placer alluvial
is Atlin gold placers, which are known for hosting a variety of metals, specific
to the Atlin region. The Atlin region consists of sedimentary material formed
from Mississippian to Jurassic age, and ophiolitie of Late Permian to Triassic
age, and Middle Jurassic, Cretaceous and Tertiary igneous rock (Hora, Pivec,
and Langrova 2011). Although the ages are various, the Atlin area has dales that
score the native bedrock and have become modified to support glacial and
glaciofluvial deposits (Levson et al. 2003). Bedrock that hosted the gold that
supplies the Atlin region is majority unknown. However, a distinctive pattern
of placer streams on every side of surprise lake batholiths exists, with the coarse
gold particles found within streams that run along the margin.
The gold particles have rounded or flaky morphology with maximum dimension
of 1 cm. The back scattered electron (BSE observations show a rim-core texture
of variable thickness from few to ~ 100 µm (Fig. 4 (a)). The rim is composed
of two different zones: (i) brightest in BSE, 10-80 µm thick inner zone
containing relatively large pores, 10-20 µm in diameter; and (ii) darker in BSE
(same grey level as the core in BSE), ~10 µm thick outer zone containing
numerous and smaller pores < 5 µm in diameter.
4.2 Paragenisis and Composition
As previously mentioned, all three samples tested were Au nuggets with silver
inclusions. The gold content across the sample is lowest at 74 wt. % up to 98.9
wt. %. The Ag content across the sample also had a large range between 0.5 wt.
% to 26 wt. %. The microprobe analysis establishes that the PGEs exist in
variable quantities in the sample. (Full microprobe data can be seen in Appendix
3). The PGE percentage is approximately 0.5 wt. % to 1.4 wt. % across the
sample. Other elements are shown to be present in the sample in small
percentages (maximum content given): Se (2.5 wt. %), As (2.3 wt. %), Hg (1.3

CHAPTER 4: RESULTS
23 | P a g e
wt. %) Fe (0.8 wt. %), Bi (0.6 wt. %), Si (0.5 wt. %) Pb (0.4 wt. %), and S (0.4
wt. %). Smaller inclusions of Ti, V and Mn exist above detection limits.
Surrounding the sample is mineralogy that is encased in the boundaries. The
compositions of these minerals (Appendix 1) suggest the area is comprised of
mostly feldspars (primarily orthoclase but some plagioclase varieties are also
present), quartz, biotite, chlorites, hornblende and possibly garnet group
minerals. These estimations are from chemical breakdowns in Fig.10. There is
an arbitrary cohesion of the minerals in the edge of the sample (Fig.5a). Au
inclusions can be seen speckled in the sample as seen in (Fig.5b).
Figure 5: (a) Edge of the gold particle with aluminosilicates; (b) Gold particles in the silicate matrix is highlighted in the red.
4.3 Silver Depleted Rim
The texture of the Au nugget is simplistic under the SEM imaging. As seen from
previous studies the Au samples display a rim that is Au enriched. The rim is a
sign of either a leaching mechanism experience by the gold in the presence of
aqueous material composed of Cl, Br and SO4 or other biogeological
mechanisms. This area extends between 2-20 microns thick.
CHAPTER 4: RESULTS
24 | P a g e
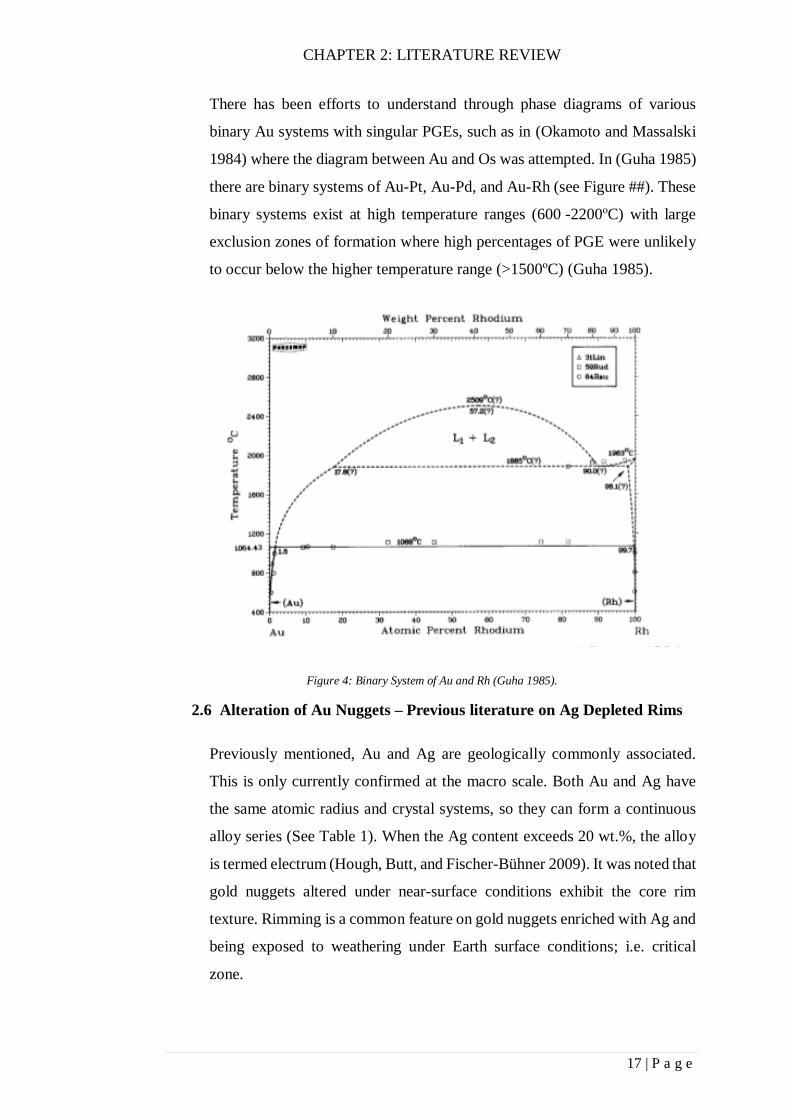
Figure 6. Boundary between Ag depleted rim and Ag rich core (blue dotted line) associated
with EDS elemental Maps.
Around the edge there is noticeable deterioration within the porous area that are
less frequently seen in the core. The distinctive rim is brighter on the edge due
to the higher percentage of Au in this area (Fig. 6) (Fig.7a).
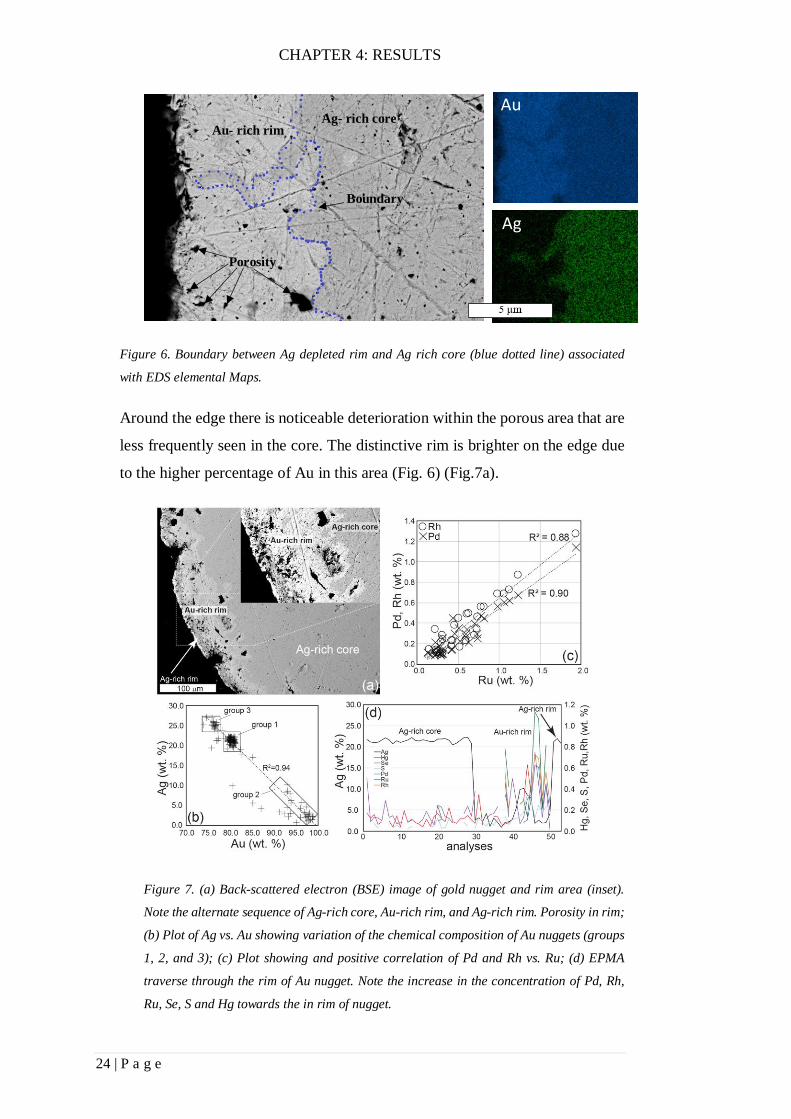
Figure 7. (a) Back-scattered electron (BSE) image of gold nugget and rim area (inset).
Note the alternate sequence of Ag-rich core, Au-rich rim, and Ag-rich rim. Porosity in rim;
(b) Plot of Ag vs. Au showing variation of the chemical composition of Au nuggets (groups
1, 2, and 3); (c) Plot showing and positive correlation of Pd and Rh vs. Ru; (d) EPMA
traverse through the rim of Au nugget. Note the increase in the concentration of Pd, Rh,
Ru, Se, S and Hg towards the in rim of nugget.
Au
Ag
Au- rich rim Ag- rich core
Boundary
Porosity

CHAPTER 4: RESULTS
25 | P a g e
The relationship between the Au and the Ag is inversely proportional
(Fig.7b). The graph shows three distinct areas with two different cores
(groups 1 and 3) and the combined rim.
Group 1 is a tightly packed area and expresses a 20-22% Ag content with
78-80% Au. As the core makes up majority of the sample, this collection
represents this area. The concentration is dense as the core is crystalline
growth that are regular in composition. The lack of external interaction
means the zone is analogous in composition.
Group 2 is a cluster that is comprised of the rim of the samples. The Au is
proportionally high (90-99%) compared to the Ag content (0-5%). The
scattering in this group is due to the variability of the Ag removal from the
rim and subsequent replacement of Au in this area. This inconsistency leads
to greater unpredictability in this group. Despite this, both rims from each
sample fall in this group.
Group 3 is comprised of 22-25% Ag with only 75% Au. This core has a
greater silver content than the other core sample. The PGE elements appear
to form with each other within the sample. Positive liner correlation exists
with Pd and Rh when associated with the Ru (dominant PGE) (Fig.7c).
The data from the EPMA traverse in (Fig. 7d) indicates the percentage
relationship between the Au and the Ag is negatively correlation with the
core having an estimated average of 22-23% Ag and only 2-3% within the
rim. The PGE data that exists above the detectable limit seem to concentrate
around where the Ag is lower in concentration with the Ag trough at analysis
47 showing peaks of Pd, Rh and Ru especially. The Au sample has various
areas of porous zones residing in both the core and the rim (see Fig. 7a).
Most of the porous area is seen along the Ag depleted rim. These areas are
viable as potential areas of reactivity with environmental exposure. Majority
of pores are in the rim and increases towards to rim of the nuggets (Fig. 7a).

CHAPTER 4: RESULTS
26 | P a g e
Figure 8. (a) Change in the relative concentration of Ag & PGE along traverse, “A” to “B”;
(b) Graph of concentration.
A section of sample was examined for both Ag and PGE elements from
points A to B (Fig. 8a). The data shows a relationship between the Ag and
PGE. As the Ag is removed from the sample in the lighter areas, the PGE
content increases in those areas (Fig. 8b).
4.4 Structure and Composition of Gold at the Nanoscale
The structure of the sample produced a different image than expected.
Traditional thought is at the microscale (then presumably the nanoscale) Au
nuggets for monocrystalline structures. The gold rich rim consists of spherical
particles that do not display the silver rich core parallel lamellae texture. The
core structure is truncated where it meets the rim of the particle (Fig. 9a). The
rim is of variable size up to 1 micron, core individual lamellae 50 – 700 nm
separated into nanodomains caused by strain. There is a lack of porosity passing
from rim to core during TEM.
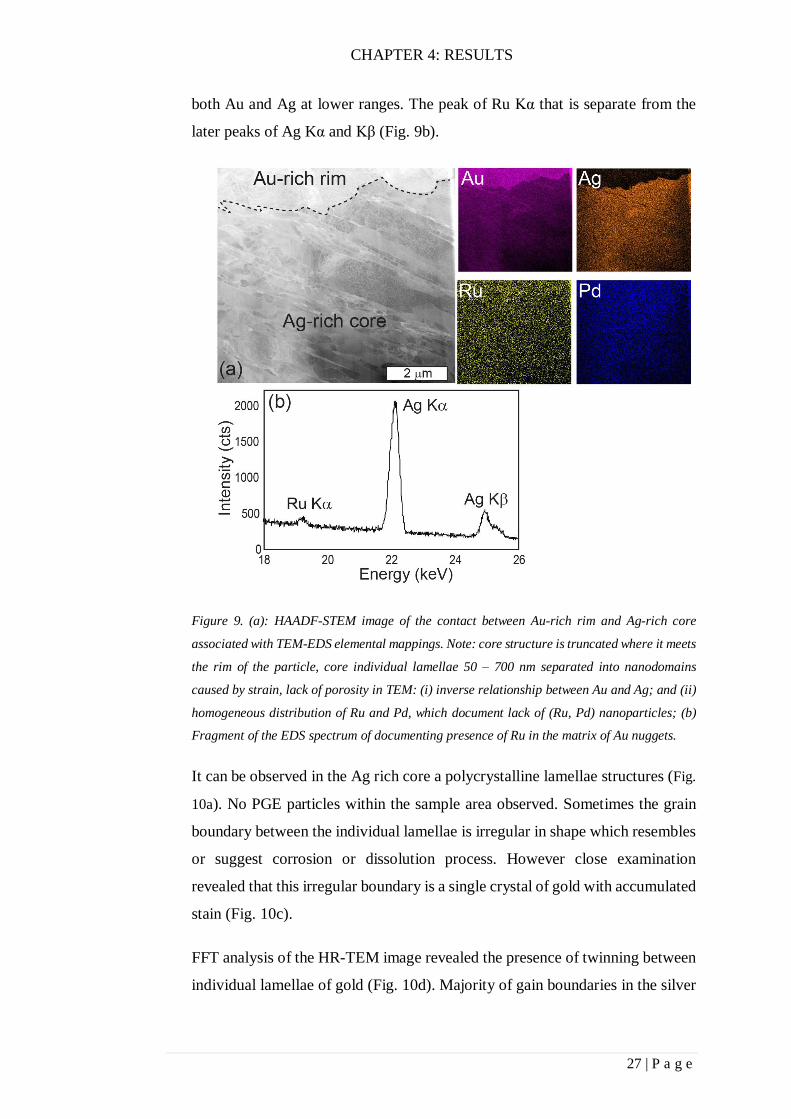
Elemental maps make the distinction clearer with the Ag absent in the rim. The
composition of this sample did not have Pd in high enough quantity to be
detected by instrumentation, however the Ru was above the detection limit. The
Ru appears homogeneous across the entire sample (core and rim)sample with
no distinctive particles of Ru (or any PGE) in the elemental maps. Higher energy
ranges were used to see peaks of the PGE material that usually overlaps with
0.0
0.5
1.0
1.5
2.0
2.5
3.0
3.5
4.0
4.5
5.0
0.0
5.0
10.0
15.0
20.0
25.0
30.0
PG
E co
nte
nt
(wt.
%)
Ag
con
ten
t (w
t. %
)
Ag
PGE Combine
B A
(b)
(a)
Au- rich
rim
Ag- rich
core
CHAPTER 4: RESULTS
27 | P a g e
both Au and Ag at lower ranges. The peak of Ru Kα that is separate from the
later peaks of Ag Kα and Kβ (Fig. 9b).
Figure 9. (a): HAADF-STEM image of the contact between Au-rich rim and Ag-rich core
associated with TEM-EDS elemental mappings. Note: core structure is truncated where it meets
the rim of the particle, core individual lamellae 50 – 700 nm separated into nanodomains
caused by strain, lack of porosity in TEM: (i) inverse relationship between Au and Ag; and (ii)
homogeneous distribution of Ru and Pd, which document lack of (Ru, Pd) nanoparticles; (b)
Fragment of the EDS spectrum of documenting presence of Ru in the matrix of Au nuggets.
It can be observed in the Ag rich core a polycrystalline lamellae structures (Fig.
10a). No PGE particles within the sample area observed. Sometimes the grain
boundary between the individual lamellae is irregular in shape which resembles
or suggest corrosion or dissolution process. However close examination
revealed that this irregular boundary is a single crystal of gold with accumulated
stain (Fig. 10c).
FFT analysis of the HR-TEM image revealed the presence of twinning between
individual lamellae of gold (Fig. 10d). Majority of gain boundaries in the silver

CHAPTER 4: RESULTS
28 | P a g e
rich core of gold particles show a pile up of dislocations which result in
multiplication of the diffraction maxima (Fig. 10e and f).
Figure 10. Low-magnification BFTEM image showing polycrystalline lamellar texture of the
Ag-rich core of the Au nugget, No PGE particles within the sample area observed; (b) TEM of
Grain boundaries between (Au,Ag)-lamellae. The white markers indicate the position of HR-
TEM images. (c-e) HR-TEM images of “corrosion” like grain boundary; (c) Looks like
replacement reaction boundary, however is a single crystal of gold with accumulated stain,
diffraction pattern; (d) Fast Fourier Transform (FFT) analysis of the HR-TEM image revealed
the presence of twinning; (e) Periodic array of edge dislocations associated with FFT of the
HRTEM images. Note the multiple, diffused diffraction maxima (right corner) from a pile up of

CHAPTER 4: RESULTS
29 | P a g e
dislocations which result in multiplication of the diffraction maxima; (f) BFTEM image of the
dislocated grain boundaries between individual domains of gold.
The crystallisation can be seen to continue into the Ag depleted rim, however
does not display the same clear structure as the core displays (Fig. 11a). This
degradation of the crystal is seen across other portions of the sample.
Misorientation of overlapping area shows the boundary between the changing
crystal complexes (Fig. 11b).
Figure 11. (a) Crystal growth in core; (b) lamellae gold crystallography in gold rich core High
resolution TEM (HRTEM) with defined diffraction pattern SAED for the overlapping, Ag-rich
core and Au-rich rim.
(a) (b)
Ag-rich core Au-rich rim Overlap

CHAPTER 5: DISCUSSION
30 | P a g e
Chapter 5: Discussion
5.1 Structure of Au in Sample and Predictions
The rim observed on the samples were shown to have a PGE accumulation of
between 10 to 20 µm. The PGEs accumulated in the rounded, poly crystalline
nanoparticulate Au-rich rim. The rim exhibited greater porosity within this rim
area. Despite porosity of the sample it was not observed to host accumulation
of the PGE particles. It was only observed a homogeneous distribution of Ru,
Rh and Pd in the gold matrix and with an apparent lack of PGEs nanoparticles
in the pores (Fig. 9a).
Structurally the sample core displayed the identified lamellae in the Ag-rich
core. The core contains minimum 19.5% of Ag (see Appendix 3) and was
interpreted as an original texture of the sample prior to alterations. The nuggets
studied all display an internal polycrystalline structure with coherent and
incoherent twins that are characteristic of thermal annealing at elevated
temperatures (Fig. 9a) (Hough et al. 2007).
Some studies observed elongated banding (lamellae) as a mylonitic style texture
that formed due to electrorefining (Reith, Stewart, and Wakelin 2012),
sequential dissolution and reprecipitation that lead to the rim forming on the
sample (Groen, Craig, and Rimstidt 1990). In this sample the lamellae observed
were much larger (tens to hundreds of microns) with Au-rich areas between the
structures. For the work completed on the Ruby Creek samples there was no
observed Au-rich areas with the lamellae nanometres large.
The nanoscale size of lamellae in Ag-rich core may be related to the content of
Ag and other impurities, which stabilize the grain boundaries between the grains
and prevent recrystallization. Some boundary areas distressing of gold from
mechanically deformation can be observed (Fig. 10c).
This structural identity of the sample links the gold nugget to igneous host
geology. The periodic array of edge dislocations of crystal intergrowth observed
indicated growth under equilibrium conditions (Fig. 10e and 10f). The
nanoscale size of lamellae in Ag-rich core may be related to the content of Ag

CHAPTER 5: DISCUSSION
31 | P a g e
and other impurities, which stabilize the grain boundaries between the grains
and prevent recrystallization. Alternatively, the rounded nanoparticulate Au-
rich rim could experience recrystallization due to the lack of the impurities.
5.2 Thermodynamics of the Formation of Au Samples
The phase equilibrium for PGE containing samples is limited to thermodynamic
binary phase diagrams of a pure binary system. Previous studies completed
show the contrasting behaviour of PGEs (Ru, Rh and Pd) with Pd being partly
miscible in both Au and Ag (Okamoto and Massalski 1984).
For a pure binary system containing Au-Pd alloys of equal composition form
particles at temperatures of 850-870ºC. Formation is also possible under low
temperature conditions of ~100ºC. Despite the opportunity of formation of
particles of this alloy, no Au-Pd domains were observed within the samples. In
a previous study supergene alteration of palladian gold (Au7Pd) in laterites
resulted in similar behaviour of Pd and Ag, which were depleted in the outer
Au-rich layer (Cabral et al. 2002).
For the other detected PGEs, Rh and Ru, are completely immiscible in Au when
in low temperature conditions of < 526ºC and < 626ºC, respectively. For Ru the
maximum concentration that can be achieved in Au-Ru system for formation is
1.9 at. % at 1066ºC. The Ag-Ru system is moderately higher at 3.1 at. % at
920ºC (Okamoto and Massalski 1984).
The sample is not able to be classified into the binary systems for formation
temperatures due to the impurities present. The presence of the investigated
PGEs in solid solution (Figs. 4 and 5) is likely due to their relatively low
concentrations and/or association with other trace elements such as As, Se and
S, which may help to dissolve PGEs in the gold structure. It is expected that
gold particles enriched with Ag may host more Pd in solid solution as Pd is
completely miscible in Ag.

CHAPTER 5: DISCUSSION
32 | P a g e
The distribution seen of the PGEs suggests that during alteration of gold
particles under supergene conditions, PGEs are either:
(i) delivered to the surface of the Au nugget by altering solutions as
colloids; including processes of dissolution and reprecipitation; or
are
(ii) subjected to the enrichment process due to a selective dissolution of
Ag.
Homogeneous distribution of Ru, Rh and Pd in the gold matrix and lack of
PGEs nanoparticles in the pores advocates for the second scenario (Fig. 9).

CHAPTER 6: CONCLUSIONS
33 | P a g e
Chapter 6: Conclusion
The irrefutable evidence obtained from this study is that the PGEs are in solid
solution in crystal structure in this sample. Exsolution does not occur at the
nanoscale. It can also be said that during the process of alteration, the PGE
accumulate in the Ag removed area.
Understanding the minor and trace element geochemistry of gold nuggets is of key
importance when attempting to elucidate the conditions of gold deposit formation
and establishing new areas for Au exploration. Geologically “instantaneous”
formation of porphyry and epithermal deposits that are subjected to sedimentary
destruction creates a variety of sources that makes gold nugget origins almost
impossible to pin point. The phase attributes and crystallography help to define the
unique nature of the gold particle at both a macro and nanoscale particle scale.
Gold’s association with precious and base metals need more research to understand
why they associate and the complex structures at an atomic scale.
6.1 Future work
The interest in this project will extend into Nano-SIMS academic activity to
have a closer look at the isotopic complexity and to look at the distribution of
isotopes of PGEs in gold sample. Re and PGE (particularly osmium) are the key
elements that will be focussed on. The will also be a focus on the isotopes of all
the PGEs that can be seen with a lower detection limit
Looking for exsolution at absolute nanoscales and to see if the isotopes of the
PGEs fractionate in the gold formation are also main features of the future work
in this area of mineralogy.
REFERENCES
34 | P a g e
References
Armstrong, JT. 1988. "Quantitative analysis of silicate and oxide minerals:
comparison of Monte Carlo, ZAF and phi-rho-z procedures." Microbeam
analysis 23:239-246.
Bakos, F. M Chovan, P Bačo, B Bahna, Š Ferenc, P Hvožďara, S Jeleň, M
Kamhalová, R Kaňa, and J Knésl. 2004. "Gold in Slovakia." Slovenský
Skauting, Bratislava:1-298.
Boyles, RW. 1979. "The geochemistry of gold and its deposits." Geological Survey
of Canada Bulletin 280:1-584.
Butt, Charles R. M., and Robert M. Hough. 2009. "Why Gold is Valuable."
Elements 5 (5):277.
Cabral, Alexandre Raphael, Bernd Lehmann, Rogerio Kwitko-Ribeiro, and Carlos
Henrique Cravo Costa. 2002. "Palladium and Platinum Minerals from the
Serra Pelada Au–Pd–Pt Deposit, Carajás Mineral Province, Northern
Brazil." The Canadian Mineralogist 40 (5):1451.
Canet, Carles, Pura Alfonso, Joan-Carles Melgarejo, and Susana Jorge. 2003. "Pge-
Bearing Minerals in Silurian Sedex Deposits in the Poblet Area,
Southwestern Catalonia, Spain." The Canadian Mineralogist 41 (3):581.
Chapman, RJ, RC Leake, and NR Moles. 2000. "The use of microchemical analysis
of alluvial gold grains in mineral exploration: experiences in Britain and
Ireland." Journal of Geochemical Exploration 71 (3):241-268.
Cobley, Claire M., and Younan Xia. 2009. "Gold and Nanotechnology." Elements
5 (5):309.
Donovan, John J, Jared W Singer, and John T Armstrong. 2016. "A new EPMA
method for fast trace element analysis in simple matrices." American
Mineralogist 101 (8):1839-1853.
Donovan, John J, Donald A Snyder, and Mark L Rivers. 1992. "An improved
interference correction for trace element analysis." Proceedings of the
Annual Meeting-Electron Microscopy Society of America.
Donovan, John J, and Tracy N Tingle. 1996. "An improved mean atomic number
background correction for quantitative microanalysis." Microscopy and
Microanalysis 2 (1):1-7.
Dowdell, Ralph Lewis, Henry Samuel Jerabek, Arthur C Forsyth, and Carrie H
Green. 1943. General metallography: J. Wiley & sons, inc.
Eby, G Nelson. 2016. Principles of environmental geochemistry: Waveland Press.
Eyles, N. 1990. "Post-depositional nugget accretion in Cenozoic placer gold
deposits, Cariboo mining district, British Columbia (93 A, B, G, H)." BC
Ministry of Energy, Mines and Petroleum Resources:147-169.
Eyles, Nicholas, and Stephen P Kocsis. 1988. "Sedimentological Controls on Gold
Distribution in Pleistocene Placer Deposits of the Cariboo Mining District,
British Columb: La."

REFERENCES
35 | P a g e
Fairbrother, L, J Brugger, J Shapter, JS Laird, G Southam, and F Reith. 2012.
"Supergene gold transformation: Biogenic secondary and nano-particulate
gold from arid Australia." Chemical Geology 320:17-31.
Goldfarb, Richard, D. Groves, and Stephen Gardoll. 2001. Orogenic gold and
geologic time: A global synthesis. Vol. 18.
Groen, John C, James R Craig, and J Donald Rimstidt. 1990. "Gold-rich rim
formation on electrum grains in placers." The Canadian Mineralogist 28
(2):207-228.
Guha, A. 1985. "Metals handbook, vol. 8." Ohio: ASM International, Materials
Park:133.
Hora, ZD, E Pivec, and A Langrova. 2011. "Irarsite (IrAsS), Osarsite (OsAsS) and
Gold from Placer Black Sands, Ruby Creek and Wright Creek, Atlin, British
Columbia." Geological Fieldwork:2012-1.
Hough, R. M., C. R. M. Butt, S. M. Reddy, and M. Verrall. 2007. "Gold nuggets:
supergene or hypogene?" Australian Journal of Earth Sciences 54 (7):959-
964. doi: 10.1080/08120090701488289.
Hough, Robert M., Charles R. M. Butt, and Jörg Fischer-Bühner. 2009. "The
Crystallography, Metallography and Composition of Gold." Elements 5
(5):297.
Knight, JB, SR Morison, and JK Mortensen. 1999. "The relationship between placer
gold particle shape, rimming, and distance of fluvial transport as
exemplified by gold from the Klondike District, Yukon Territory, Canada."
Economic Geology 94 (5):635-648.
Knight, John, and Craig H. B. Leitch. 2001. "Phase Relations in the System Au–
Cu–Ag at Low Temperatures, based on Natural Assemblages." The
Canadian Mineralogist 39 (3):889.
Levson, V, DE Kerr, C Lowe, and H Blyth. 2003. "Quaternary geology of the Atlin
area, British Columbia." Geological Survey of Canada, Open File 1562 (1).
Mihalynuk, Mitchell G, Alexandre Zagorevski, Fionnuala AM Devine, and Elaine
Humphrey. 2017. "A new lode gold discovery at Otter Creek: Another
source for the Atlin placers." Geological Survey Paper 1:179-193.
Murdoch, Joseph, and Robert Wallace Webb. 1966. Minerals of California:
Centennial Volume (1866-1966). Vol. 189: California Division of Mines
and Geology.
Murzin, Vv, Vi Kudryavtsev, Ro Berzon, Sg Sustavov, and Aa Malyugin. 1983.
"New data on the instability of natural solid solutions of the gold–silver–
copper system at temperatures below 350 C." Dokl. Acad. Sci. USSR, Earth
Sci. Sect.
Okamoto, H., and T. B. Massalski. 1984. "The Au-Os (Gold-Osmium) System."
Bulletin of Alloy Phase Diagrams 5 (4):382-382. doi: 10.1007/bf02872957.
Palacios, Carlos, Gérard Hérail, Brian Townley, Víctor Maksaev, Fabián
Sepúlveda, Philippe de Parseval, Pablo Rivas, Alfredo Lahsen, and Miguel
Angel Parada. 2001. "The Composition of Gold in the Cerro Casale Gold-

REFERENCES
36 | P a g e
Rich Porphyry Deposit, Maricunga Belt, Northern Chile." The Canadian
Mineralogist 39 (3):907.
Phillips, G. Neil, and Roger Powell. 2009. "Formation of gold deposits: Review and
evaluation of the continuum model." Earth-Science Reviews 94 (1):1-21.
doi: https://doi.org/10.1016/j.earscirev.2009.02.002.
Rauch, Sebastien, and Gregory M. Morrison. 2008. "Environmental Relevance of
the Platinum-Group Elements." Elements 4 (4):259.
Reith, Frank, Barbara Etschmann, Cornelia Grosse, Hugo Moors, Mohammed A.
Benotmane, Pieter Monsieurs, Gregor Grass, Christian Doonan, Stefan
Vogt, Barry Lai, Gema Martinez-Criado, Graham N. George, Dietrich H.
Nies, Max Mergeay, Allan Pring, Gordon Southam, and Joël Brugger. 2009.
"Mechanisms of gold biomineralization in the bacterium Cupriavidus
metallidurans." Proceedings of the National Academy of Sciences 106
(42):17757-17762.
Reith, Frank, Stephen L Rogers, DC McPhail, and Daryl Webb. 2006.
"Biomineralization of gold: biofilms on bacterioform gold." science 313
(5784):233-236.
Reith, Frank, Lachlan Stewart, and Steven A Wakelin. 2012. "Supergene gold
transformation: Secondary and nano-particulate gold from southern New
Zealand." Chemical Geology 320:32-45.
Shcheka, Galina G., Bernd Lehmann, Eike Gierth, Karsten Gömann, and Alex
Wallianos. 2004. "Macrocrystals of Pt–Fe Alloy from the Kondyor Pge
Placer Deposit, Khabarovskiy Kray, Russia: Trace-Element Content,
Mineral Inclusions and Reaction Assemblages." The Canadian
Mineralogist 42 (2):601.
Sillitoe, Richard H, and Jeffrey W Hedenquist. 2003. "Linkages between
volcanotectonic settings, ore-fluid compositions, and epithermal precious
metal deposits." Special Publication-Society of Economic Geologists
10:315-343.
Simmons, Stuart F, Noel C White, and David A John. 2005. "Geological
characteristics of epithermal precious and base metal deposits." Economic
Geology 100th anniversary volume 29:485-522.
Smith, Dorian GW, and Ernest H Nickel. 2007. "A system of codification for
unnamed minerals: Report of the Subcommittee for Unnamed Minerals of
the IMA Commission on New Minerals, Nomenclature and Classification."
The Canadian Mineralogist 45 (4):983-990.
Southam, Gordon, Maggy F. Lengke, Lintern Fairbrother, and Frank Reith. 2009.
"The Biogeochemistry of Gold." Elements 5 (5):303.
Sun, WeiDong, MingXing Ling, XiaoYong Yang, WeiMing Fan, Xing Ding, and
HuaYing Liang. 2010. "Ridge subduction and porphyry copper-gold
mineralization: An overview." Science China Earth Sciences 53 (4):475-
484. doi: 10.1007/s11430-010-0024-0.

REFERENCES
37 | P a g e
Tosdal, Richard M., John H. Dilles, and David R. Cooke. 2009. "From Source to
Sinks in Auriferous Magmatic-Hydrothermal Porphyry and Epithermal
Deposits." Elements 5 (5):289.
Townley, Brian K, Gerard Hérail, Victor Maksaev, Carlos Palacios, Philippe de
Parseval, Fabían Sepulveda, Rodrigo Orellana, Pablo Rivas, and Cesar
Ulloa. 2003. "Gold grain morphology and composition as an exploration
tool: application to gold exploration in covered areas." Geochemistry:
Exploration, Environment, Analysis 3 (1):29-38.
Vikentyev, Ilya V., Marina A. Yudovskaya, Andrey V. Mokhov, Alexey L. Kerzin,
and Anatoliy I. Tsepin. 2004. "Gold and Pge in Massive Sulfide Ore of the
Uzelginsk Deposit, Southern Urals, Russia." The Canadian Mineralogist
42 (2):651.
Walshe, John L., and James S. Cleverley. 2009. "Gold Deposits: Where, When and
Why." Elements 5 (5):288.
White, J. L., R. L. Orr, and R. Hultgren. 1957. "The thermodynamic properties of
silver-gold alloys." Acta Metallurgica 5 (12):747-760. doi:
http://dx.doi.org/10.1016/0001-6160(57)90078-0.
White, Noel C, and Jeffrey W Hedenquist. 1995. "Epithermal gold deposits: styles,
characteristics and exploration." SEG newsletter 23 (1):9-13.
Williams-Jones, Anthony E, and Christoph A Heinrich. 2005. "100th Anniversary
special paper: vapor transport of metals and the formation of magmatic-
hydrothermal ore deposits." Economic Geology 100 (7):1287-1312.
Williams-Jones, Anthony E., Robert J. Bowell, and Artashes A. Migdisov. 2009.
"Gold in Solution." Elements 5 (5):281.

APPENDIX
38 | P a g e
Appendix 1: Paragenisis and surrounding mineralogy graphs
Figure 12. a); Mineralogy Composition (At%) Spectrum 15, Orthoclase (KAlSi₃O₈); (b) Mineralogy Composition (At%) Spectrum 16, Plagioclase (Albite) (NaAlSi3O8); (c) Mineralogy Composition
(At%) Spectrum 17, Biotite (K(Mg,Fe)3(AlSi3O10)(F,OH)2); (d) Mineralogy Composition (At%)
Spectrum 18, Chlorite ((Mg,Fe)3(Si,Al)4O10(OH)2·(Mg,Fe)3(OH)6); (e) Mineralogy Composition
(At%) Spectrum 19 Possible Garnet (X3Y2(SiO4)3) or Chlorites; (f) Mineralogy Composition (At%)
Spectrum 20, Hornblende, ((Ca,Na)2-3(Mg,Fe,Al)5(Si,Al)8O22(OH,F)2); (g) Mineralogy Composition
(At%) Spectrum 21, Quartz, (SiO2); (h) Mineralogy Composition (At%) Spectrum 22, Hornblende.
(b)
(d)
(f)
(h) (g)
(e)
(c)
(a)

APPENDIX
39 | P a g e
Appendix 2: FIB Sample Preparation
The FIB cutting was done to have a sample thin enough for TEM. The selected area
was cut across where the Ag depleted rim had a clear boundary to the core. The area
was less porous and was ideal for the section cutting for a clear representation of
both areas.
Figure 13. (a) BSE Image, Au/Ag boundary; (b)BSE Image, Au/Ag Boundary Sample Zone; (c) SE
Image Carbon top, initial trenching, (d) SE Image Finished trenching (e) SE Image, U cut and
welded on needle; (f) SE Image, , Welded onto pin; (g) SE Image,, Prior to Thinning; (h) SE Image,
Final Thin Section for TEM.

APPENDIX
40 | P a g e
Appendix 3: EMPA Microprobe Analysis Table: The microprobe was completed at the CMCA facilities to establish the mineralogical content of the Au Sample.
Table 2: EMPA Microprobe Analysis Det
Limit
0.022
915
0 0.014
272
0.011
14
0 0.045
717
0.074
153
0.013
568
0.040
597
0.010
187
0.010
536
0.081
081
0 0.009
692
0.077
503
0.111
918
0.089
664
0.014
927
0.054
23
0.034
77
0.037
099
0.038
738
0.043
465
0.024
558
0.015
985
0.006
381
SAM
PLE
S
WT.
%
As
WT.
%
Sb
WT.
%
Fe
WT.
%
Se
WT.
%
Au
WT.
%
Te
WT.
%
Cu
WT.
%
Pb
WT.
%
Ni
WT.
%
Co
WT.
%
Ag
WT.
%
Bi
WT.
%
Si
WT.
%
Pd
WT.
%
Ru
WT.
%
Rh
WT.
%
Cr
WT.
%
Hg
WT.
%
Re
WT.
%
Os
WT.
%
Ir
WT.
%
Pt
WT.
%
V
WT.
%
Mn
WT.
%
Ti
WT.
%
correct
ed
totals
other
eleme
nts
PGEs S +
As +
Se T1 0.07 0.49 0.06
0.51 79.37
0.11
21.66 0.13 0.12
0.27
0.17
0.02 102.97 23.61 0.27 1.06
T1 0.02 0.08
0.09 80.53
0.06
21.11
0.04
0.12
102.05 21.52 0.00 0.19
T1 0.07 0.15
0.13 80.33
20.92
0.13
0.16
101.90 21.57 0.00 0.36
T1 0.03 0.10
0.12 80.07
0.05
21.02
0.04
0.06
101.49 21.43 0.00 0.25
T1
0.12 0.02
0.10 80.28
0.06
21.56
0.09
102.21 21.94 0.00 0.22
T1 0.05 0.26
0.29 79.87
0.04
22.08
0.08
0.13
0.01 102.81 22.93 0.13 0.60
T1
0.11 0.02
0.13 80.39
0.05 0.01
21.56
0.09
102.37 21.99 0.00 0.24
T1 0.03 0.14
0.15 80.96
0.06
20.70
0.03
102.05 21.10 0.00 0.31
T1 0.06 0.08
0.07 80.50
21.37
0.01
0.14
102.22 21.72 0.00 0.21
T1 0.02 0.10
0.08 80.55
20.98
0.04
0.04
101.83 21.27 0.00 0.21
T1
0.02
80.30
21.24
0.05
0.19
101.80 21.51 0.00 0.02
T1 0.02 0.12
0.09 80.11
0.05
21.55
0.02
0.08
102.05 21.94 0.00 0.23
T1 0.04 0.10
0.10 80.04
22.12
0.03
0.15 0.14
0.11
102.83 22.79 0.29 0.25
T1
0.00
79.92
21.44
0.08
101.45 21.53 0.00 0.00
T1
0.08
0.08 80.14
0.07
21.32
0.07
101.75 21.61 0.00 0.16
T1 0.04 0.12 0.02
0.11 79.99
0.06
21.64
0.07
0.26 0.12
102.42 22.43 0.37 0.26
T1
0.23 0.04
0.19 79.91
0.13
21.45 0.10 0.05
0.02 0.11
0.01 102.24 22.33 0.00 0.41
T1 0.04 0.14
0.11 79.43
0.06
21.13
0.03
0.03
100.96 21.53 0.00 0.29
T1 0.05 0.11
0.06 79.83
21.21
0.14
101.40 21.57 0.00 0.22
T1 0.12 0.23
0.25 79.98
21.77
0.05 0.09 0.23 0.11
0.17
103.00 23.02 0.44 0.60
T1 0.03 0.21 0.03
0.23 80.06
0.09
0.01 21.81
0.05 0.11 0.13
0.12
0.01 102.87 22.82 0.24 0.46
T1 0.03 0.12
0.13 80.38
21.90
0.01
0.09
102.66 22.28 0.00 0.28
T1 0.11 0.05
0.12 80.09
21.49
0.04
0.22
102.13 22.04 0.00 0.28
T1
0.13
0.07 80.72
20.39
0.01
0.09
101.41 20.69 0.00 0.20
T1
0.00
80.17
20.79
0.07
101.03 20.86 0.00 0.00
T1
0.00 0.02
80.75
21.44
0.11
102.32 21.57 0.00 0.00
T1 0.08 0.15
0.17 80.27
22.16
0.04
0.12
102.99 22.72 0.00 0.40
T1 0.05 0.25 0.04
0.24 79.98
0.05
22.21
0.04
0.19
0.15
0.01 103.20 23.22 0.19 0.53
T1
0.15 0.02
0.14 81.08
0.06
20.76
0.02
0.11
102.33 21.25 0.00 0.29
T1 0.03 0.39 0.08 0.04 0.38 97.79
0.10
0.01 2.62 0.20 0.20
0.11
0.07
0.02 102.04 4.25 0.11 0.80
T1 0.13 0.00
0.01
96.86
3.11
0.08
0.35
100.53 3.67 0.00 0.13
T1 0.08 0.04
97.83
2.31
0.04 0.13 0.31 0.28
0.06
101.07 3.24 0.72 0.12
T1 0.05 0.09 0.02
0.12 95.95
0.04
4.16 0.08 0.08
100.59 4.64 0.00 0.26
T1 0.09 0.17 0.03 0.03 0.16 97.73
1.10 0.03 0.11 0.34 0.61 0.49
100.88 3.15 1.44 0.42
T1 0.05 0.17 0.03
0.16 98.08
0.04 0.01
3.05 0.12 0.15
0.02 0.14
0.01 102.03 3.95 0.00 0.39
T1 0.11 0.20 0.02
0.23 98.61
2.05 0.06 0.09 0.25 0.31 0.24
0.13
0.01 102.30 3.70 0.80 0.54
T1
0.04
97.47
0.13
0.90 0.18
0.02 0.06
0.01 98.82 1.35 0.00 0.00
T1 0.14 0.31
0.02 0.35 98.81
2.08
0.17 0.47 0.78 0.56
0.07
0.01 103.75 4.94 1.81 0.79
T1 0.06 0.23 0.01
0.21 98.91
2.17 0.03 0.15 0.13 0.42 0.18
0.08
0.04
0.01 102.64 3.73 0.78 0.50
T1 0.11 0.45 0.06 0.20 0.50 92.24
0.18
2.74 0.21 0.79
0.11
0.06 97.64 5.41 0.00 1.05
T1 0.12 0.28
0.58 0.28 85.05
0.05
5.48
0.82 0.25 0.74 0.46
94.11 9.06 1.45 0.68
T1 0.14
0.74 0.07 80.40
0.09
9.84 0.14 1.24
0.25
92.92 12.51 0.00 0.21
T1 0.18 0.17 0.03
0.13 92.92
0.05
10.09 0.07 0.14 0.08 0.30 0.21
0.29
104.64 11.73 0.59 0.47
T1 0.35 0.33 0.05 0.04 0.30 93.10
0.11
8.49 0.07 0.28 0.11 0.14
0.63
0.02 104.02 10.92 0.24 0.99
T1 0.30 0.30 0.03 0.06 0.35 93.62
0.05
7.88 0.06 0.41 0.30 0.46 0.38
0.35
0.01 104.54 10.92 1.13 0.95
T1 0.13 0.73 0.08 0.01 0.74 97.09
0.19
1.81 0.26 0.17 0.62 1.13 0.73
0.03 103.73 6.63 2.47 1.60
T1 0.24 0.41 0.04
0.44 97.19
0.02
2.58 0.04 0.16 0.60 1.06 0.68
0.11
0.01 103.60 6.41 2.35 1.10

APPENDIX
41 | P a g e
T1 0.18 0.12 0.02 0.24 0.13 96.01 0.09
0.04
1.89 0.09 0.19 0.21 0.22 0.34
99.77 3.75 0.77 0.42
T1 0.23 0.38
0.76 0.45 93.25
2.00
0.42 0.45 0.81 0.56
0.14
0.05
99.50 6.25 1.82 1.06
T1 0.24 0.02
0.20 0.01 87.03
4.11
0.22 0.19
0.27
92.29 5.26 0.45 0.27
T2
0.09
0.07 79.93
0.05
21.14
101.27 21.34 0.00 0.15
T2 0.10 0.19 0.03
0.27 79.85
0.04
21.92
0.04 0.10 0.32 0.11
0.09
0.01 103.06 23.21 0.52 0.56
T2 0.17 0.00
80.01
20.73
0.13
0.34
101.37 21.36 0.00 0.17
T2
0.02
80.12
19.98
0.02
100.14 20.02 0.00 0.02
T2 0.04 0.09 0.02
0.12 80.02
0.05
21.59
0.01 101.95 21.93 0.00 0.26
T2 0.12 0.22
0.18 80.09
20.39
0.12
0.12
0.13
101.35 21.26 0.12 0.51
T2 0.02 0.04
0.04 80.93
20.56
0.10
0.14
101.83 20.90 0.00 0.11
T2
0.12
0.12 79.96
21.71
0.03
0.01 101.95 21.99 0.00 0.24
T2 0.06
80.06
22.05
0.23 0.13
0.07
102.62 22.56 0.37 0.06
T2
0.01 81.01
20.45
0.13
0.08
101.70 20.68 0.00 0.01
T2 0.11 0.11 0.02
0.19 80.12
0.01 21.47
0.06 0.13 0.25 0.11
0.14
102.71 22.59 0.49 0.41
T2 0.06 0.10
0.11 80.28
0.01 20.90
0.10
0.15
101.71 21.43 0.00 0.27
T2 0.05
0.01 82.60
17.63
0.08
0.02
100.38 17.79 0.00 0.06
T2
93.79
5.49
0.03
99.30 5.51 0.00 0.00
T2 0.03
0.03
98.12
0.05
2.75 0.06 0.10
0.15
0.03
0.01 101.33 3.22 0.00 0.03
T2 0.03 0.19 0.05
0.17 98.71
0.08 0.01 0.01 1.27 0.18 0.06
0.19
0.08
0.03
0.01 101.07 2.36 0.19 0.40
T2 0.10
101.4
0
2.09
0.05
0.56 0.08
0.13 0.15
0.02
104.57 3.18 0.35 0.10
T2
0.05 0.02
97.31
4.55
0.10
0.16
0.01 102.21 4.89 0.00 0.05
T2
93.71
2.87
0.08
96.66 2.95 0.00 0.00
T2 0.17
93.87
6.14
0.05
0.30
100.53 6.65 0.00 0.17
T2 0.18 0.29 0.01
0.40 96.33
5.62
0.16 0.45 0.44 0.23
0.17
0.05
0.01 104.33 8.00 1.16 0.87
T2 0.08 0.06
0.13 97.69
2.05
0.12 0.14 0.20
100.48 2.78 0.34 0.28
T2 0.17 0.29
0.49 0.22 92.93
4.44
0.28 0.29 0.60 0.23
0.09
100.04 7.11 1.12 0.69
T2 0.17 0.29 0.05 0.26 0.36 92.74
0.09
8.06 0.14 0.46 0.15 0.42 0.23
0.20
0.02 103.64 10.89 0.80 0.83
T2 0.14 0.07
0.02 98.37
1.33
0.04 0.56 0.99 0.69
102.21 3.84 2.24 0.22
T2 0.10 0.21
0.33 98.62
1.28 0.08 0.10 0.35 0.51 0.45
0.06
102.08 3.46 1.31 0.64
T2 0.39 0.59 0.25 0.31 0.64 126.8
7
0.23 0.01 0.30 0.12 0.10 3.44 0.59 0.46 0.72 1.33 1.08 0.08 1.32 0.55 0.56 0.67 0.83 0.09 0.10 0.15 141.78 14.91 5.74 1.62
T2 0.17 0.31
0.32 97.42
2.18
0.13 0.67 1.24 0.87
103.31 5.90 2.78 0.81
T2 0.07
0.81
89.45
1.39
0.98
92.70 3.25 0.00 0.07
T2 0.21 0.04
0.24 0.05 91.15
3.29
0.24 0.23
0.24
95.69 4.53 0.47 0.30
T3
0.14
95.05
0.56
0.10
0.02
95.87 0.83 0.00 0.00
T3
80.09
20.70
0.06
100.85 20.76 0.00 0.00
T3 0.08
80.41
21.18
0.17
101.84 21.43 0.00 0.08
T3 0.05 0.21
0.01 0.22 80.41 0.08
0.01 21.29
0.03
0.15
0.01 102.47 22.06 0.00 0.49
T3 0.02
80.47
20.77
0.07
0.06
101.40 20.93 0.00 0.02
T3 0.07 0.03
0.04 80.34
21.75
0.13
0.14
102.50 22.15 0.13 0.14
T3 0.03 0.03
0.02 80.45
0.04
21.46
0.11
102.15 21.70 0.00 0.09
T3 0.14 0.04
0.07 80.37
21.81
0.12
0.14
102.69 22.31 0.12 0.24
T3
80.60
19.60
0.11
100.31 19.71 0.00 0.00
T3 0.05 0.08
0.11 80.86
0.07
21.09
0.02
0.12
102.39 21.53 0.00 0.24
T3
0.02
0.02 80.81
21.05
0.10
102.00 21.19 0.00 0.04
T3 0.07 0.04
79.68
21.16
0.01
0.06
101.01 21.34 0.00 0.11
T3
79.86
0.01 21.62
101.49 21.63 0.00 0.00
T3 0.04 0.35 0.07
0.37 80.07 0.13
0.16
0.01 21.56 0.16 0.06
0.14
0.03 103.15 23.07 0.00 0.75
T3 0.09 0.11 0.01
0.12 79.62
0.05
22.21
0.05
0.17
0.11
102.57 22.94 0.17 0.33
T3 0.05 0.11 0.02
0.10 80.64
0.06
21.52
0.01
0.07
102.58 21.94 0.00 0.26
T3 0.13 1.33 0.20
1.44 77.25
0.38
21.70 0.54 0.30 0.22 0.52 0.17
0.10
0.07 104.35 27.10 0.91 2.90
T3 0.04 0.11
0.06 80.60
0.06
21.37
0.02
0.08
102.34 21.74 0.00 0.21
T3 0.02 0.05
0.06 80.68
0.04
21.08
0.07
0.01 102.01 21.33 0.00 0.13
T3
80.74
19.48
0.04
0.11
100.37 19.63 0.00 0.00
T3 0.08
0.02 79.77
21.34
0.01 0.21 0.63 0.50
102.57 22.80 1.34 0.11
T3 0.04 0.25 0.02
0.28 79.92
0.08
21.47 0.06 0.09 0.08 0.15
0.01
0.02 102.47 22.55 0.23 0.57

APPENDIX
42 | P a g e
T3 0.04 0.14
0.17 80.49
0.06
21.38
0.02
0.07
0.01 102.38 21.89 0.00 0.35
T3 0.07
0.05 80.46
21.34
0.10
102.02 21.56 0.00 0.12
T3 0.05 0.07
0.04 80.61
20.08
100.86 20.24 0.00 0.16
T3 0.08 0.03
0.05 80.44
20.72
0.10
101.41 20.97 0.00 0.16
T3 0.03 0.10
0.05 80.30
22.12
0.04
102.65 22.35 0.04 0.19
T3 0.02 0.17 0.02
0.14 80.23
21.33
0.01
0.18
0.09
102.18 21.95 0.18 0.33
T3
0.05
0.03 80.45
20.94
0.08
101.55 21.10 0.00 0.08
T3 0.06 0.09
0.10 80.80
21.22
0.04
0.09
102.40 21.60 0.00 0.25
T3 0.04 0.06 0.02
0.08 80.80
20.98
0.03
0.09
0.03
0.01 102.13 21.33 0.00 0.17
T3 0.08 0.22 0.01
0.24 80.14
0.02 22.00
0.03 0.11 0.29 0.10
0.08
0.01 103.32 23.18 0.49 0.54
T3 0.09 0.04
0.02 79.87
20.10
0.03
0.20
100.37 20.49 0.00 0.16
T3
0.01
81.25
0.08
20.32
0.02
0.10
101.78 20.53 0.00 0.00
T3
0.03
79.99
0.09
20.10 0.02
0.13
100.36 20.37 0.00 0.00
T3 0.15 0.13
0.16 79.92
21.41
0.05
0.21
102.03 22.11 0.00 0.44
T3
0.02
79.72
0.07 0.01
20.26
0.08
100.16 20.44 0.00 0.00
T3 0.10
79.75
20.31
0.04
0.15
100.36 20.61 0.00 0.10
T3 0.05 0.02
0.03 80.81
0.01 21.16
0.03
0.10
102.21 21.40 0.00 0.10
T3 0.10 0.27 0.02
0.31 80.09
0.07
22.04
0.04 0.18 0.26
0.10
103.48 23.39 0.44 0.68
T3 0.10 0.11 0.02
0.14 79.76
0.06
21.47
0.09
0.13
101.88 22.12 0.00 0.35
T3 0.09
79.89
20.56
0.14
100.69 20.79 0.00 0.09
T3 0.07
80.39
20.94
0.06
101.46 21.07 0.00 0.07
T3
0.06
0.07 80.55
0.07
21.33
0.01
0.06
0.01 102.15 21.60 0.00 0.13
T3
80.19
0.06
20.75
0.07
101.07 20.88 0.00 0.00
T3
0.19 0.04
0.18 80.24
0.07
21.87 0.05 0.03
0.11
0.01 102.78 22.53 0.00 0.36
T3 0.06 0.22 0.02
0.24 80.58
0.06
21.66
0.10
0.27
0.07
0.01 103.27 22.69 0.27 0.51
T3 0.06 0.07
0.03 80.76
0.01 21.26
0.05
0.07
102.30 21.55 0.00 0.16
T3 0.09 0.16
0.15 80.60
0.04
21.77
0.02 0.08 0.21
0.07
103.19 22.59 0.29 0.39
T3
0.12
0.07 80.76
21.88
0.13
102.96 22.20 0.00 0.19
T3 0.17 0.10
0.08 80.90
22.17
0.02 0.09 0.31
0.16
0.04
104.04 23.14 0.45 0.35
T3 0.03 0.06
0.12 80.84
21.48
0.01
0.09
0.01 102.64 21.80 0.00 0.22
T3 0.08 0.26 0.03
0.27 80.60
0.11
22.19
0.07
0.13
0.01 103.76 23.17 0.00 0.62
T3 0.06 0.57 0.10
0.57 78.85
0.18
21.67 0.20 0.12
0.20
0.11
0.04 102.65 23.81 0.20 1.19
T3 0.12 0.18
0.13 80.52
0.04
21.29
0.06
0.13
102.48 21.95 0.00 0.43
T3 0.06 0.09
0.01 80.58
21.29
0.07
0.02
102.12 21.54 0.00 0.16
T3
0.16 0.02
0.20 80.82
0.07
20.61 0.04 0.05
0.10
0.01 102.09 21.26 0.00 0.36
T3 0.26
82.29
19.04
0.35 0.05
0.05 0.06
102.10 19.81 0.16 0.26
T3 0.11
80.97
21.46
0.02
0.20
102.76 21.79 0.00 0.11
T3 0.03 0.09 0.02
0.04 80.75
21.67
0.08
102.69 21.94 0.00 0.17
T3 0.09 0.10
0.08 80.52
0.01 21.74
0.04
0.09
102.68 22.16 0.00 0.27
T3
0.08
0.06 80.41
21.18
0.02
0.06
101.79 21.39 0.00 0.13
T3 0.08 0.24 0.04
0.26 79.97
0.05
21.67 0.05 0.07
0.18
0.10
0.01 102.71 22.75 0.18 0.58
T3 0.09 0.25 0.01
0.25 79.89
0.04
21.27
0.10
0.17
0.09
102.17 22.28 0.17 0.59
T3 0.04 0.05
0.09 80.48
0.07
21.68
0.09
102.49 22.01 0.00 0.18
T3
0.08
0.03 79.21 0.16
0.17
19.14 0.14
0.04
0.02 99.00 19.78 0.00 0.03
T3 0.06 0.03 0.02
0.01 80.78
0.05
20.57
0.02
0.07
101.62 20.84 0.00 0.11
T3 0.03 0.15 0.02
0.18 80.83
0.06
21.64
0.02
0.08
103.02 22.18 0.00 0.36
T3 0.03 0.11
0.08 80.66
0.06
21.10
0.00
102.05 21.39 0.00 0.22
T3 0.04 0.15
0.22 80.84
0.04
21.66
0.03
0.14
103.12 22.27 0.14 0.41
T3 0.10 0.24 0.03
0.27 79.47
0.04
22.09 0.03 0.08
0.08
0.01 102.43 22.97 0.00 0.61
T3 0.03
76.75
21.26
98.03 21.28 0.00 0.03
T3 0.06 0.03 0.02
0.08 85.08
0.07
17.00 0.03 0.01
0.09
0.02 0.01 102.50 17.42 0.00 0.17
T3
0.16
0.10 80.56
0.05
21.07
0.01
0.07
102.02 21.46 0.00 0.26
T3 0.30
80.47
19.96
0.24
0.02 0.02
101.02 20.54 0.00 0.30
T3 0.07 0.02 0.01
0.04 79.39
0.05
21.04
0.05
0.08
100.76 21.37 0.00 0.13
T3 0.05 0.13 0.01
0.16 81.01
0.04
21.94
0.02
0.19
0.07
0.01 103.63 22.62 0.19 0.33
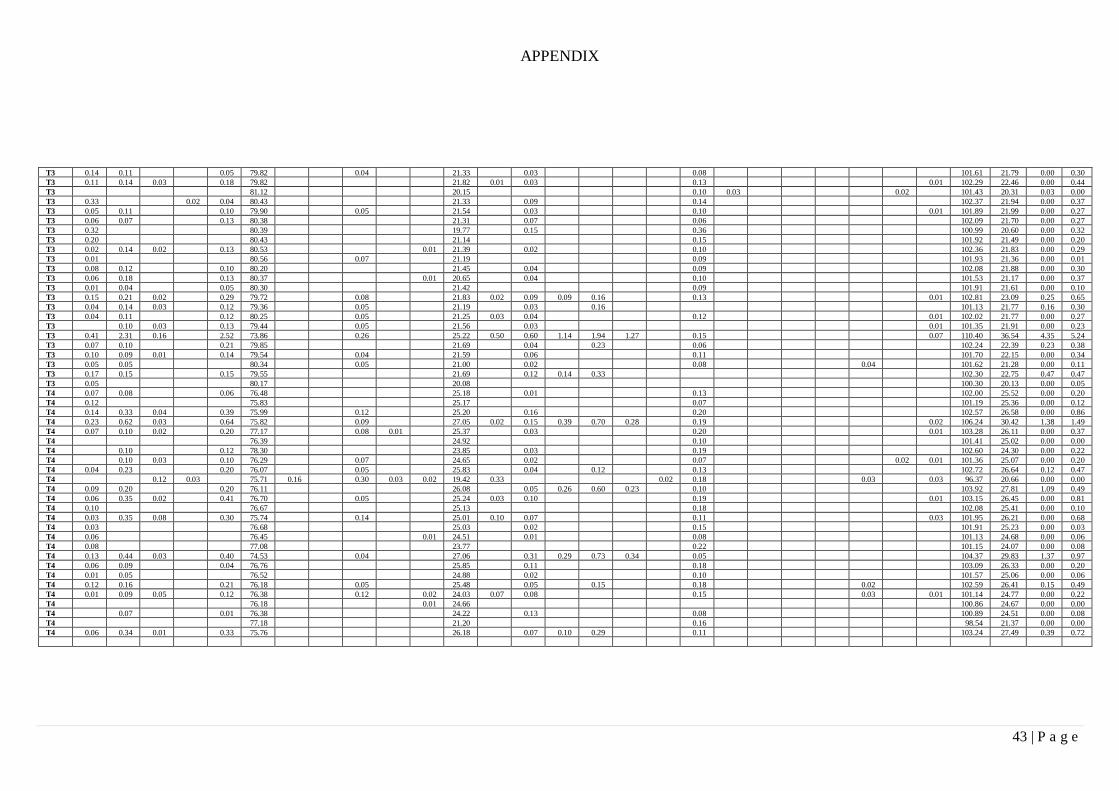
APPENDIX
43 | P a g e
T3 0.14 0.11
0.05 79.82
0.04
21.33
0.03
0.08
101.61 21.79 0.00 0.30
T3 0.11 0.14 0.03
0.18 79.82
21.82 0.01 0.03
0.13
0.01 102.29 22.46 0.00 0.44
T3
81.12
20.15
0.10 0.03
0.02
101.43 20.31 0.03 0.00
T3 0.33
0.02 0.04 80.43
21.33
0.09
0.14
102.37 21.94 0.00 0.37
T3 0.05 0.11
0.10 79.90
0.05
21.54
0.03
0.10
0.01 101.89 21.99 0.00 0.27
T3 0.06 0.07
0.13 80.38
21.31
0.07
0.06
102.09 21.70 0.00 0.27
T3 0.32
80.39
19.77
0.15
0.36
100.99 20.60 0.00 0.32
T3 0.20
80.43
21.14
0.15
101.92 21.49 0.00 0.20
T3 0.02 0.14 0.02
0.13 80.53
0.01 21.39
0.02
0.10
102.36 21.83 0.00 0.29
T3 0.01
80.56
0.07
21.19
0.09
101.93 21.36 0.00 0.01
T3 0.08 0.12
0.10 80.20
21.45
0.04
0.09
102.08 21.88 0.00 0.30
T3 0.06 0.18
0.13 80.37
0.01 20.65
0.04
0.10
101.53 21.17 0.00 0.37
T3 0.01 0.04
0.05 80.30
21.42
0.09
101.91 21.61 0.00 0.10
T3 0.15 0.21 0.02
0.29 79.72
0.08
21.83 0.02 0.09 0.09 0.16
0.13
0.01 102.81 23.09 0.25 0.65
T3 0.04 0.14 0.03
0.12 79.36
0.05
21.19
0.03
0.16
101.13 21.77 0.16 0.30
T3 0.04 0.11
0.12 80.25
0.05
21.25 0.03 0.04
0.12
0.01 102.02 21.77 0.00 0.27
T3
0.10 0.03
0.13 79.44
0.05
21.56
0.03
0.01 101.35 21.91 0.00 0.23
T3 0.41 2.31 0.16
2.52 73.86
0.26
25.22 0.50 0.60 1.14 1.94 1.27
0.15
0.07 110.40 36.54 4.35 5.24
T3 0.07 0.10
0.21 79.85
21.69
0.04
0.23
0.06
102.24 22.39 0.23 0.38
T3 0.10 0.09 0.01
0.14 79.54
0.04
21.59
0.06
0.11
101.70 22.15 0.00 0.34
T3 0.05 0.05
80.34
0.05
21.00
0.02
0.08
0.04
101.62 21.28 0.00 0.11
T3 0.17 0.15
0.15 79.55
21.69
0.12 0.14 0.33
102.30 22.75 0.47 0.47
T3 0.05
80.17
20.08
100.30 20.13 0.00 0.05
T4 0.07 0.08
0.06 76.48
25.18
0.01
0.13
102.00 25.52 0.00 0.20
T4 0.12
75.83
25.17
0.07
101.19 25.36 0.00 0.12
T4 0.14 0.33 0.04
0.39 75.99
0.12
25.20
0.16
0.20
102.57 26.58 0.00 0.86
T4 0.23 0.62 0.03
0.64 75.82
0.09
27.05 0.02 0.15 0.39 0.70 0.28
0.19
0.02 106.24 30.42 1.38 1.49
T4 0.07 0.10 0.02
0.20 77.17
0.08 0.01
25.37
0.03
0.20
0.01 103.28 26.11 0.00 0.37
T4
76.39
24.92
0.10
101.41 25.02 0.00 0.00
T4
0.10
0.12 78.30
23.85
0.03
0.19
102.60 24.30 0.00 0.22
T4
0.10 0.03
0.10 76.29
0.07
24.65
0.02
0.07
0.02 0.01 101.36 25.07 0.00 0.20
T4 0.04 0.23
0.20 76.07
0.05
25.83
0.04
0.12
0.13
102.72 26.64 0.12 0.47
T4
0.12 0.03
75.71 0.16
0.30 0.03 0.02 19.42 0.33
0.02 0.18
0.03
0.03 96.37 20.66 0.00 0.00
T4 0.09 0.20
0.20 76.11
26.08
0.05 0.26 0.60 0.23
0.10
103.92 27.81 1.09 0.49
T4 0.06 0.35 0.02
0.41 76.70
0.05
25.24 0.03 0.10
0.19
0.01 103.15 26.45 0.00 0.81
T4 0.10
76.67
25.13
0.18
102.08 25.41 0.00 0.10
T4 0.03 0.35 0.08
0.30 75.74
0.14
25.01 0.10 0.07
0.11
0.03 101.95 26.21 0.00 0.68
T4 0.03
76.68
25.03
0.02
0.15
101.91 25.23 0.00 0.03
T4 0.06
76.45
0.01 24.51
0.01
0.08
101.13 24.68 0.00 0.06
T4 0.08
77.08
23.77
0.22
101.15 24.07 0.00 0.08
T4 0.13 0.44 0.03
0.40 74.53
0.04
27.06
0.31 0.29 0.73 0.34
0.05
104.37 29.83 1.37 0.97
T4 0.06 0.09
0.04 76.76
25.85
0.11
0.18
103.09 26.33 0.00 0.20
T4 0.01 0.05
76.52
24.88
0.02
0.10
101.57 25.06 0.00 0.06
T4 0.12 0.16
0.21 76.18
0.05
25.48
0.05
0.15
0.18
0.02
102.59 26.41 0.15 0.49
T4 0.01 0.09 0.05
0.12 76.38
0.12
0.02 24.03 0.07 0.08
0.15
0.03
0.01 101.14 24.77 0.00 0.22
T4
76.18
0.01 24.66
100.86 24.67 0.00 0.00
T4
0.07
0.01 76.38
24.22
0.13
0.08
100.89 24.51 0.00 0.08
T4
77.18
21.20
0.16
98.54 21.37 0.00 0.00
T4 0.06 0.34 0.01
0.33 75.76
26.18
0.07 0.10 0.29
0.11
103.24 27.49 0.39 0.72

APPENDIX
44 | P a g e
Appendix 4: Glossary of Terms (Geological) (Murdoch and Webb
1966)
Acicular: A mineral consisting of fine needle-like crystals.
Adamantine: A brilliant luster like that of a diamond.
Aggregate: A mass of rock particles, grains of minerals, or both. B. Irregular mass
of crystals. C. Sand, gravel, crushed stone or rock that forms the major part of
concrete.
Alkaline: Containing sodium and/or potassium in excess of the amount needed to
form feldspar with the available silica. An alkaline rock, for example, contains more
than average amounts of potassium- and sodium-bearing minerals.
Amorphous: Without form; applied to rocks and minerals which have no definite
external crystalline structure.
Amphibole: A mineral group that consists of common, dark-colored, rock-forming
silicate minerals. The most common minerals are hornblende, tremolite, and
actinolite.
Andesite: A volcanic rock composed essentially of the mineral andesine and one or
more of the mafic minerals.
Anhedral: Refers to a crystal with no well-formed external faces.
Arborescent: Minerals having a treelike form, with branches similar to the way a
tree forms.
Asbestos: A group of naturally fibrous silicate minerals. The most common
asbestos type is chrysotile.
Bed: A rock mass of large horizontal extent bounded by physically different
material.
Bituminous: a. Containing much organic, or at least carbonaceous matter, mostly
in the form of the tarry hydrocarbons which are usually described as bitumen. B.
Pertaining to bituminous coal.
Bladed: Elongated and flattened; descriptive of some minerals.
Borates: Compounds are formed when metallic elements combine with the borate
radical. Minerals include ulexite, colemanite, and howlite.
Boron mineral: Many known minerals contain boron, but only a few are
commercially valuable as a source of boron. The principal boron minerals are borax,
kernite, colemanite, and ulexite.
Botryoidal: A mineral surface that resembles a cluster of grapes: describes certain
minerals such as hematite and malachite.
Brittle: Breaks or powders easily. A type of tenacity.

APPENDIX
45 | P a g e
Cabochan: A style of cutting in which the top of the gemstone forms a curved
convex surface. The base may be convex, concave, or flat.
Carbonaceous: a. Referring to a rock or sediment that is rich in carbon. B.
Referring to a sediment containing organic matter.
Carbonates: Compounds in which one or more metallic or semimetallic elements
combine with the carbonate radical. Calcite is the most common carbonate.
Chalky: Having the color, luster, or general appearance of chalk.
Chemical formula: The standard way of stating the chemical composition of a
mineral in terms of the number of atoms of each element contained in that mineral.
Clastic: Consisting of fragments of minerals, rocks, or organic structures that have
been moved individually from their places of origin. Synonym detrital.
Cleavable: Easily split into smaller fragments. See cleavage.
Cleavage: The property of a mineral breaking along its crystallographic planes.
Color: One of the most important properties used in determining minerals. Some
minerals always show the same color, while others come in many different ones.
The color of metallic (or metal-bearing) minerals is fairly constant; whereas that of
non-metallic minerals is generally less so owing to the pigmentation effect of
impurities. The color of a massive mineral is sometimes different from the color of
its powder or streak.
Columnar: A mineral with a structure obscurely resembling prisms, for example,
hornblende.
Compact: Dense crystalline texture requiring magnification to distinguish
individual crystals or particles.
Conchoidal: Shell-shaped; the more compact rocks, such as flint, which break with
concave and convex surfaces, are said to have a conchoidal fracture.
Concretion: A hard, compact mineral-mass of mineral matter that forms usually in
sedimentary rock around a center such as bone, shell, leaf, or fossil.
Conglomerate: Refers to a cemented clastic rock containing rounded fragments of
pebble size gravel; the consolidated equivalent of gravel. The composition of rock
or mineral fragments may vary widely in size, but are usually rounded and
smoothed from transportation by water or wave action.
Coralloidal: Having the form or appearance of coral.
Cryptocrystalline: Crystalline, but so fine-grained that the individual components
cannot be seen under an ordinary microscope.

APPENDIX
46 | P a g e
Crystal: The geometrical, faceted shape assumed naturally by minerals as they
solidify, provided that nothing impedes their growth. A crystal is characterized first
by its definite internal, molecular structure and second by its external form.
Crystal class: One of the 32 possible crystallographic combinations or groups of
symmetry operations that leave one point, or origin, fixed. Crystal classes are
divided among the six crystal systems and deal with outward symmetry.
Crystal face: The flat exterior surface of a crystal.
Crystal form: The form or shape in which crystals occur, such as the cube, the
octahedron, and others.
Crystal habit: Crystal habit is a typical crystal form or a combination of forms or
other shapes. It is the general shape of crystals that play an important role in
identifying minerals.
Crystal system: Minerals are classified in one or more of the six designated crystal
systems, according to the geometrical shapes in which minerals crystallize. These
are isometric, tetragonal, hexagonal, orthorhombic, monoclinic and triclinic.
Crystalline: Made of crystal or resembling crystal. Crystalline rock is composed of
crystals or fragments of crystals. Opposite ofamorphous.
Crystallography: The study of crystals, including their growth, structure, physical
properties, and classification by form.
Cube: A crystal form of six equivalent and mutually perpendicular faces.
Cubic: Having the form of a cube, as a cubic crystal.
Cubo-octahedron: A crystal form which has faces of both the cube and the
dodecahedron.
Dendrite: A branching figure resembling a tree produced on or in a mineral or stone
by an oxide of manganese or other foreign mineral (as in the moss agate); the
mineral or stone so marked.
Dendritic: Branch- and moss-like shapes or markings. For example, some
crystallized native gold.
Dense: a. Compact, fine-grained, lacking pore space. B. Rock or mineral with a
high specific gravity.
Deposition: Earth material of any type that has accumulated by some natural
process and is large enough to invite exploration, such as a mineral or ore.
Detrital: See clastic.
Dike: A tabular body of igneous rock injected into a fissure when molten and cuts
across the structure of the adjacent rocks.
Dipyramidal: A crystal form where two identical pyramids are joined base to base.

APPENDIX
47 | P a g e
Disseminated: Fragments of minerals dispersed in a rock.
Distorted crystal: A crystal whose faces have developed unequally, some being
larger than others. Some distorted crystal forms are drawn out or shortened, but the
angle between the faces remains the same.
Dodecahedral: A crystal form with 12 faces. Each face (either pentagonal or
rhombic) is parallel to one crystallographic axis and intersects the other two at equal
distances.
Dodecahedron: An isometric form composed of 12 equal faces that are either
pentagonal or rhombic.
Druse: A cavity in a rock or vein with walls encrusted with small projecting
crystals.
Ductile: a. The capacity of a metal to elongate without cracking or breaking, when
pulled from the ends. B. Capable of being permanently drawn out without breaking.
Dull: Those minerals in which there is a total absence of luster, as chalk or kaolin.
Earthy: Rough to the touch; dull and lusterless.
Effervesce: To bubble or hiss, as in carbonated water.
Elastic: Able to return to original shape after bending.
Element: A substance composed of atoms bearing an identical number of protons
in each nucleus. An element cannot be decomposed into other substances (except
by radioactive decay or bombardment with high-speed particles).
Equant: Applied to crystals having the same, or nearly the same, diameter or the
same dimensions in all directions.
Evaporation: The change by which a substance is converted from a solid or liquid
state into a vapor state.
Evaporites: a. One of the salts that results from the evaporation of ocean water or
of saline lakes. B. Rocks such as rock salt and potash salts formed by evaporation
of lakes or seas.
Face: See crystal face.
Feldspar: A mineral group that consists of abundant, light-colored, rock-forming
silicate minerals. The most common minerals are microcline, orthoclase, and
plagioclase.
Ferromagnesian: Containing iron and magnesium. Applied to certain dark silicate
minerals, especially amphibole, pyroxene, biotite, and olivine.
Fiber: The smallest single strands of asbestos or other fibrous materials.
APPENDIX
48 | P a g e
Fibrous: a. Applied to minerals that occur in fibers, such as asbestos. B. Consisting
of fine threadlike strands; for example, satin spar.
Filiform: A mineral occurring as thin threads, often twisted like the strands of a
rope; for example, native copper.
Fine: Very small in size, weight, or bulk
Flexible: Bends without breaking and will not return to its original shape.
Fluorescence: The emission of visible light by a substance exposed to ultraviolet
(UV) light. Some materials, when exposed to invisible UV radiation, emit visible
light and seem to "glow-in-the-dark."
Foliated: Thin, leaf-like layers of intergrowth, such as micaceous or schistose
rocks.
Fracture: a. The way in which a mineral breaks, other than its cleavage. B. A crack,
joint, or break in rocks.
Geode A hollow nodule or concretion, the cavity of which is commonly lined with
crystals.
Glassy: Applied to igneous rocks that have no crystals, only supercooled magma.
For example obsidian.
Globular: Smooth rounded surface of crystalline intergrowth.
Gossan: An iron-bearing weathered product overlying a sulfide deposit. It is formed
by the oxidation of sulfides and the leaching-out of the sulfur and most metals,
leaving hydrated iron oxides and rarely sulfates.
Grain: A mineral or rock particle, less than a few millimeters in diameter, and
generally lacking well-developed crystal faces, for example a sand grain. Used to
describe sedimentary particles of all sizes from clay to boulders, for example fine-
grained and coarse-grained.
Granular: Consisting of grains of approximately equal size and ranging from two
to ten millimeters.
Greasy: Applied to the luster of minerals; minerals that are oily to the touch or
sight. For example talc.
Habit: The characteristic or typical crystal form, combination of forms, or other
shape of a mineral, including irregularities.
Halides: Compounds in which metallic elements combine with halagens (the
elements, bromine, chlorine, fluorine, and iodine). Minerals include halite and
fluorite.
Hardness: Hardness is the resistance of a mineral to abrasion or scratching.

APPENDIX
49 | P a g e
Hexagonal: One of the six crystal systems. Hexagonal crystals have four axes of
symmetry; three equal horizontal axes intersect at 120 degree angles, the fourth can
be either longer or shorter and perpendicular to the plane of the other three.
Hopper-shaped: Crystal faces with depressed centers because growth has been
quicker along their edges than at the center.
Hydrocarbons: Organic substances that are composed only of hydrogen and
carbon.
Hydrothermal veins: Veins formed at relatively high temperatures (300 degrees -
500 degrees C) and at relatively great depth.
Hydroxides: Compounds of metallic elements combined with water and hydroxyl.
Igneous: Rock formed by the solidification of molten rock (magma).
Inlier: An area or group of rocks surrounded by rocks of younger age.
Intergrowth: An interlocking of two or more minerals that resulted from their
simultaneous crystallization.
Iridescent: Rainbow-like colors on the interior or surface of a mineral.
Isometric: One of the six crystal systems. Isometric crystals have three axes of
equal length, all at right angles to one another.
Lamellar: Composed of thin layers, plates, or scales; disposed in layers like the
leaves of a book.
Lathanides: Rare earth elements from atomic numbers 58 to 71 inclusive. They
have chemical properties similar to lanthanum, a silvery-white metal that can take
a high polish and which is the most common and most basic of the rare earth metals.
Lapidary: A craftsman who cuts and polishes precious stones.
Lignite: A low-grade brownish black coal.
Lode: A deposit consisting of several veins spaced closely enough so that all of
them, together with the intervening rock, can be mined as a unit.
Lode gold: Gold found in veins within quartz or other rock.
Luster: The way a mineral reflects light or shines. It is one of the means for
distinguishing minerals.
Mafic: Dark colored rock; usually applied to igneous and metamorphic rocks
containing magnesium and iron rich minerals.
Malleable: Able to be hammered into thin sheets without breaking, as gold or silver.
See tenacity.
Massive: a. A mineral deposit characterized by a great concentration of ore in one
place, as opposed to a disseminated or vein deposit. B. A rock with a homogenous

APPENDIX
50 | P a g e
texture or fabric over a wide area, with an absence of layering, foliation, cleavage,
or any similar directional structure. C. Many interlocking crystals, without faces,
forming masses of considerable size.
Metallic: Minerals having the luster of a metal, for example gold and copper.
Metallurgy: a. The science and art of separating metals and metallic materials from
raw ore by mechanical and chemical means. B. Study of the physical properties of
metals as affected by composition, mechanical working and heat treatment.
Metamorphic: Refers to rock which has been altered by heat or intense pressure at
a depth in the earth's crust causing new minerals and new structures in the rock to
be formed.
Mica: A group of monoclinic minerals having similar chemical compositions. The
micas are prominent rock-forming constituents of igneous and metamorphic rocks.
Micaceous: Composed of or resembling mica. Occurring in thin plates or scales
like mica.
Micromount: A natural mineral specimen, preferably in distinct crystals, mounted,
properly labeled, and requiring magnification for meaningful observation.
Mineral: A naturally occurring inorganic substance having an orderly internal
structure and characteristic chemical composition, crystal form, and physical
properties.
Mineral classification: The division of minerals into classes according to aspects
of their chemical composition and atomic structure.
Mineral name: A distinct mineral name is given to each mineral species. Minerals
have been named after people, places, properties, and similarities with other
minerals. Today, all newly discovered minerals, and their intended new name, must
be presented for evaluation to the Commission on New Mineral Names of the
International Mineralogical Association (IMA) so that the name is sanctioned and
standardized.
Mineral species: Any mineral that can be distinguished from all other minerals. It
must differ from every other mineral species either in its chemical composition or
atomic structure.
Monoclinic: One of the six crystal systems. Monoclinic crystals have three unequal
axes, two of which are at right angles to one another and lie in a plane, the third is
inclined to the plane of the other two.
Native Occurring in nature, either pure or uncombined with other substances.
Usually applied to metals, such as native mercury and native copper.
Native element: Uncombined elements that are classified into three groups: metals
such as gold, semimetals such as antimony, and nonmetals such as sulfur.

APPENDIX
51 | P a g e
Nitrates: Compounds in which one or more metallic elements combine with the
nitrate radical, for example, nitratine.
Nodule: A small rounded lump of a mineral or aggregate, normally without internal
structure, and having a contrasting composition from the enclosing sediment or rock
in which it is embedded. For example, pyrite in a coal bed.
Nugget: A lump of native gold, silver, platinum, copper, etc.
Octahedral: Referring to or resembling an octohedron, a crystal form consisting of
eight triangular faces each having equal intercepts on all three crystallographic axes.
Oily: Poorly reflective luster, similar in appearance to oil.
Oolitic: Concentric globular deposits smaller than the size of a pea.
Ore: a. Rocks or minerals that can be mined for a profit. B. The mineral(s) thus
extracted.
Orthorhombic: One of the six crystal systems. Orthorhombic crystals have three
unequal axes, all lying at right angles with respect to one another.
Outcrop: The part of a rock formation that appears at the ground's surface.
Overburden: A material that readily yields oxygen or other oxidizing substances
needed for an explosive reaction to take place.
Pearly: Minerals with a luster like a pearl, such as talc.
Pegmatite: Coarse-grained igneous rock found usually as dikes associated with a
large mass of finer grained plutonic rock.
Pentagonal: A polygon with five sides and five interior angles.
Petrify: To become stone. Organic substances such as shells, stones, and wood
embedded in sediments become converted into stone by the gradual replacement of
their tissues, particle by particle, with corresponding amounts of infiltrated mineral
matter.
Phosphates: Compounds in which metallic elements combine with the phosphate
radical. Minerals include lazulite, pyromorphite, and ludlamite.
Phosphorescence: Where a mineral continues to glow for an interval after the
ultraviolet light source has been turned off. Seefluorescence.
Plagioclase: A group of minerals containing a mixture of sodium and calcium
feldspar.
Platy: Mineral habit with flat, thin crystals.
Plumose: Having a feathery appearance.
Plutonic: A general name pertaining to igneous rocks formed at great depths.

APPENDIX
52 | P a g e
Porcelaneous: Dull, white luster resembling unglazed porcelain.
Porous: Contains voids, pores, cells, and other openings that may or may not
interconnect.
Prism: A crystal form with three or more similar faces parallel to a single axis.
Property: One of the physical or chemical characteristics of a material.
Pulverulent: Easily reduced to powder.
Pyramidal: A crystal form which has three, four, six, eight, or twelve nonparallel
faces that meet at a point.
Pyritohedron: An isometric closed crystal form of 12 faces, each having an
irregular pentagon. It is named after pyrite, which characteristically has this crystal
form.
Pyroxene: This mineral group consists of common, dark-colored, rock-forming
silicate minerals. The most common minerals are diopside and augite.
Radiated: Crystal aggregates that radiate from a center without producing star-like
forms.
Rare earths: a. Oxides of a series of 15 metallic elements, from lanthanum (atomic
number 57) to lutetium (71), and of two other elements, yttrium (39) and scandium
(21). B. Rare earths are not especially rare in the earth's crust, but economic
concentrations are. The rare earth metals resemble one another very closely in
chemical and physical properties so it is difficult to separate them.
Reniform: A term meaning kidney-shaped, used to describe rounded mineral
surfaces.
Resinous: Having the luster of resin.
Reticulated: A mineral with cross meshes, like a net.
Rhombic: Shaped liked a rhombus (an equilateral parallelogram).
Rhombohedral: Referring to a rhombohedron, which is a common crystal form in
the hexagonal crystal system. Its 3-dimensional shape can be visualized as a cube
stretched or compressed in the direction of two opposite corners.
Rock: An aggregate of one or more minerals, (such as granite, shale, marble) or a
body of undifferentiated mineral matter, (such as obsidian) or a solid organic
material, (such as coal). Rocks fall into three broadly defined groups: igneous,
sedimentary, and metamorphic rocks. In some instances a single mineral forms a
rock, as calcite, serpentine, and kaolin. Rock-forming
Minerals: Mineral that is common and abundant in the earth's crust; one making up
large masses of rock.

APPENDIX
53 | P a g e
Rosette: Intergrowth of numerous platy crystals overlapping like the petals of a
rose.
Scaly: Consisting of scales or tabular crystals.
Schistose: Resembling schist (a crystalline rock that can be readily split or cleaved
because of having a foliated or parallel structure).
Sectile: Capable of being cut with a knife into thin shavings.
Sedimentary: Pertaining to rocks formed by the sediment deposition (fragments of
rocks, minerals, animal or plant material).
Series: Any number of rocks, minerals, or fossils having characteristics, such as
growth patterns, succession, composition, or occurrence, that make it possible to
arrange them in a natural sequence.
Serpentine: A group of common rock-forming minerals with a greasy or silky
luster, a somewhat soapy feel, and a tough, conchoidal fracture. They are usually
green, greenish yellow or greenish gray and often veined or spotted with green and
white.
Sheen: The way a mineral reflects light can be affected by characteristics just below
the mineral's surface: for example, the pearly sheen caused by partly-developed
cleavage(s) parallel to the surface; the silky sheen from a fibrous growth structure
or parallel hair-like inclusions.
Silica: A dioxide of silicon, which occurs in crystalline form as quartz, crystobalite,
amorphous opal; an essential constituent of the silicate group of minerals.
Silicates: Compounds in which metallic elements combine with either single or
linked Si-O tetrahedra. Stucturally, minerals in this class are subdivided according
to their crystalline structure, into various groups (for example, ring silicates, single-
chain silicates, framework silicates) rather than their chemical formula. Minerals
include beryl, tourmaline, and epidote.
Silky: Having the luster of silk.
Skeletal: In crystallography, hollow or imperfectly developed crystals formed by
rapid crystallization.
Soluble: Capable of being dissolved in a fluid.
Spalling: The chipping and upward and outward heaving of rock caused by release
of pressure.
Specific gravity: The ratio of a specimen's weight compared with the weight of an
equal volume of water. Therefore, if the weight of a mineral specimen is three times
that of the volume of water it displaces, its specific gravity is three.
Specimen: A sample, as of a mineral, rock, ore, or fossil.

APPENDIX
54 | P a g e
Spherulitic: A rounded mass of acicular crystals, radiating from a central point.
Splintery: The property of certain minerals or rocks to break or fracture into
elongated fragments like splinters of wood.
Spongy: Applied to vesicular rock structures with thin partitions between the
vesicles, thus resembling a sponge.
Stalactitic: Like a stalactite, a conical or cylindrical mineral deposit that hangs from
the ceiling of a cave.
Stellate: An aggregate of crystals in starlike arrangement.
Streak: A mineral's powder color. It is most easily observed by rubbing the mineral
on a piece of white unglazed porcelain (called a streak plate). Also, streak can be
observed by fine crushing a specimen with a hammer.
Subvitreous: Luster not as highly reflective as adamantine, but more so than
vitreous.
Sulfates: Compounds in which one or more metallic elements combine with the
sulfate radical. Minerals include barite, gypsum, and linarite.
Sulfides: Compounds in which sulfur combines with metallic and semimetallic
elements. Minerals include cinnabar, pyrite, and galena.
Sulfosalts: Compounds in which metallic elements combine with sulfur plus a
semimetallic element, for example, stephanite.
Tabular: Crystal habit with the appearance of a paper tablet.
Tenacity: The strength of a mineral; its resistance to breaking, crushing, bending,
or tearing. Terms commonly used to describe the tenacity of a mineral are brittle,
sectile, malleable, flexible, elastic, ductile, and tough.
Tetragonal: One of the six crystal systems. Tetragonal crystals have three axes at
right angles of which only two lateral axes are equal.
Tetrahexahedron: A crystal form of the isometric system, bounded by twenty-four
equal triangular faces, four to each face of the cube.
Tough: Strong and firm in texture but flexible and not brittle; capable of resisting
great strain without coming apart.
Triclinic: One of the six crystal systems. Triclinic crystals share three axes, all
having different lengths and perpendicular to the others.
Trisoctahedron: A form with 24 congruent triangular faces and having an
octahedron base.
Tufted: Refers to a crystal aggregate in the form of fibrous crystal clumps.
APPENDIX
55 | P a g e
Tungstates: Compounds in which metallic elements combine with the tungstate
radical. Minerals include scheelite and wolframite.
Twin crystal: Two portions of a crystal having a definite crystallographic
relationship.
Twinning: An intergrowth of two or more single crystals of the same substance.
Vanadates: Compounds in which metallic elements combine with the vanadate
radical, for example, carnotite.
Variety: A mineral showing differences in color, other physical properties, or minor
variations in composition from the typical species material. For example, amethyst
is the purple variety of the mineral species quartz which has many other varieties
as well.
Vein: A zone or belt of mineralized rock lying within boundaries clearly separating
it from neighboring rock. It includes all deposits of mineral matter found through a
mineralized zone or belt coming from the same source, impressed by the same
forms, and appearing to have been created by the same method.
Veinlet: a small vein.
Vesicle: A small cavity in a glassy, igneous rock formed by the expansion of a gas
bubble or steam during the solidification of the rock.
Vitreous: Luster similar to freshly broken glass; brightly reflective.
Wad: A dark brown or black, impure mixture of manganese and other oxides. It
contains 10 to 20 percent water, and is generally soft; massive and of low specific
gravity. Also called black ocher; earthy manganese; bog manganese.
Waxy: Mineral luster that is only slightly reflective; typical of minutely granular
surfaces.
Wiry: A mineral occurring as thin wires, often twisted like the strands of a rope,
for example native copper.

APPENDIX
56 | P a g e
Appendix 5: Glossary of Terms (General)
Platinum Group Elements (PGEs) PGEs are a specific group of noble metals
that display similar chemical and physical characteristics to one another. They
include: platinum (Pt), palladium (Pd), osmium (Os), ruthenium (Ru), rhodium
(Rh) and iridium (Ir). However, PGEs have a strong affinity towards arsenic
(As), sulphur (S), selenium (Se) and tellurium (Te) which result in complex
mineralogy. So far, 144 minerals of PGE were identified (Smith and Nickel
2007).
Rim Formation Simplification:
1. Biological: Bacterial Biofilms associated with the Ralstonia
metallidurans show an aerated network of budding spherical particles as
small as 3 µm (Reith et al. 2006).
2. Dealloying: Selective corrosion of one or more components of a solid
solution alloy.
3. Mechanical strain: Change in shape, or non-rigid body deformation of a
rock caused by stresses.
EDS: Energy Dispersive X-ray Spectroscopy (EDS, EDX or XEDS) A
qualitative and quantitative X-ray microanalytical technique that can provide
information on the chemical composition of a sample for elements with atomic
number (Z) >3.
EPMA: Electron probe micro-analyser An electron probe micro-analyser is
a microbeam instrument used primarily for the in situ non-destructive chemical
analysis of minute solid samples. EPMA is also informally called an electron
microprobe, or just probe. It is fundamentally the same as an SEM, with the
added capability of chemical analysis. The primary importance of an EPMA is
the ability to acquire precise, quantitative elemental analyses at very small
"spot" sizes (as little as 1-2 microns), primarily by wavelength-dispersive
spectroscopy (WDS).
FFT: Fast Fourier Transform: An algorithm that computes the discrete
Fourier transform (DFT) of a sequence, or its inverse (IFFT). Fourier analysis
converts a signal from its original domain (often time or space) to a
representation in the frequency domain and vice versa. An FFT rapidly

APPENDIX
57 | P a g e
computes such transformations by factorizing the DFT matrix into a product of
sparse (mostly zero) factors.
FIB: Focussed Ion Beam: Uses a finely focused beam of ions (usually gallium)
that can be operated at low beam currents for imaging or at high beam currents
for site specific sputtering or milling.
HAADF-STEM: High-angle Annular Dark-field Scanning Transmission
Electron Microscopy High-angle annular dark-field scanning transmission
electron microscopy (HAADF-STEM) is a STEM method which receives
inelastically scattered electrons or thermal diffuse scattering (TDS) at high
angles using an annular dark-field (ADF) detector (~50 to sufficiently high
angle; e.g. ~200 mrad).
Kikuchi lines: Kikuchi lines pair up to form bands in electron diffraction from
single crystal specimens, there to serve as "roads in orientation-space" for
microscopists not certain at what they are looking. In transmission electron
microscopes, they are easily seen in diffraction from regions of the specimen
thick enough for multiple scattering.[1] Unlike diffraction spots, which blink on
and off as one tilts the crystal, Kikuchi bands mark orientation space with well-
defined intersections (called zones or poles) as well as paths connecting one
intersection to the next.
SEM: Scanning Electron Microscopy The signals used by a scanning electron
microscope to produce an image result from interactions of the electron beam
with atoms at various depths within the sample. Various types of signals are
produced including secondary electrons (SE), reflected or back-scattered
electrons (BSE), characteristic X-rays and light (cathodoluminescence) (CL),
absorbed current (specimen current) and transmitted electrons.
TEM: Transmission Electron Microscopy A microscopy technique in which
a beam of electrons is transmitted through a specimen to form an image. The
specimen is most often an ultrathin section less than 100 nm thick or a
suspension on a grid. An image is formed from the interaction of the electrons
with the sample as the beam is transmitted through the specimen. The image is
then magnified and focused onto an imaging device, such as a fluorescent
screen, a layer of photographic film, or a sensor such as a charge-coupled
device.