alternative energy portfolio standard review
TRANSCRIPT

DAYMARK ENERGY ADVISORS
370 MAIN STREET, SUITE 325 | WORCESTER, MA 01608
TEL: (617) 778-5515 | DAYMARKEA.COM
ALTERNATIVE ENERGY PORTFOLIO STANDARD REVIEW
OCTOBER 30, 2020
PREPARED FOR Massachusetts Department of Energy Resources
PREPARED BY Daymark Energy Advisors

TABLE OF CONTENTS
I. Summary ................................................................................................................................ 1 A. Introduction ............................................................................................................................. 1
B. Scope........................................................................................................................................ 2
C. Summary of Methodology ....................................................................................................... 3
D. Summary of Findings ............................................................................................................... 4
E. Recommendations ................................................................................................................... 8
F. Key Considerations ................................................................................................................... 8
II. Financial and Cost and Benefit Analysis ................................................................................ 10 A. Technologies Studied ............................................................................................................. 10
B. Financial Analysis ................................................................................................................... 13
C. Cost-Benefit Analysis ............................................................................................................. 18
III. Supply and Demand and EmIssions AnalysEs ........................................................................ 21 A. Policy Levers .......................................................................................................................... 21
B. Supply and Demand Analysis ................................................................................................. 23
C. Supply and Demand Findings and Recommendations ........................................................... 35
D. Recommendations ................................................................................................................. 39
APPENDIX A
I. Financial Analysis Assumptions ............................................................................................ 40 II. Financial Results ................................................................................................................... 45 III. Cost-Benefit Analysis Assumptions ....................................................................................... 49
APPENDIX B
I. Moving Obligation to Natural Gas LDCs ................................................................................ 50 II. Renewable Thermal Adoption Rate ...................................................................................... 51 III. Renewable Thermal Required AEC Price and Multiplier ........................................................ 52 IV. Scenario Analysis .................................................................................................................. 53 V. Emissions Savings By Scenario .............................................................................................. 64

OCTOBER 30, 2020
Alternative Energy Portfolio Standard Review 1
I. SUMMARY
A. Introduction The Massachusetts Department of Energy Resources (DOER) manages the state’s Alternative Energy Portfolio Standard (APS) and engaged Daymark Energy Advisors (Daymark) to assess the viability of current incentives and the potential for introducing new technologies. This report documents that work.
History and Intent of APS First implemented in January 2009, the Massachusetts APS is a program to incentivize relatively cleaner, more efficient technologies across the energy spectrum.1 While Combined Heat and Power (CHP) had historically provided the bulk of APS compliance since the policy’s inception, the program has since expanded its qualified technologies over time with the most recent eligibility expansion in December 2017, which included renewable thermal, waste-to-energy, and fuel cell technologies.2 The APS incentivizes these technologies through the generation and sale of Alternative Energy Certificates (AECs). Each system generates an AEC for each megawatt hour equivalent of alternative energy it produces. Electric load serving entities (LSEs) have obligations which require them to purchase a certain percentage of their load from alternative energy, which can be achieved by purchasing AECs. While the Alternative Compliance Payment (ACP) (an alternative to purchasing an AEC) acts as a price ceiling in the APS program, AEC prices are determined by the market.
What is APS Achieving and Not Achieving? The APS has been successful at promoting the use of CHP units since its inception. Since the introduction of renewable thermal technologies three years ago, the APS program has also seen growth participation from both liquid biofuels and residential ground and air-source heat pumps. However, the APS program has not seen as much participation from other APS eligible technologies, such fuel cells, commercial and industrial ground-source or air-source heat pumps, woody biomass, and solar thermal.
1 MA DOER – Program Summaries. https://www.mass.gov/service-details/program-summaries 2 MA DOER – Historical Development of the APS. https://www.mass.gov/service-details/historical-development-of-the-alternative-energy-portfolio-standard

2 Alternative Energy Portfolio Standard Review
What Alternative Approaches Might Improve Program Success? DOER has a variety of policy levers at its disposal to help Massachusetts and the region decarbonize their energy use, particularly for electricity and heating. Some of these levers may include changes to the APS program. These include:
• Changes to the APS demand through alteration of the required APS obligation.
• Modifications to resource eligibility requirements.
• Adjustments to the Alternative Compliance Payments.
• Varying the APS multipliers for individual technologies – so that a particular technology produces more or less AECs.
Additional policy changes that could be implemented include a change to the entity responsible for compliance (e.g. change obligation from electric LSEs to natural gas local distribution companies (LDCs)), however this would require the Massachusetts Legislature to amend to M.G.L. Chapter 25A Section 11 F ½ and is not within DOER’s current authority. Regardless of the tool chosen by regulators, the ultimate driver of AEC supply is the “total incentive” received by adopters of the APS technologies through the sale of AECs generated. This total incentive varies based on the timing and the amount of monetary incentives on a present value basis.
B. Scope MA DOER engaged Daymark to provide analyses and insights as DOER assesses the performance of the APS in order to determine whether the policy is optimally structured. Daymark’s scope includes the following:
• Financial analysis. Review the existing incentive levels offered under the Alternative Energy Portfolio Standard for qualified technologies and evaluate the impact of the incentive on technology growth and adoption.
• Cost-Benefit Analysis. Analyze the greenhouse gas emissions impact of qualified technologies and calculate the economic benefit of emissions savings on both a technology and supply scenario basis.
• Supply and Demand Analysis. Develop baseline supply and demand forecasts based on current conditions and evaluate the impact of multiple potential policy changes on supply and demand.

OCTOBER 30, 2020
Alternative Energy Portfolio Standard Review 3
• Policy options. At the conclusion of the analysis, we provide observations about potential APS program changes based on the research and analyses completed in the three earlier scope items.
C. Summary of Methodology
Financial Cost and Benefits Analyses The financial analysis and cost-benefit analysis were conducted for a subset of APS qualified technologies, which were selected in collaboration with DOER staff, based on the current landscape of the APS. Our analysis included renewable thermal technologies and CHP. Each analysis included the comparison of an APS-qualified technology with conventional non-renewable technologies. The methodology for each analysis is summarized below and described more fully later in the report.
The intent of the financial analysis was to understand the current level of APS incentive provided to each technology and whether that incentive is sufficient to drive technology adoption given the project’s overall economics and comparison technologies. The financial analysis was designed to answer the following questions:
What is the total amount of incentive that technologies require in order to have a reasonable return on investment?
Are technologies over- or under-incentivized through the APS? Are there policy changes that could provide the appropriate level of incentive under the
APS while creating a sustainable market?
Daymark conducted a discounted cash flow (DCF) analysis to evaluate the relative economics of various conventional and APS-qualified technologies. The DCF analysis compares costs and revenues over time to calculate a net present value for each technology comparison.
The intent of the cost-benefit analysis was to understand the greenhouse gas emissions reduction benefits to the Commonwealth of APS qualified technologies and the relative costs of achieving those benefits. Understanding the relative cost of the greenhouse gas emissions reduction for each APS-qualified technology can assist DOER with future program policy decisions. The financial model described above was augmented to calculate the carbon emissions of both the APS-qualified technologies and the comparison technologies.

4 Alternative Energy Portfolio Standard Review
Supply and Demand and Emissions Analyses Policy levers were identified to help structure the Supply and Demand Analysis. Policy levers addressed include modifications to the APS compliance obligation, alternative compliance pricing, technology eligibility, and extending the obligation to the natural gas LDCs.
A baseline supply and demand analysis was then conducted assuming business as usual conditions. Scenario analyses were conducted by changing supply or demand using the policy levers identified.
The emissions analysis was conducted by applying the emissions benefits by technology identified in the cost and benefit analysis to the baseline supply and other supply scenarios.
D. Summary of Findings
Financial and Cost and Benefit Analyses There were a number of findings from the financial analysis and the cost-benefit analysis, which are described in full detail in Section II. The four primary findings related to the financial analysis are:
the necessary incentive level for renewable thermal technologies varies by comparison technology,
the current incentive levels under the APS are not adequate to support the adoption of many renewable thermal technologies,
combined heat and power systems currently do not require an APS incentive, and small renewable thermal systems achieve emissions reductions for the lowest cost.
These findings are depicted in Table 1 below. The table shows the total incentive required by a typical, small renewable thermal system3 to provide net benefits within seven years, compared to a conventional heating technology, and the portion of that total incentive which is being met by the APS program. For example, a ground source heat pump (GSHP) replacing a conventional oil-fired unit would receive an APS incentive of $4,300, which is $9,500 below the necessary incentive for adoption. This varies from a GSHP replacing a natural gas unit as the fuel costs of oil versus natural gas vary over the period analyzed.
3 Further information is available in appendix under renewable thermal costs, page 42, on the assumptions used to define the costs of a typical, small renewable thermal system.

OCTOBER 30, 2020
Alternative Energy Portfolio Standard Review 5
Table 1: Required Incentive for Small Renewable Thermal Technologies
GSHP Oil Gas Propane Electric*
Total Incentive Needed $ 13,800 $ 20,000 $ 9,100 $ (4,900)
APS Incentive ($15/AEC) $ 4,300 $ 4,300 $ 4,300 $ 4,300
Incentive Needed After APS $ 9,500 $ 15,700 $ 4,800 $ -
ASHP (PARTIAL) Oil Gas Propane Electric*
Total Incentive Needed $ 13,300 $ 17,000 $ 7,200 $ (8,700)
APS Incentive ($15/AEC) $ 1,100 $ 1,100 $ 1,100 $ 1,100
Incentive Needed After APS $ 12,200 $ 15,900 $ 6,100 $ -
ASHP (FULL) Oil Gas Propane Electric*
Total Incentive Needed $ 7,900 $ 14,100 $ 3,200 $ (10,700)
APS Incentive ($15/AEC) $ 1,700 $ 1,700 $ 1,700 $ 1,700
Incentive Needed After APS $ 6,200 $ 12,400 $ 1,500 $ -
SOLAR THERMAL HOT WATER
Oil Gas Propane Electric*
Total Incentive Needed $ 6,100 $ 3,600 $ 100 $ 6,100
APS Incentive ($15/AEC) $ 1,100 $ 1,100 $ 1,100 $ 1,100
Incentive Needed After APS $ 5,000 $ 2,500 $ - $ 5,000
BIOMASS PELLET BOILER Oil Gas Propane Electric*
Total Incentive Needed $ 26,900 $ 33,100 $ 22,200 $ 8,200
APS Incentive ($15/AEC) $ 1,900 $ 1,900 $ 1,900 $ 1,900
Incentive Needed After APS $ 25,000 $ 31,200 $ 20,300 $ 6,300

6 Alternative Energy Portfolio Standard Review
Another key finding from the financial analysis is that CHP systems are currently economic without the support of the APS. These technologies receive support from the federal investment tax credit (ITC) and MassSave; given the availability of these incentives, CHP do not require the support of the APS in order to achieve net benefits over a 5-year period.
Lastly, from the cost-benefit analysis, we conclude that small renewable thermal systems achieve emissions reductions for the lowest cost compared to other renewable thermal and CHP systems. Intermediate and large renewable thermal provide emissions reductions, however the cost per emissions reduction of these systems is higher than the small systems. In the cases modeled, CHP systems do not provide any emissions benefits.
Supply and Demand Analysis
If business as usual continues, supply will quickly out pace demand. The baseline supply and demand analysis, shown below in Figure 1, indicates that supply will quickly exceed demand and this imbalance will worsen as additional installations of renewable thermal, CHP, and other technologies come online. The scenario modeled includes renewable thermal (RT-Baseline), CHP (NG CHP-Base), Fuel Cells, and other technologies continuing to have the same adoption rate as previous years with liquid biofuels supply increasing to reach its cap, which is 20% of AEC demand, each year over the next 4 years.

OCTOBER 30, 2020
Alternative Energy Portfolio Standard Review 7
Figure 1: Baseline Supply and Demand Analysis
There are potential policy levers to address supply-demand imbalance. As more fully described in Section III there are policy levers that the Commonwealth could use to address the supply demand imbalance. These include:
Reducing the qualification of CHP for the APS. Historically, CHP has been the largest contributor to APS supply and continues to supply a large percentage of the APS demand through 2030 in the baseline analysis, as shown in Figure 1. The financial and emissions analysis in Section II of this report shows that CHP does not require APS incentives to be economic and that natural gas fueled CHP does not provide GHG emission reductions. Given these two factors, reducing CHP qualification in a manner similar to one of the scenarios described in this report may be productive.
Biofuels and Biogas could be used as a bridge fuel. There is currently a cap on participation on biofuels equal to 20% of the total projected APS obligation for the Compliance Year. Biofuels and biogas have contributed a significant portion of supply (~300,000 AECs, which is ~15% of total supply, in 2018). Given that liquid biofuel can be

8 Alternative Energy Portfolio Standard Review
used in a customer’s existing boiler with no upfront investment, liquid biofuels could serve as a bridge to a low carbon future. Customers could utilize biofuels until they have the capital to convert to a renewable thermal technology.
Increasing demand could accommodate large renewable thermal potential. The potential for renewable thermal technologies is greater than the APS demand in many scenarios. Reducing the eligibility of CHP as suggested above would leave demand available for an expanded renewable thermal program.
Moving obligation to natural gas local distribution companies could be a tool to increase demand. Moving the obligation standard to LDCs could provide more room to expand technology eligibility. The obligation standard on gas LDCs to provide the same demand for AECs would be a lower percentage of load served. Applying the APS to gas LDCs would also remove the perverse relationship of encouraging electrification through a program levied against electric customers. A second option would be to keep the current obligation on electric LSE customers and add an obligation on gas LDC customers. This would also increase demand and allow for expansion of APS supply. A shift or expansion of the APS obligation to include gas LDCs, however, would require the Massachusetts Legislature to amend M.G.L. Chapter 25A Section 11 F ½ and is not within DOER’s current authority.
E. Recommendations We recommend that DOER undertake further stakeholder engagement to assess the applicability and impact of the supply and demand changes described in this report. DOER should seek additional public comment before commencing the promulgation of updated regulations.
F. Key Considerations There are a series of considerations that the reader and policymakers should keep in mind when reviewing this report. These are detailed below.
Financial Considerations The analysis described in this report assumes the current AEC price of $15 stays constant in real terms. The AEC price is a market price that varies based on the supply and demand of AECs in the marketplace. Historically AEC prices have been close to the alternative compliance payment (ACP) level of $25, but prices have dropped recently due to higher supply of certificates in the market. If the market becomes oversupplied, AEC prices are likely to decline, which would negatively impact the economics of all APS

OCTOBER 30, 2020
Alternative Energy Portfolio Standard Review 9
qualified resources. Similarly, if there were another shortage of certificates, prices would rise toward the ACP of $25, improving project economics.
The federal ITC also provides benefits to CHP, solar thermal, and ground source heat pump systems. The ITC provides a tax credit of 10-26% of project capital costs in year 1 of operation and are expected to phase out or be ratchet down in the future, which will negatively impact the economics of these projects.
Supply and Demand Considerations Two ways DOER can modify the total incentive given to Generation Units are through adjustments to the supply of AECs or to the demand for AECs, which will impact the price of AECs in the market. In order to develop these modifications, the first step must be to understand where the supply of AECs is relative to the APS obligation (demand).
Should supply be higher than the demand, the AEC price will fall and the overall incentive to consumers will be lower. Should the supply of AECs be less than the demand, AEC prices will approach the ACP, which is paid when compliance entities are unable to procure sufficient AECs to fulfill their obligation.
Supply may be altered in a variety of ways, including changing the APS multipliers and modifying technology eligibility.
Risks Encouraging modifications in supply or demand levels is not an exact science, and adjustments to either may have indirect and unintended consequences. Of highest importance to DOER may be the indirect effects to the electric ratepayers, whose rates may be affected by increased costs related to APS compliance passed on to them by their utility. Additionally, the APS is unique in the diversity of technologies represented in the program, and the AECs they produce. The diversity of these technologies’ capital costs, fuel costs, depreciation and tax rules may make it difficult to apply “simple fixes”. Any broad adjustment may trigger a change that benefits one technology more than others or at the expense of others.

10 Alternative Energy Portfolio Standard Review
II. FINANCIAL AND COST AND BENEFIT ANALYSIS This section describes the financial and cost and benefit analyses and results. Supporting information for this section is contained in Appendix A.
A. Technologies Studied Daymark developed a list of technologies to investigate but did not study every technology that qualifies for the APS and instead included the technologies that constitute most of the current and expected future compliance. This section describes the APS and conventional technologies that were assessed.
Renewable Thermal The renewable thermal technologies included in the analyses are air- and ground-source heat pumps, biomass pellet boilers, and solar thermal hot water heaters. These are described in Table 2.

OCTOBER 30, 2020
Alternative Energy Portfolio Standard Review 11
Table 2: Renewable Thermal Technologies
TECHNOLOGY DESCRIPTION SIZES COVERED
Ground Source Heat Pump
Ground source heat pumps in new construction or in existing structures replacing conventional heating systems.
Small, Intermediate, Large
Air source Heat Pump
Air source heat pumps in new construction or in existing structures replacing conventional heating systems.
Small, Intermediate, Large
Air Source Heat Pump Retrofit
Air source heat pumps added to existing systems in an existing structure, replacing at least 90% of energy demand.
Small
Biomass Pellet Boiler
Biomass pellet boilers in new construction or in existing structures replacing conventional heating systems.
Intermediate (residential scale), Intermediate (commercial scale), Large
Solar Thermal Hot Water
Solar thermal hot water system providing hot water for domestic or industrial use.
Small, Intermediate, Large
Three different sizes of renewable thermal technologies were studied: small (representing residential), intermediate, and large. Assumptions for the three sizes are shown below in Table 3.

12 Alternative Energy Portfolio Standard Review
Table 3: Renewable Thermal Technologies Sizes Studied
SMALL (RESIDENTIAL) INTERMEDIATE LARGE
Annual Thermal Load 89 MMBtu 662 MMBtu 2200 MMBtu
Size of Unit 2,000 sq. ft. 15,000 sq. ft. 50,000 sq. ft.
Annual Hot Water Load 17 MMBtu 431 MMBtu 1,077 MMBtu
Heating Load Calculation 22 Btu/hr/sq. ft. 22 Btu/hr/sq. ft. 22 Btu/hr/sq. ft.
Renewable Thermal Comparison Cases Each renewable thermal technology was evaluated in comparison to the conventional heating technology it could replace. Comparison heating fuels included oil, natural gas, propane, and electric resistance heating. Comparison hot water fuels included natural gas, propane, and electric resistance. The renewable thermal technology comparisons modeled are included below in Table 4.
Table 4: Renewable Thermal Technology Comparisons OIL NATURAL
GAS PROPANE ELECTRIC
Solar Thermal Small X X X
Intermediate
X X Large X X
Air Source Heat Pumps - Retrofit Small X X X X
Air Source Heat Pumps - New Small X X X X
Intermediate X X X Large X X X
Ground Source Heat Pumps Small X X X X
Intermediate X X X Large X X X
Woody Biomass - Pellets Intermediate (Residential) X X X X Intermediate (Commercial) X X X
Large X X X

OCTOBER 30, 2020
Alternative Energy Portfolio Standard Review 13
CHP Combined heat and power units generate electricity, while capturing steam or waste heat from electricity generation to use as space or process heating. The comparison case for CHP included both the comparison of the electricity and thermal energy provided by a unit to purchases of grid electricity and natural gas for heat, separately.
B. Financial Analysis
Intent of the Analysis The financial analysis was intended to understand the current level of incentive that the APS provides each technology and whether that incentive is enough to drive technology adoption given the project economics. The financial analysis was designed to answer the following questions:
What is the total amount of incentive that technologies require in order to have a reasonable return on investment?
Are technologies over- or under-incentivized through the APS? Are there policy changes that could optimize the incentive level under the APS?
Methodology Daymark conducted a DCF analysis to evaluate the relative economics of various conventional and APS-qualified technologies. The DCF analysis compares costs and revenues over time to calculate a net present value for each technology.
Daymark developed two models for the analysis presented in this study: renewable thermal and CHP. Broadly, the models calculate a system owner’s annual costs or savings from switching from a conventional technology to one of the APS-qualified technologies. Each model accounts for slightly different costs and revenues depending on the specifics of the technology and use case.
For the renewable thermal model, the cost components include initial capital investment, annual fuel costs, operations, and maintenance costs. The revenues, or cost offsets, include federal incentives and AEC revenue. The model includes a DCF of the APS technology and the comparison (conventional) technology. To determine the net present value of an investment in an APS-qualified renewable thermal technology, the model assesses the net costs of the new technology and treats the conventional technology as avoided capital and operating costs.

14 Alternative Energy Portfolio Standard Review
The CHP model is similar but includes some additional cost categories. Since a CHP unit is generating both useful heat and electricity, there are two avoided conventional technologies that must be accounted for: conventional heating equipment and grid electricity services. The grid electricity services include both energy and peak demand charges. The CHP model includes the potential for the unit to sell excess energy back to the grid, providing an additional revenue item for the DCF. Lastly, the CHP model incorporated eligible state incentives.
The assumptions included in each model are described in Section I of Appendix A.
Daymark used the models to calculate the economics under current program rules and market conditions and to separately determine the necessary total incentive levels to provide the required return in a 5-year window for commercial systems and a 7-year window for residential systems, which is an industry standard benchmark used in investment decisions. Based on this total incentive level, the model independently calculated the necessary AEC price, based on the current AEC calculation method, and the AEC multiplier, based on current APS market prices, needed to drive adoption.
Comparative Metrics The DCF financial model described above was used to calculate the following metrics for each technology comparison:
20-year NPV. This is the NPV of the technology comparison over the 20-year project life. Simple payback period. This is the period in years for the project to break even given a
zero-discount rate. Discounted payback period. This is the period in years for the project to achieve a
positive NPV given a 7 percent discount rate. Total necessary incentive. This is the incentive necessary to yield an NPV of zero over a
5-year period for commercial projects or a 7-year period for residential projects, independent of the APS program.
Required AEC price. This is the required levelized AEC price for an NPV of zero over a 5-year period for commercial projects or a 7-year period for residential projects. This analysis assumes that the current AEC calculation methodology and multipliers remain in place.
Required AEC multiplier. This is the required AEC multiplier for an NPV of zero over a 5-year period for commercial projects or a seven-year period for residential projects. This analysis assumes a levelized AEC price of $15.

OCTOBER 30, 2020
Alternative Energy Portfolio Standard Review 15
The full results of this analysis are shown in Section II of Appendix A.
Key Financial findings This section describes our key findings from the financial analysis.
Necessary incentive for renewable thermal technologies varies by comparison technology.
The results from the renewable thermal analysis show that the necessary incentive per technology varies greatly based on the comparison technology. This is due to the large differences in heating and hot water costs between oil, natural gas, propane, and electric resistance technologies. This is shown below in Figure 2 for small renewable thermal applications and shown for all sizes of renewable thermal technologies in Appendix A, Table 18 to Table 20. Figure 2 shows what the AEC price would need to be to achieve net benefits over a seven-year period for each of the renewable thermal technologies, based on the type of fuel the system is replacing. It assumes that the existing multipliers remain unchanged. A high required AEC price, such as ASHP replacing natural gas, indicates that the combined operating and capital costs of the renewable thermal system are significantly more than the conventional system. The AEC price for electric resistance is negative for heat pump systems due to the high operational costs of electric resistance and the improved efficiencies of a heat pump.
Figure 2: Required AEC Price for Small Renewable Thermal Technologies by Comparison Technology
$(150)
$(100)
$(50)
$-
$50
$100
$150
$200
$250
$300
GSHP ASHP(retrofit)
ASHP SolarThermal
Biomass
Requ
ired
AEC
Pric
e ($
/MW
h)
Oil Natural Gas Propane Electric Resistance

16 Alternative Energy Portfolio Standard Review
The results in Figure 2 indicate that it may be challenging to design the APS so that it provides the right incentive for all technology comparisons, unless the comparison technology is taken into account. For example, making modifications to the APS so that the incentive paid to customers currently heating with natural gas is sized so the project results in a zero NPV after 7 years would over-incentivize the same project for oil, propane, and electric resistance heating customers.
Current incentive levels are not adequate to support many renewable thermal technologies.
The second finding related to renewable thermal is that the current incentive levels are not sufficient to support a typical small, renewable thermal system4 for most of the technology comparisons studied. This is shown in Table 5 for small renewable thermal technologies. The necessary incentive for technologies compared with oil, natural gas, and propane is higher than the APS incentive given to most technologies.
Table 5. Required Incentive for Small Renewable Thermal Technologies
GSHP Oil Gas Propane Electric*
Total Incentive Needed $ 13,800 $ 20,000 $ 9,100 $ (4,900)
APS Incentive ($15/AEC) $ 4,300 $ 4,300 $ 4,300 $ 4,300
Incentive Needed After APS $ 9,500 $ 15,700 $ 4,800 $ -
ASHP (PARTIAL) Oil Gas Propane Electric*
Total Incentive Needed $ 13,300 $ 17,000 $ 7,200 $ (8,700)
APS Incentive ($15/AEC) $ 1,100 $ 1,100 $ 1,100 $ 1,100
Incentive Needed After APS $ 12,200 $ 15,900 $ 6,100 $ -
ASHP (FULL) Oil Gas Propane Electric*
Total Incentive Needed $ 7,900 $ 14,100 $ 3,200 $ (10,700)
APS Incentive ($15/AEC) $ 1,700 $ 1,700 $ 1,700 $ 1,700
Incentive Needed After APS $ 6,200 $ 12,400 $ 1,500 $ - 4 Further information is available in appendix under renewable thermal costs, page 42, on the assumptions used to define the costs of a typical, small renewable thermal system.

OCTOBER 30, 2020
Alternative Energy Portfolio Standard Review 17
SOLAR THERMAL HOT WATER Oil Gas Propane Electric*
Total Incentive Needed $ 6,100 $ 3,600 $ 100 $ 6,100
APS Incentive ($15/AEC) $ 1,100 $ 1,100 $ 1,100 $ 1,100
Incentive Needed After APS $ 5,000 $ 2,500 $ - $ 5,000
BIOMASS PELLET BOILER Oil Gas Propane Electric*
Total Incentive Needed $ 26,900 $ 33,100 $ 22,200 $ 8,200
APS Incentive ($15/AEC) $ 1,900 $ 1,900 $ 1,900 $ 1,900
Incentive Needed After APS $ 25,000 $ 31,200 $ 20,300 $ 6,300
Intermediate and large renewable thermal technologies require even larger incentives than the small renewable thermal technologies. An example of this variation in required incentive for small, intermediate, and large systems is shown below in Figure 3 for GSHP and in the Appendix Table 18 through Table 20.

18 Alternative Energy Portfolio Standard Review
Figure 3: Required AEC Price for Ground Source Heat Pumps
CHP is economic without the support of the APS. Our analysis shows that CHP is economic without the support of the APS for the three sizes studied. This is evidenced by the fact that all three cases modeled achieve a positive NPV in less than 5 years of operation and the payback period for CHP units is approximately 1 year. It is important to note that CHP is modeled as receiving the current MassSave incentives and a 10% ITC. Loss of either incentive would impact project economics. The full CHP results are shown in Table 21 to Table 23.
C. Cost-Benefit Analysis The cost-benefit analysis was intended to help understand the carbon benefits of the APS-qualified technologies and the relative costs of achieving those benefits. Understanding the relative cost of carbon reduction of each APS qualified technology enhances DOER’s future program policy decisions.
$-
$50
$100
$150
$200
$250
$300
Oil Gas Propane
$/AE
C Small
Intermediate
Large

OCTOBER 30, 2020
Alternative Energy Portfolio Standard Review 19
Methodology The financial model described above was augmented to calculate the carbon emissions of both the APS-qualified technology and the conventional, comparison technology. The financial model already calculated fuel and electricity use for APS qualified and comparison technologies and assumptions about the carbon content of fuels and carbon emissions generated by electricity were developed to allow for the calculation of emissions savings for each technology comparison.
Cost-Benefit Metrics The results of the emissions analysis for renewable thermal technologies are expressed in dollars of incentive given per metric ton of carbon reduced. The results for the renewable thermal technology are shown in Table 6 through Table 8 below. A negative value indicates the system did not require an incentive, although one was given. CHP did not show any emissions savings in the cases studies.
Table 6: Small Renewable Thermal Systems
TARGET TECHNOLOGY GSHP ASHP (RETROFIT) ASHP (NEW) SOLAR THERMAL
Comparison Technology
Oil Gas Prop. Electric Oil Gas Prop. Electric Oil Gas Prop. Electric Gas Prop. Electric
$ Incentive/ MT GHG Reduction
$54 $130 $36 ($67) $92 $195 $67 ($102) $38 $115 $13 ($100) $162 $76 ($29)
Table 7: Intermediate Renewable Thermal Systems
TARGET TECHNOLOGY GSHP ASHP (NEW) SOLAR THERMAL HOT WATER
Comparison Technology Oil Gas Propane Oil Gas Propane Gas Propane
$ Incentive/MT GHG Reduction $240 $365 $311 $219 $348 $291 $134 $103
Table 8: Large Renewable Thermal Systems
TARGET TECHNOLOGY GSHP ASHP (NEW) SOLAR THERMAL HOT WATER
Comparison Technology Oil Gas Propane Oil Gas Propane Gas Propane
$ Incentive/MT GHG Reduction $183 $281 $234 $208 $330 $274 $134 $103

20 Alternative Energy Portfolio Standard Review
Key Cost/Benefit Findings Small renewable thermal systems achieve emissions reductions for the lowest cost, particularly GSHP and ASHP when compared to oil, propane, and electric resistance. Intermediate and large renewable thermal systems also provide emissions reductions, however the cost per emissions reductions of these systems is higher than the small systems as the total installed cost is much greater for intermediate and large systems.
CHP systems do not provide any emissions benefits, in the cases studied. Emission reduction results are shown in Section IV of Appendix A.

OCTOBER 30, 2020
Alternative Energy Portfolio Standard Review 21
III. SUPPLY AND DEMAND AND EMISSIONS ANALYSES
A. Policy Levers Policy levers were identified to help structure the Supply and Demand Analysis. Policy levers addressed include modifications to the APS compliance obligation, alternative compliance pricing, technology eligibility, and extending the obligation to the natural gas LDCs.
APS Compliance Obligation Massachusetts LSEs are required under the APS program to purchase AECs equal to a certain percentage of their retail sales in a given year (5% in 2020). The APS compliance obligation increases annually, adding a quarter percent to the obligation automatically. Increasing the obligation percentage increases the number of AECs that LSEs must purchase, creating additional demand within the APS market.
Increasing the APS compliance obligation is a lever that policymakers could use to increase AEC demand and stabilize AEC prices as AEC supply increases. If AEC supply exceeds demand due to increasing adoption of APS-qualified technologies, AEC prices would likely decline, limiting the ability of the policy to incent development. Conversely, given constant demand, increasing the APS obligation would be a lever to increase AEC prices.
Alternative Compliance Payment Price ACP prices act as an indirect cap on AEC pricing – should an owner of an AEC offer to sell at a price higher than the ACP, the LSE would likely choose to comply with an ACP instead. Raising the ACP would raise AEC prices in a supply-constrained scenario, as generators could offer AECs at a higher price without LSEs resorting to the ACP. In a balanced or oversupplied market, raising the ACP would likely not impact AEC prices.
Modify Technology Eligibility Changing the rules around technology eligibility is a lever that has previously been used by DOER to introduce or limit types of technology into various portfolio standard program. This lever could range from adding categories, such as adding Renewable Thermal, to changing a detail of technology eligibility, such as changing the required coefficient of performance of heat pumps. Adding or modifying resource eligibility requirements for technologies from the program is a fundamental lever of supply and allows for phasing out a technology that has reached the point of commercial viability

22 Alternative Energy Portfolio Standard Review
without APS incentives. A sub-lever to technology eligibility is the adjustment of the APS multiplier applied to each technology, to achieve a more precise adjustment.
Some examples of technology eligibility changes that DOER could consider include the following:
CHP phase out. New CHP generation units would not be allowed to qualify, so that as existing systems go offline, CHP would slowly be phased out of the APS program.
CHP multiplier change. Applying a factor to existing CHP systems to reduce the number of AECs they produce per MWh generated.
Expanded air source heat pump (ASHP) eligibility. While the APS allows for ASHP retrofits, these systems must supply 90 percent of a home’s heating needs in order to be eligible. This means that customers who want to add ASHP(s) to their home but do not meet the 90% requirement are not eligible to receive AECs. Expanding the eligibility to incorporate small ASHP systems could drive program participation by supplemental systems which replace a smaller amount of heating load.
Extend Obligation to Gas LDCs Many of the APS-qualified technologies target thermal energy rather than electric loads. Customers of natural gas LDCs use a majority of the gas they consume for thermal needs, making an APS obligation on the LDC load a logical choice. In terms of megawatt-hour equivalence, the LDC natural gas demand in Massachusetts is larger than the retail electricity market and therefore the obligation could be adjusted proportionally.
Shifting the APS obligation from electric LSEs to LDCs without changing the number of AECs demanded would lower the obligation percentage, as shown below in Table 9. Our analysis is explained in detail in Appendix B Section I. A shift or expansion of the APS obligation to include gas LDCs, however, would require the Massachusetts Legislature to amend M.G.L. Chapter 25A Section 11 F ½ and is not within DOER’s current authority.

OCTOBER 30, 2020
Alternative Energy Portfolio Standard Review 23
Table 9: APS Obligation on LDCs
MA ELEC. RETAIL SALES
(MWH)
APS REQUIREMENT
(% OF ELECTRIC
SALES)
AECS REQUIRED (CURRENT)
LDC GAS DEMAND
(MWH EQUIV.)5
AECS AS %
OF LDC VOLUME
2020 45,047,645 5.00% 2,252,382 78,249,690 2.88%
2025 43,035,618 6.25% 2,689,726 81,825,144 3.29%
2030 42,850,597 7.50% 3,213,795 83,700,792 3.84%
2035 41,371,676 8.75% 3,620,022 85,814,342 4.22%
2040 39,943,798 10.00% 3,994,380 87,981,262 4.54%
Another option would be to maintain the obligation on electric LSEs and also extend the APS obligation to natural gas LDCs. This would be a way to increase demand without placing all of the additional obligation on electric customers. This serves the same purpose as increasing the obligation – ensuring enough demand to motivate participation in the program.
B. Supply and Demand Analysis To inform the policy lever decision-making process, Daymark evaluated the implications of modifications in the APS program on supply and demand by establishing a baseline projection and developing modified program scenarios.
Baseline We developed a baseline supply and demand analysis based on a business as usual outlook. This analysis assumes that AEC prices remain at current level of $15/AEC. The baseline demand and supply are described below.
Demand The number of AECs required for compliance in a given year is a function of the retail sales of electricity6 by Massachusetts electric utilities in MWh multiplied by the annual compliance percentage requirement as laid out in 225 CMR 16.07(1) and (2). In the year 2020, the minimum compliance percentage is 5.00%, escalating at 0.25% per year.
5 A projection of LDC gas demand was converted to MWh by 1 MWH was equivalent to 3412 cubic feet of natural gas. 6 An electric retail sales forecast was provided by DOER staff.

24 Alternative Energy Portfolio Standard Review
Through 2030, the number of AECs required grows from 2.3 million in 2020 to 4.1 million in 2030 under the current regulation structure.
Figure 4: Baseline AEC Demand
Supply AEC supply is formed by the combined output of all APS-eligible units operating in the state in a given year in addition to any pre-minted7 AECs for small units. While the specific formulas for each technology vary, all non-renewable thermal APS units (such as fuel cells, CHP, etc.), and intermediate or large renewable thermal units are minted quarterly based on the useful thermal energy produced, as measured in MWh. For small renewable thermal units, AECs are pre-minted.
Renewable Thermal
To develop the forecasts of small renewable thermal (ASHP and GSHP) systems, we used a forecast of heating systems with the potential for conversion to renewable thermal and applied an adoption rate for each scenario.
Using key assumptions described more fully in Appendix B Section II results in 2,277 renewable thermal units being adopted in 2019, growing to 15,011 units in 2030. This adoption rate assumes any number of levers are used to maintain the APS incentive. For
7 Pre-minted AECs are the expected MWhs of useful thermal energy produced by a small APS Generation Unit over the first ten years of operation. An owner earns these pre-minted AECs in the first quarter of operation, based upon formulas established by DOER.

OCTOBER 30, 2020
Alternative Energy Portfolio Standard Review 25
the alternative scenarios (discussed below) we applied multipliers to the baseline adoption rate to model accelerated renewable thermal adoption.
Solar thermal units were assumed to generate 81 AECs each per year, with 100 new installations each year.
CHP
For non-renewable technologies in the APS program, different growth assumptions were assumed for different technologies. The technology that currently produces the largest number of AECs is natural gas-powered CHP units. Over the last three years, DOER has seen an average increase in natural gas CHP capacity of 45 MW per year. Assuming a capacity factor equivalent to the average capacity factor of units online in 2018 for these new CHP units results in an incremental 156,464 AECs per year from the current level of 1.4 million AECs.
Liquid Biofuels
Liquid biofuels are the second highest producing APS technology, having produced 294,337 AECs in 2018, or approximately 16% of total AEC demand. In order to protect the APS market from an oversupply due to AECs from Eligible Liquid Biofuels, Eligible Liquid Biofuel Generation Units have a cap on the number of AECs they are able to generate in a given year, which is equal to roughly 20% of the total APS demand. In our baseline scenario, we assume that the AECs from biofuels gradually ramp up from 16% of AEC demand to the program cap of 20% of AEC demand, at a rate of one additional percent per year.
Fuel Cells
Fuel cells are another category of non-renewable APS technologies, with the last two years growing at roughly 1.6 MW of capacity per year, resulting in 19,758 AECs per year of growth.
All other technologies were assumed static. Forecasted supply provided by non-renewable thermal APS technologies did not change in any of the three scenarios forecasted.
Baseline Supply Demand Balance Under our standard baseline assumptions, we show that AEC supply has already outpaced AEC demand in 2019. The baseline assumptions (see Figure 5) show that the current level of demand, as set by the APS compliance minimums, are insufficient to

26 Alternative Energy Portfolio Standard Review
maintain the AEC price at current levels. This would make achieving the baseline projections of renewable thermal technologies challenging, as the baseline adoption rate assumes that the current AEC price of $15 is maintained.
Figure 5: Baseline Supply and Demand
Supply Levers In the supply scenario analysis, we modified the supply by changing the assumptions applied to establish the baseline analysis. The three categories of supply we modified were CHP, liquid biofuels, and small renewable thermal. The section below describes the supply levers and assumptions behind the supply analysis and shows the results of each scenarios.
0
1
2
3
4
5
6
7
8
2019 2020 2021 2022 2023 2024 2025 2026 2027 2028 2029 2030
AECs
(Mill
ions
)
RT - Baseline
NG CHP - Base
Liquid biofuels -Ramp to Cap
Fuel cell
Other
AEC Demand -Baseline
Electric
NG

OCTOBER 30, 2020
Alternative Energy Portfolio Standard Review 27
CHP Currently, natural gas-fueled CHP units comprise the bulk of AEC supply in the market. Daymark’s financial modeling showed that CHP units are generally economic to run, without the APS incentive. Accordingly, two scenarios were devised to demonstrate potential policy modifications their impact on the market. The first CHP scenario evaluates a freeze of eligibility in the APS program – one that effectively allows current CHP units and owners to continue earning AECs for their output but would prevent new CHP units installed after 2021 from qualifying. Such a scenario would allow more room for renewable thermal AECs to fill the market without having to raise the APS minimum compliance percentage as high as the baseline would otherwise require.
The second scenario phases out CHP units from the APS program over time. Beginning in 2022, CHP systems would receive less than full credit for their generation. Credit for CHP would decrease over time ending with full disqualification in 2030. This scenario allows CHP owners to plan for the phase out and provides the most room for renewable thermal technologies.
Each of the CHP scenarios are depicted with the baseline in Figure 6.
Figure 6: CHP Scenarios

28 Alternative Energy Portfolio Standard Review
Renewable Thermal We developed several scenarios of renewable thermal adoption rates. These scenarios are based on the idea that adoption rates could be increased by increasing either the multiplier used to calculate AECs or increasing the AEC price. Daymark calculated both the required AEC price and the required multiplier for each type of renewable thermal project to achieve a zero NPV over 7-years for small systems. These are shown in the table below for small air source and ground source heat pumps and in Appendix B Section III for all systems.
Table 10: Required AEC Price and Multiplier for 7-year NPV = 0
ASHP GSHP
OIL CUSTOMER
NG CUSTOMER
OIL CUSTOMER
NG CUSTOMER
Required AEC Price Assuming Current Multiplier $71 $126 $48 $70
Required Multiplier Assuming $15 AEC Price 14 25 16 23
The first renewable thermal scenario is the baseline scenario described above. It is also described in more detail in Appendix B Section III.
The second supply scenario modeled an increase in incentives resulting from either a growth in AEC prices via an increase in demand and ACP payments to renewable thermal units, such that the net present value of a renewable thermal unit as compared to fuel oil systems was $0. This increase in the financial incentive doubles the baseline adoption rate (e.g., to 10% in 2019) for all fuel types, except natural gas which remains economically advantageous and therefore has a 0 percent adoption rate. This new scenario brought the number of installed units in 2019 to 5,970 and 39,224 in 2030. The number of AECs produced grew from close to 1.1 million to 7.1 million between 2019 and 2030.
The third supply scenario sets the AEC price, via any number of demand levers, to the point where the net present value over a seven-year period is zero when comparing APS technologies to natural gas. Naturally, such high incentives would further increase the conversion rates of oil, propane, and electric systems, so we assumed the adoption rate for these units was three times the baseline rate (e.g., to 15% in 2019). We assumed this higher rate applied to new housing units as well. Again, this produced an increase in APS
OCTOBER 30, 2020
Alternative Energy Portfolio Standard Review 29
units from 14,239 in 2019 to 93,187 in 2030 and AECs produced from 2.5 million to a high of 16.9 million over the same period.
The fourth supply scenario kept the AEC price constant at current levels but used the APS multiplier as the tool to increase the incentive paid out to renewable thermal units. This scenario set the multiplier for both air and ground source heat pumps to be the necessary number to bring their seven-year NPV to zero when compared with oil-heating systems (14x and 16x, respectively). The adoption rates used in this scenario were identical to the adoption rates in our second renewable thermal scenario, as the overall incentive paid to the adopter would be identical. Under this scenario, the number of AECs generated in 2030 reaches 27 million, compared to 2.7 million in the baseline scenario.
A fifth renewable thermal supply scenario mimics scenario four but sets the multipliers to levels necessary to bring renewable thermal in line with natural gas heating systems (25x for ASHP, 23x for GSHP). Adoption rates used in this scenario are identical to scenario three. This scenario sees a high of 106 million AECs in 2030, compared to 2.7 million in the baseline. For reference, 106 million AECs, put in terms of MWh terms, results in an APS compliance percentage of 201%, using the baseline CHP and biofuel scenarios.
Scenarios six and seven are more realistic examples of potential policy decisions made by DOER and would cap the multipliers for both air and ground source heat pumps at 10x each. Scenario 6 is modeled using the adoption rates of Scenario 2, where Scenario 7 is using the adoption rates demonstrated in Scenario 3. The two scenarios would result in a 2030 AEC demand of 18 million and 43 million, respectively.
All renewable thermal supply scenarios are shown in the figure below.

30 Alternative Energy Portfolio Standard Review
Figure 7: Renewable Thermal Supply Scenarios
Scenarios We analyzed three scenarios using the supply levers described above. For each scenario we graphed the supply and calculated the percent of electric or natural gas demand that the APS policy would need to require in order to create a balanced supply and demand scenario.
This metric was calculated to enable us to understand if increasing demand to meet projected supply from a supply scenario was realistic. For example, an APS obligation that is 80 percent of electric demand would be infeasible to implement. This metric is shown on the bottom of the graphs below.

OCTOBER 30, 2020
Alternative Energy Portfolio Standard Review 31
Cap CHP As discussed above, in this scenario, CHP was capped at its 2021 level, while the renewable thermal supply was varied through each of the scenarios described above. All other supply sources were kept at the level described in the baseline analysis. The graph below shows the CHP Cap with Liquid Biofuels Ramp to Cap and the renewable thermal baseline scenarios. Graphs for all the renewable thermal scenarios discussed above are located in the Section IV.A. of Appendix B.
Figure 8: Supply Demand Balance with CHP capped at 2021 Level and Baseline Renewable Thermal
0
1
2
3
4
5
6
7
2019 2020 2021 2022 2023 2024 2025 2026 2027 2028 2029 2030
AECs
(Mill
ions
)
RT - Baseline
NG CHP - Freeze
Liquid biofuels -Ramp to Cap
Fuel cell
Other
AEC Demand -Baseline
Electric
NG
Electric Demand 6.3% 9.4% 10.7%Natural Gas Demand 3.8% 5.4% 7.0%
Total APS Supply as a percent of:

32 Alternative Energy Portfolio Standard Review
Some observations:
The market is oversupplied in every scenario. Demand would need to increase to prevent prices from declining.
If prices did decline due to oversupply, the supply pictured would not be possible. In the baseline renewable thermal scenario, the necessary obligation standard in 2030
would need to be 10.7 percent of electric load to align with the anticipated supply of AECs. which is more than the 7.5 percent obligation standard in 2030 under current regulations. In the more aggressive renewable thermal scenarios, the resulting supply of AECs would be significantly greater than the AEC supply in the baseline renewable thermal scenario. , In some scenarios, the necessary obligation standard would need to be greater than 100% of electric load, which is impractical. Therefore, it is likely not possible to create a balanced APS market by only adjusting the obligation standard.
CHP Phase Out As discussed above, in this scenario CHP is phased out; we varied the renewable thermal supply through each of the scenarios described above. All other supply sources were kept at the level described in the baseline analysis. The graph below shows the CHP Phase Out with Liquid Biofuels Ramp to Cap and the renewable thermal baseline scenarios. Graphs for all the renewable thermal scenarios discussed above are located in Appendix B Section IV.B.

OCTOBER 30, 2020
Alternative Energy Portfolio Standard Review 33
Figure 9: Supply Demand Balance with CHP Phased Out by 2030 and Baseline Renewable Thermal
Some observations:
The market is oversupplied in every scenario except for the scenario in which renewable thermal systems continue to be adopted at the baseline rate, in which supply, and demand are balanced by 2030. Demand would need to increase in the other scenarios to prevent prices from crashing.
If prices did crash due to oversupply, the supply pictured would not be possible. It is likely not possible to increase demand to the levels necessary to create a balanced
market in any of the more aggressive renewable thermal scenarios because in these scenarios the required obligation standard would be a large percentage of electric load and in some cases, the obligation standard would exceed 100% of the electric load.
Emissions Impact of Scenarios For each of the scenarios described above, we analyzed the emissions savings. The technology by technology emissions savings was described in Section II of this report.
0
0.5
1
1.5
2
2.5
3
3.5
4
4.5
2019 2020 2021 2022 2023 2024 2025 2026 2027 2028 2029 2030
AECs
(Mill
ions
)RT - Baseline
NG CHP - Phaseout
Liquid biofuels -Ramp to Cap
Fuel cell
Other
AEC Demand -Baseline
Electric
NG
Electric Demand 6.3% 7.9% 7.2%Natural Gas Demand 3.8% 4.5% 4.7%
Total APS Supply as a percent of:

34 Alternative Energy Portfolio Standard Review
We calculated the emissions savings of individual technologies by calculating the emissions savings relative to the technologies that it is replacing.
We used this analysis to calculate the emissions savings by scenario for each technology type. Renewable thermal and biofuels showed emissions saving, while CHP showed a slight increase in emissions when more of those technologies was included in the supply stack.
Figure 10: Baseline Supply and Demand Scenario Emissions Savings
Appendix B Section V shows the emissions savings for each technology supply scenario.
Biofuel and Biogas As discussed above, our analysis showed that the inclusion of biofuel in the APS provides emissions savings. In addition to biofuel, biogas is another fuel that has the potential to provide emissions savings through its inclusion in the APS.
While biogas was not included in our analysis of supply levers, it is important to note that renewable natural gas is advancing. Currently, the APS requires all Eligible Biogas

OCTOBER 30, 2020
Alternative Energy Portfolio Standard Review 35
Fuel to be transported from where it is created (landfill, digestor, etc.) to the Generation Unit via a dedicated pipeline, which limits the ability for biogas to qualify as biogas injected directly into the distribution system is not eligible. While there are concerns about availability of feedstocks, the addition of renewable natural gas into the distribution network may add value.
A more generous inclusion of biogas in the APS may be particularly important if there is a move to extend the obligation to gas LDCs as discussed above. Some LDCs in the region already have plans to inject renewable natural gas into their distribution networks. For example, Summit Natural Gas in Maine plans to provide its customers with biogas from an anaerobic digester in an amount equal to 45% of its annual residential natural gas demand.8 The APS could incent more projects like this.
C. Supply and Demand Findings and Recommendations
If business as usual continues, supply will quickly out pace demand.
The baseline supply and demand analysis, shown above in Figure 1, indicates that supply will quickly exceed demand and this imbalance will worsen as additional installations of renewable thermal, CHP, and other technologies come online.
This analysis assumes AEC prices remain constant; however, AEC prices will likely drop as the oversupply grows, resulting in a lower incentive for new generation units and therefore slowing adoption rates. Due to this, the actual oversupply will likely be smaller.
Changes to the eligibility rules may manage the oversupply issue.
CHP Historically, CHP has been the largest contributor to APS supply and continues to supply a large percentage of the APS demand through 2030 in the baseline analysis, as shown in Figure 11. Assuming CHP continues the same trajectory predicted in the baseline analysis, there is little room for other resources.
The financial and emissions analysis described Section II showed that CHP does not require APS incentives to be economic and that natural gas fueled CHP does not provide GHG emission reductions, in the cases modeled. Given these two factors, reducing CHP
8 https://summitnaturalgasmaine.com/SummitAnnouncesRenewableNaturalGasInitiative

36 Alternative Energy Portfolio Standard Review
qualification in a manner similar to one of the scenarios described in this report may be productive.
Figure 11: CHP Supply Forecast
Biofuels and Biogas The inclusion of eligible liquid biofuels and biogas should also be examined. As described above, there is currently a cap on participation on biofuels, but together with biogas, these resources still make up a significant portion of supply (~300,000 AECs in 2018).
Given that liquid biofuel can be used in a customer’s existing boiler with no upfront investment, liquid biofuels could serve as a bridge to a low carbon future. Customers could utilize biofuels until they have the capital to convert to a renewable thermal technology.
0
0.5
1
1.5
2
2.5
3
3.5
4
4.5
2019 2020 2021 2022 2023 2024 2025 2026 2027 2028 2029 2030
AECs
(Mill
ions
)
NG CHP - Base
AEC Demand -Baseline
OCTOBER 30, 2020
Alternative Energy Portfolio Standard Review 37
Additionally, biofuels, which utilize specific feedstocks, do provide GHG emissions savings (~0.1 MT CO2 per MWH). Current oil system customers could reduce their emissions by switching to a biofuel blend that is more than the traditional B5 blend that is widely distributed in this region today.
Use of renewable natural gas could also lead to GHG reductions, similarly to biofuel, depending on the feedstock and processing methodology utilized
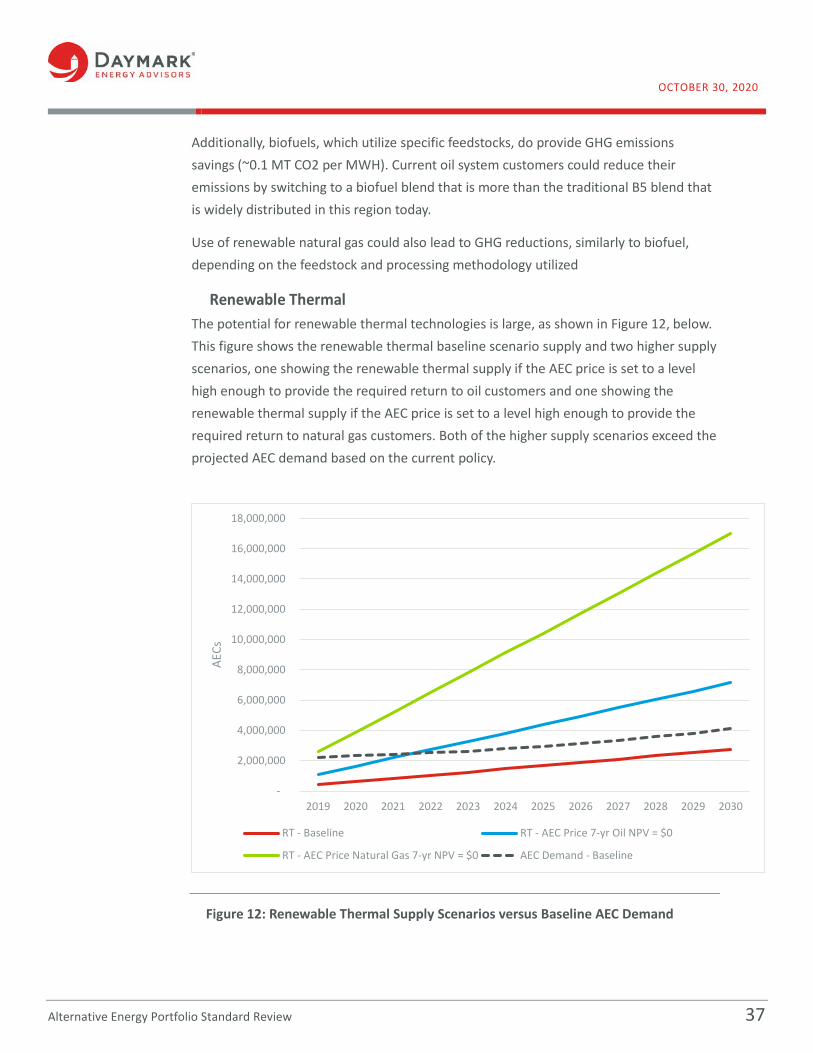
Renewable Thermal The potential for renewable thermal technologies is large, as shown in Figure 12, below. This figure shows the renewable thermal baseline scenario supply and two higher supply scenarios, one showing the renewable thermal supply if the AEC price is set to a level high enough to provide the required return to oil customers and one showing the renewable thermal supply if the AEC price is set to a level high enough to provide the required return to natural gas customers. Both of the higher supply scenarios exceed the projected AEC demand based on the current policy.
Figure 12: Renewable Thermal Supply Scenarios versus Baseline AEC Demand
-
2,000,000
4,000,000
6,000,000
8,000,000
10,000,000
12,000,000
14,000,000
16,000,000
18,000,000
2019 2020 2021 2022 2023 2024 2025 2026 2027 2028 2029 2030
AECs
RT - Baseline RT - AEC Price 7-yr Oil NPV = $0
RT - AEC Price Natural Gas 7-yr NPV = $0 AEC Demand - Baseline

38 Alternative Energy Portfolio Standard Review
Reducing the eligibility of CHP as suggested above would leave demand available for an expanded renewable thermal program.
The baseline renewable thermal analysis assumes a return on investment that is longer than 7-years, indicating that at the current incentive levels, adoption will be slow. The higher adoption rate scenarios shown in Figure 12 would require a larger incentive. In most cases this would be higher than the current ACP of $25/AEC. This is shown in Figure 13, below for ground source heat pumps.
Figure 13: Required AEC Price for GSHP to meet NPV = 0 over 7- years for small installations and 5-years for large installations
Increasing demand would help balance the market. As shown above in Figure 1, the obligation level is below the anticipated supply of AECs. Oversupply is anticipated to begin during 2019. APS banking provisions provide some cushion to the market however the oversupply could affect AEC prices.
Moving the Obligation Standard to LDCs will provide more room to expand technology eligibility. The obligation on gas LDCs to provide the same AEC demand would be a lower
$-
$50
$100
$150
$200
$250
$300
Oil Gas Propane
$/AE
C
Small
Intermediate
Large
ACP

OCTOBER 30, 2020
Alternative Energy Portfolio Standard Review 39
percentage per load served. Applying the APS on gas LDCs would also remove the perverse relationship of encouraging electrification through a program levied against electric ratepayers. A shift or expansion of the APS obligation to include gas LDCs, however, would require the Massachusetts Legislature to amend M.G.L. Chapter 25A Section 11 F ½ and is not within DOER’s current authority.
A second option would be to keep the current obligation on electric LSE customers and add an obligation on gas LDC customers. This would also increase demand and allow for expansion of APS supply.
D. Recommendations We recommend that DOER undertake further stakeholder engagement to assess the applicability and impact of the supply and demand changes described in this report. DOER should seek additional public comment before commencing the promulgation of updated regulations.

40 Alternative Energy Portfolio Standard Review
APPENDIX A
I. FINANCIAL ANALYSIS ASSUMPTIONS Assumptions for the financial analysis were developed utilizing publicly available sources and input from DOER. This section provides the assumptions used and their sources.
Project Life A project life of 20 years was assumed for all resources studied. Given the APS qualified technologies would be installed by commercial and residential customers who would likely look for a shorter return on their investment, we also analyzed project economics over a period of 5 and 7 years for commercial and residential projects, respectively.
Financial Assumptions We used a discount rate of 7% for all technologies. We also assumed an inflation rate of 2%.
Alternative Energy Credit (AEC) Price An AEC price of $15/AEC was used in this analysis. We assumed that the AEC price increased with inflation throughout the study period.
AECs are distributed using technology-specific “multipliers” that serve to adjust incentives awarded. In addition to the multipliers listed below, CHP systems earn AECs based on a formula that calculates the efficiency gains of a given CHP unit over stand-alone electric and heat production.9
9 DOER APS Guideline on the Eligibility and Metering of Combined Heat & Power Projects https://www.mass.gov/files/documents/2016/08/tt/aps-chp-guidelines-jun14-2011.pdf

OCTOBER 30, 2020
Alternative Energy Portfolio Standard Review 41
Table 11: AEC Multipliers10
TECHNOLOGY APS RENEWABLE THERMAL
GENERATION UNIT MULTIPLIER
System size Small Intermediate Large Active solar hot water systems used for domestic hot water 3 3 3
Active solar hot water systems used for domestic hot water, space condition, or process loads 1 1 1 Active solar hot air systems 0 5 5 Solar sludge dryer 0 0 1 Ground source heat pumps 5 5 5 Deep geothermal 0 0 1
Air source heat pumps (electric or engine driven) -- supplying less than 100% of building heating load 2 0 0 Air source heat pump (electric or engine driven) -- all other 3 3 3 Compost heat exchange system 0 0 1 Biomass, biofuels, biogas N/A N/A N/A
Incentives MassSave provides incentives to CHP units based on factors such as the individual project’s efficiency and other variables. Due to the variability of incentives given to CHP systems, an estimation of the MassSave incentive for CHP was modeled to be $938/kW. State incentives were not modeled for renewable thermal technologies due to wide program variability in the MassSave incentives available.
The federal investment tax credit (ITC) was modeled for the technologies that qualify, which include CHP, ground source heat pumps, and solar thermal. The percentage ITC modeled is included in Table 12.
10 DOER APS Guideline on Multipliers for Renewable Thermal Generation Units. https://www.mass.gov/files/documents/2017/12/14/Guideline%20on%20Multipliers%20for%20Renewable%20Thermal%20Generation%20Units%20FINAL.pdf

42 Alternative Energy Portfolio Standard Review
Table 12: Federal ITC Modeled
TECHNOLOGY ITC PERCENTAGE CHP 10%
Solar Thermal 26%
Ground Source Heat Pump 26%
Renewable Thermal Costs For small residential heat pumps, key cost information was derived from NYSERDA’s Analysis of Residential Heat Pump Potential and Economics report.11 Information on intermediate and large heat pumps, as well as all sized biomass units was derived from cost data provided by DOER. Solar thermal technologies were modeled using information from NREL.12 Tables of renewable thermal cost assumptions are included in the tables below.
Table 13: Small Renewable Thermal Technology Cost Assumptions
TECHNOLOGY INSTALLED COSTS
ANNUAL O&M
EFFICIENCY SIZE
GSHP $35,190 $102 400% 4 tons
Retrofit ASHP $12,615 $102 300% 3 tons
New ASHP $17,872 $102 250% 5 tons
Solar DHW $9,792 $97.92 5,400% 64 sq. ft.
Biomass $26,630 $1,960 85% 68 kBtu/hr
Table 14: Intermediate Renewable Thermal Technology Cost Assumptions
TECHNOLOGY INSTALLED COSTS
ANNUAL O&M EFFICIENCY SIZE
GSHP $505,000 $300 400% 40 tons
ASHP $310,145 $300 250% 27.5 tons
Solar DHW $177,600 $888 6,800% 1,600 sq. ft.
Biomass $165,140 $9,506 85% 330 kBtu/hr 11 NYSERDA New Efficiency: New York, Analysis of Residential Heat Pump Potential and Economics https://www.nyserda.ny.gov/-/media/Files/Publications/PPSER/NYSERDA/18-44-HeatPump.pdf 12 NREL Distributed Generation Renewable Energy Estimate of Costs https://www.nrel.gov/analysis/tech-lcoe-re-cost-est.html

OCTOBER 30, 2020
Alternative Energy Portfolio Standard Review 43
Table 15: Large Renewable Thermal Technology Cost Assumptions
TECHNOLOGY INSTALLED COSTS
ANNUAL O&M EFFICIENCY SIZE
GSHP $1,262,500 $500 400% 100 tons
ASHP $918,000 $500 250% 92 tons
Solar DHW $444,000 $2,200 6,800% 4,000 sq. ft.
Biomass $390,000 $28,714 85% 1 MMBtu/hr
Electric costs were estimated using the average Residential Delivery Rate from the three major investor-owned utilities operating in Massachusetts. The MA basic service rate was added on to this average to reach an average price of approximately $0.23 per kWh. This was escalated at a rate of 2.6 percent.
Renewable Thermal Comparison Costs Comparison home heating costs were developed for conventional technologies including system and fuel costs for oil, natural gas, propane, and electric resistance heaters. For home heating systems and commercial sized boilers, the EIA Updated Buildings Sector Appliance and Equipment Costs and Efficiencies report provided cost information.13
The APS does not require solar hot water heaters to cover the full water-heating load of a house. Therefore, the study assumes solar hot water heaters do not displace conventional capital costs of heating but reduced the fuel costs needed to produce the same quantity of hot water.
Conventional heating and hot water system costs are included in Table 16, below.
13 EIA Updated Buildings Sector Appliance and Equipment Costs and Efficiencies https://www.eia.gov/analysis/studies/buildings/equipcosts/pdf/full.pdf

44 Alternative Energy Portfolio Standard Review
Table 16: Conventional Heating and Hot Water System Assumptions
ASSUMPTION OIL NATURAL GAS PROPANE ELECTRIC
RESISTANCE
Capital Costs Small $6,866 $4,785 $4,785 $1,040 Medium $32,772 $33,760 $22,760 NA Large $54,240 $55,733 $55,733 NA
Fixed Annual O&M
Small $146 $94 $94 $42 Medium $2,393 $1,873 $1,873 NA Large $54,140 $55,733 $55,733 NA
CHP To model CHP financial incentives, three reciprocating engine systems were modeled at 100 kW, 633 kW, and 3,326 kW sizes. Size, efficiency figures, power to heat ratios, as well as total installed costs per kW were derived from the EPA’s Catalog of CHP Technologies.14
CHP natural gas costs were computed using National Grid’s G-42B Medium Commercial Customer, Low Load Factor Rates over the November 2018 to October 2019 period. Electric Rates used were National Grid’s G-2 rate structure for medium sized businesses with more than 10,000kWh usage per month.
A table of CHP system costs modeled is included below as Table 17.
Table 17: Combined Heat & Power System Cost Assumptions
ASSUMPTION SMALL MEDIUM LARGE
Modeled Size 100 kW 633 kW 3326 kW
Electrical Efficiency 27% 35% 36.8%
Overall Efficiency 80% 79% 78%
Power to Heat Ratio 0.51 0.78 1.06
Installed Cost ($/kW) $3,266 $3,194 $2,028
Fixed O&M Cost ($/kW-year) $20 $20 $8
14 EPA Catalog of CHP Technologies https://www.epa.gov/chp/catalog-chp-technologies
OCTOBER 30, 2020
Alternative Energy Portfolio Standard Review 45
II. FINANCIAL RESULTS
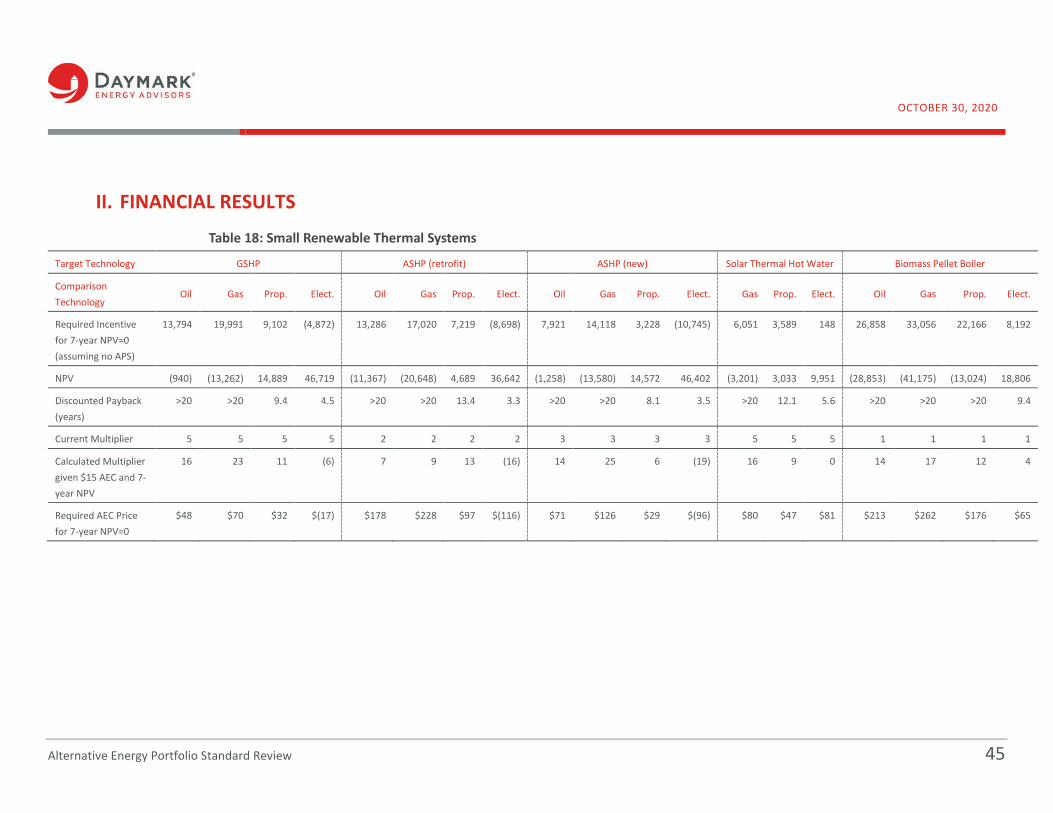
Table 18: Small Renewable Thermal Systems
Target Technology GSHP ASHP (retrofit) ASHP (new) Solar Thermal Hot Water Biomass Pellet Boiler
Comparison Technology
Oil Gas Prop. Elect. Oil Gas Prop. Elect. Oil Gas Prop. Elect. Gas Prop. Elect. Oil Gas Prop. Elect.
Required Incentive for 7-year NPV=0 (assuming no APS)
13,794 19,991 9,102 (4,872) 13,286 17,020 7,219 (8,698) 7,921 14,118 3,228 (10,745) 6,051 3,589 148 26,858 33,056 22,166 8,192
NPV (940) (13,262) 14,889 46,719 (11,367) (20,648) 4,689 36,642 (1,258) (13,580) 14,572 46,402 (3,201) 3,033 9,951 (28,853) (41,175) (13,024) 18,806
Discounted Payback (years)
>20 >20 9.4 4.5 >20 >20 13.4 3.3 >20 >20 8.1 3.5 >20 12.1 5.6 >20 >20 >20 9.4
Current Multiplier 5 5 5 5 2 2 2 2 3 3 3 3 5 5 5 1 1 1 1
Calculated Multiplier given $15 AEC and 7-year NPV
16 23 11 (6) 7 9 13 (16) 14 25 6 (19) 16 9 0 14 17 12 4
Required AEC Price for 7-year NPV=0
$48 $70 $32 $(17) $178 $228 $97 $(116) $71 $126 $29 $(96) $80 $47 $81 $213 $262 $176 $65

46 Alternative Energy Portfolio Standard Review
Table 19: Intermediate Renewable Thermal Systems
TARGET TECHNOLOGY GSHP ASHP (NEW) SOLAR THERMAL HOT WATER BIOMASS PELLET BOILER
COMPARISON TECHNOLOGY OIL GAS PROPANE OIL GAS PROPANE GAS PROPANE OIL GAS PROPANE
Required Incentive for 5-year NPV=0, Assuming no APS
$335,109 $346,707 $323,776 $274,328 $285,926 $262,995 $120,675 $101,911 $154,490 $166,088 $143,157
NPV $(246,445) $(288,030) $(203,936) $(244,847) $(286,432) $(202,338) $(42,824) $23,502 $(164,762) $(206,347) $(122,253)
Discounted Payback >20 years >20 years >20 years >20 years >20 years >20 years >20 years 16.0 >20 years >20 years >20 years
Simple Payback >20 years >20 years >20 years >20 years >20 years >20 years 15.3 9.9 >20 years >20 years >20 years
Current Multiplier 5 5 5 3 3 3 5 5 1 1 1
Calculated Multiplier given $15 AEC and 5-year NPV
18 18 17 43 45 41 7 6 21 22 19
Required AEC Price for 5-year NPV=0
$265 $274 $256 $643 $671 $617 $105 $89 $310 $333 $287

OCTOBER 30, 2020
Alternative Energy Portfolio Standard Review 47
Table 20: Large Renewable Thermal Systems
TARGET TECHNOLOGY GSHP ASHP (NEW)
SOLAR THERMAL HOT WATER
BIOMASS PELLET BOILER
COMPARISON TECHNOLOGY OIL GAS PROPANE OIL GAS PROPANE GAS PROPANE OIL GAS PROPANE
Required Incentive for 5-year NPV=0, Assuming no APS
$864,293 $901,903 $825,698 $864,335 $901,945 $825,739 $301,707 $254,818 $417,178 $454,788 $378,583
NPV $(589,711) $(722,006) $(442,539) $(786,432) $(918,727) $(639,260) $(107,176) $58,563 $(466,095) $(598,389) $(318,923)
Discounted Payback >20 years >20 years >20 years >20 years >20 years >20 years >20 years 16.0 >20 years >20 years >20 years
Simple Payback >20 years >20 years >20 years >20 years >20 years >20 years 15.3 9.9 >20 years >20 years >20 years
Current Multiplier 5 5 5 3 3 3 5 5 1 1 1
Calculated Multiplier given $15 AEC and 5-year NPV
14 18 13 41 42 39 7 6 17 18 15
Required AEC Price for 5-year NPV=0
$205 $214 $196 $610 $636 $583 $105 $89 $252 $275 $229

48 Alternative Energy Portfolio Standard Review
Table 21: 300 kW CHP System
METRIC VALUE NPV $1,436,385
Discounted Payback 1.14
Simple Payback 1.00
Required AEC Price for 5-year NPV=0 0.00
Required Incentive for 5-year NPV=0 0.00
Table 22: 633 kW CHP System
METRIC VALUE
NPV $7,696,768
Discounted Payback 1.17
Simple Payback 1.02
Required AEC Price for 5-year NPV=0 0.00
Required Incentive for 5-year NPV=0 0.00
Table 23: 3326 kW CHP System
METRIC VALUE NPV $38,622,123
Discounted Payback 0.63
Simple Payback 0.63
Required AEC Price for 5-year NPV=0 0.00
Required Incentive for 5-year NPV=0 0.00

OCTOBER 30, 2020
Alternative Energy Portfolio Standard Review 49
III. COST-BENEFIT ANALYSIS ASSUMPTIONS The carbon content of fuels and carbon emissions from grid generated electricity was a key input in the calculation of carbon savings. DOER provided emissions factors for natural gas, heating oil, and propane which are currently used in the APS, as shown below in Table 24. These emissions factors are based upon life cycle emissions as developed by Manomet in its study on life cycle carbon emissions for biomass fuels.15 The electricity emissions were based on the average marginal emissions rate from ISO New England’s 2017 ISO NE Electric Generator Air Emissions Report.16
Table 24: Carbon Emissions by Fuel OIL NATURAL GAS PROPANE ELECTRICITY
lbs/MMBTU lbs/MMBTU lbs/MMBTU lbs/kWh
200.5 158.1 168.7 0.654
15 Manomet, Biomass Sustainability and Carbon Policy Study. June 2010. https://www.mass.gov/files/documents/2016/08/qx/manomet-biomass-report-full-hirez.pdf 16 ISO New England, 2017 ISO NE Electric Generator Air Emissions Report. April 2019. Table 5-3. https://www.iso-ne.com/static-assets/documents/2019/04/2017_emissions_report.pdf

50 Alternative Energy Portfolio Standard Review
APPENDIX B
I. MOVING OBLIGATION TO NATURAL GAS LDCS Estimating the potential impact of applying the APS to LDCs requires a forecast of natural gas demand for Massachusetts gas utilities. Daymark used a 2016 report from consultant ICF to ISO-NE providing demand forecasts for the years 2020, 2025, and 2030, along with a compound annual growth rate (CAGR) for each five-year period in between. We applied growth rates to the forecasted years to create an annual forecast for the 2019 to 2040 forecasting period, using the 2025-2030 CAGR for all years past 2030.
Daymark forecasted AECs required for the study period based on existing policy. APS compliance percentages are provided in 225 CMR 16 and escalate at 0.25% per year after 2020. We developed a retail sales forecast by using the forecast for 2017-2021 included in the 2016 APS Compliance Report. Beyond 2021 we applied the long term CAGR assumed in the 2019 ISO-NE CELT load forecast for Massachusetts. ISO-NE forecasts a -0.7% growth rate, indicating that net load is forecast to decline. Together, these forecasts provided the number of AECs required in all years of the study.
Daymark converted the gas forecast Bcf per year to MWh per year to properly determine the number of AECs as a percentage of gas demand. Demand in Bcf was multiplied by 1,000,000 to arrive at demand in Mcf, with 1 Mcf = 1 MMBtu approximately. 1 MMBtu = approximately 293 kWh, therefore the Mcf gas forecast was multiplied by 293, and then divided by 1,000 to arrive at MWh forecast.
As we expected, because the gas demand forecast is higher than the retail electricity forecast, the number of AECs if left unchanged would result in a much lower percentage needed for compliance by LDCs in each study year. Furthermore, because of the decline in retail electricity sales in combination with the demand growth of natural gas, the number of AECs as a percentage of gas demand rises much more slowly than as a percentage of electricity demand.
The table below provides the AEC requirement and comparable percentage of electric and LDC sales for select years.

OCTOBER 30, 2020
Alternative Energy Portfolio Standard Review 51
Table 25: APS Obligation on LDCs
LDC GAS DEMAND (MWH
EQUIV.)
MA ELEC. RETAIL SALES
(MWH)
APS REQUIREMENT (% OF ELECTRIC
SALES)
AECS REQUIRED (CURRENT)
AECS AS % OF LDC
VOLUME
2020 78,249,690 45,047,645 5.00% 2,252,382 2.88%
2025 81,825,144 43,035,618 6.25% 2,689,726 3.29%
2030 83,700,792 42,850,597 7.50% 3,213,795 3.84%
2035 85,814,342 41,371,676 8.75% 3,620,022 4.22%
2040 87,981,262 39,943,798 10.00% 3,994,380 4.54%
II. RENEWABLE THERMAL ADOPTION RATE To determine the number of heating systems available to implement renewable thermal technology, we developed an annual forecast of the number of new Massachusetts housing units, and the number of existing housing units with heating systems reaching their end-of-life. This forecast relied on data from the U.S. Census Bureau’s American Community Survey for the years 2012-2017, which provides the number of housing units in the state disaggregated by heating fuel type.
We forecasted the number of new housing units by extrapolating the annual housing unit additions for 2018-2030 using the compound annual growth rate (CAGR) from the last five years of actual data, resulting in a housing stock that is rising at 0.47% per year. This results in new construction in the range of 12,200-12,800 units per year.
For the existing housing units in which heating systems are reaching the end-of-life, we assumed that systems have a lifespan of 25 years – resulting in 1/25th of 2017 existing units coming to the end of their useful life and needing replacement each year. The new housing units plus the units with heating systems at their end of life represent the total housing units available for conversion.
For a baseline adoption rate of renewable thermal, we began with the following trajectory published in a recent NYSERDA heat pump study.

52 Alternative Energy Portfolio Standard Review
Figure 14: Small Renewable Thermal Adoption Rate
After 2025 we assume that this adoption rate growth trajectory continues at 2.5% per year.
The NYSERDA study assumed that this adoption rate would occur if incentive levels are sufficient to make an ASHP cost effective over a 15-year period. Our previous modeling showed that conversion from electric and propane heat would be cost-effective over this period assuming current AEC prices. Therefore, in the baseline scenario we assumed the full NYSERDA adoption rate for units of these fuel types coming to the end of their useful life. The conversion of fuel oil systems has a longer payback period, so in the baseline we assumed adoption occurs at half the rate of propane and electricity in all years (i.e. 2.5% in 2019). Under current incentive levels, renewable thermal systems are not economically competitive with natural gas systems, and therefore no conversion from natural gas was assumed. All new housing units were assumed to adopt APS systems at the full adoption rate.
III. RENEWABLE THERMAL REQUIRED AEC PRICE AND MULTIPLIER
Table 26: Required AEC Price and Multiplier for Intermediate Renewable Thermal Technologies
ASHP GSHP
OIL CUSTOMER
NG CUSTOMER
OIL CUSTOMER
NG CUSTOMER
Required AEC Price Assuming Current Multiplier $643 $671 $265 $274
Required Multiplier Assuming $15 AEC Price 18 18 43 45

OCTOBER 30, 2020
Alternative Energy Portfolio Standard Review 53
Table 27: Required AEC Price and Multiplier for Large Renewable Thermal Technologies
ASHP GSHP
OIL CUSTOMER
NG CUSTOMER
OIL CUSTOMER
NG CUSTOMER
Required AEC Price Assuming Current Multiplier $610 $636 $205 $214
Required Multiplier Assuming $15 AEC Price 41 42 14 22
IV.SCENARIO ANALYSIS
A. Cap CHP Below are addition graphs showing all the renewable thermal scenarios.
Figure 15: Supply Demand Balance with CHP capped at 2021 Level and Renewable Thermal Supply based on Setting NPV = 0 for Oil Customers
0
2
4
6
8
10
12
2019 2020 2021 2022 2023 2024 2025 2026 2027 2028 2029 2030
AECs
(Mill
ions
)
RT - AEC Price 7-yrOil NPV = $0
NG CHP - Freeze
Liquid biofuels -Ramp to Cap
Fuel cell
Other
AEC Demand -Baseline
Electric
NG
Electric Demand 8.5% 15.2% 18.7%Natural Gas Demand 5.0% 8.7% 12.3%
Total APS Supply as a percent of:

54 Alternative Energy Portfolio Standard Review
Figure 16: Supply Demand Balance with CHP capped at 2021 Level and Renewable Thermal Supply based on Setting NPV = 0 for Gas Customers (Assumes AEC Price of
$126)
0
5
10
15
20
25
2019 2020 2021 2022 2023 2024 2025 2026 2027 2028 2029 2030
AECs
(Mill
ions
)RT - AEC PriceNatural Gas 7-yrNPV = $0NG CHP - Freeze
Liquid biofuels -Ramp to Cap
Fuel cell
Other
AEC Demand -Baseline
Electric
NG
Electric Demand 13.4% 28.1% 36.7%Natural Gas Demand 7.9% 16.1% 24.0%
Total APS Supply as a percent of:
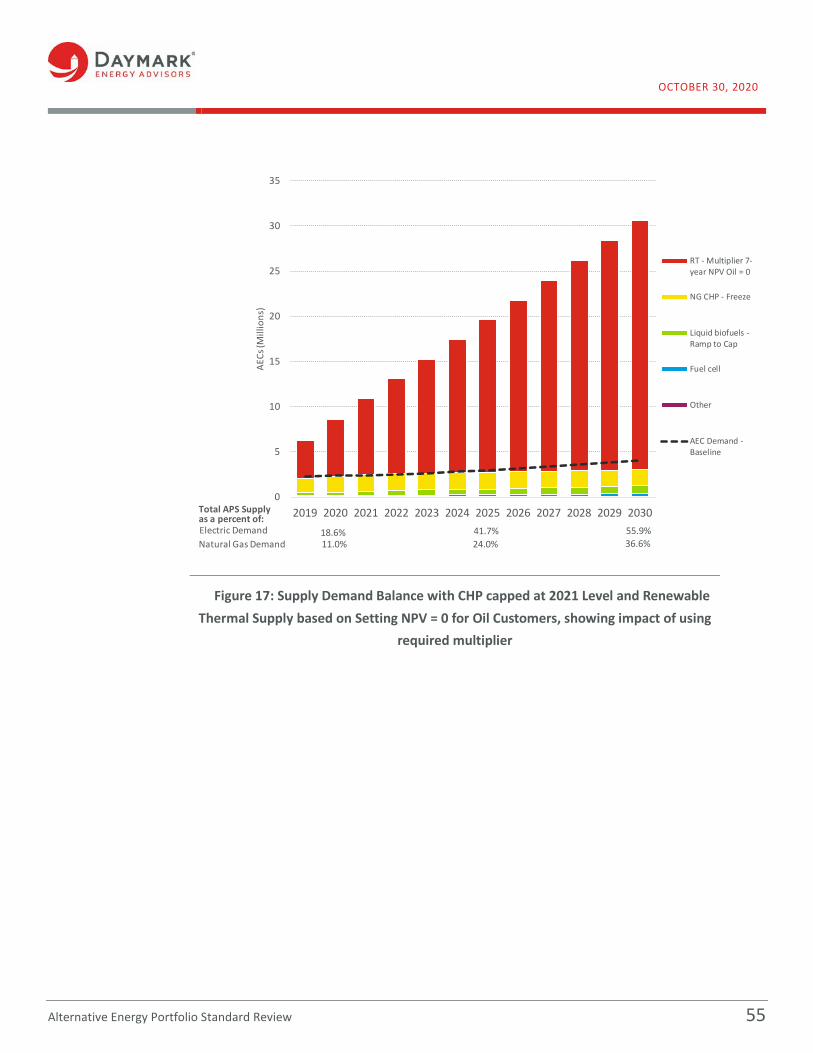
OCTOBER 30, 2020
Alternative Energy Portfolio Standard Review 55
Figure 17: Supply Demand Balance with CHP capped at 2021 Level and Renewable Thermal Supply based on Setting NPV = 0 for Oil Customers, showing impact of using
required multiplier
0
5
10
15
20
25
30
35
2019 2020 2021 2022 2023 2024 2025 2026 2027 2028 2029 2030
AECs
(Mill
ions
)RT - Multiplier 7-year NPV Oil = 0
NG CHP - Freeze
Liquid biofuels -Ramp to Cap
Fuel cell
Other
AEC Demand -Baseline
Electric
NG
Electric Demand 18.6% 41.7% 55.9%Natural Gas Demand 11.0% 24.0% 36.6%
Total APS Supply as a percent of:

56 Alternative Energy Portfolio Standard Review
Figure 18: Supply Demand Balance with CHP capped at 2021 Level and Renewable Thermal Supply based on Setting NPV = 0 for Gas Customers, showing impact of using
required multiplier
0
20
40
60
80
100
120
2019 2020 2021 2022 2023 2024 2025 2026 2027 2028 2029 2030
AECs
(Mill
ions
)RT - Multiplier 7-year NPV Gas = 0
NG CHP - Freeze
Liquid biofuels -Ramp to Cap
Fuel cell
Other
AEC Demand -Baseline
Electric
NG
Electric Demand 57.5% 144.4% 199.3%Natural Gas Demand 34.0% 82.9% 130.4%
Total APS Supply as a percent of:

OCTOBER 30, 2020
Alternative Energy Portfolio Standard Review 57
Figure 19: Supply Demand Balance with CHP capped at 2021 Level and Renewable Thermal Supply based on Setting NPV = 0 for Oil Customers, showing impact of using
Multiplier of 10
0
5
10
15
20
25
2019 2020 2021 2022 2023 2024 2025 2026 2027 2028 2029 2030
AECs
(Mill
ions
)RT - MultiplierCapped at 10 (Oil7-year NPV = 0adoptionscenario)NG CHP - Freeze
Liquid biofuels -Ramp to Cap
Fuel cell
Other
Electric Demand 14.1% 30.0% 39.4%Natural Gas Demand 8.4% 17.2% 25.8%
Total APS Supply as a percent of:

58 Alternative Energy Portfolio Standard Review
Figure 20: Supply Demand Balance with CHP capped at 2021 Level and Renewable Thermal Supply based on Setting NPV = 0 for Gas Customers, showing impact of using
Multiplier of 10Multiplier of 10
0
5
10
15
20
25
30
35
40
45
50
2019 2020 2021 2022 2023 2024 2025 2026 2027 2028 2029 2030
AECs
(Mill
ions
)RT - MultiplierCapped at 10 (gas7-yr NPV adoptionscenario)NG CHP - Freeze
Liquid biofuels -Ramp to Cap
Fuel cell
Other
AEC Demand -Baseline
Electric
Electric Demand 26.8% 63.3% 85.9%Natural Gas Demand 15.8% 36.3% 56.2%
Total APS Supply as a percent of:

OCTOBER 30, 2020
Alternative Energy Portfolio Standard Review 59
B. CHP Phase Out
Figure 21: Supply Demand Balance with CHP Phased Out by 2030 and Renewable Thermal Supply based on Setting NPV = 0 for Oil Customers (assuming AEC price of
$71)
0
1
2
3
4
5
6
7
8
9
2019 2020 2021 2022 2023 2024 2025 2026 2027 2028 2029 2030
AECs
(Mill
ions
)
RT - AEC Price 7-yrOil NPV = $0
NG CHP - Phaseout
Liquid biofuels -Ramp to Cap
Fuel cell
Other
AEC Demand -Baseline
Electric
NG
Electric Demand 8.5% 13.7% 15.3%Natural Gas Demand 5.0% 7.8% 10.0%
Total APS Supply as a percent of:

60 Alternative Energy Portfolio Standard Review
Figure 22: Supply Demand Balance with CHP Phased Out by 2030 Level and Renewable Thermal Supply based on Setting NPV = 0 for Gas Customers (Assumes AEC
Price of $126)
0
2
4
6
8
10
12
14
16
18
20
2019 2020 2021 2022 2023 2024 2025 2026 2027 2028 2029 2030
AECs
(Mill
ions
)RT - AEC PriceNatural Gas 7-yrNPV = $0NG CHP - Phaseout
Liquid biofuels -Ramp to Cap
Fuel cell
Other
AEC Demand -Baseline
Electric
NG
Electric Demand 13.4% 26.5% 33.3%Natural Gas Demand 7.9% 15.2% 21.8%
Total APS Supply as a percent of:

OCTOBER 30, 2020
Alternative Energy Portfolio Standard Review 61
Figure 23: Supply Demand Balance with CHP Phased Out by 2030 and Renewable Thermal Supply based on Setting NPV = 0 for Oil Customers, showing impact of using
required multiplier
0
5
10
15
20
25
30
35
2019 2020 2021 2022 2023 2024 2025 2026 2027 2028 2029 2030
AECs
(Mill
ions
)RT - Multiplier 7-year NPV Oil = 0
NG CHP - Phaseout
Liquid biofuels -Ramp to Cap
Fuel cell
Other
AEC Demand -Baseline
Electric
NG
Electric Demand 18.6% 40.2% 52.5%Natural Gas Demand 11.0% 23.1% 34.3%
Total APS Supply as a percent of:

62 Alternative Energy Portfolio Standard Review
Figure 24: Supply Demand Balance with CHP Phased Out by 2030 Level and Renewable Thermal Supply based on Setting NPV = 0 for Gas Customers, showing
impact of using required multiplier
0
20
40
60
80
100
120
2019 2020 2021 2022 2023 2024 2025 2026 2027 2028 2029 2030
AECs
(Mill
ions
)RT - Multiplier 7-year NPV Gas = 0
NG CHP - Phaseout
Liquid biofuels -Ramp to Cap
Fuel cell
Other
AEC Demand -Baseline
Electric
NG
Electric Demand 57.5% 142.9% 195.9%Natural Gas Demand 34.0% 82.0% 128.2%
Total APS Supply as a percent of:

OCTOBER 30, 2020
Alternative Energy Portfolio Standard Review 63
Figure 25: Supply Demand Balance with CHP Phased Out by 2030 and Renewable Thermal Supply based on Setting NPV = 0 for Oil Customers, showing impact of using
Multiplier of 10
0
5
10
15
20
25
2019 2020 2021 2022 2023 2024 2025 2026 2027 2028 2029 2030
AECs
(Mill
ions
)RT - MultiplierCapped at 10 (Oil7-year NPV = 0adoptionscenario)NG CHP - Phaseout
Liquid biofuels -Ramp to Cap
Fuel cell
Other
Electric Demand 14.1% 28.5% 36.0%Natural Gas Demand 8.4% 16.3% 23.6%
Total APS Supply as a percent of:

64 Alternative Energy Portfolio Standard Review
Figure 26: Supply Demand Balance with CHP Phased Out by 2030 and Renewable Thermal Supply based on Setting NPV = 0 for Gas Customers, showing impact of using
Multiplier of 10
V. EMISSIONS SAVINGS BY SCENARIO
A. Emissions Savings by Technology Renewable thermal emissions by scenario are shown below in Figure 27. Note that while there were 7 supply scenarios due to changes in AEC multipliers, there are only 3 scenarios of renewable thermal emissions the changes in AEC multiplier do not impact emissions.
0
5
10
15
20
25
30
35
40
45
50
2019 2020 2021 2022 2023 2024 2025 2026 2027 2028 2029 2030
AECs
(Mill
ions
)RT - MultiplierCapped at 10 (gas7-yr NPV adoptionscenario)NG CHP - Phaseout
Liquid biofuels -Ramp to Cap
Fuel cell
Other
AEC Demand -Baseline
Electric
Electric Demand 26.8% 61.7% 82.5%Natural Gas Demand 15.8% 35.4% 54.0%
Total APS Supply as a percent of:

OCTOBER 30, 2020
Alternative Energy Portfolio Standard Review 65
Figure 27: Renewable Thermal Emissions Reductions by Scenario
Figure 28, below, shows the emissions by CHP scenario. CHP creates slightly more emissions than the alternatives, so the emissions are improved with less CHP.
Figure 28: CHP Emissions Reductions by Supply Scenario
0500
10001500200025003000350040004500
2019 2020 2021 2022 2023 2024 2025 2026 2027 2028 2029 2030
Millions of MT CO2 reduction
RT - Baseline RT - AEC Price 7-yr Oil NPV = $0
RT - AEC Price Natural Gas 7-yr NPV = $0
-50-45-40-35-30-25-20-15-10
-50
2019 2020 2021 2022 2023 2024 2025 2026 2027 2028 2029 2030
Millions of MT CO2 reductions
NG CHP - Base NG CHP - Freeze NG CHP - Phase out

66 Alternative Energy Portfolio Standard Review
Figure 29 shows emissions reductions for the two biofuels supply scenarios.
Figure 29: Liquid Biofuels Emissions Reductions by Scenario
0102030405060708090
100
2019 2020 2021 2022 2023 2024 2025 2026 2027 2028 2029 2030
Millions of MT CO2
Liquid biofuels - Ramp to Cap Liquid biofuels - Reduce Cap

OCTOBER 30, 2020
Alternative Energy Portfolio Standard Review 67
B. CHP Cap
Figure 30: Greenhouse Gas Emission savings in scenario of Balanced Supply and Demand with CHP capped at 2021 Level and Renewable Thermal Baseline Supply
-100
0
100
200
300
400
500
600
700
800
900
2019 2020 2021 2022 2023 2024 2025 2026 2027 2028 2029 2030
GHG Savings to 2030
RT - Baseline
Liquid biofuels -Ramp to Cap
NG CHP - Freeze
MT CO2
(Thousands)

68 Alternative Energy Portfolio Standard Review
Figure 31: Greenhouse Gas Emission savings in scenario of Balanced Supply and Demand with CHP capped at 2021 Level and Renewable Thermal Supply based on
Setting NPV = 0 for Oil Customers
-500
0
500
1000
1500
2000
2500
2019 2020 2021 2022 2023 2024 2025 2026 2027 2028 2029 2030
GHG Savings to 2030
RT - AEC Price 7-yr Oil NPV = $0
Liquid biofuels -Ramp to Cap
NG CHP - Freeze
MT CO2
(Thousands)

OCTOBER 30, 2020
Alternative Energy Portfolio Standard Review 69
Figure 32: Greenhouse Gas Emission savings in scenario of Balanced Supply and Demand with CHP capped at 2021 Level and Renewable Thermal Supply based on
Setting NPV = 0 for Gas Customers
-500
0
500
1000
1500
2000
2500
3000
3500
4000
4500
2019 2020 2021 2022 2023 2024 2025 2026 2027 2028 2029 2030
GHG Savings to 2030
RT - AEC PriceNatural Gas 7-yrNPV = $0
Liquid biofuels -Ramp to Cap
NG CHP - Freeze
MT CO2
(Thousands)

70 Alternative Energy Portfolio Standard Review
C. CHP Phase Out
Figure 33: Greenhouse Gas Emission savings in scenario of Balanced Supply and Demand with CHP Phased Out by 2030 and Renewable Thermal Baseline Supply
-100
0
100
200
300
400
500
600
700
800
900
2019 2020 2021 2022 2023 2024 2025 2026 2027 2028 2029 2030
GHG Savings to 2030
RT - Baseline
Liquid biofuels -Ramp to Cap
NG CHP - Phaseout
MT CO2
(Thousands)

OCTOBER 30, 2020
Alternative Energy Portfolio Standard Review 71
Figure 34: Greenhouse Gas Emission savings in scenario of Balanced Supply and Demand with CHP Phased Out by 2030 and Renewable Thermal Supply based on
Setting NPV = 0 for Oil Customers (assuming AEC price of $71)
-500
0
500
1000
1500
2000
2500
2019 2020 2021 2022 2023 2024 2025 2026 2027 2028 2029 2030
GHG Savings to 2030
RT - AEC Price 7-yr Oil NPV = $0
Liquid biofuels -Ramp to Cap
NG CHP - Phaseout
MT CO2
(Thousands)

72 Alternative Energy Portfolio Standard Review
Figure 35: Greenhouse Gas Emission savings in scenario of Balanced Supply and Demand with CHP Phased Out by 2030 and Renewable Thermal Supply based on
Setting NPV = 0 for Gas Customers
-500
0
500
1000
1500
2000
2500
3000
3500
4000
4500
2019 2020 2021 2022 2023 2024 2025 2026 2027 2028 2029 2030
GHG Savings to 2030
RT - AEC PriceNatural Gas 7-yrNPV = $0
Liquid biofuels -Ramp to Cap
NG CHP - Phaseout
MT CO2
(Thousands)

OCTOBER 30, 2020
Alternative Energy Portfolio Standard Review 73
A. Liquid Biofuels Reduce Cap
Figure 36: Greenhouse Gas Emission savings in scenario of Balanced Supply and Demand with a Reduced Liquid Biofuels Cap and with CHP and Renewable Thermal
Baseline Supply
-100
0
100
200
300
400
500
600
700
800
2019 2020 2021 2022 2023 2024 2025 2026 2027 2028 2029 2030
GHG Savings to 2030
RT - Baseline
Liquid biofuels -Reduce Cap
NG CHP - Base
MT CO2
(Thousands)

74 Alternative Energy Portfolio Standard Review
Figure 37Greenhouse Gas Emission savings in scenario of Balanced Supply and Demand with a Reduced Liquid Biofuels Cap and with CHP and Renewable Thermal
Supply based on Setting NPV = 0 for Oil Customers (assuming AEC price of $71)
-500
0
500
1000
1500
2000
2500
2019 2020 2021 2022 2023 2024 2025 2026 2027 2028 2029 2030
GHG Savings to 2030
RT - AEC Price 7-yr Oil NPV = $0
Liquid biofuels -Reduce Cap
NG CHP - Base
MT CO2
(Thousands)

OCTOBER 30, 2020
Alternative Energy Portfolio Standard Review 75
Figure 38: Greenhouse Gas Emission savings in scenario of Balanced Supply and Demand with a Reduced Liquid Biofuels Cap and with CHP and Renewable Thermal
Supply based on Setting NPV = 0 for Gas Customers
-500
0
500
1000
1500
2000
2500
3000
3500
4000
4500
2019 2020 2021 2022 2023 2024 2025 2026 2027 2028 2029 2030
GHG Savings to 2030
RT - AEC PriceNatural Gas 7-yrNPV = $0
Liquid biofuels -Reduce Cap
NG CHP - Base
MT CO2
(Thousands)