an alternative portfolio theory - keyquant
TRANSCRIPT

An Alternative Portfolio Theory
Robert Baguenault de Viéville | Raphaël Gelrubin | Edouard Lindet | Charles Chevalier


An Alternative
Portfolio Theory

An Alternative Portfolio Theory
4 |
Disclaimer
This document, communicated by KeyQuant SAS (“KeyQuant”), is confidential and may not be recopied, reproduced or otherwise redistributed. It has been issued for informational purposes only and nothing in this document should be interpreted as constituting legal, regulatory, tax, financial or investment advice.
The information contained herein is addressed to and directed only at professional investors and should not be relied on by any other person. It does not constitute a report, an offer or a solicitation by anyone in the United States or in any other jurisdiction in which such a report, offer or solicitation is not authorized or to, or for the account or benefit of, any US person as defined in relevant US securities laws, or to any person to whom such report, offer or solicitation is unlawful.
The information herein may be approximate. It may contain errors and/or omissions and due to rounding, numbers presented throughout may not precisely reflect performance results. It may be based on third party sources of information which are assumed to be correct and reliable but not independently verified.
This document may also contain forward-looking statements, including, but not limited to, statements that are predictions of or indicate future events, trends, plans or objectives. Undue reliance should not be placed on such statements because, by their nature, they are subject to known and unknown risks and uncertainties.
KeyQuant does not guarantee, and accept no legal liability whatsoever arising from or connected to, the accuracy, reliability, currency or completeness of any information provided herein which may be amended at any time. KeyQuant is under no obligation to provide you with an updated version of such information.
PAST RESULTS ARE NOT NECESSARILY INDICATIVE OF FUTURE RESULTS

An Alternative Portfolio Theory
| 5
Tabel of Contents
Part I: Serenity Ratio: Don’t get Trapped in a Pitfall!
I – The Flaws of Classic Risk Measure . . . . . . . . . . . . . . . . . . . . . . . . . . . . . . . . . . . . . . . 9
II – Ulcer Index (UI): Consider Drawdowns . . . . . . . . . . . . . . . . . . . . . . . . . . . . . . . . . . . 11
III – Conditional Drawdown at Risk (CDaR). . . . . . . . . . . . . . . . . . . . . . . . . . . . . . . . . . . . 12
IV – Pitfall Indicator (PI): Measuring the Surprises . . . . . . . . . . . . . . . . . . . . . . . . . . . . . . 13
V – The Serenity Rartio (SR). . . . . . . . . . . . . . . . . . . . . . . . . . . . . . . . . . . . . . . . . . . . . . . 16
VI – An Alternative Portfolio Theory . . . . . . . . . . . . . . . . . . . . . . . . . . . . . . . . . . . . . . . . . 18


An Alternative Portfolio Theory
| 7
Part I : Serenity Ratio:
Don’t get Trapped in a Pitfall !


An Alternative Portfolio Theory
| 9
Don’t get Trapped in a Pitfall !
Modern Portfolio Theory and its Discontents
In this note, we argue that classic risk measures (such as volatility) do not consider the path followed by returns and leave out the risk of potential large drawdowns. We also show that
using path dependent measures such as the Ulcer Index or Conditional Drawdown at Risk adds valuable information to any investment decision. We propose a new measure of the global risk: The Serenity Ratio which reveals both the average and extreme risk carried by an investment. We conclude that this indicator can be used in a modified version of the Modern Portfolio Theory [Markowitz (1952)] and help investors choose the best strategies for their portfolio.
The Flaws of Classic Risk Measures
Annualized standard deviation or volatility (Sharpe Ratio being its return adjusted version) is one of the most widely used measures of the riskiness of an investment. However, this measure presents some drawbacks of which investors may not be aware. Both upside and downside changes in prices are used to calculate the volatility of an investment.
Many investors therefore use a modified version of standard deviation that only penalizes the downside risk: Downside Volatility (Sortino Ratio [Rom (1983)] being its return adjusted version). This downside risk measure can be misleading1 when it comes to fat tail distributions.
The Omega Ratio [Shadwick and Keating (2002b)] was developed to overcome these non-normal limitations by taking into account all moments of the distribution function.
However, all these measures do not consider autocorrelation of returns (i.e., today’s return is dependent on yesterday’s return).
Consider the three following strategies2, 3:
• An investment in the MSCI World Index (“Long” Strategy)
• An investment in an asset where we rearranged the returns of the MSCI World Index so that the worst months occur first, ahead of the best months (“Sorted” Strategy)
• An investment in an asset where we rearranged the returns of the MSCI World Index in order to minimize drawdowns (“Flattened” Strategy)
1 The measure does not focus on tail loss and therefore may significantly understate the range of potential losses.2 The ideas presented in this paper are adapted from Martin (1987). 3 In this article, we always subtract the risk free rate (LIBOR) from our noted strategies. Thus, not achieving
this minimum return represents a loss or a drawdown.

An Alternative Portfolio Theory
10 |
Figure 1 (below) displays the net asset value of these three investment strategies:
Figure 1: NAVs of the “Long”, “Sorted” and “Flattened” Strategies from 2000 to 2016 (Source: Bloomberg)
These three strategies offer identical annualized return, volatility, downside-volatility, Omega ratio, and even the same VaR and CVaR figures. Thus, without seeing the NAV chart and only viewing the classic risk-return metrics, an investor would be indifferent: all three strategies would look equally good. An investor would be at risk of choosing the Sorted Strategy which exhibits much bigger drawdowns than the Flattened or Long Strategy (hidden risk).
The Sharpe Ratio, although a good measure of adjusted performance, clearly should not be the sole investment criterion. To obtain a more accurate and actionable view of the true global risk of an investment, investors need to consider the risk of long and/or acute drawdowns.
Maximum drawdown is a measure of the maximum decline of the NAV from its historical peak (Calmar Ratio being its return-adjusted version). Although it is a path dependent metric, maximum drawdown is not representative of the global risk of an investment because it only focuses on the worst observed drawdown and not on the length and recurrence of each drawdown.
The section that follows presents a risk measure developed by Martin (1987) to take drawdown risk into consideration.
Long Strategy Sorted Strategy Flattened Strategy
0
20
40
60
80
100
120
140
160
2000 2005 2010 2015
Figure 1

An Alternative Portfolio Theory
| 11
Ulcer Index (UI): Consider Drawdowns
The Ulcer Index (“UI,” or “Ulcer”) measures both the depth and duration of drawdowns and is one of the rare risk indicators that is path-dependent. Its return-adjusted version is a better indicator than the Sharpe Ratio for investors who are more concerned by drawdowns (vs. volatility). The name of the index comes from the supposition that drawdowns cause stress and ulcers to investors.
Ulcer is calculated by taking the quadratic mean4 of the drawdowns5:
,
where is the drawdown at date t.
The reader can note a similarity with the definition of standard deviation (where the deviation of returns is replaced by the drawdowns):
,
Therefore, Ulcer only takes into account the “downside” risk of a strategy (drawdown equals 0 when the price is at its maximum value).
Flattened Strategy Long Strategy Sorted Strategy
Annualized Return 1.75% 1.75% 1.75%
Annualized Volatility 15.5% 15.5% 15.5%
Ulcer Index 3.7% 24.4% 86.4%
Table 1: Annualized returns, volatility and UI of the three strategies (Source: Bloomberg)
Indeed, for the same returns and volatilities, the Ulcer of the Flattened Strategy is nearly seven times smaller than the Ulcer of the Long Strategy and twenty-three times smaller than the Ulcer of the Sorted Strategy. Were an investor to consider Ulcer as their principal risk measure, they would have a persuasive reason for choosing the Flattened Strategy.
4 This measure is a convex risk metric as shown in Chekhlov et al. (2005) and annex 1.5 A simplified Ulcer Index (sometimes called the Pain Index) can be defined by taking the arithmetic mean.
Table 1

An Alternative Portfolio Theory
12 |
Martin (1987) also defines the Ulcer Performance Index (UPI) which is the return divided by Ulcer. UPI is the Ulcer counterpart of the Sharpe Ratio.
Just like volatility, Ulcer represents an average risk and does not take into consideration tail risk. To create a global measure of risk, the next part of this paper will study the tail events of drawdowns.
To summarize our argument thus far:
Average Risk = Ulcer Index
Conditional Drawdown at Risk (CDaR)
As shown in the previous section, Martin was able to define a risk measure (UPI) somewhat comparable to a Sharpe Ratio by changing the data of reference in the calculation from returns to drawdowns. In a similar fashion, Chekhlov et al. (2005)6 define DaR and CDaR for Drawdown at Risk and Conditional Drawdown at Risk, comparable to the VaR and CVaR definition.
We define DaR and CDaR as the VaR and CVaR of the Drawdowns distribution (and not the return distribution). Therefore, DaR(α) represents the 1-α% biggest drawdowns and CDaR(α) is the mean of the drawdowns strictly under the DaR(α).
The DaR(95%) and CDaR(95%) of the S&P 500 can be observed in Figure 2:
Figure 2: Cumulative Distribution of Drawdowns, DaR and CDaR definitions of the SP500 from 1990 to 2016 (Source: Bloomberg)
100%
80%
60%
40%
20%
0%-10%-20%-30%-40%-50%-60%
CDaR
DaR
Figure 2
6 Chekhlov et al. (2005) show that DaR and CDaR measures are convex and therefore offer the possibility of convex optimization to create an efficient frontier.

An Alternative Portfolio Theory
| 13
7 This oxymoron has been made on purpose.
Figure 3 shows the visual interpretation of the CDaR(95%) on the underwater curve of the S&P 500.
Figure 3: CDaR(95%) for the SP500 from Jan. 1990 to Mar. 2016 (Source: Bloomberg)
The CDaR corresponds to the average of the drawdowns falling under the black line which is the DaR(95%) = 43.3%. In this example, CDaR(95%) = 48.2%.
We assume that an investor’s level of pain varies on each drawdown. The sharper and/or the longer the drawdown, the higher the discomfort. The most important factor is what investors are ready to stomach based on the risk they believe they are taking. When investing in a strategy with 1% vs. 10% volatility, one does not expect the same drawdown. For this reason, we measure CDaR in multiples of volatility to create a new risk metric: The Pitfall Indicator.
Pitfall Indicator (PI): Measuring the Surprises
In the following paragraph, we create an indicator to measure the bad surprises an investor can expect7. An investor is sort of “trapped” inside a drawdown, and can be surprised by an abnormal depth, hence the name: Pitfall Indicator (“PI” or “Pitfall”).
The Pitfall Indicator is defined as:
0%
-10%
-20%
-30%
-40%
-50%
-60%
1990 1995 2000 2005 2010 2015
DaR(95%)
Figure 3

An Alternative Portfolio Theory
14 |
The Pitfall represents the average loss of the biggest drawdowns expressed in units of volatility. Thus, the bigger the number, the riskier is the strategy. The Pitfall also addresses one of the main flaws of Ulcer explained below. Let us consider the following two stereotyped strategies:
Figure 4: Net Asset Value of 2 stereotyped strategies (log-scale)
Steady Strategy Unpredictable Strategy
Annualized Return 7.5% 7.5%
Volatility 6.0% 6.0%
Ulcer Index 7.0% 7.0%
CDaR(95%) 10% 40%
Pitfall Indicator 1.64 6.31
Table 2: Statistics of the 2 stereotyped strategies
Both strategies offer the same returns, volatility, and Ulcer, but it is clear that they do not offer the same drawdown profiles. The Steady Strategy exhibits frequent but small drawdowns resulting in a Pitfall of 1.64 (times the volatility of the strategy). The Steady Strategy presents a low risk of surprises to an investor.
Table 2
Steady Strategy Unpredictable Strategy
-40%
-10%
150
75
100
125
175
Figure 4

An Alternative Portfolio Theory
| 15
On the other hand, the Unpredictable Strategy exhibits infrequent but deep drawdowns resulting in a Pitfall of 6.31 (times its volatility). The Unpredictable Strategy causes a big problem as no rational investor would expect a drawdown over 40% at this level of volatility (6%). This unexpected sharp drawdown will most likely result in the investor cutting his losses and not waiting for a potential recovery.
The Pitfall indicator reflects the number of volatility an investor risks losing by being trapped in a drawdown and should not be ignored in the context of portfolio construction. Considering the following two assets:
• A strategy with a volatility of 5% and a CDaR of 10% (Pitfall=2)
• A strategy with a volatility of 20% and a CDaR of 20% (Pitfall=1)
An investor using the classic risk parity (1/Vol) methodology would allocate 4 times more money to the first strategy. In doing so, the investor greatly increases the risk of a blow-up since the strategy is more likely to reach a deeper drawdown vis-à-vis the volatility (as reflected in the value of the Pitfall).
A strategy can exhibit low average risk (that is, low Ulcer Index or volatility), yet suffer rare extreme drawdowns. It makes sense to penalize such strategies as their average risk does not represent the actual risk. Therefore, we argue that:
Extreme Risk Penalty = Pitfall Indicator = CDaR
Vol

An Alternative Portfolio Theory
16 |
The Serenity Ratio (SR)
In this section, we create the Serenity Ratio, a Sharpe Ratio equivalent using a penalized risk measure instead of volatility.
First, we use the Pitfall to penalize our previously defined measure of average risk:
Penalized Risk = Average Risk x Extreme Risk Penalty
Penalized Risk = Ulcer x Pitfall
This measure of Penalized Risk represents the average risk of a strategy (Ulcer) adjusted by a measure of extreme risk (Pitfall). Thus, the new measure of risk considers all three-metrics defined previously in this paper: Volatility, Ulcer and CDaR.
By definition:
• The lower the Ulcer the lower the risk of drawdowns
• The lower the Pitfall the lower the risk of surprises
Therefore, just like volatility, the lower the Penalized Risk, the less risky the strategy.
Serenity Ratio (“SR,” or “Serenity”), is defined as Return divided by Penalized Risk:
The name is derived from the fact that the higher the value of Serenity, the more serene an investor will feel in regards to his investment decision. The Serenity is comparable to the Sharpe Ratio, the higher its value the better is the strategy.
Illustration with Hedge Fund Strategies
In the following, we use: The Hedge Fund Research Indices8 (HFRI) as proxies for various hedge funds strategies; the S&P 500 and the Barclays Capital Aggregate Bond Index to model investments in equity and bonds9 over the 1990 to 2016 time period. The purpose of this section is to show the added-value of the alternative risk measures in the context of a portfolio construction process using various hedge-fund strategies.
8 List of indexes used is provided in annex 2.9 All indexes are taken total return (dividend reinvested).
Serenity Ratio = Return
Penalized Risk

An Alternative Portfolio Theory
| 17
The Sharpe Ratio and Ulcer Performance Index in Table 3 exhibit the weakness - indeed, the danger — of not properly acknowledging the “extreme” risk of an investment.
Relative Value strategies present the best risk adjusted metrics through Sharpe Ratio and Ulcer Performance Index. However, for the Pitfall Indicator they fall to 7th place with extreme drawdowns reaching 3.17 times their level of volatility. This could prove harmful to an investor in the context of a classic risk parity allocation as the investor would have allocated more capital towards those strategies looking solely at volatility. These strategies display steady returns but their actual drawdowns can be sharper than expected. Investors choosing to allocate to Relative Value strategies run the risk of having their long-term steady performance gains wiped out by a rare and deep drawdown.
While strategies such as Global Macro and Systematic Diversifi ed seem less appealing when considering their Sharpe Ratio (5th and 7th place respectively), they are amongst the top three strategies in terms of Ulcer Performance Index. They also outclass all other strategies when using the Pitfall Indicator. While providing less steady returns, Systematic Diversifi ed and Global Marco Strategies are less likely to incur heavy drawdowns compared to their level of volatility. These strategies have less hidden risk.
Table 3Normal Distri-bution
S&P 500
Barclays US Bond
Index
Equity Hedge
Equity Market Neutral
Event Driven
FI Convert.
Arb.
Global Macro
Multi-Strategy
Equity Quant.
Dir.
Relative Value
Syst.Diversi-
fi ed
Sparkline(Log-Scale)
Return 5.9% 5.9% 2.7% 7.9% 3.0% 7.0% 4.6% 7.0% 4.4% 7.4% 5.9% 6.0%
Volatility 14.4% 14.4% 3.6% 8.7% 2.9% 6.6% 6.3% 7.1% 4.2% 12.1% 4.2% 7.3%
Sharpe 0.41 0.41 0.75 0.91 1.02 1.07 0.73 0.98 1.06 0.61 1.41 0.82
Rank 11 8 6 4 2 9 5 3 10 1 7
Ulcer Index 18% 20.2% 2.6% 8.1% 3.7% 6.0% 6.1% 4.4% 5.1% 12.5% 3.4% 4.2%
Ulcer Perf Ind. 0.33 0.29 1.05 0.98 0.80 1.18 0.75 1.59 0.87 0.59 1.72 1.41
Rank 11 5 6 8 4 9 2 7 10 1 3
CDaR(95%) -37% -48.2% -7.1% -24.2% -10.2% -20.5% -22.2% -10.3% -18.0% -31.7% -13.3% -10.5%
Pitfall Ind. 2.55 3.34 1.95 2.78 3.51 3.12 3.53 1.45 4.30 2.62 3.17 1.44
Rank 8 3 5 9 6 10 2 11 4 7 1
Penalized Risk 45.0% 67.7% 5.1% 22.5% 12.9% 18.6% 21.6% 6.3% 22.0% 32.6% 10.9% 6.1%
Serenity 0.13 0.09 0.54 0.35 0.23 0.38 0.21 1.10 0.20 0.23 0.54 0.98
Rank 11 4 6 7 5 9 1 10 8 3 2
11 Worst 10 9 8 7 6 5 4 3 2 1 Best
Table 3: Advanced Risk Metrics for different Hedge Fund Strategies for the 1990-2016 period (Source: Bloomberg)

An Alternative Portfolio Theory
18 |
Comparing classic and alternative risk metrics on hedge-fund strategies exacerbates the necessity of managing both average and extreme risk during the allocation process. Using only the Sharpe Ratio (hence considering volatility as the only measure of risk) can lead to allocating more capital towards strategies with a higher probability of blow-up. This risk can be mitigated through the consideration of both the Ulcer Index and the Pitfall Indicator through the Serenity Ratio.
An Alternative Portfolio Theory
The Modern Portfolio Theory (MPT) developed by Markowitz (1952) uses volatility as the sole risk metric. The allocation process proposed by Markowitz is driven by attaining the maximum Sharpe Ratio on the Portfolio.
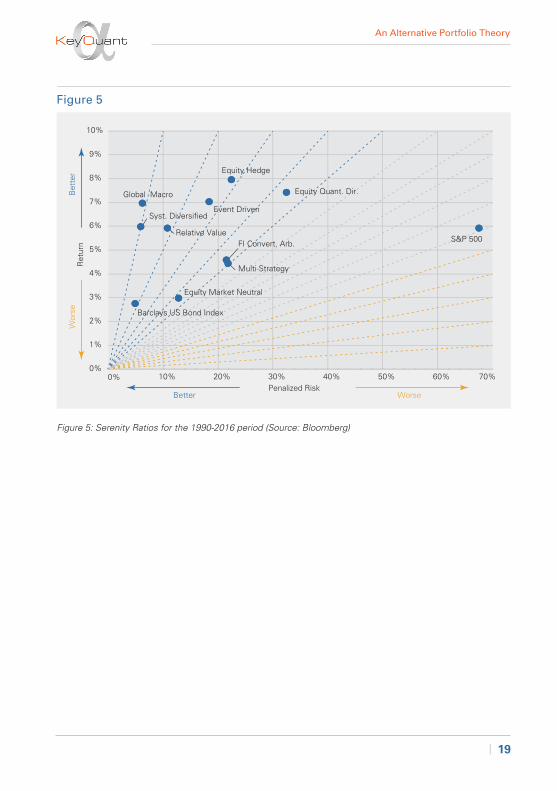
We propose to adapt MPT by maximizing the Serenity Ratio. In the classic Risk-Return space, we replace Volatility with our Penalized Risk Metric.
Figure 5 displays the values of Returns and Penalized Risk for every strategy. The lines drawn on the graph represent indifference lines for the investor as the value of the Serenity Ratio stays constant over each line. A rational investor always prefers strategies in the upper left quadrant to strategies in the bottom right quadrant, as they present a higher measure of Serenity. Investors would therefore be better off investing in Systematic Diversified or Global Macro hedge funds if they wish to maximize their performance relative the risk of drawdowns looking at Ulcer and Pitfall.
The proximity between Sharpe and Serenity will be further developed in our second white paper by introducing the definition of an efficient frontier analogous to the theory developed by Markowitz (1952) and previously studied in Harris and Mazibas (2011), Allen et al. (2015) and Goldberg and Mahmoud (2015).
An Alternative Portfolio Theory
| 19
Syst. Diversified
0%
1%
2%
3%
4%
5%
6%
7%
8%
9%
10%
0% 10% 20% 30% 40% 50% 60% 70%
Ret
urn
Penalized Risk
Bet
ter
Better Worse
Wor
se
S&P 500
Barclays US Bond Index
Equity Hedge
Equity Market Neutral
Event Driven
FI Convert. Arb.
Global Macro
Multi-Strategy
Equity Quant. Dir.
Relative Value
Figure 5
Figure 5: Serenity Ratios for the 1990-2016 period (Source: Bloomberg)
An Alternative Portfolio Theory
20 |
Conclusion
Investors should be aware of the incomplete nature of using classic risk metrics such as volatility, Sharpe Ratio, VaR, and CVaR as inputs into investment decisions. All these measures share the same flaw: Considering time-independence of returns (and leaving out any potential auto-correlation). Thus, we believe the use of Ulcer and Pitfall in addition to these widely used risk measures is advised if an investor wishes to have a better understanding of both known and hidden risks of a strategy. Indeed, when comparing many hedge fund strategies using only classic risk measures, we find that some strategies seem very appealing when investors only use volatility as a risk measure, therefore maximizing the Sharpe Ratio. However, the perception of global risk of these strategies is better depicted by including the risk of drawdowns, through Ulcer and especially, through Pitfall. Replacing the classic Markowitz representation (Mean-Variance) with both the Ulcer and the Pitfall (Mean-Penalized Risk) introduces a new and interesting manner of sorting strategies. The use of these alternative risk metrics reduces the risk of an investment blow-up by preventing misallocation to riskier strategies. This Alternative Portfolio Theory will be further developed in a second white paper, taking into account the correlation of drawdowns and defining an alternative efficient frontier.

An Alternative Portfolio Theory
| 21
References and
Appendices

An Alternative Portfolio Theory
22 |
References – Part 1
[1] Allen D., McAleer, M, Powell, R., and Singh A. (2015). Down-side Risk Metrics as Portfolio Diversification Strategies across the GFC. Tinbergen Institute Discussion Paper.
[2] Artzner, P., Delbaen, F., Eber, J., and Heath, D. (1999). Coherent Measures of Risk. Mathematical Finance, 9, 203-228.
[3] Chekhlov A., Uryasev S. and Zabarankin M. (2003). Portfolio Optimisation with Drawdown Constraints, Working Paper.
[4] Chekhlov A., Uryasev S. and Zabarankin M. (2005). Drawdown measure in portfolio optimization. International Journal of Theoretical and Applied Finance, 8(1), 13 58.
[5] Goldberg L. and Mahmoud O. (2015). Drawdown: From Practice to Theory and Back Again, Working Paper.
[6] Harris R., Mazibas M. (2013). Dynamic hedge fund portfolio construction: A semi-parametric approach. Journal of Banking & Finance 37 (2013) 139–149.
[7] Keating C. and Shadwick W.F. (2002b). A Universal Performance Measure. The Finance Development Center Limited.
[8] Krokhmal P., Uryasev S. and Zrazhevsky G. (2005). Numerical Comparison of CVaR and CDaR Approaches: Application to Hedge Funds. S.W. Wallace and W.T. Ziembra SIAM/MPS Series on Optimization, 609-631.
[9] Markowitz H. M. (1952). Portfolio selection. Journal of Finance 7(1) 77–91.
[10] Martin P. G. (1987). Ulcer Index, An Alternative Approach to the Measurement of Investment Risk & Risk-Adjusted Performance, http://www.tangotools.com/ui/ui.htm
[11] Martin P. G. and McCann B. (1989). The Investor’s Guide to Fidelity Funds: Winning Strategies for Mutual Fund Investors, http://www.tangotools.com/ui/fkbook.pdf

An Alternative Portfolio Theory
| 23
Annex 1 – Coherent Risk Measure
A coherent risk measure ρ as defined by Artzner & al. (1999) must respect the following properties:
(1) Normalizedρ(0)=0
The risk of holding no assets is zero.
(2) Monotonicity
If X1 and X2 are two portfolios and X1 ≤ X2 almost surely, then ρ(X1) ≥ ρ(X2).
The risk of a better portfolio is always lower.
(3) Positive Homogeneity
If λ > 0 then ρ(λX) = λρ(X)
Which means that if you double your portfolio you double your risk.
(4) Insensitivity to a constant shift
If a is a constant, ρ(X + a) = ρ(X)
(5) Sub-additivity
If X1 and X2 are two portfolios
ρ(X1 + X2) < ρ(X1) + ρ(X2)
The risk of two portfolios together cannot be worse than adding the risks of each portfolio. This is the concept of diversification.
(6) Convexity
The notion of sub-additivity and positive homogeneity can be replaced by the notion of convexity:
Ulcer Index
(1), (2), (3), (4) are a direct consequence of the definition.
(6) Convexity: even though the Ulcer Index is defined as a norm in the mathematical sense and therefore is convex we will show it here.
for λ [0,1] ρ(λX1 + (1 – λ) X2) < λρ(X1) + (1 – λ)ρ(X2)
Appendices – Part 1

An Alternative Portfolio Theory
24 |
Using (3), we only have to show that the Euclidean norm is convex. Therefore, we have to prove that its unit ball is convex.
We have:
Therefore which means is convex and the norm is also convex.
Thus the Ulcer Index is a convex risk measure.
Annex 2 – HFRI Indices
HFRI Names Short Name Strategies Included
HFRI Macro: Systematic Diversified Systematic Diversified Managed Futures, Trend Index (HFRIMTI Index) Following
HFRI EH: Equity Market Equity Market Neutral Quantitaztive Equity Market Neutral Index (HFRIEMNI Index) Neutral Strategies
HFRI EH: Quantitative Directional Equity Quantitative Factor-Based and Statistical (HFRIENHI Index) Directional Arbitrage Trading Strategies
HFRI RV: Fixed Income-Convertible Fixed Income- Relative Value Strategies limited Arbitrage Index (HFRICAI Index) Convertible Arbitrage to Fixed Income and Convertible Instruments
HFRI RV: Multi-Strategy Index Multi-Strategy Relative Value Strategies on (HFRIFI Index) Fixed Income, derivatives, Equity, Real Estate and/or MLP Assets
HFRI Event-Driven (Total) Index Event-Driven Event Driven Strategies (HFRIEDI Index)
HFRI Equity Hedge (Total) Index Equity Hedge Long-Short Equity Strategies (HFRIEHI Index)
HFRI Macro (Total) Index Global Macro Global Macro Strategies (HFRIMI Index)
HFRI Relative Value (Total) Index Relative Value Relative Value Strategies (HFRIRVA Index)
S&P 500 (SPXT Index) S&P 500 S&P 500
Barclays US Bond Index Barclays US Bond Index US Bonds (LBUSTRUU Index)

An Alternative Portfolio Theory
| 25
Syst. Diversi-
fied
Equity Market Neutral
Equity Quant.
Dir.
Convert. Arb.
Multi-Strategy
Event Driven
Equity Hedge
Global Macro
Relative Value
S&P 500
Barclays US Bond
Index
AR(1) 3.5% 7.0% 19.6%* 57.2%* 50.4%* 37.6%* 22.0%* 14.8%* 43.8%* 5.3% 12.4%
Table 4: Lag 1 Autocorrelation (* represents significance at the 5% confidence level)
Annex 3 – Autocorrelation of Hedge Fund Indexes
By definition, auto-correlation is defined as the correlation between the values of the same process at different times. We have tested autocorrelation of lag 1 for all the indexes of annex 2, in order to detect indexes where returns are somewhat linked to previous returns. Indeed, one can see that if an asset exhibits high autocorrelation, it means that when negative returns occur, they persist over time and cause drawdowns. Therefore, for strategies with high autocorrelation, it is not abnormal to find deep drawdowns and therefore high pitfall indexes.
The table below presents the AR(1) (Lag 1 Auto regressive coefficient) based on monthly data from 1990 to 2016 and their statistical significance according to the Ljung-Box test (* represent statistical significance at the 5% level).
Table 4

An Alternative Portfolio Theory
26 |
Figure 6: Lag 1 Autocorrelation for the 1990-2016 period (blue color represents significance at the 5% confidence level)
We can see that many hedge-fund strategies exhibit statistically significant autocorrelation through the 1990-2016 period. Fixed-Income convertible arbitrage and Multi-strategy hedge funds even exhibit coefficient above 0.5 showing strong autocorrelation of returns. As a conclusion, it is statistically sound to find that the returns of some strategies tend to persist over time creating period of inevitable drawdowns.
S&P500
BarclaysUS Bond
Index
EquityHedge
EquityMarketNeutral
EventDriven
Fixed IncomeConvert.Arbitrage
GlobalMacro
Multi-Strategy
AR(1) Correlation Coefficient
EquityQuant.
Dir.
RelativeValue
SystematicDiversified
-10%
0%
10%
20%
30%
40%
50%
60%
70%
Figure 6

An Alternative Portfolio Theory
| 27
Notes

Authors
Robert Baguenault de Viéville, Founding Partner & Fund ManagerGraduate of ESTACA and with a Master’s degree from HEC, Robert Baguenault de Viéville began his career as a quantitative researcher with a subsidiary of Man Investments specializing in managing futures. In 2007, he co-founded his first research company focused on systematic trading with Raphaël Gelrubin. In 2009, he co-founded the investment management company KeyQuant.
Raphaël Gelrubin, Founding Partner & Fund ManagerGraduate of the University Paris - Dauphine and ENSAE, Raphaël Gelrubin began his career as a quantitative researcher focused on risk within a subsidiary of Man Investments specializing in managing futures. In 2007, he co-founded his first research company focused on systematic trading with Robert Baguenault de Viéville. In 2009, he co-founded the investment management company KeyQuant.
Edouard Lindet, Research AnalystEdouard joined the investment research team of KeyQuant in January 2016. He previously interned as a quantitative analyst with KPMG in Paris and Alken Asset Management in London. He holds a graduate degree from École Nationale de la Statistique et de l’Administration Économique (“ENSAE”) with a specialization in Market Analysis and Corporate Finance.
Charles Chevalier, Research AnalystCharles joined the investment research team of KeyQuant in October 2016 as a PhD candidate. He previously interned as a quantitative analyst with Amundi and BNP Paribas Investment Partners in Paris. He holds a graduate degree from École Nationale de la Statistique et de l’Analyse de l’Information (“ENSAI”) with a specialization in Financial Engineering and a MSc in Finance from Université Paris Dauphine.

20 rue Quentin-Bauchart
75008 – Paris – France
T. +33 1 84 13 83 00
www.keyquant.com