alternative transportation modes: how to create more ... · alternative transportation modes: how...
TRANSCRIPT
THESIS SPRING, 2012 JOYCE TAM
Alternative Transportation Modes: How to Create More Options in Los Angeles
A Thesis Presented to the Faculty of Architecture and Planning COLUMBIA UNIVERSITY
In Partial Fulfillment
of the Requirements for the Degree
Master of Science in Urban Planning
By
Joyce Tam
May 2012

THESIS DRAFT SPRING, 2012 JOYCE TAM
TABLE OF CONTENTS
ABSTRACT …………………………………………….1
INTRODUCTION ……….……………………………..2
BACKGROUND …………….………………………….5
LITERATURE REVIEW …………….…..…………..11
RESEARCH DESIGN …………….………………….19
RESULTS & ANALYSIS …………….………………26
CONCLUSIONS ………………………………………44
BIBLIOGRAPHY ………………….……….………...47
APPENDIX ……………………………….…………..A1
THESIS SPRING, 2012 JOYCE TAM
1
ABSTRACT
The City of Los Angeles is the 2nd largest city in the United States. With a population of
nearly 4 million that needs to get to and from work every day, the transportation infrastructure
needs to be able to accommodate these commuters. Known for their car dependent lifestyles,
Angelenos also have options for alternative modes of transportation. An infrastructure system
that provides more options for a multi-modal lifestyle can help to create more opportunities for
Angelenos to move around their city. Through mapping and site analysis, this paper will provide
a strategy and recommendations for how to implement a more diversified transportation network
that is more welcoming to bicyclists and pedestrians. Selecting a group of transit stations and
analyzing the spatial characteristics will provide the groundwork for how to begin the process of
creating an integrated bike-transit network. By making more options available, Los Angeles
could accommodate alternative modes of transportation.
Keywords: Los Angeles, bicycle infrastructure and network, alternative modes, bicycle
parking, bike-transit network, multi-modalism
THESIS SPRING, 2012 JOYCE TAM
2
INTRODUCTION
The mode of transportation that city dwellers choose can affect how they interact with the
urban landscape and how the landscape evolves. Cities have grown and evolved to include many
modes of transportation. Beginning with small, walkable cities, they grew through the help of the
horse and buggy, omnibus, streetcar, rail, automobile and many other forms of urban
transportation. The typical modes of transportation found in most cities today can be broadly
categorized into walking, bicycling, public transportation, and the private automobile.
In recent times, the American city has grown, or sprawled, with the aide of the
automobile. Whereas cities once developed along transit routes into an urban core, the way roads
can be built have created entirely new patterns of development. American urban landscapes bear
dramatically different characteristics than cities internationally. An American car dependent
lifestyle has earned a notorious reputation for anyone without a car, and has arguably spelled
disaster for the future of America in terms of sustainability. With climate change concerns taking
place, the sustainability of a car dependent lifestyle has been called into question more than ever.
The limits of a mono-modal society are becoming even more apparent while people and cities
are seeking other options.
Cities are beginning to advocate and encourage alternative modes of transportation like
bicycling and walking; they are also creating the policy on which their goals stand. Bicycle Plans
and Pedestrian Plans are becoming more commonplace, with many documents in the works
today. Not only are government agencies and municipalities creating these plans, local transit
agencies have also begun to integrate bicycle infrastructure into their systems. Adding bike racks
onto buses, including bicycle parking at train stops, or even signage to indicate where bicycles
THESIS SPRING, 2012 JOYCE TAM
3
are allowed on train cars are all ways public transit has evolved to include another mode. As a
single mode, bicycling, walking, or riding transit alone has limitations. In combination, however,
bicycling, walking and transit could have the potential to garner a far greater number of users
than each on its own. There is not only a potential of an alternative mode of transportation, but
also of an intermodal lifestyle – one in which multiple forms of transportation can be used for
single trips. The options for mobility and accessibility can be exponentially increased when
multiple modes are used.
Notorious for its love affair with the automobile, the City of Los Angeles is at a
crossroads in the history of sustainability and transportation. Plagued by congestion, it is
becoming apparent that Angelenos need other options as pedestrians struggle to be seen and
cyclists battle for space on the road. There is a limit to how much space the road can occupy and
keeping the automobile at the top of the transportation hierarchy is not an option. Strategies like
road diets and complete streets have opened the possibility to include alternative modes, but
these solutions need to be coordinated in such a way to make connections across multiple lines.
In investigating this possibility, this paper will look at the City of Los Angeles, LA
Metro, and other advocacy groups in this area to gain an idea of the status and potential for an
intermodal lifestyle in Los Angeles. How can these agencies and organizations best cooperate to
integrate bicycling, walking, and transit that would attract the most users? What would the urban
landscape look like if it were transformed to accommodate a larger mode share for alternative
modes? The potential for intermodal integration could have profound impacts on the quality of
life for individual residents, but also make a difference for the City of Los Angeles. Modes of
transportation have been compartmentalized, but can be seen anew as combinations of modes of
travel. Contributing to issues of sustainability like energy consumption, air pollution, equity of
THESIS SPRING, 2012 JOYCE TAM
4
resource allocation, and economic efficiency, bike-ped-transit integration has the potential to
change the entire mindset and landscape of the American city life for the better.
Los Angeles has the pieces to make an excellent and diverse transportation network. The
next step is to make the connections from bicycling to walking, walking to transit, transit to
bicycling, etc. The hierarchy of transportation modes needs to be about options, and making each
option equally attractive. When the number of combinations you can make with these options are
realized, the system works as a network that can synergistically support itself to mean much
more than the sum of its parts.
THESIS SPRING, 2012 JOYCE TAM
5
BACKGROUND
The City of Los Angeles has the second largest population in the United States. According to
the 2010 US Census (2010 Census), it had a population of 3,792,621. It covers a land area of
468.67 square miles. Ranking high in both categories of land area and residents, a major concern
is transportation infrastructure support. The urban pattern and growth of Los Angeles is unique
historically. Having grown up in conjunction with the era of the automobile, the city’s growth
patterns have reflected these influences.
A monocentric city is exemplary of the earliest cities of the States – New York City and
Chicago for example. These cities began with strong urban cores in which people and
employment was located. Due to transportation limitations, people had to reside close to jobs and
jobs had to be located in clusters to be efficient. Cities exhibit growth patterns that reflect the
limits of how mobile they can be. The walking city is small and centered around the core.
Bicycles and horse carriages allowed cities to expand. Development patterns and urbanization of
North American cities were dictated by patterns of mobility. At first, cities formed around the
limits of where people could go on their feet. As cities grew and alternative modes developed,
however, the expansion of cities around bus and rail routes continued to be contingent upon
access to public transportation via walking. People still depended on walking to get to another
mode.
It was finally public transportation that enabled city residents to live outside the urban core.
Yet these public transit systems were still a limiting factor for growth and development. People
had to locate near and around bus or train routes. Public transportation continued to face
declining ridership amidst the car boom. The urban landscape had also grown to be a lot less
THESIS SPRING, 2012 JOYCE TAM
6
dense as the automobile aided in the ability to travel farther distances in less time. Efforts to gain
ridership began to focus on park and ride programs, in which ridership was encouraged by
providing automobile parking at transit stations (FHWA). Problems that arose with these
facilities included determining what the appropriate capacity was and cost.
The widespread availability and distribution of the automobile enabled dramatically greater
freedom in movement for the American. The construction of streets and freeways created
entirely new patterns of movement that could reach farther than any mode of transportation had
previously provided. This combination of transportation dramatically shifted with the widespread
affordability and availability of the personal automobile. The patterns of urban landscapes
shifted from easy pedestrian access characterized by smaller scale streets that enabled slower
moving traffic to wider roads that enabled faster moving traffic. By maximizing automobile
capacity, many cities neglected to maintain the convenience and safety of the pedestrian
environment (FHWA).
It was under these last set of circumstances that the City of Los Angeles boomed in the
mid 1900s. The growth of Los Angeles followed a different urban form than those East of the
Mississippi – polycentric cities (Giuliano, 1991). Also described as sprawl, Los Angeles can be
characterized by having many sub-centers of activity, dispersed populations, and decentralized
employment patterns (Ewing, 1997). A pioneer in freeway development, Los Angeles built a
landscape that could easily accommodate the automobile. Containing 181 miles of freeway, Los
Angeles is notorious for its traffic jams and long journeys most times of the day. According to
INRIX, a real time traffic data company, Angelenos can expect on average trips to extend up to
71% longer than normal, compared to the nation’s average of 10 percent. But there are also a
THESIS SPRING, 2012 JOYCE TAM
7
significant portion of Angelenos driving. Data from the latest American Community Survey
shows that 77% of Angelenos are driving to work, compared to 67% nationally.
The problem lies along its streets that were designed with the car in mind. Alternative
modes of transportation like the bicycle, walking, and public transit were not priority and the
allocation of space on the roads reflect this concept. Of the 6,500 miles of streets, only 320 of
those miles accommodate bicycles. The local light rail system, LA Metro Rail, operates 73 miles
of track. LA Metro also operates 2,000 bus routes at peak hours. Public transit, however, is often
perceived as slow and unreliable, and users will drive if and when it’s possible (Kenworthy,
1999).
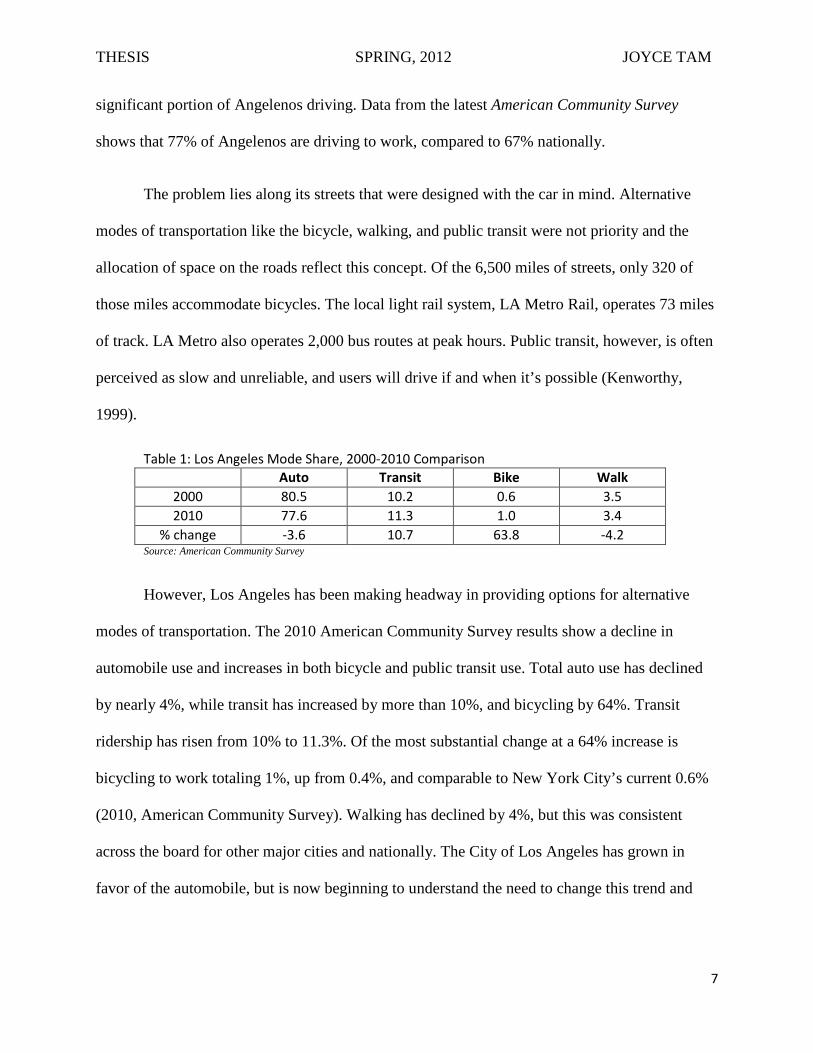
Table 1: Los Angeles Mode Share, 2000-2010 Comparison Auto Transit Bike Walk
2000 80.5 10.2 0.6 3.5 2010 77.6 11.3 1.0 3.4
% change -3.6 10.7 63.8 -4.2 Source: American Community Survey
However, Los Angeles has been making headway in providing options for alternative
modes of transportation. The 2010 American Community Survey results show a decline in
automobile use and increases in both bicycle and public transit use. Total auto use has declined
by nearly 4%, while transit has increased by more than 10%, and bicycling by 64%. Transit
ridership has risen from 10% to 11.3%. Of the most substantial change at a 64% increase is
bicycling to work totaling 1%, up from 0.4%, and comparable to New York City’s current 0.6%
(2010, American Community Survey). Walking has declined by 4%, but this was consistent
across the board for other major cities and nationally. The City of Los Angeles has grown in
favor of the automobile, but is now beginning to understand the need to change this trend and

THESIS SPRING, 2012 JOYCE TAM
8
make room for alternative modes. With a flat terrain and steady increase in the popularity of
alternative modes, it is reasonable that bicycling to work will continue to increase in mode share.
With the recent completion of the City of Los Angeles Bicycle Plan, the City has begun
to engage with the community and other stakeholders in a discussion on implementation. The
Bicycle Plan Implementation Team is a diverse compilation of spearheads from local community
groups, average citizens, public agency representatives, and designers who meet to discuss next
steps and approve street plans. Next on Los Angeles’s agenda is an update on the Transportation
Element of the City’s General Plan. With the Bicycle Plan in place, they now have the tools to
create more comprehensive policies that include alternative modes of transportation.
Los Angeles Metro, the local public transit agency, has been contributing to the
expansion of the bicycle network and infrastructure within the city. They have installed a 14 mile
bicycle path adjacent to the Metro Orange Line, in addition to fitting every Orange line bus with
bicycle racks that accommodate 3 bicycles. Understanding that they have a share of users that
may ride their bikes to get to public transit, LA Metro has installed bicycle racks and bicycle
lockers at many of their stations. Their recent campaign to encourage bringing bikes onto the
Metro has allocated space aboard train cars to hold bicycles. They also initiated studies that
looked into the use of their Orange Line bicycle path, and what the benefits are. Not only are
they providing the infrastructure, they are also evaluating and monitoring the utility of their
facilities.
LA Metro and the City’s public agencies are headed in the right direction. Providing
infrastructure and following up to assess and investigate best practices has the potential to
improve transportation infrastructure and engage with different groups of people in the City. By
THESIS SPRING, 2012 JOYCE TAM
9
improving and adding onto the infrastructure for alternative modes of transportation, having
these options available can begin to weigh heavier in a commuter’s decision. The possibility for
making a trip via automobile or public transit can be equalized and hopefully make alternative
modes more attractive.
The level of mobility, how easily someone can move, within a city is key to the
livelihood of every urban dweller. LADOT’s Transportation Inventory reported 8% of
Angelenos without access to an automobile. This group of residents is entirely dependent on
alternative modes of transportation – they have no choice. By diversifying the modes of
transportation available, residents have many ways to get from point A to point B.
It must also be acknowledged that given the space and area that spans Los Angeles, there
is no one mode that will be the silver bullet to empowering peoples’ selections. Bicycling alone
cannot complete a trip that may be as long as 15 miles. A trip that is intermodal includes more
than one mode of transportation. For example, bicycling to a train station, taking the train, and
walking to a destination is intermodal. There are many combinations that can be used to take a
trip. These individual modes may combine to be synergistic, produce a result that each could not
obtain alone. An intermodal lifestyle is one that easily integrates several different modes as the
form of transportation.
As an urban landscape, the City of Los Angeles has the potential to include alternative
modes as a viable option that is just as appealing as driving. Having just completed its Bicycle
Plan, the City plans to implement 40 new miles of bike lanes per year. The LA Metro has just
completed a first set of studies on its own bike lane adjacent to their Orange Line. These recent
developments are the beginnings of a change in urban infrastructure for Los Angeles. A shift
THESIS SPRING, 2012 JOYCE TAM
10
away from the patterns of freeways and congested cars, the future of Los Angeles is on the brink
of something big that can transform the patterns of movement in the polycentric city. Looking at
the existing infrastructure and proposed ideas will help to guide how to best create a landscape
that would be optimal for providing options to the residents of Los Angeles.
THESIS SPRING, 2012 JOYCE TAM
11
LITERATURE REVIEW
Given recent developments in the economic, environmental, and social issues of the United
States, investigating alternative intermodal forms of transportation can be beneficial (Maartens,
2004). Bike and ride programs, in which public transportation providers emphasize bicycling and
walking as a primary means of access to transit, are a possibility. The Federal Transit
Administration (FTA) cites typical front loading bicycle racks costing $300-$400 each, whereas
a typical surface parking lot costs $3,500-$5,000 per space. Bicycle storage has far fewer space
requirements and can be placed in both urban and suburban settings with capacity concerns that
can be addressed more easily. A Los Angeles Metro Bicycle Study found that bicycle-rail trips
offset carbon dioxide emissions to the equivalent of removing 422 motor vehicles from the road
each year (2010). Returning to bicycling and walking as forms of access to public transportation
gave jurisdictions opportunities to address the needs of a more varied and diverse demographic
including those who may not have access to automobiles, lower income households, or students.
Many lessons can be gained from abroad for how to integrate bicycle and pedestrian facilities
with public transportation (Pucher, 2007). Despite a variety of policies, programs, and initiatives,
Pucher describes the key to promoting bicycle use is a coordinated, multi-faceted approach
amongst all the policies and measures. For example, an extensive network integrated with traffic
signalization and laws, protected from traffic, with connections to public transit and parking and
supported through education and training are all aspects that need to come together. The
separation for cycling and transit facilities is one of the flaws of the American transportation
network. By creating these facilities independent of each other, the network fails to create the
connections that would encourage multi-modal trips. One of the main hurdles Karel Martens

THESIS SPRING, 2012 JOYCE TAM
12
describes is the inattention transit agencies give to public transit access (2007). With primary
goals of service efficiency and frequency, they often neglect how their customer will arrive at the
station or leave from the station. Inherent with the shortcoming of transit access, these agencies
do not view bicycling or walking as a primary form of transit access. As the FHWA states, park
and ride facilities gained attention and funding as bike and ride facilities lowered in priority. As
public transit networks increased saturation within urban areas, they expanded service into
suburban communities. Rather than continuing to invest in urban public transit amenities, they
sought to gain ridership from a different demographic. Agencies determined they needed to turn
their attention to the private automobile as the primary mode by which users would access
transit.
One of the fundamental faults in American public transportation planning is their lack of
attention for modes that feed into their services. Martens suggests this kind of system would
indicate that in order for public transportation to consider bicycles and walking, there must be
explicit bike and ride policies that dictate as such. There needs to be a specifically outlined
policy that would promote bicycling or walking to transit stations (Pucher, 2010). The most
effective types of interventions have been implemented through comprehensive public policies
that outline complementary measures including infrastructure provisioning, bicycle programs,
land use planning and restrictions on car use. Martens draws upon the Dutch experience in which
transportation agencies involved each skirted the responsibility of establishing clear policies. He
advises localities to make “deliberate efforts” to promote intermodality, rather than make
“regular efforts” to improve transportation infrastructure.
Both Pucher and Martens, in their findings, make the case for measures outside of bike lanes
or paths. Though safe and attractive bicycle routes will gain users, the provision of bicycle
THESIS SPRING, 2012 JOYCE TAM
13
storage can be the determining factor for whether or not someone will ride their bicycle. Pucher
advocates for bicyclists rights like traffic signalization or traffic laws and driver and cyclist
education or training are important to the proliferation of bicycling that is often disregarded.
Martens found that the case abroad, despite the availability of safe routes, users remained
reluctant to ride their bicycle until adequate parking facilities were provided. Integrating bicycle
usage is more than just providing lanes or routes, it must include other amenities like parking and
storage.
Policy initiatives that encourage bicycle integration into transit services have been successful
in creating programs that include alternative modes (Martens). A UK study found that the best
way to address the relationship between bicyclists and transit riders is to recognize the
importance of taking into account how bicyclists are affected by transit services (McClintock). In
order to realize the potential of both modes, transit providers need to include bicycles in their
implementation strategies. In the Netherlands, the Bicycle Master Plan includes projects that
stimulate the use of bike-and-ride services. This type of policy addresses the issue of a lack of
“systematic attention” for the combination of these two modes. In promoting bicycle and
pedestrian integration into transportation options, new funding opportunities behind policy
initiatives have given transit agencies new sources for ridership.
Funding sources are beginning to open up for bicycle and pedestrian facilities as they grow
comparatively more limited for new automobile infrastructure. However, the extensive
automobile network continues to require maintenance, and this limits the amount of funding
available for alternative modes. Complete streets initiatives are an opening cities have been using
that increases available funding for bicycle and pedestrian facilities while maintaining the
infrastructure of the whole street. The Transportation Equity Act for the 21st Century is
THESIS SPRING, 2012 JOYCE TAM
14
encouraging planning and development of bicycle and pedestrian access to public transit by
creating a category with its own portion of available funds for transit enhancement activities. The
DOT funding percentages for alternative modes continue to grow (LA Metro). According to the
FHWA, over 50 transit providers use front loading bicycle racks.
Bicycle-transit integration has been a cost-effective means by which transit agencies can gain
ridership and expand their service area. The FTA cites one of the advantages of bike and ride to
include the ability to attract customers from areas of low density that surround higher density
cities where it would be inefficient to expand transit service into. Martens adds that using
bicycles at stations in areas where ridership is low and infrastructure is limited will be difficult.
He suggests simple and flexible solutions that include bikeshare or bike stations located near
transit hubs can be more successful than leases for bike lockers. By providing the additional
option of riding a bicycle to or from a station without the need to return to the bike, the freedom
this option offers makes intermodal transport more attractive.
In looking at the components of a trip: origin to transit to destination, there are some
interesting findings. Martens concludes that the transit to destination portion of a trip tends to be
shorter. Although riders may ride a bike from their origin to transit, they are less likely to do the
same with the final portion of their trip. A DOT study conducted across 15 transit agencies
confirmed the finding. The beginning portion of trips tend to be longer than the final portion,
thus making storage facilities at transit stations and transfer centers an important part of the
commuters’ decision-making criteria.
The first and final mile is a problem that transit agencies often disregard. Addressing this
problem through the integration of public transit and bicycle infrastructure is some ways a
THESIS SPRING, 2012 JOYCE TAM
15
perfect “marriage” that has yet to be realized (Krizek, 2010). Considering the entire trip for the
rider can appeal to a greater number of customers. A study done in Montreal, Canada inquires
even further into the hierarchy of infrastructure preference in creating connections between
public transit and bicycling. Researchers identified through survey results groups of users that
make intermodal trips through the use of their personal bicycle, a bike share, or automobile.
These users with personal bicycles contended that being able to bring their bicycles on-board
was preferred, while on-site storage was more likely to be used (Bachand-Marleau). Although
on-site storage is more common due to simpler logistics (cost, insurance, capacity, etc.), one of
the concerns with on-site storage may be the security of the bicycles. A study conducted by the
Mineta Transportation Institute supported that on-board storage was preferred, despite the
limited capacity (Krizek, 2011). The fact remains, however, that on-board bicycle storage may
be more difficult to secure as bicycles occupy more space than passengers and can be a liability
issue. Krizek maintains that an effective way to encourage intermodal trips is to make on-site
bicycle storage more attractive and on-board storage more convenient. As technology,
innovation, and conditions continue to improve, it seems evident that in order to appeal to the
greatest number of riders, transit agencies need to provide bicycle storage on board transit and at
transit stops in tandem.
Besides infrastructure advancements and policy measures, social perception of bicycling is
important as well according to a study conducted at the University of California, Davis (Xing,
2010). Through survey results, this survey indicates that the user may consider social perceptions
and acceptable norms just as much, if not, even more so than infrastructure. However, social
perception of bicycling can be attributed to an indirect effect of infrastructure provisioning. If
more infrastructure is provided, users may perceive it safer to ride a bicycle and will ride more
THESIS SPRING, 2012 JOYCE TAM
16
frequently. A TCRP 2009 study supports the notion that user choices are affected by individual
and social factors that may be out of the control of the transit agency directly.
There is a great range of bike-transit policies in cities across the United States. As
bicycling, transit, and alternative modes continue to grow in popularity and convenience, many
cities continue to make the effort to improve their facilities. Bay Area Rapid Transit (BART) in
the San Francisco-Bay Area and Chicago Transportation Authority in Chicago has made great
headway in integrating bicycles into their transit systems with nearly equal numbers of bicycle
parking spaces at rail stations at about 6,500 (Pucher, 2009). These agencies prioritize bicycle
storage at transit stations and work to ensure adequate design and capacity for bicycles. In
Minneapolis and Washington, DC, the policies make deliberate efforts in coordinating bike
routes to transit routes. Ensuring the compatibility of these two modes of travel, they create the
connections and convenience of a multi-modal trip.
In 2005, the Transit Cooperative Research Program (TCRP) found more than 50 public
transit agencies integrating bicycling and walking into their services. These are cases in which
the public transit provider took up the responsibility for modes by which their customers reached
their transit services. The results were positive. These agencies were met with general support
and built relationships with other agencies from local planning boards to bicycle advocacy
groups. They also encountered few maintenance costs and found bicycle and pedestrian
infrastructure to be less expensive than bus, train, or automobile infrastructure. Public transit
agencies can make small investments to improve their customers’ overall travel experience.
With the continued growth and establishment intermodal policies that encourage bike-ped-
transit integration, the next field of inquiry would be to gather the customer experience with

THESIS SPRING, 2012 JOYCE TAM
17
these services. TCRP found some agencies that do collect data on bicycle infrastructure usage,
but most did not. Since many of these programs are new or have little to no data for analysis, it is
difficult to determine customer satisfaction or reaction to these facilities. There have been studies
that have looked at general proliferation of these services, but their effectiveness has not been
very deliberately established.
Bike-transit programs are relatively new developments; a TCRP study found 50 as of 2005.
Though there are studies that span across multiple programs to look at what general trends there
are that have worked or not worked in certain regions, there has not been a lot of customer
feedback specific to the programs. Studies have typically described what features or methods
were used in creating these programs. This research can be incredibly valuable as more transit
agencies decide to take advantage of the opportunities that intermodal integration provides. Key
lessons in what to consider and technologies to include are going to be extremely useful as public
transit agencies continue to look for ways to gain ridership and customer satisfaction.
The more microscale details of a customers’ trip can help to gain insight into how to best
continue making improvements on the facilities to gain more new users. Learning things like
what made the customer ride the bus or ride a bike, how influential a certain amenity was, their
trip purpose, etc. can provide some feedback for what steps to take next in implementing
intermodal-transit integration. Research in this type of transportation planning needs to continue
by creating positive relationships with the users, and following up to assess the success or
effectiveness of the programs with the goal of continuing to improve service and satisfaction.
Public transit agencies have numerous options that can be implemented with relative ease
and low cost that could yield positive results. The issue of bicycle parking and storage could
THESIS SPRING, 2012 JOYCE TAM
18
include installing bicycle racks, bicycle lockers. Bicycle stations that include parking facilities,
lockers, attendants, and sometimes showers have been popular in cities near transit hubs for
people commuting to work. Not only providing infrastructure at transit stations, but also
including bicycle infrastructure on the journey is important. Providing space on train cars or
installing front loading bicycle racks have been successful in promoting bike-and-ride trips.
Through individual customer surveys, this study will help to further the conversation and
knowledge of how to plan for better public transit facilities that encourage bicycle and pedestrian
use. An inquiry into who these intermodal facilities are servicing and where they are servicing
would contribute to the initial case that intermodal transit integration can support non car
owning, low income, or student users and whether or not the facilities are expanding the area of
coverage for the transit agency. By surveying bicyclists and transit riders of the Los Angeles
Metropolitan Area, this study will contribute to how to make more headway in developing an
intermodal network of movement for the City of Los Angeles. Introducing the different options
for bicycle and pedestrian facilities may help to get an idea of what features would be the most
attractive or influential in encouraging an intermodal trip. Through individual customer surveys,
it will fulfill the purpose of generating customer feedback that will inform public transit agencies
what is important to the customer in deciding to make a trip via bicycle and transit.
THESIS SPRING, 2012 JOYCE TAM
19
RESEARCH DESIGN
Location of Study
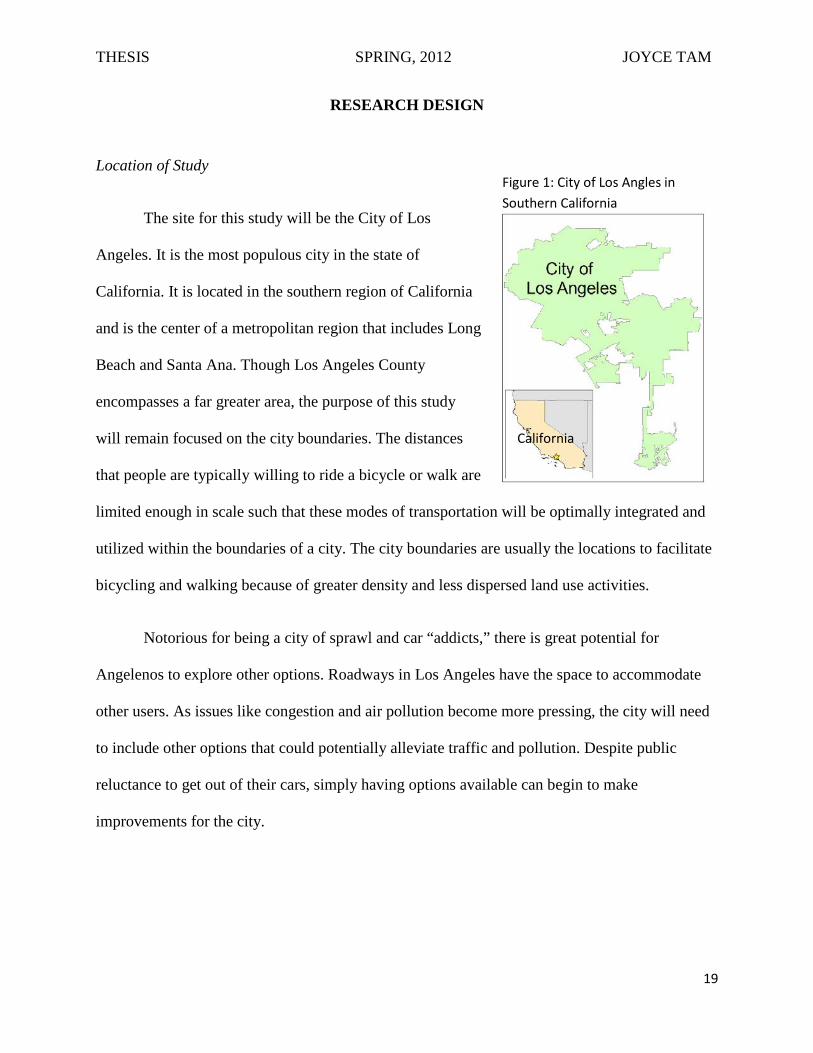
The site for this study will be the City of Los
Angeles. It is the most populous city in the state of
California. It is located in the southern region of California
and is the center of a metropolitan region that includes Long
Beach and Santa Ana. Though Los Angeles County
encompasses a far greater area, the purpose of this study
will remain focused on the city boundaries. The distances
that people are typically willing to ride a bicycle or walk are
limited enough in scale such that these modes of transportation will be optimally integrated and
utilized within the boundaries of a city. The city boundaries are usually the locations to facilitate
bicycling and walking because of greater density and less dispersed land use activities.
Notorious for being a city of sprawl and car “addicts,” there is great potential for
Angelenos to explore other options. Roadways in Los Angeles have the space to accommodate
other users. As issues like congestion and air pollution become more pressing, the city will need
to include other options that could potentially alleviate traffic and pollution. Despite public
reluctance to get out of their cars, simply having options available can begin to make
improvements for the city.
Figure 1: City of Los Angles in Southern California
California
THESIS SPRING, 2012 JOYCE TAM
20
Sources of Data
The City of Los Angeles adopted the Los Angeles Bicycle Plan in the Spring of 2011.
Considered ambitious and progressive by many, the Plan proposes to create a 1,680 mile
bikeway system. It outlines needs for other aspects like safety, education, and storage methods.
The LA Metro continues to make improvements and expansions on their public transit network.
The LA Metro Orange Line, the newest of its MetroRail lines is an exclusive bus-rapid transit
line, the first in the United States. The Metro Orange Line Bicycle Path runs along the entire
length of the Orange Line. Discussion to extend the Orange Line will include an extension of the
bicycle path. The Metro Rail Orange Line, being the newest addition to the public transit system
has made deliberate efforts to include bicycles in its design. This will serve as a source for
assessing the progress and satisfaction of bike-transit services.
A secondary form of data that will be used will be data that Los Angeles County
Metropolitan Transportation Authority has collected. They conducted bicycle counts and
collected user surveys in 2010 that revealed aspects of decision-making that their customers
considered when using public transit services or their bicycle infrastructure. They surveyed
customers who brought their bikes aboard public transit or parked bicycles before boarding
public transit at a number of public transit MetroRail stations. This study will provide a further
analysis and interpretation of the information collected through the LA Metro studies by looking
closer at the design of selected stations.
The Bicycle Rail Trip Analysis and Greenhouse Gas Emission Reduction Focused Study
used bicycle-trip data gathered in the Fall of 2009. LA Metro staff intercepted bicyclists to
survey them about the trips they were taking at the time of survey. Volunteers collected 605
THESIS SPRING, 2012 JOYCE TAM
21
surveys from 19 Metro Rail Stations during the AM and PM commutes and weekend mid-day
commutes. The number of bicyclists entering and exiting stations were counted at the same time.
This survey revealed trip details like distance traveled with various modes and whether or not an
automobile would have been used instead. This study is telling of the potential impacts
additional bicycle infrastructure could have on future bicycle use.
The Metro Orange Line Mode Shift Study and Greenhouse Gas Emissions Analysis used
data collected from bicycle-trip data gathered during the Spring of 2010. LA Metro staff counted
bicyclists and pedestrians using the Metro Orange Line Bicycle Path, counted bicyclists getting
on and off the buses, and distributed surveys to bicyclists and park-and-ride users. Counts were
taken at weekday AM, mid-day, and PM hours and mid-day weekend hours. This study revealed
the details of what kinds of factors influenced the use of the bicycle path and how customers
reached the Metro stations. With the Orange Line as the newest addition to the LA Metro Rail
network, this study was the first to assess and analyze bicycle-transit usage and park-and-ride
facilities on this service line.
Maps & Calculations
A spatial analysis will be conducted through the computing software ArcGIS by looking
at the LA Metro public transit infrastructure and network, City of LA bicycle plan network, and
LADOT bicycle plan and network. The software will be able to place each of these data sets onto
a single map. The data sets may have different projections for their coordinate systems. This can
be reset for the projections to match. Because these transportation infrastructure systems are
typically constructed and maintained by separate parties, they have not been displayed
concurrently. This study will be the first to combine these three parts of the transportation
THESIS SPRING, 2012 JOYCE TAM
22
network of LA. Two mile buffers will be created around each MetroRail station, providing the
basis on which some important points of inquiry can be drawn about where the networks are
connected or disconnected. This kind of data will help to interpret what basic connectivity issues
exist outside of other infrastructural amenities. Additionally, this will provide the basic map from
which MetroRail stations will be selected for further investigation.
A useful addition may be including where bicycle parking and storage facilities are
located, but things like stoplight timing or bicyclists’ legal rights cannot be displayed, even
though they have been shown to be important components to encouraging bicycle use. Looking
at this information will help to create an inventory across multiple modes of transportation and
agencies that will lay the basis for what exists altogether – not simply what each agency owns.
This will provide the spatial component that will dictate further social analysis at the site level.
This will help to develop recommendations for the potential for the future of circulation in the
City of Los Angeles.
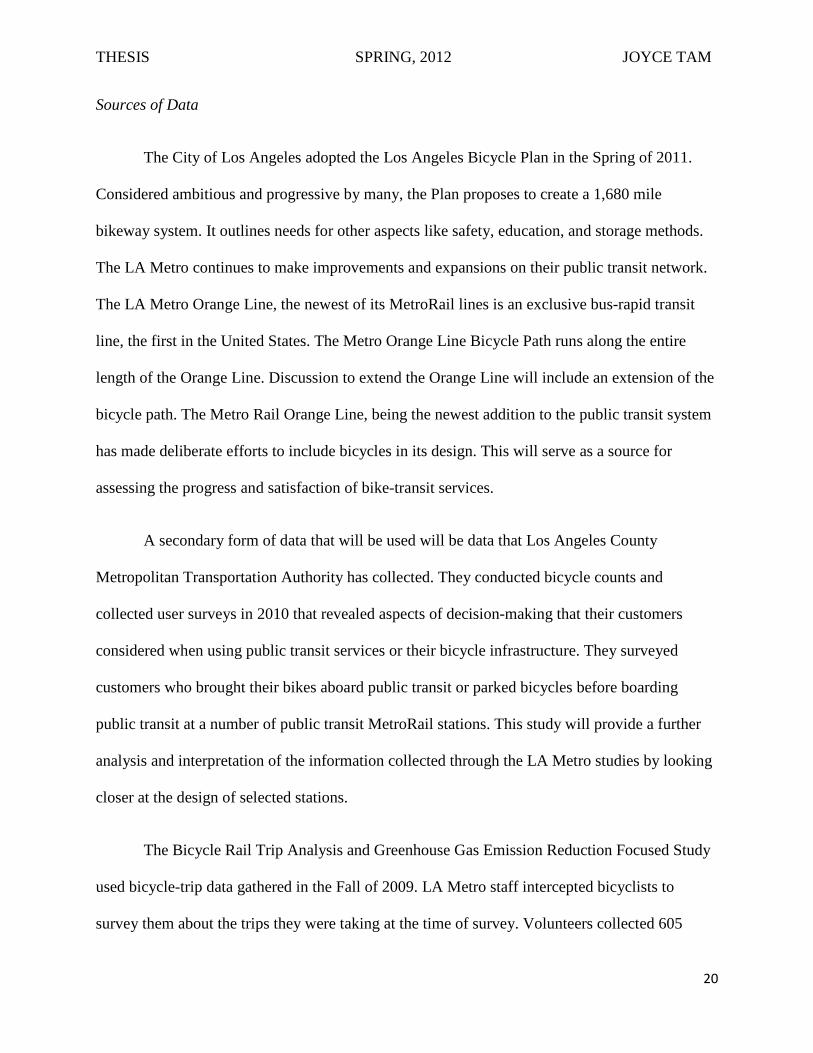
Upon determining the transit stations for further analysis, calculations will be made to
determine the amount of space available to add bicycle infrastructure. Using aerial images from
Figure 2: Surface area calculations using Google Earth aerial images.
How much area? How many cars? ¼ cars
THESIS SPRING, 2012 JOYCE TAM
23
Google Earth, the amount of surface area can be estimated based on comparisons of how many
parking spaces can fit into the open space. Given that a typical parking space in Los Angeles is
20 feet by 10 feet (LADOT), the surface area available can be calculated. Regarding
underground surface area calculations, measurements were taken in person at each location.
Given that a typical automobile parking space can accommodate 12 bicycles (LACBC), the
number of bicycles that would fit the given surface area can be calculated. Meanwhile, reserving
¾ of the space for other street furniture and pedestrian walking paths maintains ¼ of surface area
available for bicycle infrastructure. Given that each u-rack can accommodate 2 bicycles, the
number of u-racks to be installed can be calculated.
Physical & Social Combined
Through the combination of the LA Metro survey results and spatial analyses, some
recommendations will be drawn about where there are critical points to create a transit hub that
will effectively accommodate bicyclists, pedestrians, and transit users. A hierarchy of potential
locations or sites to upgrade and fortify infrastructure for alternative modes will be developed
with primary sites as the optimal locations with many crossing points for bicyclists, pedestrians,
drivers, and transit lines. Secondary locations can serve as connector points between primary
locations with less activity than primary locations, but still a good location with connections to
various modes. The primary and secondary locations will help to create a network of movement
that can be utilized via alternative modes.
The study will work with the Los Angeles County Bicycle Coalition (LACBC) to create a
meaningful set of recommendations for the future of alternative modes development and transit.
LACBC is a non-profit organization that uses advocacy, education, and outreach to build a
THESIS SPRING, 2012 JOYCE TAM
24
better, more bikable Los Angeles. They collaborate with many other agencies – public, private
and non-profit to work towards their mission. Collaboration with the LACBC will be
instrumental in how the outcome of this study may be used for further investigation or
deliberation in policy making. LACBC is an expansive organization that contributes in many
ways to policy making and implementation that will contribute towards a better, more bikable
Los Angeles. It is one of the goals of this study to be able to contribute to LACBC’s efforts in
influencing policy making. LACBC has worked hard and made great efforts to establish good,
working relationships with a variety of groups including public agencies like LADOT and LA
City Planning, and community groups like Ciclavia or City of Lights. LACBC has conducted
successful campaigns in the past in working with public agencies to allow bikes on buses, create
bicycle education events, reform transit funding structures, etc.; this study will be able to
contribute to its efforts for bike-transit policies or implementation strategies.
Using the LACBC bicycle counts and user survey results, Bicycle Rail Trip Analysis and
Greenhouse Gas Emission Reduction Focused Study, and Metro Orange Line Mode Shift Study
and Greenhouse Gas Emissions Analysis will guide the recommendations on enhancing the user
experience and creating more opportunities in multi-modality. The survey results will provide
direct user feedback that aid in determining trends in bicycle ridership. Combining these user
opinions with LADOT, LA Metro, and LA City Bike Plan maps will locate where riders might
use additional bicycle facilities. By relating user opinions and feedback to physical infrastructure
and station design, the recommendations provided will bring together studies that have typically
been independent of each other. The recommendations will be made based on the combination of
physical and geographical characteristics guided by how users interact with the system.
THESIS SPRING, 2012 JOYCE TAM
25
The combination of the mapping assessment and findings of the LA survey results will
guide this study in developing recommendations for how to create a more integrated and
continuous bike-transit network that will create more options for the citizens of Los Angeles.
Using the City of Los Angeles as a case study, the final recommendations will include policy
additions and infrastructure developments. The recommendations will help to inform various
agencies in developing a network that will make transit, bicycling, and walking more attractive
not only as individual modes of transportation but together as combinations of each other. These
modes are not meant to be separate of each other, but synergistic with each other.
THESIS SPRING, 2012 JOYCE TAM
26
RESULTS & ANALYSIS
LA Metro themselves designates Bike-Transit Hubs, the list is extensive and might be
difficult to implement because they are including their entire network of MetroRail and
MetroBus. The scope of their list is incredibly large, while giving little distinction for which
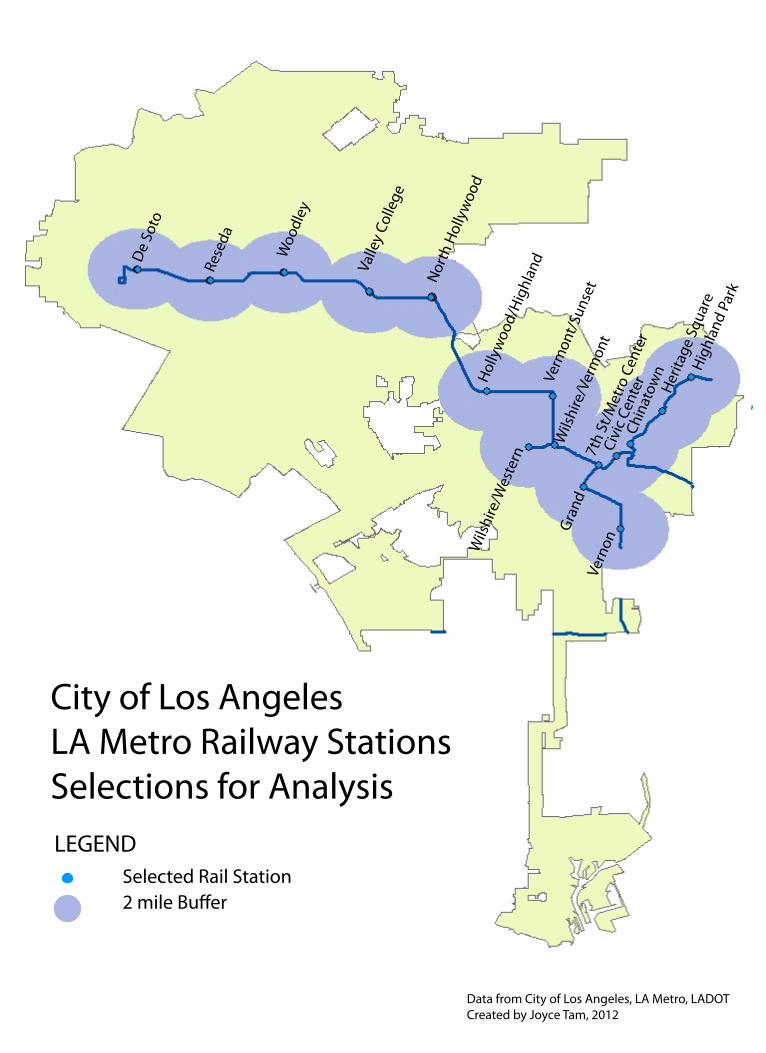
stations to begin with or have priority. I have selected 16 MetroRail stations that would serve as
an initial group to provide a more appropriate starting point that could eventually build up to all
the stations LA Metro envisions. By providing a starting point, I hope to be able to create a more
feasible step-by-step method of establishing a Bike-Transit Network in the City of Los Angeles.
Based on a spatial analysis, I have selected 16 LA Metro stations that would be the
beginning hubs of a multi-modal network. I have selected stations that range 3-4 miles apart.
Based on an LA Metro survey in which it was found that the average distance of a Metro rider to
get to the Metro Station was 2 miles, I created 2 mile boundaries around each station. This was to
ensure that from any direction, any rider would only have to ride a bicycle 2 miles to get to a
train station. For the hub stations, I selected the stations for which their boundaries just
intersected because anybody within those boundaries would be able to ride a bike to get to either
station. I eliminated the stations that were overlapped by two stations on either side, which also
overlapped each other despite having a station in between them. This created a network of hub
stations that were each 3-4 miles apart. I also checked that at least a bicycle path ran through the
stations, either one that belonged to LADOT or LACity, and sometimes both.
THESIS SPRING, 2012 JOYCE TAM
27
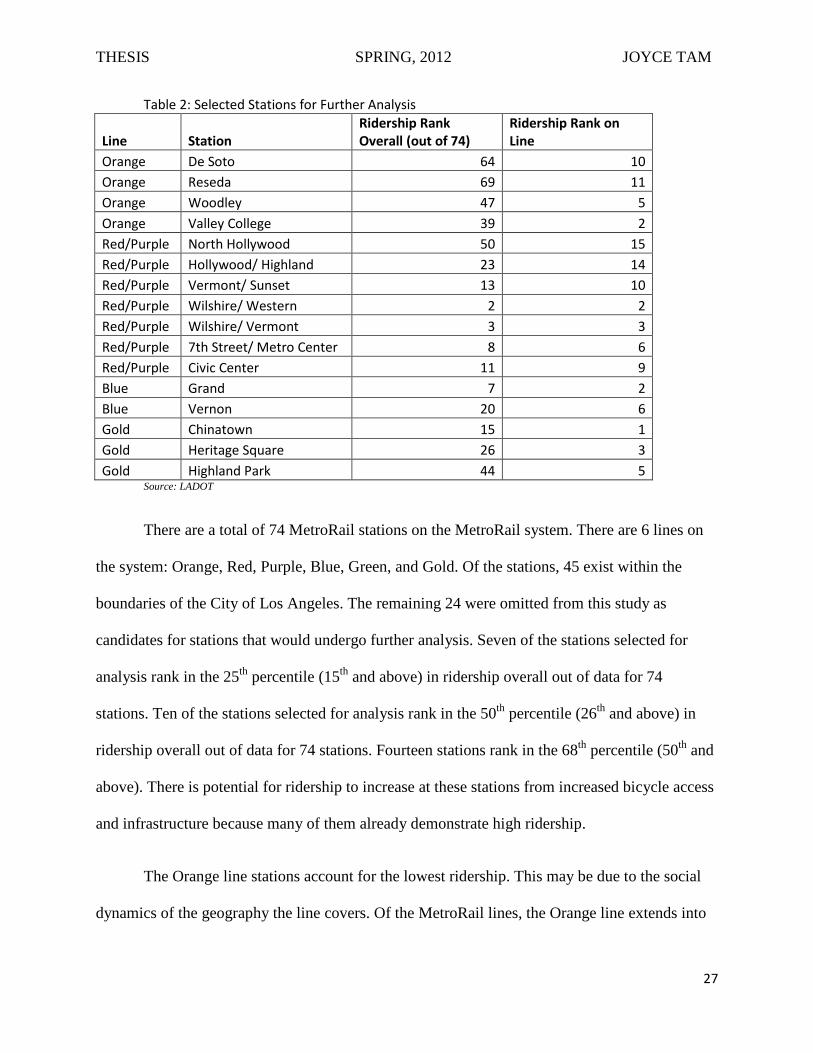
Table 2: Selected Stations for Further Analysis
Line Station Ridership Rank Overall (out of 74)
Ridership Rank on Line
Orange De Soto 64 10 Orange Reseda 69 11 Orange Woodley 47 5 Orange Valley College 39 2 Red/Purple North Hollywood 50 15 Red/Purple Hollywood/ Highland 23 14 Red/Purple Vermont/ Sunset 13 10 Red/Purple Wilshire/ Western 2 2 Red/Purple Wilshire/ Vermont 3 3 Red/Purple 7th Street/ Metro Center 8 6 Red/Purple Civic Center 11 9 Blue Grand 7 2 Blue Vernon 20 6 Gold Chinatown 15 1 Gold Heritage Square 26 3 Gold Highland Park 44 5
Source: LADOT
There are a total of 74 MetroRail stations on the MetroRail system. There are 6 lines on
the system: Orange, Red, Purple, Blue, Green, and Gold. Of the stations, 45 exist within the
boundaries of the City of Los Angeles. The remaining 24 were omitted from this study as
candidates for stations that would undergo further analysis. Seven of the stations selected for
analysis rank in the 25th percentile (15th and above) in ridership overall out of data for 74
stations. Ten of the stations selected for analysis rank in the 50th percentile (26th and above) in
ridership overall out of data for 74 stations. Fourteen stations rank in the 68th percentile (50th and
above). There is potential for ridership to increase at these stations from increased bicycle access
and infrastructure because many of them already demonstrate high ridership.
The Orange line stations account for the lowest ridership. This may be due to the social
dynamics of the geography the line covers. Of the MetroRail lines, the Orange line extends into
THESIS SPRING, 2012 JOYCE TAM
28
the most characteristically suburban neighborhoods – with predominantly automobile use and
wide roads. Regardless, LAMetro continues to report growing ridership on this line, in addition
to increased service frequency and reliability.
Of the stations I selected, there were characteristics that were common among some
stations. There were stations that were located in more suburban and residential settings versus
urban and mixed-use settings. The suburban stations might have less pedestrian activity, but also
a large amount of space that could potentially fit a plaza and bicycle infrastructure. These spaces
could serve as community meeting places. This could potentially welcome more pedestrian and
bicycle activity. Some stations had automobile parking available in a separate lot, temporary u-
rack bicycle parking, permanent locker bicycle parking, both automobile and bicycle parking, or
neither. Urban stations might have been inside a commercial building or in the middle of the
road with automobile traffic on either side of the train tracks. These stations had more limited
space to add pedestrian and bicycle infrastructure. This factor indicated whether or not there
would be space that could be adapted to include more uses at the surface. Below ground space
was an additional factor that was investigated at each station. Every station with below ground
space was handicap accessible, which meant they had elevators in addition to escalators that
bicyclists could use. Square footage available below ground was estimated on site with
calculations taken for how much of the space could be used by bicycle infrastructure while
maintaining pedestrian space for transit riders.
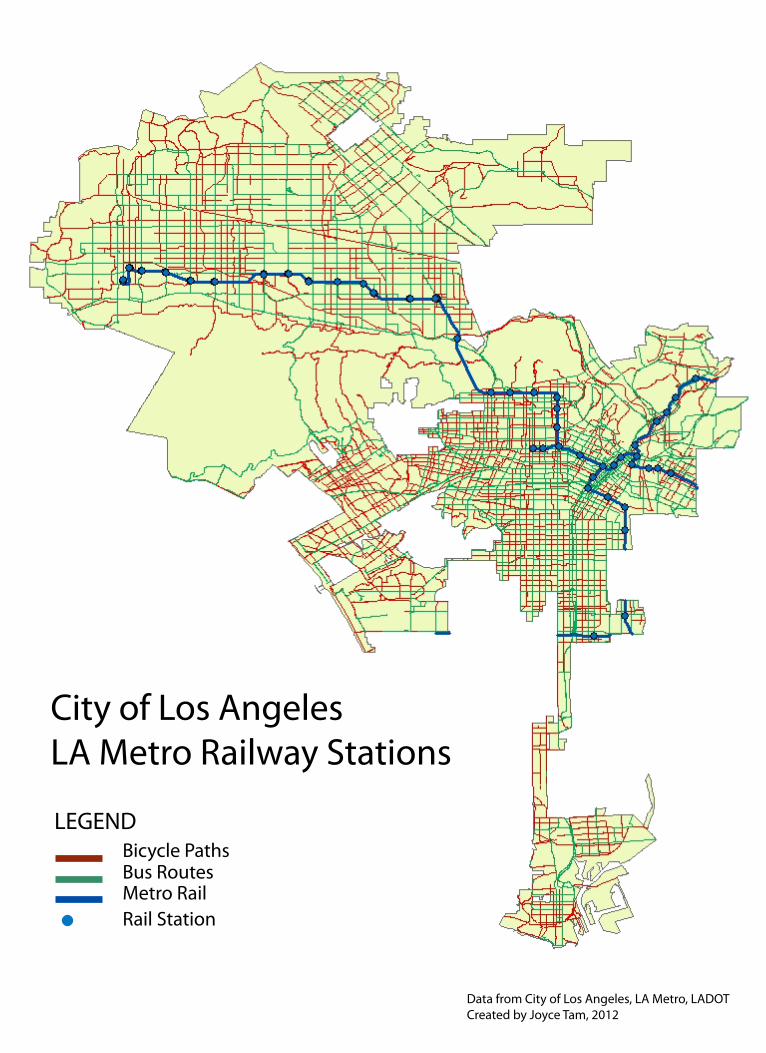
LEGEND
City of Los AngelesLA Metro Railway Stations
Bicycle PathsBus RoutesMetro RailRail Station
Data from City of Los Angeles, LA Metro, LADOTCreated by Joyce Tam, 2012
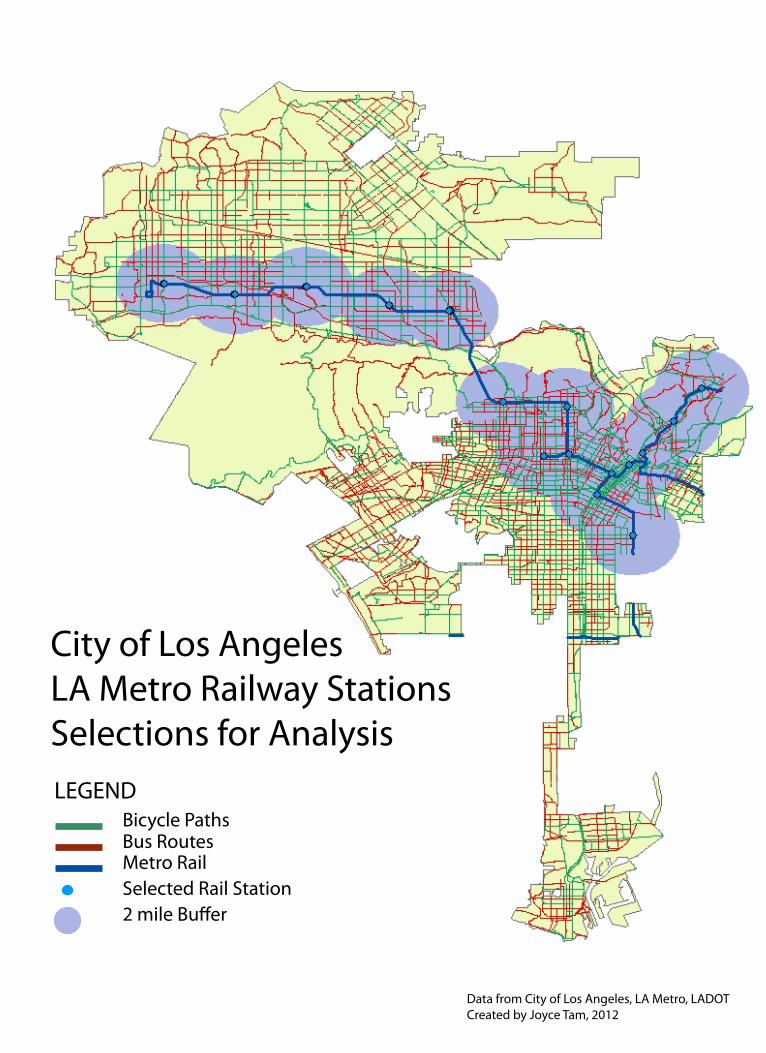
LEGEND
City of Los AngelesLA Metro Railway StationsSelections for Analysis
Bicycle PathsBus RoutesMetro RailSelected Rail Station2 mile Bu�er
Data from City of Los Angeles, LA Metro, LADOTCreated by Joyce Tam, 2012
LEGEND
City of Los AngelesLA Metro Railway StationsSelections for Analysis
Selected Rail Station2 mile Bu�er
Data from City of Los Angeles, LA Metro, LADOTCreated by Joyce Tam, 2012
De
Soto
Rese
da
Woo
dley
Valle
y Co
llege
Nor
th H
olly
woo
dHo
llyw
ood/
Hig
hlan
dVe
rmon
t/Su
nset
Hig
hlan
d Pa
rk
Herit
age
Squa
re
Chin
atow
n
Civi
c Ce
nter
7th
St/M
etro
Cen
ter
Wils
hire
/Wes
tern
Wils
hire
/Ver
mon
t
Gran
dVe
rnon
THESIS SPRING, 2012 JOYCE TAM
32
Ample space
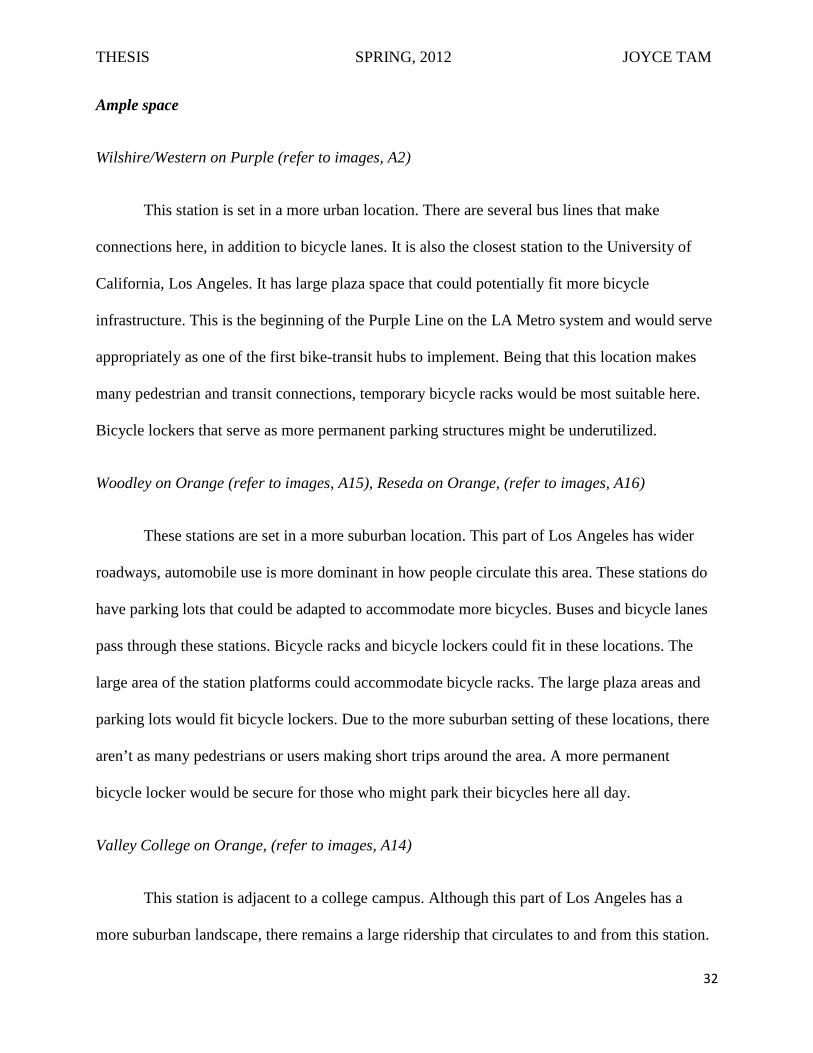
Wilshire/Western on Purple (refer to images, A2)
This station is set in a more urban location. There are several bus lines that make
connections here, in addition to bicycle lanes. It is also the closest station to the University of
California, Los Angeles. It has large plaza space that could potentially fit more bicycle
infrastructure. This is the beginning of the Purple Line on the LA Metro system and would serve
appropriately as one of the first bike-transit hubs to implement. Being that this location makes
many pedestrian and transit connections, temporary bicycle racks would be most suitable here.
Bicycle lockers that serve as more permanent parking structures might be underutilized.
Woodley on Orange (refer to images, A15), Reseda on Orange, (refer to images, A16)
These stations are set in a more suburban location. This part of Los Angeles has wider
roadways, automobile use is more dominant in how people circulate this area. These stations do
have parking lots that could be adapted to accommodate more bicycles. Buses and bicycle lanes
pass through these stations. Bicycle racks and bicycle lockers could fit in these locations. The
large area of the station platforms could accommodate bicycle racks. The large plaza areas and
parking lots would fit bicycle lockers. Due to the more suburban setting of these locations, there
aren’t as many pedestrians or users making short trips around the area. A more permanent
bicycle locker would be secure for those who might park their bicycles here all day.
Valley College on Orange, (refer to images, A14)
This station is adjacent to a college campus. Although this part of Los Angeles has a
more suburban landscape, there remains a large ridership that circulates to and from this station.

THESIS SPRING, 2012 JOYCE TAM
33
It has large parking lots that would be suitable to use for bicycle and pedestrian infrastructure.
With a large portion of potential bus riders, bicyclists, and Metro riders, this station could be a
larger hub to develop. There is a tremendous amount of space here that could be used for more
modes of transportation. The parking lots would fit bike lockers. College students might find
bicycle racks more beneficial if they are making shorter trips to, from, and around campus. This
station might attract more riders if the bike lockers and bike racks were added to the automobile
parking lots.
North Hollywood on Orange/Red, (refer to images, A8)
This is an incredibly large station. It is the connection point between the Metro Red line
and Metro Orange line. There is a lot of space here that can accommodate pedestrian and bicycle
infrastructure. Although the Red line Station is large, the Orange line Station across the street has
more limited space, but could still allow for some temporary bicycle parking structures. There is
currently a supply of bicycle infrastructure at the Red line Station, but the Orange line does not
have any. It would be beneficial to include bicycle infrastructure at the Orange line station to
supplement the connection at the North Holllywood Station. Because this station serves as the
connecting points between the Orange and Red line, there is a large amount of riders making
transfers, but also activity and development in the neighborhood. Also serving as a connector
point to local buses, the station has the potential to embrace intermodal services. Converting
some automobile parking spaces into more bicycle racks and adding more bike lockers to the
large plaza space would add to the bike-transit network.
THESIS SPRING, 2012 JOYCE TAM
34
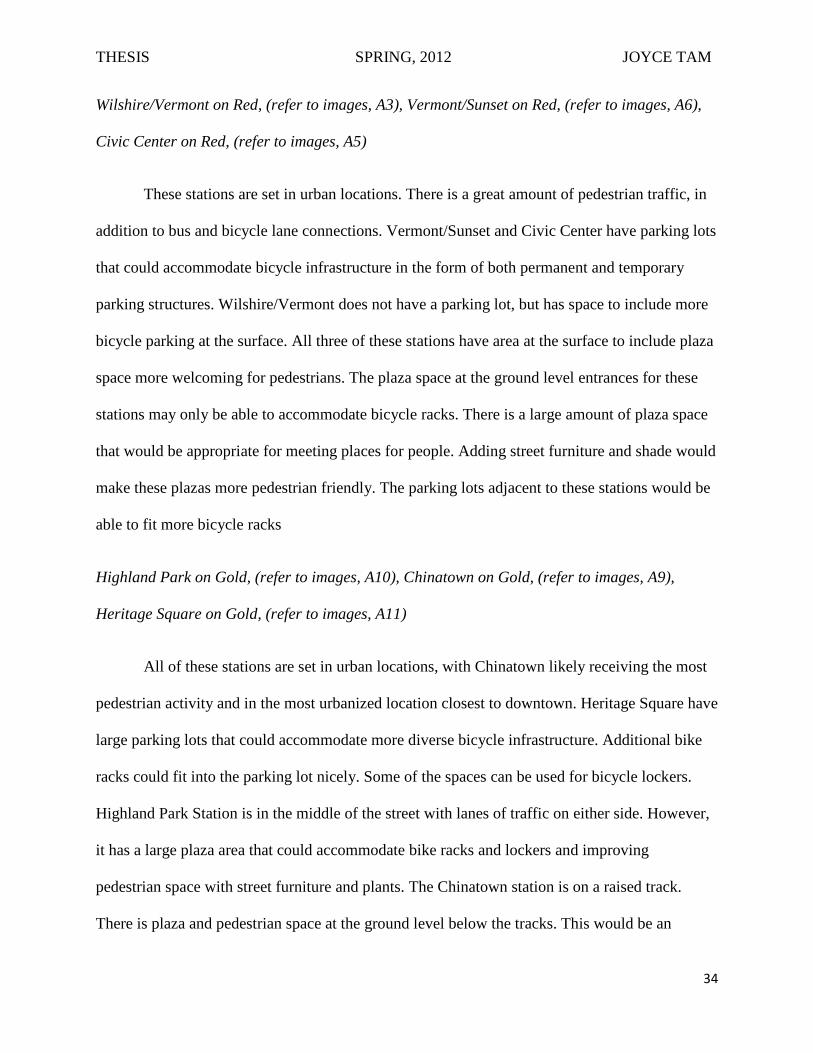
Wilshire/Vermont on Red, (refer to images, A3), Vermont/Sunset on Red, (refer to images, A6),
Civic Center on Red, (refer to images, A5)
These stations are set in urban locations. There is a great amount of pedestrian traffic, in
addition to bus and bicycle lane connections. Vermont/Sunset and Civic Center have parking lots
that could accommodate bicycle infrastructure in the form of both permanent and temporary
parking structures. Wilshire/Vermont does not have a parking lot, but has space to include more
bicycle parking at the surface. All three of these stations have area at the surface to include plaza
space more welcoming for pedestrians. The plaza space at the ground level entrances for these
stations may only be able to accommodate bicycle racks. There is a large amount of plaza space
that would be appropriate for meeting places for people. Adding street furniture and shade would
make these plazas more pedestrian friendly. The parking lots adjacent to these stations would be
able to fit more bicycle racks
Highland Park on Gold, (refer to images, A10), Chinatown on Gold, (refer to images, A9),
Heritage Square on Gold, (refer to images, A11)
All of these stations are set in urban locations, with Chinatown likely receiving the most
pedestrian activity and in the most urbanized location closest to downtown. Heritage Square have
large parking lots that could accommodate more diverse bicycle infrastructure. Additional bike
racks could fit into the parking lot nicely. Some of the spaces can be used for bicycle lockers.
Highland Park Station is in the middle of the street with lanes of traffic on either side. However,
it has a large plaza area that could accommodate bike racks and lockers and improving
pedestrian space with street furniture and plants. The Chinatown station is on a raised track.
There is plaza and pedestrian space at the ground level below the tracks. This would be an
THESIS SPRING, 2012 JOYCE TAM
35
appropriate place with the space necessary to add bike racks and bike lockers. This station has
connections to many other local services.
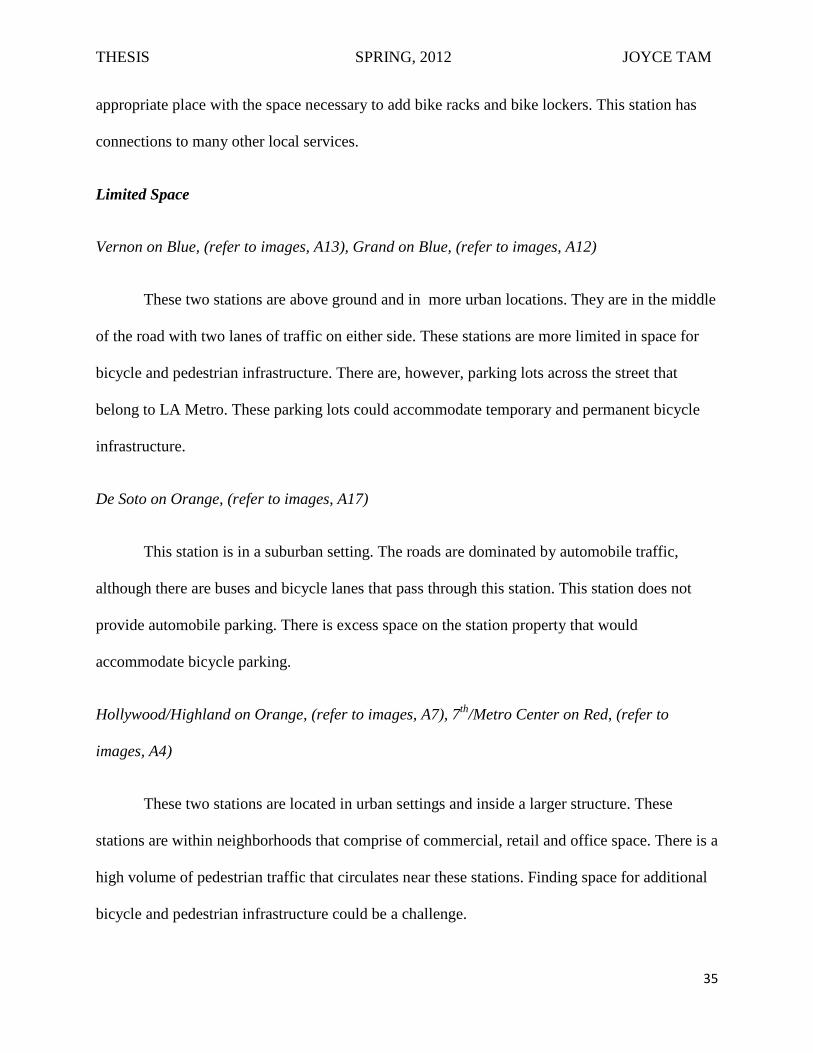
Limited Space
Vernon on Blue, (refer to images, A13), Grand on Blue, (refer to images, A12)
These two stations are above ground and in more urban locations. They are in the middle
of the road with two lanes of traffic on either side. These stations are more limited in space for
bicycle and pedestrian infrastructure. There are, however, parking lots across the street that
belong to LA Metro. These parking lots could accommodate temporary and permanent bicycle
infrastructure.
De Soto on Orange, (refer to images, A17)
This station is in a suburban setting. The roads are dominated by automobile traffic,
although there are buses and bicycle lanes that pass through this station. This station does not
provide automobile parking. There is excess space on the station property that would
accommodate bicycle parking.
Hollywood/Highland on Orange, (refer to images, A7), 7th/Metro Center on Red, (refer to
images, A4)
These two stations are located in urban settings and inside a larger structure. These
stations are within neighborhoods that comprise of commercial, retail and office space. There is a
high volume of pedestrian traffic that circulates near these stations. Finding space for additional
bicycle and pedestrian infrastructure could be a challenge.
THESIS SPRING, 2012 JOYCE TAM
36
Table 3: Above ground estimates of space available for bicycle infrastructure.
Parking spaces Plaza or platform
x12 bikes/car
¼ space 2 bike u-racks
Purple
1. Wilshire/Western 62 Plaza 744 186 93
2. Wilshire/Vermont 36 Plaza 432 108 54
Orange
3. De Soto 9 X 2 platforms 216 54 27
4. Reseda 6; 25 Plaza; X 2 platforms
672 168 84
5. Woodley 12; 11 Plaza; x 2 platforms
408 102 51
6. Valley College 12; 25 Plaza; x 2 platforms
744 186 93
Red
7. 7th/Metro Center Sidewalk 5
8. Vermont/Sunset 28 Plaza 336 84 42
9. Hollywood/Highland Sidewalk 5
10. North Hollywood 220 cars
Plaza
2640
660
330
11. Civic Center 30 Plaza 360 90 45
Gold
12. Highland Park 132 Plaza 1584 396 198
13. Chinatown 30 Plaza 360 90 45
14. Heritage Square Sidewalk 5
Blue
15. Vernon Sidewalk 5
16. Grand Sidewalk 5
total 880
THESIS SPRING, 2012 JOYCE TAM
37
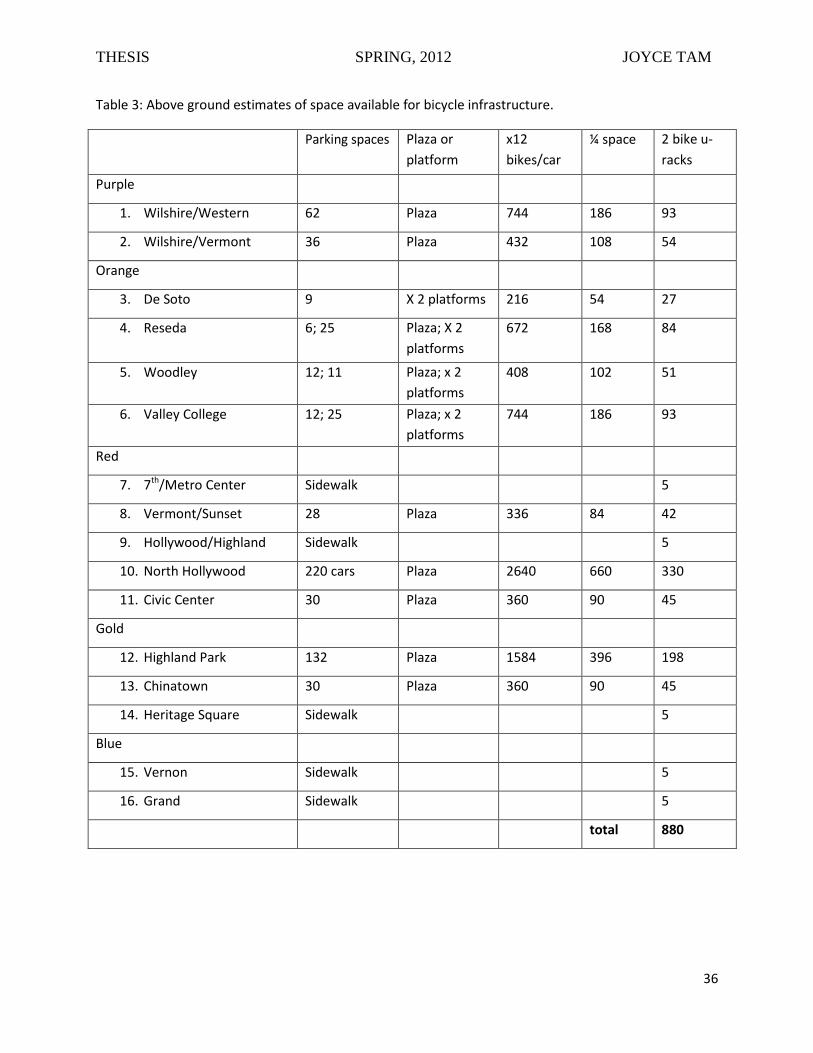
Based on a spatial comparison, the amount of adaptable space available to include bicycle
racks is listed above for each selected station. An estimation of the pedestrian or plaza space was
first equated to the number of automobile parking spaces in the area. Based on LACBC
calculations, one automobile parking spot can accommodate up to 12 bicycles. Based on
observations of the use of the surface area at these stations and aerial photographs estimating the
percentage of surface area for the space’s primary use - walking, it was determined that using up
to ¼ of the space would be reasonable for bicycles, if not, lower than it could be. The number of
bicycles that would fit in the area was halved to determine the number of u-racks that would
need to be installed. If a quarter of the pedestrian space could be used for bicycle infrastructure,
there still remain great opportunities to add 2-bike u racks.
North Hollywood and Highland Park have the most capacity for bicycle infrastructure
gains at over 100 2-bike u racks. Valley College and Wilshire/Western also have high numbers
at 93 racks possible. These stations could be able to replace some of the space for u-racks with
bike lockers. De Soto, Woodley, Wilshire/Vermont, Vermont/Sunset, Civic Center and
Chinatown can hold a relatively moderate number of racks ranging from 20-60. The stations with
only sidewalk availability might only have space for a few racks on the sidewalk near 7th
Street/Metro Center, Hollywood/Highland, Heritage Square, Vernon and Grand.

THESIS SPRING, 2012 JOYCE TAM
38
Table 2: Below ground estimates of space available for bicycle infrastructure.
sq ft parking spaces
x12 bikes/car
¼ space 2-bike u-racks
Purple
1. Wilshire/ Western 1656 8 96 24 12
2. Wilshire/Vermont 2736 14 168 42 21
Red
7. 7th St/ Metro Center 7744 39 468 117 58
8. Vermont/ Sunset 1660 8 96 24 12
9. Hollywood/ Highland 3936 20 240 60 30
10. North Hollywood 1344 7 84 21 10
11. Civic Center 9020 45 540 135 67
Gold
13. Chinatown 2880 14 168 42 21
total 231
grand total
above ground
+ below ground
1,111
Based on spatial measurements taken at the above stations, the amount of adaptable space
available to include bicycle racks is listed above for each selected station. An estimation of the
space available was first measured and the calculations were made based on the above ground
methods. Given the typical area of a parking spot in Los Angeles to be 20 feet by 10 feet, the
number of available parking spaces were calculated. Based on LACBC calculations, one
automobile parking spot can accommodate up to 12 bicycles. If a quarter of the space could be
used for bicycle infrastructure, there still remains great opportunities to add 2-bike u racks.
THESIS SPRING, 2012 JOYCE TAM
39
Seventh Street/Metro Center and Civic Center have the most amount of space available
below ground. Wilshire/Vermont, Chinatown, and Hollywood/Highland have a moderate amount
of space available. Wilshire/Western, Vermont/Sunset, and North Hollywood have the least
amount of space available. Compared to above ground availability, Wilshire/Western,
Vermont/Sunset, and North Hollywood stations have more space above than below. 7th
Street/Metro, Civic Center, Hollywood/Highland stations have more availability below ground
than above. There are opportunities for both above ground or below ground infrastructure to
accommodate bicycle infrastructure where one may be more adaptable than the other.
The latest inventory that LADOT took of their bicycle racks lists about 3,000 bicycle
racks (2009). The simple strategy outlined in this report would increase the number of available
bicycle racks by 33%. The grand total number of 2-bike u-racks that these stations could have
installed both above ground and below ground is 1,111, making the total stock in the inventory
upwards of 4,000 bicycle racks. This allows for the current trends of increased bicycle ridership
to continue with not only growth in bicycle lane miles, but also bicycle storage capacity.
Some of these stations may have more space above ground, but less space below ground,
and vice versa. If both of these types of spaces are considered, there would be no station lacking
for bicycle infrastructure. The strategy outlined here looks beyond what is available or
limitations at the surface. The combination of above and below ground space needs to be a next
step in implementing a multi-modal transportation infrastructure network of connections and
facilities for the bike-transit user.
THESIS SPRING, 2012 JOYCE TAM
40
Next Steps
Bicycling info lists a typical u-rack could cost $150 to $300 to purchase and install. If the
figures listed above are pursued as the beginning of bicycle infrastructure enhancements in Los
Angeles, the grand total cost could range between $166,650 and $333,300 for 1,111 2-bike u-
racks. Given the space available at many of the locations listed above, this could be the only cost
and would be inexpensive compared to other expenses that include track maintenance or
automobile parking spots. Investing in this infrastructure may help to bring in more customers by
creating a larger catch basin of riders and making bicycling more attractive to current customers.
According to LA Metro user surveys, more than a quarter of trips that include bike and
rail replace car trips altogether. Additionally, about 12% of bike trips to the rail station replaced a
car trip. The combination of bicycles and MetroRail is an option that is utilized and could
increase in popularity if the proper facilities are provided. Bike-rail trips replace more than
300,000 vehicle trips, resulting in 422 cars removed from the road. Another 13% reported not
making the trip at all if they could not both bike and ride the train. These figures indicate that
there are a group of users that rely on a combination of bike and rail. This method of travel could
increase in popularity if more infrastructure is included to make it more attractive.
Currently, there are about 118,740 bicycle commuters to work and 1,341,762 transit
commuters to work. The trend with these figures is that it will increase. Given that the previous
increase for bicycling to work has been at greater than 50% and transit to work has been 10%
from the 2010 American Community Survey, implementing this program to install more bicycle
infrastructure would help to continue these trends. This would be the first time Los Angeles’s
THESIS SPRING, 2012 JOYCE TAM
41
public transit agency would pursue such an aggressive program to target and attract bicycle
riders. The initial benefits would be large, for a small cost.
One of the benefits to creating a bike program or bike plan is the new funding
opportunities an agency can pursue. There are many grants from non-profit or private
organizations that are available for bidding for alternative modes like bicycle and pedestrian
planning. Having a program in place makes it easier to apply for grants, and gives a candidate a
better chance at receiving more funds. Regional and local agencies are other resources to look for
funding. Public agencies like the City of Los Angeles and Los Angeles Department of
Transportation have transportation funds that are allocated for bicycle infrastructure. LA Metro
itself holds control over federal funds to use towards transportation improvements through a Call
for Projects proposal process. The cost for the 1,111 bicycle racks is not high, but the reward
would be much more valuable.
Installing bicycle u-racks are simple steps in transit station maintenance. With just a few
bolts in the ground, adding this piece of furniture would not take a long time. Beginning with
these initial 16 stations is more feasible than approaching the entire LA Metro system. This
initial first step could begin the process of creating a bike-transit integrated network.
After these initial 16 stations have increased bicycle infrastructure, the next steps would
be to determine what other transit stations to increase bicycle infrastructure. Since many
Angelenos depend on buses for commuting, it might be prudent to look at the most used bus
lines and create bike to bus hubs on a few bus lines. By working on a few bus lines at a time, this
strategy could be feasible to eventually cover all the routes in Los Angeles.
THESIS SPRING, 2012 JOYCE TAM
42
It is important to not forget the outer edges of bus and train routes. There is a great
concentration of cyclists and transit in the downtown core of Los Angeles, but the population is
much more spread out than transit indicates. By including populations and communities farther
from downtown, it would be possible to create the kind of dense bike-transit structure that is
downtown all over Los Angeles.
Looking at the usage rates of the parking lots that LA Metro owns. In adapting the
current automobile parking infrastructure into multimodal hubs, it would be interesting to
determine which facilities are being over or under-utilized. This could mean an even larger
potential for more space for bicycle or pedestrian infrastructure.
Bicycle support and infrastructure extends beyond the limits of this study in bicycle
parking at transit stations. There are many other aspects of bicycle usage to consider. Bicycle
policies and programs need to consider other aspects of bike riding. For example, bicyclists
rights are crucial in developing an appropriate environment for bicyclists. Laws that involve how
much lane space they can occupy, amount of space required when passing a bicyclist, and speed
limits need to be considered. Other allowable places of usage like whether or not they are
allowed to be brought on a bus if the front racks are full, if they are allowed on escalators or
elevators, or how many are allowed on train cars are other factors affecting bicycle usage.
Education and information programs are another way to encourage bicycle usage. Teaching
young children or adults how to ride a bike or the rules of the road when riding a bike can
influence ridership. Another way to encourage bicycle commuting is to include bicycle parking
inside office buildings. To supplement the bicycle commute, bicycle stations that provide long
term bicycle parking have also provided showers, locker rooms, on-site bicycle repairman, and
coffee shop. There are many other ways the bike-transit commute can be supplemented.
THESIS SPRING, 2012 JOYCE TAM
43
Mapping bicycle infrastructure is an important resource to the typical bicycle rider. Not
only mapping the routes available, but also mapping the storage facilities can be incredibly
useful. Although LADOT lists some transit sites with their facilities, they do not list all of their
available bicycle parking – racks and lockers- by quantity at each transit station. NYCDOT, for
example, provides an interactive and downloadable map for Google Earth, that will identify
exactly where and how many bicycle racks that exist. This would be an excellent resource for
Los Angeles to create.
Creating a truly tight-knit bike-transit network would finally be accomplished by filling
in the spaces in between the initial bike-transit and bike to bus hubs. The structure outlined with
the 16 initial stations mentioned above create bike-transit hubs at every 3-4 miles. By adding
bicycle infrastructure at the stations in between, the network can become a structure with 1-2
miles in between every bike-transit hub.
THESIS SPRING, 2012 JOYCE TAM
44
CONCLUSIONS
• According to LA Metro user surveys, 13% of respondents would not have made the trip
at all if they could not both bike and ride the train. In order to get to the MetroRail
station, 12% of respondents claimed their bike trip replaced a car trip. There is a
percentage of riders that bring their bikes with them on their trip to begin and/or complete
their journey – indicating space available on trains is important. Infrastructure and
networks for bicycles include other dimensions besides building bike lanes. Parking and
storage policies are an integral part of creating a bike-transit integrated system.
• Another survey finding showed that 87% of survey respondents used the Orange line bike
path, and 55% claiming the existence of the path influenced their decision to ride their
bicycle that day. The existence of this piece of infrastructure was a factor that was
considered in how a trip was made. This survey provides evidence that adding
infrastructure would not be over-looked, but might become a significant influence in the
everyday travels of Angelenos.
• These figures can make an impact on the way LA Metro riders perceive the transit system
as more than tracks and routes, but also a system inclusive of alternative modes. These
alternative modes create new methods and routes for how LA Metro riders make their
trips and interact with the rail network. Riders can begin to perceive LA Metro as a
system that is designed to get them to and from their destination rather than one that picks
up and drops off at a station or bus stop. Of the 1% of bike to work commuters and 11%
transit to work commuters, these portions of user groups can combine to take advantage
of the benefits of a multi-modal path.

THESIS SPRING, 2012 JOYCE TAM
45
• The City of Los Angeles has low density that is spread over a large area. The population
is spread out – so the transportation network should reflect that. There is a lot of
infrastructure and activity downtown, but LA has activity centers all over the city, and
people that go to and from any number of destinations. Given the current network that
circulates people into the core and then outward to the rest of the city, LA Metro can
create a bike-transit network that brings people from all over the city into the transit
network. Rather than starting from the core and spreading out, LA can attract any users
on any point in the grid – creating a much larger catch-basin of users, and get them safely
and conveniently to any point in the grid.
• Looking at the interior of the stations. In my experience as an LA Metro rider, there has
always been large areas of empty space in the underground stations. This could be a way
to find space for those stations like 7th/Metro Center and Hollywood/Highland that have
limited space at ground level. Considering the below ground space opens the possibilities
for adaptable space that is available. Below ground bicycle parking could be more secure
because only transit riders would walk past and protected from weather because it is
indoors.
• Despite some suburban locations of certain stations, there is an incredible change that a
multi-modal transit hub can create for a neighborhood. In places where buses can be
unreliable and infrequent, bicycle and pedestrian infrastructure could be a great addition
to the mobility of the community. Creating bike-transit hubs and improving pedestrian
infrastructure on these stations could create new plazas for the community. It could help
to create a stronger community and encourage more neighbors to meet.
THESIS SPRING, 2012 JOYCE TAM
46
• Because the LA Metro, LADOT, and LACity are three different agencies, their
infrastructure systems have never been combined. They have never been able to visualize
the ways in which they can help each other to provide better services and a better user
experience. In creating this resource, it is easy to see how the systems interact and can
work symbiotically rather than independently.
THESIS SPRING, 2012 JOYCE TAM
47
BIBLIOGRAPHY
1. Bachand-Marleau, J., Larsen, J. El-Geneidy, A. “The Much Anticipated Marriage of
Cycling and Transit: But How Will it Work?”, Transportation Research Board, 2011.
2. Coffel, K., et. al. “Literature Review for Providing Access to Public Transportation
Stations.” Transit Cooperative Research Program, 44 2009: 1-91.
3. Hagelin, Christopher. “A Return on Investment Analysis of Bikes-On-Bus Programs.”
National Center for Transit Research, NCTR 576-05 2005.
4. El-Gneidy, A. Tetreault, P., Surprenant-Legault, J. “Pedestrian Access to Transit:
Identifying Redundancies and Gaps Using a Variable Service Area Analysis.”
Transportation Research Board, 2009.
5. Ewing, Reid. “Is Los Angeles Style Sprawl Desirable?,” American Planning Association,
63 1997: 107-126.
6. Federal Transit Administration. “Bicycles and Transit.” USDOT, 1999.
7. Giuliano, Genevieve. “Subcenters in the Los Angeles Region.” Regional Science and
Urban Economics, 21 1991: 163-182.
8. Gordon, Pater, and Richardson, Harry. “Are Compact Cities a Desirable Planning Goal?”,
American Planning Association, 63 1997: 95-106.
9. Holtzclaw, J., Clear, R., Ditmar, H., Goldstein, D., Haas, P. “Location Efficiency:
Neighborhood and Socio-economic Characteristics Determine Auto Ownership and use –
Studies in Chicago, Los Angeles, and San Francisco, Transportation Planning and
Technology, 25 2002: 1-27.
10. Krizek, K. and Stonebaker, E. “Bicycling and Transit: A Marriage Unrealized.”
Transportation Research Board, 2144 2010: 161-167.

THESIS SPRING, 2012 JOYCE TAM
48
11. Krizek, K., Stonebaker, E. “Assessing Options to Enhance Bicycle and Transit
Integration.” Transportation Research Board, 2217 2011: 162-167.
12. Krizek, K., Stonebaker, E., Tribbey, S. ”Bicycling Access and Egress to Transit:
Informing the Possibilities.” Mineta Transportation Institute, 2825 2011: 1-127.
13. LADOT. “The City of Los Angeles Transportation Profile.” 2009.
14. Pucher, John, Komanoff, Charles, and Schimek, Paul. “Bicycling Renaissance in North
America?: Recent Trends and Alternative Policies to Promote Bicycling.” Transportation
Research Part A: Policy and Practice, 33 (7-8) 1999: 625-654.
15. Federal Highway Administration. “Linking Bicycle/Pedestrian Facilities with Transit.”
Case Study No 9. 1993.
16. National Bicycle and Pedestrian Clearinghouse. “Integration of Bicycles with Transit.”
NBPC Technical Brief, 1995.
17. McClintock, Hugh and Morris, Dave. “Integration og Cycling and Light Rapid TransitL
Realising the Potential.” World Transport Policy and Practice, 9 (3), 2003: 9-15.
18. Martens, Karel. “Promoting Bike-and-Ride: The Dutch Experience. Transportation
Research Part A, 41 2007: 326-338.
19. Murray, Alan. ”A Coverage Model for Improving Public Transit Systam Accessibility
and Expanding Access.” Annals of Oeration Research, 123 2003: 143-156.
20. Transportation Cooperative Research Board. “Integration of Bicycles and Transit.”
Transportation Research Board, 1994.
21. Pucher, John, Dill, Jennifer, and Handy, Susan. “Infrastructure, Programs, and Policies to
Increase Bicycling: An International Review.” Preventive Medicine, 50 2010: 106-125.

THESIS SPRING, 2012 JOYCE TAM
49
22. Pucher, John and Buehler, Ralph. “Integrating Bicycling and Public Transport in North
America.” Journal of Public Transportation, 12 (3) 2009: 79-104.
23. Pucher, John and Buehler, Ralph. “Making Cycling Irresistible: Lessons from the
Netherlands, Denmark, and Germany.” Transport Reviews, 28 (4) 2008: 495-528.
24. U.S. Census Bureau. “2010 American Community Survey.” 2010 Census.
25. U.S. Census Bureau. “Los Angeles City, California.” 2010 Census.
26. Wachs, Martin. “Learning from Los Angeles: Transport, Urban Form, and Air Quality.”
Transportation, 20 1993: 329-354.
27. Xing, Y., Handy, S., Buehler, T. “Factors Associated with Bicycle Ownership and Use: A
Study of 6 Small US Cities.” Transportation, 37 2010: 967-985
A1
THESIS SPRING, 2012 JOYCE TAM
Appendix: Station Images

Station:Above Ground
Below Ground
A2
THESIS SPRING, 2012 JOYCE TAM
Wilshire/Western
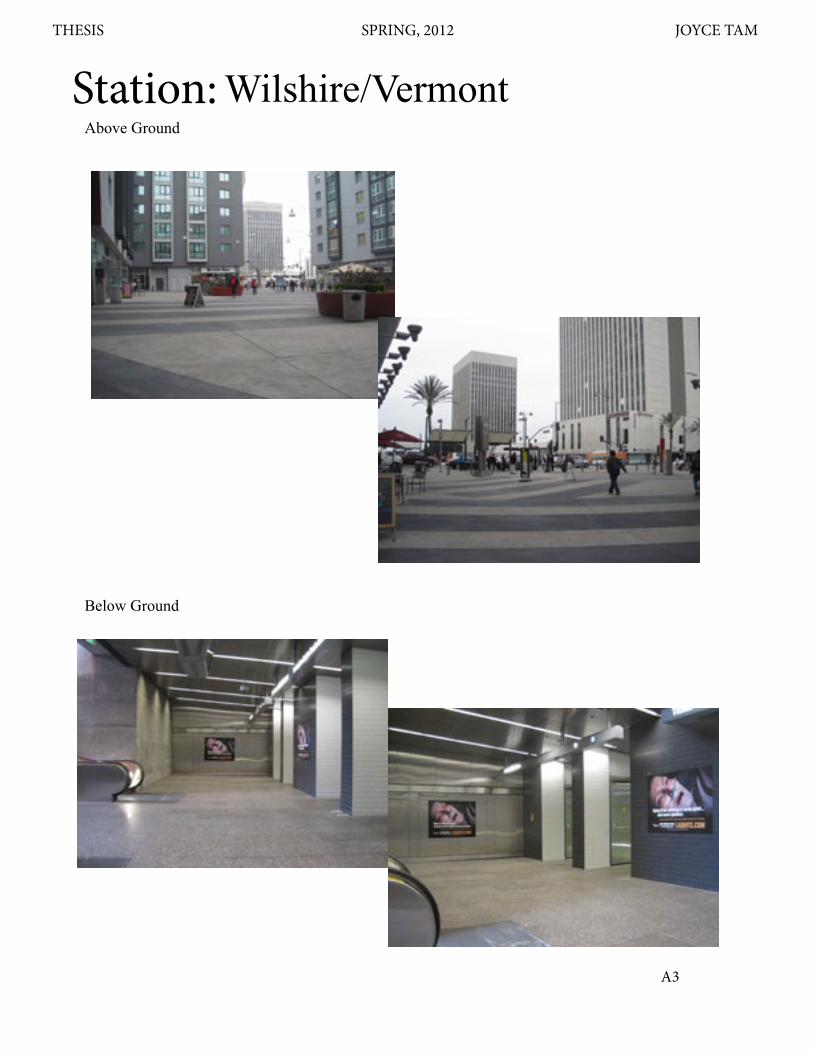
Station:Above Ground
Below Ground
A3
THESIS SPRING, 2012 JOYCE TAM
Wilshire/Vermont
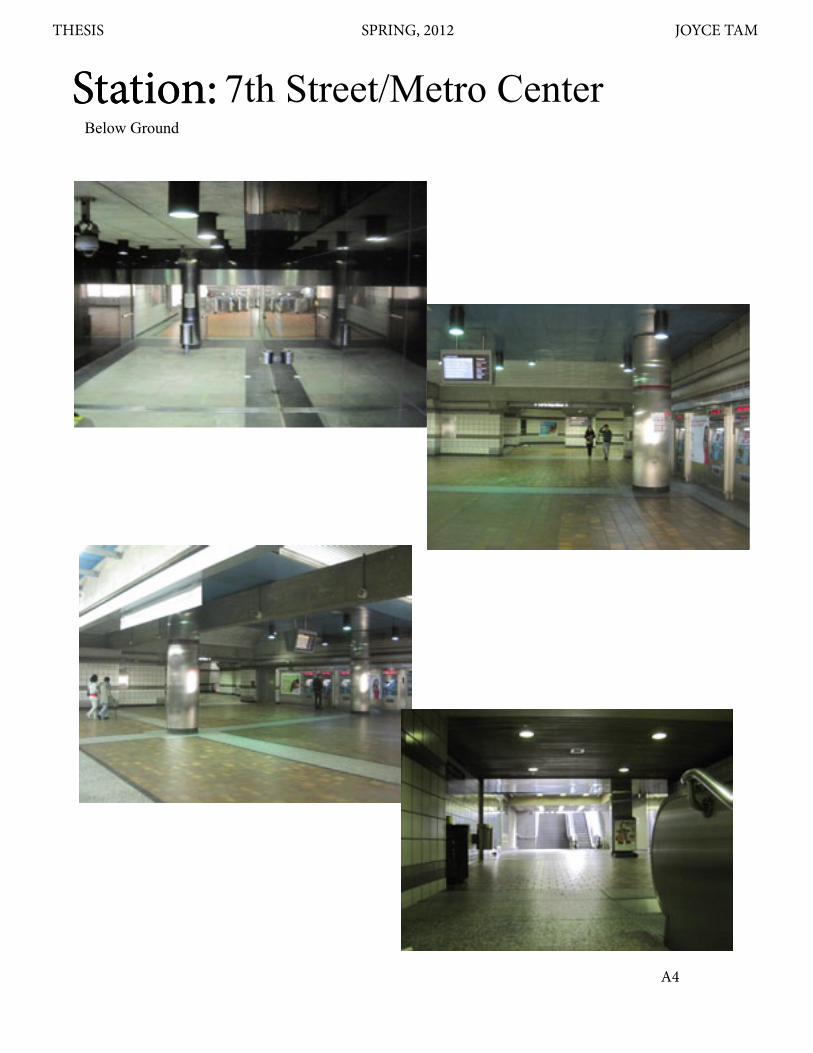
A4
THESIS SPRING, 2012 JOYCE TAM
Station:Below Ground
Station: 7th Street/Metro Center

Station:Above Ground
Below Ground
A5
THESIS SPRING, 2012 JOYCE TAM
Civic Center

Station:Above Ground
Below Ground
A6
THESIS DRAFT SPRING, 2012 JOYCE TAM
Vermont/Sunset

A7
THESIS SPRING, 2012 JOYCE TAM
Station:Below Ground
THESIS DRAFT SPRING, 2012 JOYCE TAM
Hollywood/Highland
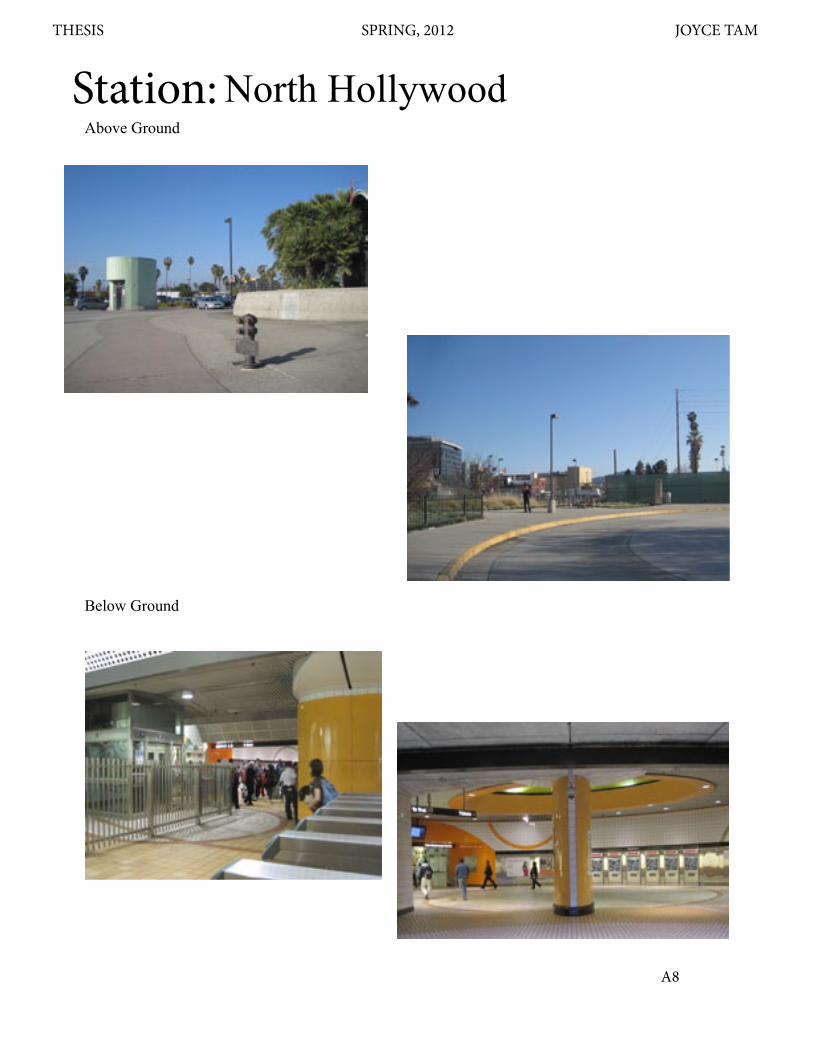
Station:Above Ground
Below Ground
A8
THESIS SPRING, 2012 JOYCE TAM
North Hollywood
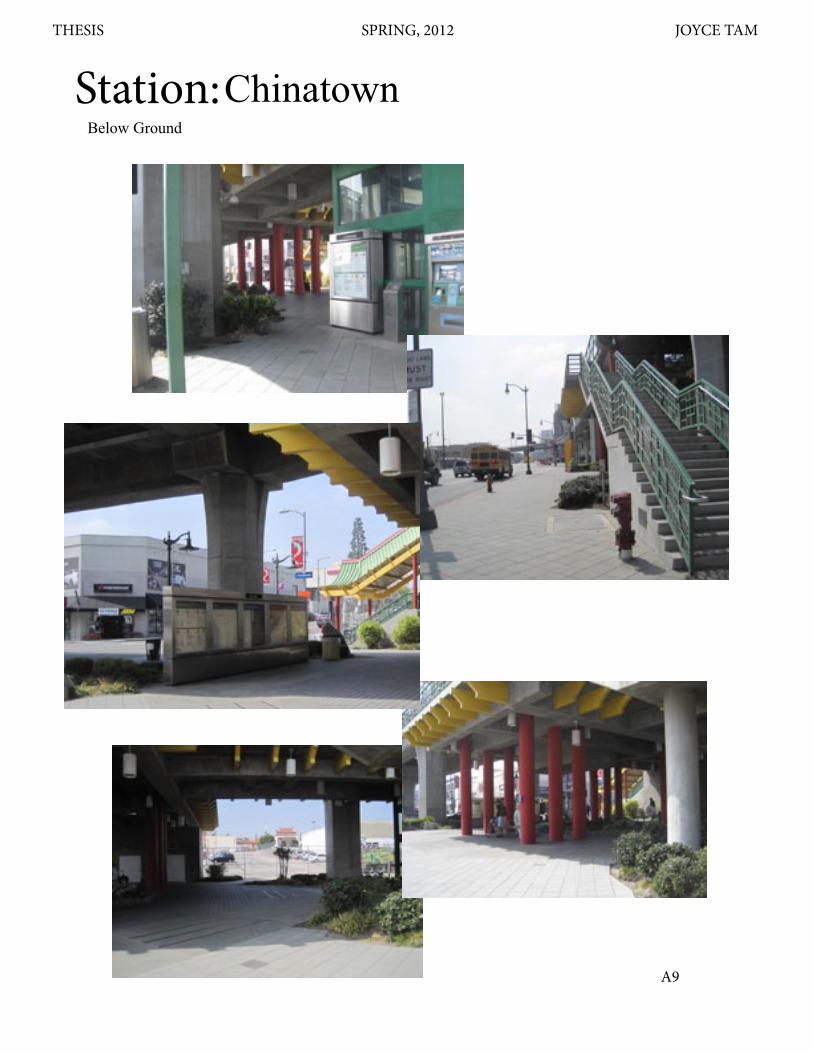
A9
THESIS SPRING, 2012 JOYCE TAM
ChinatownStation:Below Ground
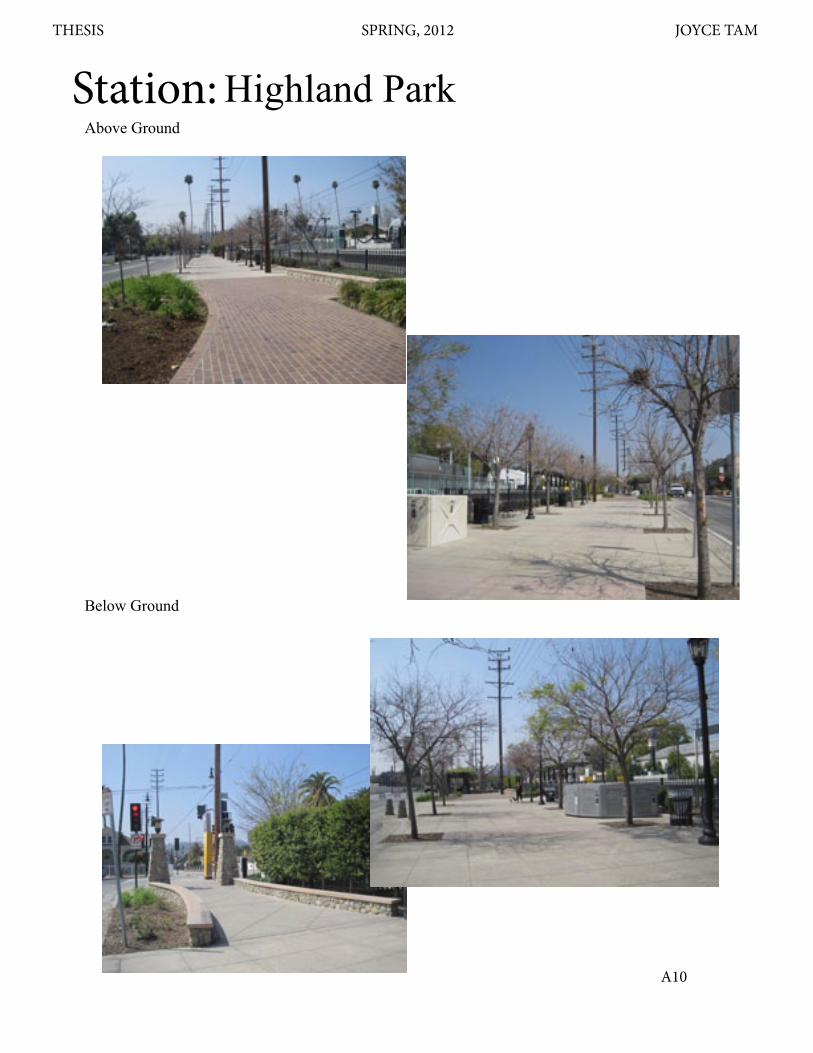
Station:Above Ground
Below Ground
A10
THESIS SPRING, 2012 JOYCE TAM
Highland Park
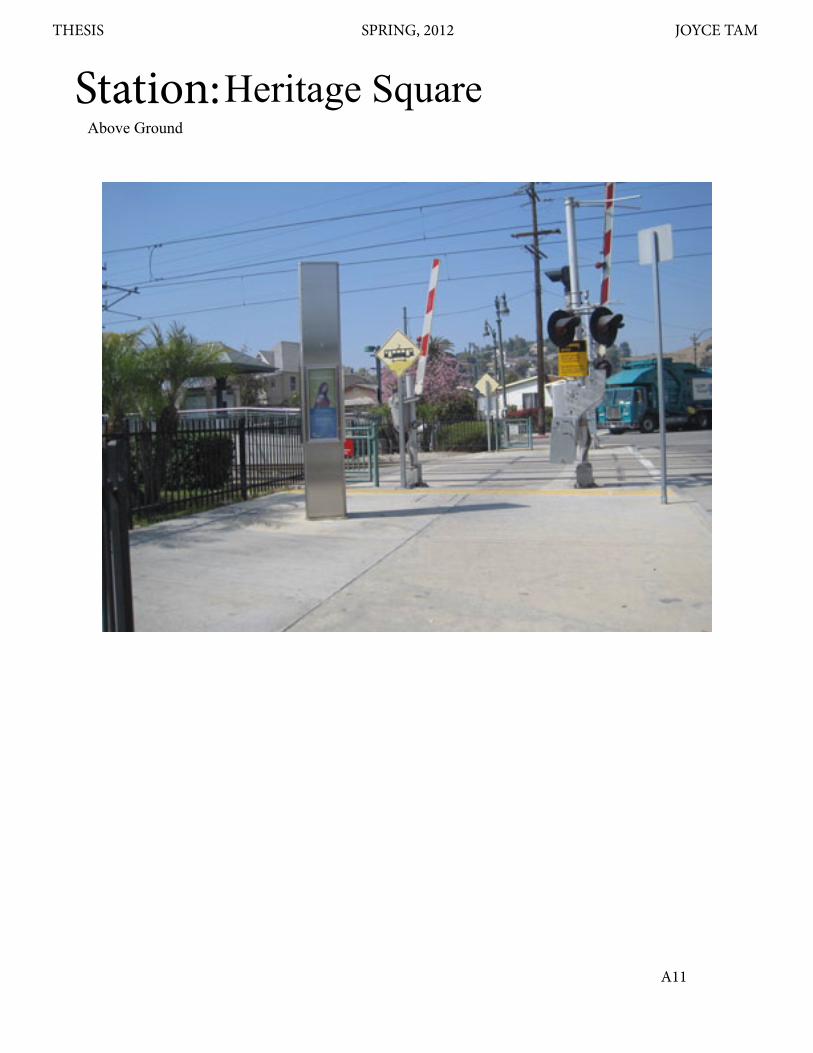
A11
THESIS SPRING, 2012 JOYCE TAM
Heritage SquareStation:Above Ground
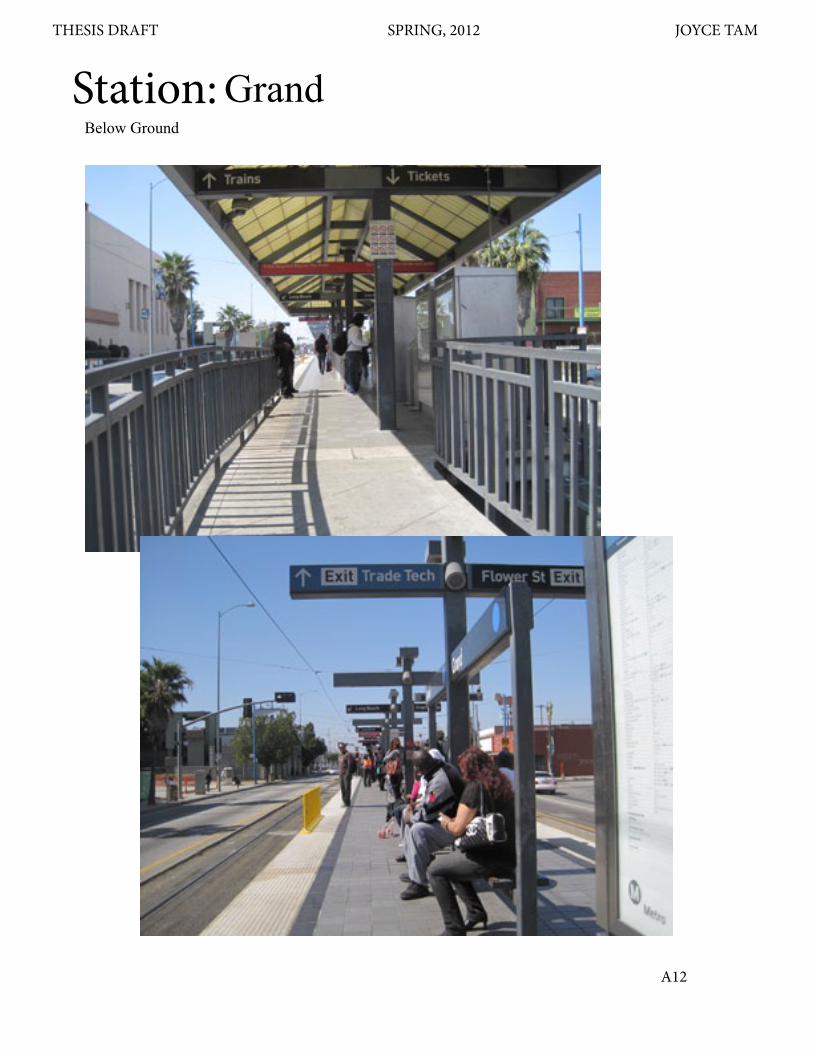
A12
THESIS DRAFT SPRING, 2012 JOYCE TAM
GrandStation:Below Ground

A13
THESIS SPRING, 2012 JOYCE TAM
Station:Above Ground
A13
Vernon
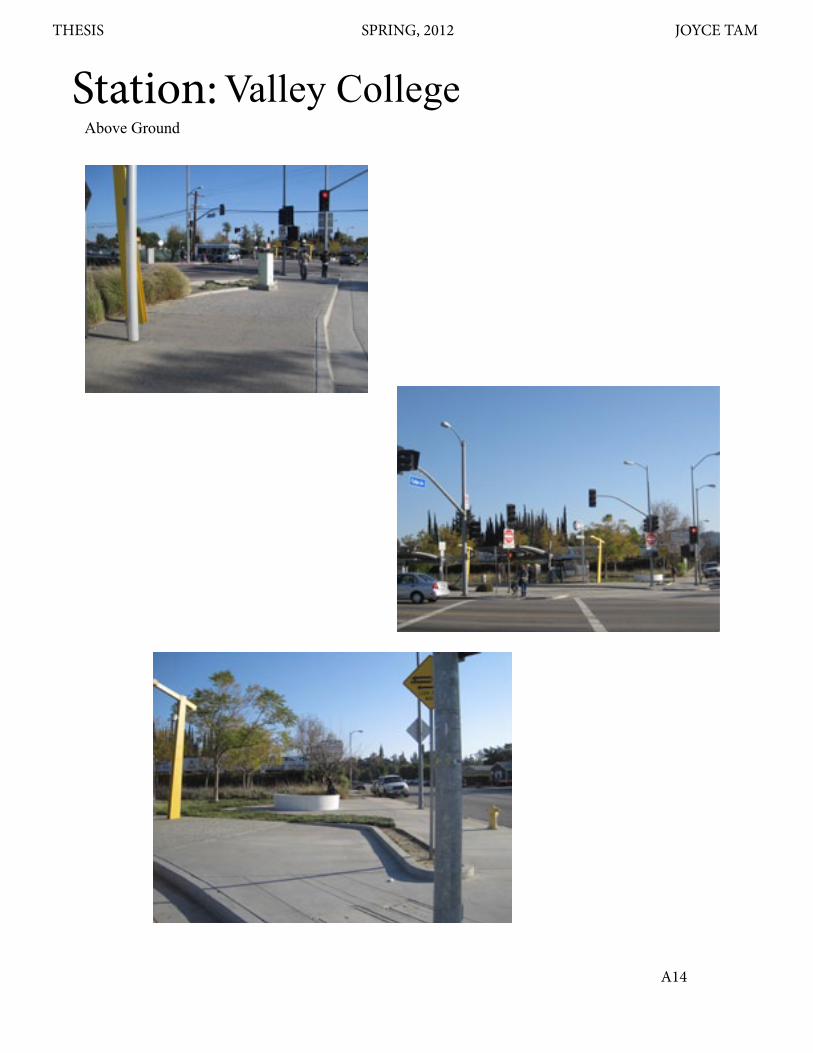
A14
THESIS SPRING, 2012 JOYCE TAM
Station:Above Ground
Valley College
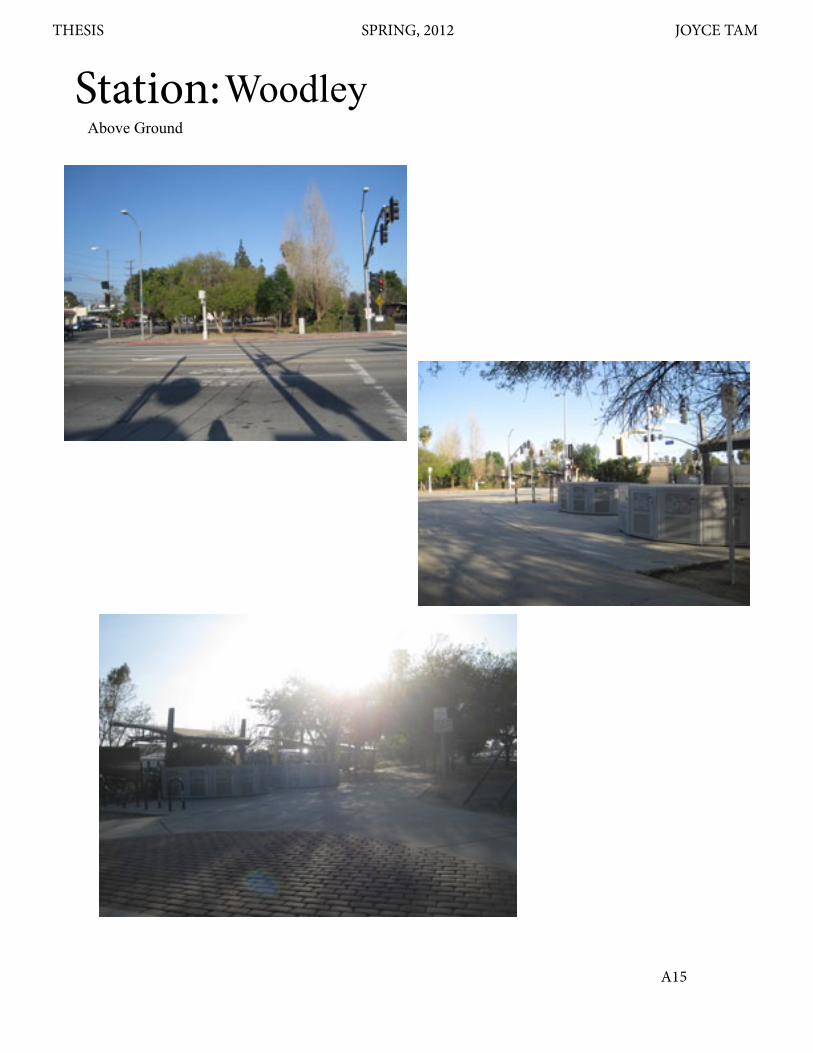
A15
THESIS SPRING, 2012 JOYCE TAM
WoodleyStation:Above Ground
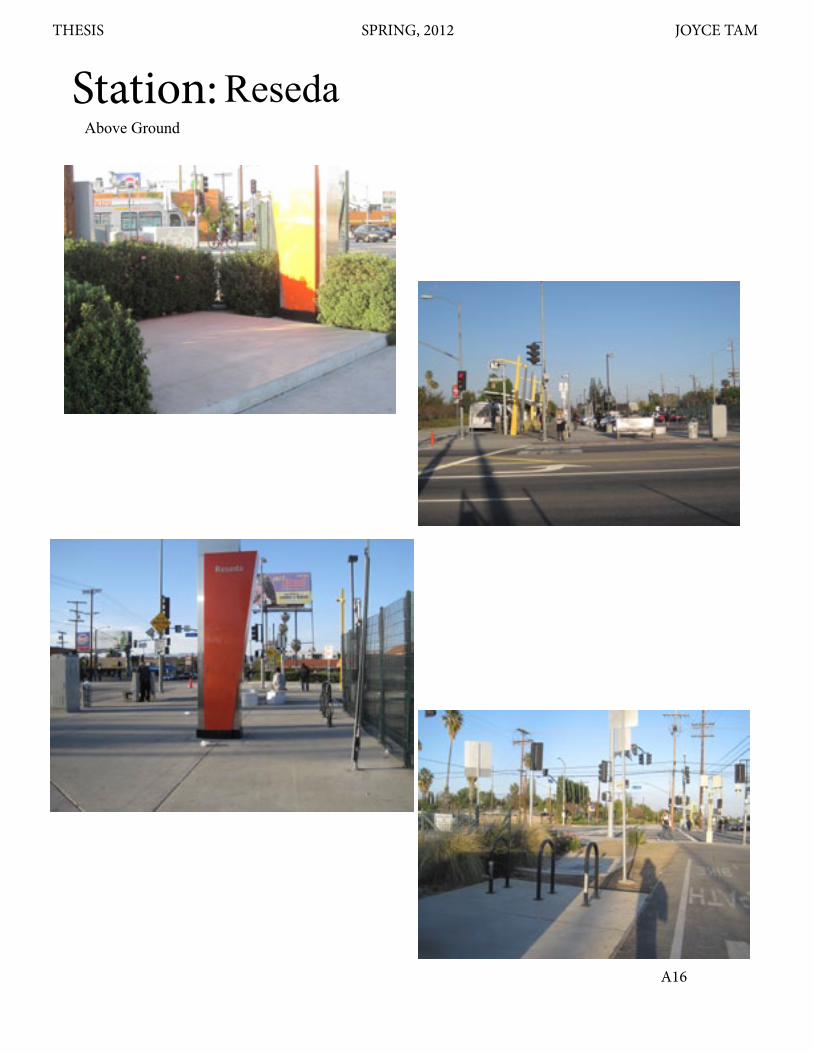
A16
THESIS SPRING, 2012 JOYCE TAM
Station:Above Ground
Reseda
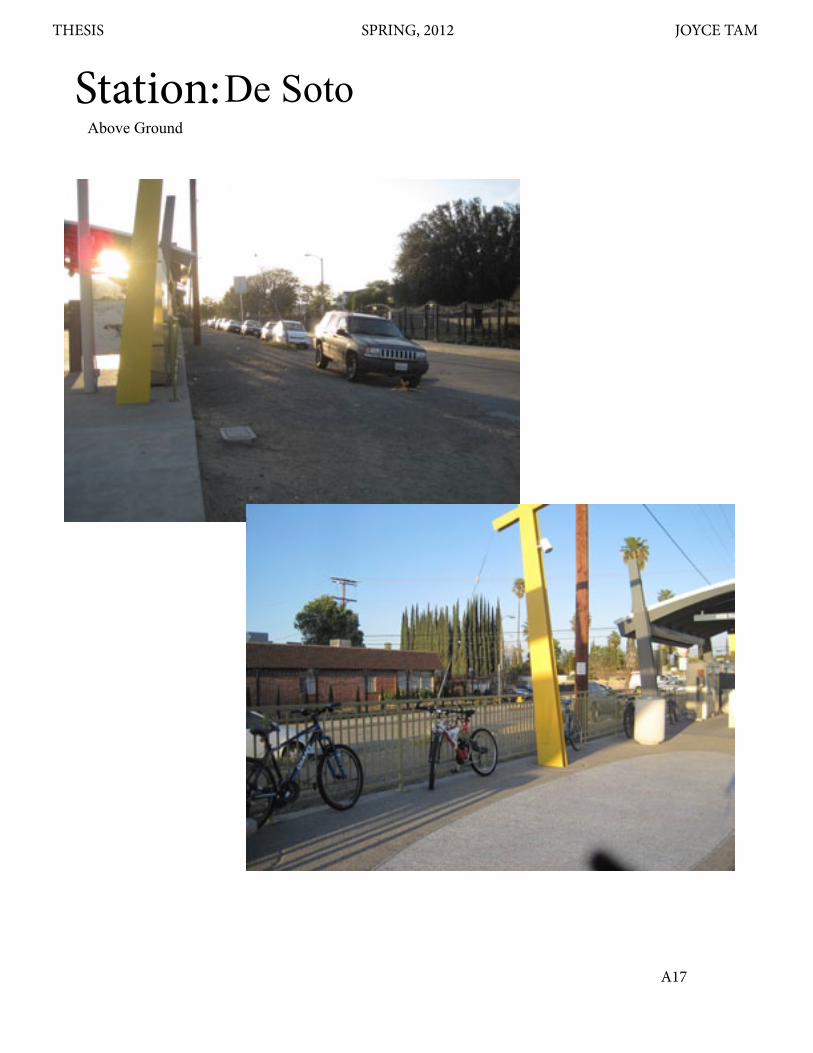
A17
THESIS SPRING, 2012 JOYCE TAM
De SotoStation:Above Ground