american educational research journal ...cepa.stanford.edu/sites/default/files/4.full_.pdf · how...
TRANSCRIPT

http://aerj.aera.netJournal
American Educational Research
http://aer.sagepub.com/content/50/1/4The online version of this article can be found at:
DOI: 10.3102/0002831212463813
2013 50: 4 originally published online 23 October 2012Am Educ Res JMatthew Ronfeldt, Susanna Loeb and James Wyckoff
How Teacher Turnover Harms Student Achievement
Published on behalf of
American Educational Research Association
and
http://www.sagepublications.com
can be found at:American Educational Research JournalAdditional services and information for
http://aerj.aera.net/alertsEmail Alerts:
http://aerj.aera.net/subscriptionsSubscriptions:
http://www.aera.net/reprintsReprints:
http://www.aera.net/permissionsPermissions:
What is This?
- Oct 23, 2012OnlineFirst Version of Record
- Jan 15, 2013Version of Record >>
by guest on January 26, 2013http://aerj.aera.netDownloaded from

How Teacher Turnover Harms StudentAchievement
Matthew RonfeldtUniversity of Michigan
Susanna LoebStanford University
James WyckoffUniversity of Virginia
Researchers and policymakers often assume that teacher turnover harms stu-dent achievement, though recent studies suggest this may not be the case.Using a unique identification strategy that employs school-by-grade levelturnover and two classes of fixed-effects models, this study estimates the ef-fects of teacher turnover on over 850,000 New York City fourth- and fifth-grade student observations over 8 years. The results indicate that studentsin grade levels with higher turnover score lower in both English languagearts (ELA) and math and that these effects are particularly strong in schoolswith more low-performing and Black students. Moreover, the results suggestthat there is a disruptive effect of turnover beyond changing the distributionin teacher quality.
KEYWORDS: student achievement, teacher turnover, retention
MATTHEW RONFELDT is an assistant professor of educational studies at the University ofMichigan, 610 E. University Ave., Rm. 4216A, Ann Arbor, MI 48109-1259; e-mail: [email protected]. His scholarship focuses on teacher education, particularly on pre-service field experiences including student teaching. He also studies teacher quality,teacher retention, teacher identity, and teacher assessment.
SUSANNA LOEB is the Barnett Family Professor of Education and director of the Centerfor Education Policy Analysis at Stanford University. Susanna studies the relationshipbetween schools and federal, state, and local policies, focusing particularly onteacher and school leader labor markets and education finance.
JAMES WYCKOFF is the Curry Memorial Professor of Education and Policy and directorof the Center for Education Policy and Workforce Competitiveness at the Universityof Virginia. His research focuses on issues of teacher labor markets: teacher prepara-tion, recruitment, assessment, and retention.
American Educational Research Journal
February 2013, Vol. 50, No. 1, pp. 4–36
DOI: 10.3102/0002831212463813
� 2012 AERA. http://aerj.aera.net
by guest on January 26, 2013http://aerj.aera.netDownloaded from

Introduction
Teacher turnover rates can be high, particularly in schools serving low-income, non-White, and low-achieving student populations. Nationally,about 30% of new teachers leave the profession within 5 years, and the turn-over rate is about 50% higher in high-poverty schools as compared to moreaffluent ones (Darling-Hammond & Sykes, 2003; Ingersoll, 2001, 2003).1
Teacher turnover rates also tend to be higher in urban and lower-performingschools (Hanushek, Kain, & Rivkin, 1999).
Researchers and policymakers often assume that teacher turnover harmsstudent learning. There are reasons to think it would, as institutional memoryis lost and resources get used on the hiring process. On the other hand, theorganizational management literature has demonstrated that some turnovermay in fact be beneficial. Turnover, for example, can result in better person-job matches and infusion of new ideas into organizations (Abelson &Baysinger, 1984). To this point, Jackson (2010) demonstrates that poorperson-job matches predict migration and that teachers tend to be more pro-ductive in their new schools. Moreover, turnover can have institutional ben-efits if the less effective employees leave.
Surprisingly little research has assessed the causal effect of teacher turn-over on student achievement (Guin, 2004; Ingersoll, 2001). Most existingresearch on the relationship between teacher turnover and student achieve-ment is correlational, revealing negative correlations. For example, Guin(2004) studies 66 elementary schools in a large urban district to look atthe relationship between school-level turnover and the proportion of stu-dents meeting standards on statewide assessments in reading and math.Pearson correlations are significant and negative, indicating that schoolswith higher turnover also have lower achievement. These results are consis-tent with other correlational evidence (Boyd, Lankford, Loeb, & Wyckoff,2005; Hanushek et al., 1999). Such evidence, though, is not necessarily indic-ative of a causal relationship, as a third factor (e.g., poverty, working condi-tions, or poor school leadership) may simultaneously cause both lowachievement and higher turnover. Even if we assume the relationship isa causal one, its direction is unclear—teachers leaving may cause lowachievement, but low achievement may also cause teachers to leave.
‘‘Compositional’’ Explanations
One mechanism by which turnover may directly affect students is ‘‘com-positional.’’ That is, if there is a difference in quality between teachers wholeave and those who replace them, then student achievement can change.When leaving teachers are, on average, worse than those who replacethem, the compositional effect of turnover on student achievement is posi-tive; if leaving teachers are better than the ones who replace them, the com-positional effect is negative.
How Teacher Turnover Harms Student Achievement
5
by guest on January 26, 2013http://aerj.aera.netDownloaded from

A growing body of evidence indicates that more effective teachers are atleast as likely, and sometimes more likely, to stay in schools than their lesseffective peers and that this is true even in schools with historically under-served student populations (Boyd, Lankford, Loeb, Ronfeldt, & Wyckoff,2011b; Goldhaber, Gross, & Player, 2007; Hanushek & Rivkin, 2010;Murnane, 1984). Boyd et al. (2011b) study data on teachers’ applicationsfor transfer to uncover which teachers are more likely to want to transferfrom New York City (NYC) schools. They discover that teachers who pro-duce higher achievement gains and those with more experience are lesslikely to apply for transfer.2 This preference to stay held true even for teach-ers in the lowest performing schools. Earlier work by Murnane (1984) alsofinds evidence for selective attrition of less productive teachers, as signaledby principal ratings and prior student achievement, out of one large, urbandistrict. Similarly, Hanushek and Rivkin (2010) show that in Texas, thosewho left a given school tended to be less effective than those who stayed.
Contrary to common assumptions, in the Hanushek and Rivkin (2010)study the relative effectiveness of stayers as compared to leavers is actuallyhighest in schools with more low-achieving and Black students even thoughdiscussion about the harmful impact of teacher turnover often focuses onlow-income, low-achieving, and high-minority schools (Carroll, Reichardt,& Guarino, 2000; Clotfelter, Ladd, Vigdor, & Wheeler, 2007; Hanusheket al., 2004; Ingersoll, 2001). In other words, the exiting teachers, at leastcompositionally, seem to benefit schools with historically underserved stu-dent populations the most.
In demonstrating that less effective teachers are more likely to leave thanmore effective counterparts, the studies described previously suggest turn-over may be beneficial. However, none of these studies directly testedwhether the teachers who filled vacancies in a given school were more effec-tive on average than those they replaced. Darling-Hammond and Sykes(2003) argue that when teachers leave, low-income schools have a difficulttime attracting new teachers and so end up hiring inexperienced and lessprepared teachers. Without knowing the net distribution of quality that re-sults from turnover, it is difficult to draw conclusions about the overallimpact of turnover. Recognizing this point, Hanushek and Rivkin (2010) sim-ulated the impact where only ‘‘rookie’’ teachers replaced exiting ones andfound no overall effect of turnover on student achievement.
The results of the Hanushek and Rivkin (2010) simulation are an impor-tant challenge to the commonly held assumption that teacher turnoverharms student achievement, especially that of low-performing, low-income,and non-White students. However, their findings have important limitations,even aside from being simulated, rather than observed, effects of new hires.Like all compositional accounts, the results assume that the only lever bywhich teacher turnover harms or helps student achievement is by adjustingthe composition of teachers that make up a school’s faculty. But turnover
Ronfeldt et al.
6
by guest on January 26, 2013http://aerj.aera.netDownloaded from

may impact student achievement beyond the relative effectiveness of thosewho stay as compared to those who leave.
‘‘Disruptive’’ Explanations
The compositional explanations described previously assume that stu-dents benefit when their school hires teachers who are more effectivethan the ones who left. Effectiveness is thought to be something that individ-ual teachers bring with them (or not). The overall effect of turnover dependson the resulting distribution in effectiveness of individual teachers. If leavingteachers are equally as effective as those who replace them, then thereshould be no net effect of turnover. In such compositional explanations,turnover effects are driven only by leavers and their replacements. The stu-dents of teachers who stay in the same school from one year to the next thenare merely bystanders, unaffected by turnover.
Turnover, however, may have a broader organizational influence thatreaches beyond leaving teachers, replacement teachers, and their students.Where turnover is considered to have a disruptive organizational influence,all members of a school community are vulnerable, including staying teach-ers and their students. In such disruptive accounts of turnover, even whenleaving teachers are equally as effective as those who replace them, turnovercan still impact students’ achievement.
A substantial research base provides evidence that staff cohesion andcommunity are related to student engagement and achievement (Bryk, Lee,& Holland, 1993; Bryk & Schneider, 2002; Johnson, Berg, & Donaldson,2005; Little, 1982; Louis & Marks, 1998). According to Bryk and Schneider(2002), the quality of relationships and the trust between teachers, andbetween teachers and students, predicts student achievement. Likewise,Little (1982) finds ‘‘patterned norms’’ of interaction among colleagues thatalso predict student achievement. When teachers leave schools, previouslyheld relationships and relational patterns are altered. To the degree that turn-over disrupts the formation and maintenance of staff cohesion and commu-nity, it may also affect student achievement. Guin (2004) shows that teacherturnover indeed has a negative effect on faculty interactions and school cli-mate. Likewise, a recent study by Hanselman, Grigg, Bruch, and Gamoran(2011) indicates that teacher and principal turnover has a disruptive effecton the ‘‘development and maintenance of social resources’’ (p. 27)—includingstaff collegiality, community, and trust—in a school. Moreover, these authorsfind the impact of turnover to be initially detrimental to ‘‘high resource’’schools and initially beneficial to ‘‘low resource’’ schools. In other words,the disruptive influence of turnover can have either positive or negative effectsdepending on a school’s initial conditions.
School instructional program coherence has also been shown to predictstudent achievement (Newman, Smith, Allensworth, & Bryk, 2001). Since
How Teacher Turnover Harms Student Achievement
7
by guest on January 26, 2013http://aerj.aera.netDownloaded from

staff turnover presents significant challenges to the successful and coherentimplementation of such instructional programs (Guin, 2004), it also mayharm student achievement. With leaving teachers goes organizationalknowledge important to the effective implementation of such programs(Abelson & Baysinger, 1984). Moreover, newly hired teachers initially lackessential knowledge and skills to implement an unfamiliar instructional pro-gram, so must be brought up to speed before institutional progress can bemade. The result in settings with persistent turnover then is that schoolsare continuously starting over rather than making progress on their program-matic agendas.
Turnover may have substantial impact on the financial and human re-sources in districts and schools as well. The recruiting, hiring, and trainingof new teachers requires significant financial costs (Barnes, Crowe, &Schaefer, 2007). These costs drain resources that might otherwise be spenton program improvement or working conditions (Barnes et al., 2007;Carroll et al., 2000; Darling-Hammond & Sykes, 2003). Such dynamics mayharm schools with historically underserved student populations the most,as these schools tend to have more persistent turnover and in some caseshave fewer overall resources to work with. In addition, new hires in under-served schools often are less experienced and so require more supports toimprove (Carroll et al., 2000; Darling-Hammond & Sykes, 2003).
Contrary to compositional explanations that assume stayers to be unaf-fected by turnover, disruptive explanations indicate that stayers indeed maybe affected. Because they bear much of the responsibility for mentoring newteachers about school expectations and programs, stayers can also beaffected by turnover (Guin, 2004). Stayers must carry more of the instruc-tional burden and have less professional development resources availableto them, as available resources get used up on new hires (Shields et al.,1999, 2001). Persistent turnover may then have a debilitating impact on stay-ing teachers and in turn their students.
We have provided a review of literature that describes many plausiblemechanisms—both compositional and disruptive—by which teacher turn-over may affect student achievement. Because prior research has not ade-quately established a direct, causal link between teacher turnover andstudent achievement, however, it is important first to establish that sucha relationship exists before trying to explain why. Using a unique identifica-tion strategy and two classes of fixed-effects regression models, this studypresents the cleanest estimates to date for a direct effect of teacher turnoveron student achievement. After establishing evidence for a direct effect ofturnover on student achievement, this article begins to explore possiblemechanisms to account for the observed effect.
Three research questions guide the investigation:
Ronfeldt et al.
8
by guest on January 26, 2013http://aerj.aera.netDownloaded from

Research Question 1: What is the average effect of teacher turnover on studentachievement?Research Question 2: Are the effects different for different kinds of schools?Research Question 3: What explains the relationship between teacher turnoverand student achievement?
To address the latter question, the study explores whether observed effectsare compositional or disruptive in nature.
The article proceeds as follows. We first describe the data and method-ological approach. We then present the results and conclude with a discus-sion of the implications of the findings.
Data
This study draws on extensive administrative data from the New YorkCity Department of Education and the New York State EducationDepartment. Analyses focus on approximately 850,000 observations offourth- and fifth-grade students across all NYC elementary schools over eightacademic years (2001–2002 and 2005–2010).3 We are able to link student testscores in math and English language arts (ELA) to student, class, school, andteacher characteristics.
Table 1 describes student-year, teacher-year, and school-by-grade-by-year characteristics. During the years of this study, about 70% of studentsin fourth and fifth grades in NYC were either Black or Hispanic. Overone-third of students had a home language other than English, and 72%were on free or reduced priced lunch. Approximately 1% of students hadbeen suspended in the previous year, while 9% had switched schools sincethe prior year. Finally, students were absent for an average of approximately11 days in the previous year.
On average, 86% of teachers each year had stayed in the same schoolfrom the prior year (stayers). Approximately 4% of fourth- and fifth-gradeteachers had transferred schools within NYC (movers), while 9% werefirst-year teachers. The fourth- and fifth-grade teachers in the district had,on average, 8 years of experience. Each fourth and fifth grade within eachNYC school had, on average, 5 teachers, with a range from 1 to as manyas 20 teachers. Figure 1 plots the distribution of teachers per grade in thesample schools.
Our identification strategy requires measuring school-by-grade levelturnover in each year. Such measurement is not entirely straightforward.To illustrate, imagine a fourth grade within School A that had six teachersin year t – 1. Due to increasing enrollments, in year t there were sevenfourth-grade teachers. Of these, five were stayers, one a mover, and onea first-year teacher. Teacher turnover could be estimated as the proportionof year t – 1 teachers that were no longer in the fourth grade in School A
How Teacher Turnover Harms Student Achievement
9
by guest on January 26, 2013http://aerj.aera.netDownloaded from
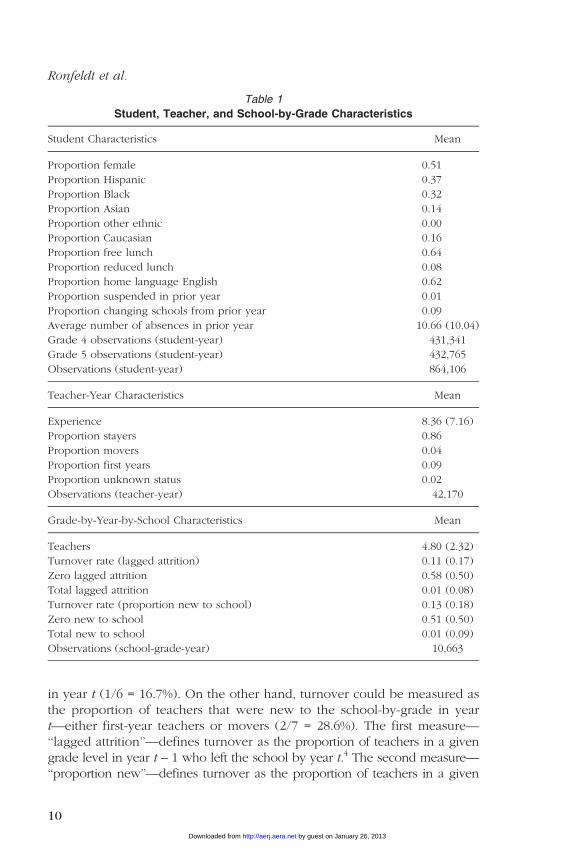
in year t (1/6 = 16.7%). On the other hand, turnover could be measured asthe proportion of teachers that were new to the school-by-grade in yeart—either first-year teachers or movers (2/7 = 28.6%). The first measure—‘‘lagged attrition’’—defines turnover as the proportion of teachers in a givengrade level in year t – 1 who left the school by year t.4 The second measure—‘‘proportion new’’—defines turnover as the proportion of teachers in a given
Table 1
Student, Teacher, and School-by-Grade Characteristics
Student Characteristics Mean
Proportion female 0.51
Proportion Hispanic 0.37
Proportion Black 0.32
Proportion Asian 0.14
Proportion other ethnic 0.00
Proportion Caucasian 0.16
Proportion free lunch 0.64
Proportion reduced lunch 0.08
Proportion home language English 0.62
Proportion suspended in prior year 0.01
Proportion changing schools from prior year 0.09
Average number of absences in prior year 10.66 (10.04)
Grade 4 observations (student-year) 431,341
Grade 5 observations (student-year) 432,765
Observations (student-year) 864,106
Teacher-Year Characteristics Mean
Experience 8.36 (7.16)
Proportion stayers 0.86
Proportion movers 0.04
Proportion first years 0.09
Proportion unknown status 0.02
Observations (teacher-year) 42,170
Grade-by-Year-by-School Characteristics Mean
Teachers 4.80 (2.32)
Turnover rate (lagged attrition) 0.11 (0.17)
Zero lagged attrition 0.58 (0.50)
Total lagged attrition 0.01 (0.08)
Turnover rate (proportion new to school) 0.13 (0.18)
Zero new to school 0.51 (0.50)
Total new to school 0.01 (0.09)
Observations (school-grade-year) 10,663
Ronfeldt et al.
10
by guest on January 26, 2013http://aerj.aera.netDownloaded from

grade level who are new (movers or first-year teachers) to the school in year t.We used both measures in all analyses to test whether results were robust acrossthem; the distributions for school-by-grade lagged attrition (averaged over 8years) can be seen in Figure 2 and for school-by-grade proportion new (aver-aged over 8 years) in Figure 3. The measures have similarly shaped distribu-tions, bell shaped with a right skew.
The average teacher turnover rate in each grade in each school in eachyear was similar for both of the measures we developed: .11 for the laggedattrition measure and .13 for the proportion new measure. Thus, each year,approximately 1 out of every 10 fourth- and fifth-grade teachers in NYC leftor came to a given grade level in a given school. At the school-grade-yearlevel, the two measures have a correlation of r = .27.5 Lagged attrition couldresult from teachers leaving the profession altogether or transferring toanother school. This measure does not include the transfer of teachersfrom one grade to another within the same school. We chose not to includethis behavior because in such cases, the expertise of teachers would remainwithin the same school.6 About one-half of school-by-grades experienced noteacher turnover each year (between 51% and 58%). On the other hand,each year around 1% of fourth- and fifth-grade level teams had turnoverrates of 100%.7
Figure 1. Distribution of number of teachers per school by grade.
How Teacher Turnover Harms Student Achievement
11
by guest on January 26, 2013http://aerj.aera.netDownloaded from

Methods
As described previously, three questions drive our analyses: What is theaverage effect of teacher turnover on student achievement? Are the effectsdifferent for different kinds of schools? And what explains the relationshipbetween teacher turnover and student achievement?
What is the average effect of teacher turnover on student achievement?Typically teacher turnover is measured at the school level. However, highturnover rates in the sixth grade may have little impact on incomingfourth-grade students, especially when the fourth-grade level team staysintact. To get a more precise estimate of the effects of turnover, this studyexamines turnover at the school-by-grade-by-year level, rather than at theschool or school-by-year level. Another benefit of examining school-by-grade-by-year level turnover is that we can adjust for school-by-grade orschool-by-year level factors that could influence both student achievementand turnover. For example, if the school’s principal leaves, then the transi-tion could simultaneously affect both turnover and achievement. If we donot measure this effect, then our results would be biased, showing an asso-ciation between turnover and achievement even if no causal relationship ex-ists. Focusing on school-by-grade-by-year level turnover allows us to adjustfor school-by-year level factors, both observed and not observed.
Figure 2. Distribution of ‘‘lagged attrition’’ turnover measure.
Ronfeldt et al.
12
by guest on January 26, 2013http://aerj.aera.netDownloaded from

For each analysis we use two different estimation strategies to study theeffects of school-by-grade-by-year level teacher turnover on studentachievement. First, we use regression models with school-by-grade fixed ef-fects to leverage variation in turnover across years within the same gradelevel and school. This allows us to examine whether students within thesame grade level and within the same school had better or worse test scoregains in a given year, as compared to other years when teacher turnover wasat different rates. These models assume that the effects of turnover in thesame school and grade level are comparable across years. These estimatescan be affected by shocks that occur to a school in a particular year, suchas a new principal, that may influence both teacher turnover and studentachievement. To try to mitigate these influences and use more idiosyncraticvariation, we add extensive controls—for prior student achievement andother student, class, school, grade, and teacher characteristics. Equation 1summarizes the regression model used for these analyses:
Aitgsy5b0 þ b1Aitgsðy�1Þ þ b2OtherAitgsðy�1Þ þ b3Xitgsy
þb4Ctgsy þ b5Ssy þ fy þ nsy þ b6Tgsy þ eitgsy: ð1Þ
Figure 3. Distribution of ‘‘proportion new’’ turnover measure.
How Teacher Turnover Harms Student Achievement
13
by guest on January 26, 2013http://aerj.aera.netDownloaded from

The test performance of individual i, with teacher t, in grade g, in school s,in time y is a function of his or her test performance in that subject, A, andthe other subject, OtherA, in the prior year, student background characteris-tics, X, time-varying classroom characteristics, C, time-varying school charac-teristics, S, year fixed effects, f, grade-by-school fixed effects, n, the grade-by-school-by-year turnover measure, T, and an error term, E. To account forthe nonindependence of turnover rates within a grade-by-school unit overtime, we cluster the standard errors at the grade-by-school-by-year level.
In our second method of analysis, we use school-by-year, instead ofschool-by-grade, fixed effects to capitalize on turnover variation acrossgrades within the same year and school. The advantage of the secondmethod is that year-to-year variations—like bringing in a new principal, asdescribed previously—cannot explain observed effects; however, the disad-vantage is that it assumes turnover rates have comparable effects on studentachievement at different grade levels. All models control for prior studentachievement, but we also control for other student, class, school, grade,and teacher characteristics depending on the analysis. Equation 2 describesthe second method of analysis:
Aitgsy5b0 þ b1Aitgsðy�1Þ þ b2OtherAitgsðy�1Þ þ b3Xitgsy
þb4Ctgsy þ b5Ssy þ fy þ nsy þ b6Tgsy þ eitgsy: ð2Þ
The test performance of individual i, with teacher t, in grade g, in school s,in time y is a function of his or her test performance in that subject, A, andthe other subject, OtherA, in the prior year, student background characteris-tics, X, time-varying classroom characteristics, C, time-varying school charac-teristics, S, grade fixed effects, f, year-by-school fixed effects, n, the grade-by-school-by-year turnover measure, T, and an error term, E. To account forthe nonindependence of turnover rates within a year-by-school unit acrossgrade levels, we cluster the standard errors at the grade-by-school-by-yearlevel.
A potential concern with the fixed-effect approaches is that there mightnot be enough variation in the turnover within the groups (e.g., within thegrade in a particular school over time or across grades within a particularschool in a particular year). However, we find that there is substantial vari-ation within our groups. Almost three-quarters of the variation is withingroups for both turnover measures when using school-by-grade fixed ef-fects. Within-group variation is lower in models employing school-by-yearfixed effects—42% for lagged attrition and 36% for proportion new.
The fixed effects models described previously are two of many possibleapproaches to estimating the effects of turnover on student achievement.One alternative is a repeated measures, multilevel analysis with student out-comes on the left-hand side of the equation and student-specific random
Ronfeldt et al.
14
by guest on January 26, 2013http://aerj.aera.netDownloaded from

intercept and growth terms on the right-hand side. One possible advantageof this alternative approach would be that the multilevel nature directly ad-justs for the grouping of students within grade-by-school-by-year units, thelevel at which turnover is measured in our study. By clustering the standarderrors at the school-by-grade-by-year level in our fixed-effects approach, weadjust for this nested structure; thus, an explicit multilevel structure wouldnot provide more appropriate standard errors than our models. Anotherpotential advantage of the alternative approach is that test scores, whichare measured with error, do not appear on the right-hand side of the equa-tion. Measurement error in these variables can bias the estimates on the co-efficients for teacher turnover. Though our models do include test scores onthe right-hand side, these include prior performance in both tested subjects(i.e., math and ELA), as well as time-varying classroom-level averages onthese tests. Each of these measures is an imperfect signal for a student’sincoming potential for achievement based on information from the previousyear. By combining these variables to signal students’ potential, we reducethe measurement error that we would have were we to include only oneof these measures. An additional benefit of the fixed-effects approach weuse is that repeated measures value-added models (VAMs) tend to be diffi-cult to estimate with large samples. Fixed-effects models with least squaresestimation often converge without difficulty under circumstances wheremaximum likelihood estimation of repeated measures VAMs is infeasible.Finally, in a study comparing models for estimating teachers’ value-addedto student test performance, McCaffrey, Lockwood, Koretz, Louis, andHamilton (2004) compare fixed-effects and repeated measures approaches.In regards to a teacher’s value-added, they find fault with the assumptionthat treatment effects fully persist, an underlying assumption of the repeatedmeasures approach.
Another alternative to our approach is to model gain scores as the out-come. Compared to this alternative, an advantage of our approach is that itallows for performance in the other academic areas to affect learning in thefocal area. Our approach also does not assume that students who start at dif-ferent levels necessarily gain the same amount, on average, across time,a questionable assumption behind the alternative growth model. For exam-ple, if a student scores particularly well in one year, our approach accountsfor the possibility that he or she may be more likely to have smaller gains thefollowing year.
Are the effects of turnover different in different kinds of schools? To bet-ter understand the nature of observed effects, we examine whether the rela-tionship between teacher turnover and student achievement varies indifferent kinds of schools. As described in the Introduction, many have sug-gested turnover to be a particularly pernicious problem in schools with his-torically underserved student populations, especially given that the turnoverrates tend to be higher in these settings. To test this, we run models
How Teacher Turnover Harms Student Achievement
15
by guest on January 26, 2013http://aerj.aera.netDownloaded from

separately in low- versus high-performing schools and in low versus highpercentage Black schools. In particular, we constrain our sample only toschools whose students averaged below the test score mean and then repro-duce the analyses described previously. We then repeat this process with oursample constrained only to schools that had 20% or more Black students.8
For comparison’s sake, we also examine schools with students scoring ator above the mean on test scores and with Black student populations ofless than 20%.
Additionally, during the period of this study, NYC opened a number ofnew schools, many of which were small and expanding. Given the uniquechallenges that new schools face, high rates of teacher turnover are morecommon (Hemphill, Nauer, Zelon, & Jacobs, 2009). National trends also indi-cate that small schools tend to have higher rates of teacher turnover (Ingersoll,2001; Ingersoll & Rossi, 1995). We wondered whether the effects of turnovermight then be particularly salient in new and small schools in NYC. Moreover,some have suggested school size to be related to staff cohesion and commu-nity (Bryk, Camburn, & Seashore Louis, 1999), which, as described in theIntroduction, predict both teacher turnover and student achievement.
To explore whether the effects of turnover may vary in new and in smallschools, we run models separately for large versus small schools and for newversus old schools. We classify ‘‘new’’ schools as not yet existing in 2001 and‘‘old’’ schools as existing in or prior to 2001 and run models separately foreach group. We classify ‘‘small’’ schools as having fewer than four teachersper grade level and ‘‘big’’ schools as having four or more teachers per gradelevel and run analyses separately for each group.
What explains the relationship between teacher turnover and studentachievement? As described in the Introduction, there are many possible ex-planations for the effects of turnover that we estimate in Equations 1 and 2.Turnover may affect achievement because the teachers who replace thosewho left are either more or less effective (we refer to this as the ‘‘composi-tional’’ explanation). Alternatively, even where arriving and leaving teachersare equally effective, turnover may cause a broad disruption that impacts allstudents, including students of teachers who did not transition (we refer tothis as the ‘‘disruption’’ explanation).
To examine the effect of differentially effective teachers (compositionalexplanation), we try controlling for different signals for teacher quality. Adrawback to this approach of controlling for measured teacher characteris-tics is that there may be unmeasured characteristics of teachers that differbetween new and remaining teachers that affect student performance.First, we add teacher experience indicator variables for the number of yearsof experience for each teacher in our data set (leaving out first-year teachersas the reference group) to see whether any observed turnover effects aredriven by changes in the distribution of teachers’ experience. We then addto our models an indicator variable for teachers who migrated from
Ronfeldt et al.
16
by guest on January 26, 2013http://aerj.aera.netDownloaded from

a different school in the previous year to test whether observed effects aredriven by teachers who are new to schools being worse.
While there is no perfect way of measuring teacher effectiveness, regression-based, value-added measures are increasingly common. We also run models thatcontrol for teachers’ average prior value-added to examine whether effects aredriven by distributional changes in effectiveness resulting from teachers leavingand entering grade-level teams.9 We can calculate average prior value-addedscores for a subsample of teachers in the sample.10 Due to missing data, ouroverall sample sizes are reduced substantially—from about 850,000 studentobservations to about 670,000 for both math and ELA.
As described in the Introduction, if only compositional, and not disrup-tive, effects are at work, we should not then see an effect of turnover on thestudents of teachers who were in the same grade-by-school group in theprior year (i.e., students of ‘‘stayers’’). To test whether turnover has a disrup-tive force on student achievement beyond changing the distribution ofteacher effectiveness, we rerun our analyses but only for students of stayers.More specifically, we constrain our sample only to teachers (and their stu-dents) who remained in the same grade and school from the previousyear (stayers) and use models described in Equations 1 and 2 to estimatethe effects of turnover on this subpopulation. In models with school-gradefixed effects, we compare the effects of turnover on the achievement of stu-dents of only stayers in a given grade level and school to the students ofstayers in the same grade level and school but in different years. In modelswith school-year fixed effects, we compare the effects of turnover on theachievement of students of only stayers in a given year and school to the stu-dents of stayers in the same year and school but in a different grade level.For comparison’s sake, we repeat this strategy by constraining our sampleonly to those teachers who stayed in NYC but migrated from a differentschool in the previous year (movers) and then by constraining the sampleonly to teachers (and their students) who are first-year (rookie) teachers.
Results
What Is the Average Effect of Teacher Turnover on Student Achievement?
Table 2 describes the results for estimates of the effects of teacher turn-over on student achievement when comparing students within the samegrade within the same school but in different years (grade-by-schoolfixed-effects models). Model 1 includes year fixed effects as well asschool-by-grade fixed effects, while Model 2 adds in student-, class-, andschool-level controls.11 Note that each estimate in Table 2 comes from a sep-arate estimation. The estimations vary in their outcome variable (math orELA) and in their measure of turnover (proportion of new teachers or laggedattrition). The estimated coefficients are negative and significant for test
How Teacher Turnover Harms Student Achievement
17
by guest on January 26, 2013http://aerj.aera.netDownloaded from

scores in both ELA and math and for all model specifications, suggesting thatthe students of teachers in the same grade-level team in the same school doworse in years where teacher turnover rates are higher, as compared to yearswith less teacher turnover. Student math scores are 8.2% to 10.2% of a stan-dard deviation lower in years when there was 100% turnover as compared toyears when there was no turnover at all. For a year in which turnover in-creases by one standard deviation (.17 for lagged attrition), this correspondswith a decrease in math achievement by approximately 2% of a standarddeviation. Effect sizes are somewhat smaller in ELA than in math, estimatedat between 4.9% and 6.0% of a standard deviation decrease.
Across models, estimates are somewhat larger when signaling teacherturnover using the proportion of new teachers to a grade-level team as com-pared to the proportion of teachers who left a grade-level team in the prioryear. We are not certain why this is the case but suspect it may be the resultof differences in the sensitivity of measures to variation in turnover acrossyears where there was growth or decline in the number of teachers withina particular grade-by-school. To illustrate, Table 3 summarizes three differentscenarios—when there is an increase in the number of teachers in a hypo-thetical fourth grade in a hypothetical School A, when there is a decline inthe number of teachers, and when the number of teachers stays the same.As the table demonstrates, the lagged attrition measure may be less sensitiveto changes caused by turnover in growth years. On the other hand, indecline years, the proportion new measure may fail to detect changes due
Table 2
Estimates of the Effects of Teacher Turnover on Student Achievement, Using
School-by-Grade Fixed Effects
Test Turnover Measure Model 1 Model 2
Math Lagged attrition 2.086** 2.082**
(.011) (.011)
Proportion new to school 2.102** 2.096**
(.01) (.01)
ELA Lagged attrition 2.049** 2.049**
(.01) (.01)
Proportion new to school 2.060** 2.051**
(.009) (.009)
School-by-grade fixed effects x x
Year indicators x x
Student, class, school controls x
Note. Each column corresponds to a different model in the analysis; x indicates which con-trols and fixed effects were included in each model. Standard errors in parentheses. ELA =English language arts.**p \ .01.
Ronfeldt et al.
18
by guest on January 26, 2013http://aerj.aera.netDownloaded from
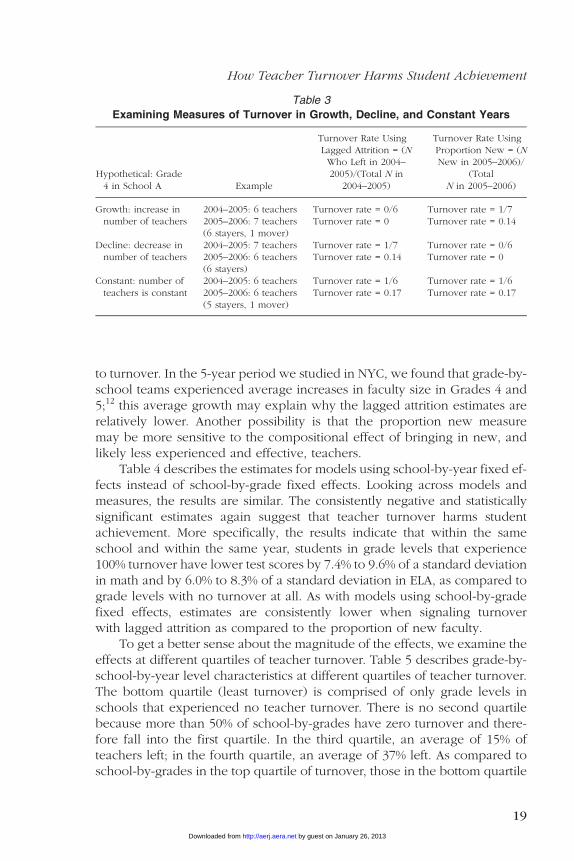
to turnover. In the 5-year period we studied in NYC, we found that grade-by-school teams experienced average increases in faculty size in Grades 4 and5;12 this average growth may explain why the lagged attrition estimates arerelatively lower. Another possibility is that the proportion new measuremay be more sensitive to the compositional effect of bringing in new, andlikely less experienced and effective, teachers.
Table 4 describes the estimates for models using school-by-year fixed ef-fects instead of school-by-grade fixed effects. Looking across models andmeasures, the results are similar. The consistently negative and statisticallysignificant estimates again suggest that teacher turnover harms studentachievement. More specifically, the results indicate that within the sameschool and within the same year, students in grade levels that experience100% turnover have lower test scores by 7.4% to 9.6% of a standard deviationin math and by 6.0% to 8.3% of a standard deviation in ELA, as compared tograde levels with no turnover at all. As with models using school-by-gradefixed effects, estimates are consistently lower when signaling turnoverwith lagged attrition as compared to the proportion of new faculty.
To get a better sense about the magnitude of the effects, we examine theeffects at different quartiles of teacher turnover. Table 5 describes grade-by-school-by-year level characteristics at different quartiles of teacher turnover.The bottom quartile (least turnover) is comprised of only grade levels inschools that experienced no teacher turnover. There is no second quartilebecause more than 50% of school-by-grades have zero turnover and there-fore fall into the first quartile. In the third quartile, an average of 15% ofteachers left; in the fourth quartile, an average of 37% left. As compared toschool-by-grades in the top quartile of turnover, those in the bottom quartile
Table 3
Examining Measures of Turnover in Growth, Decline, and Constant Years
Hypothetical: Grade4 in School A Example
Turnover Rate UsingLagged Attrition = (NWho Left in 2004–2005)/(Total N in
2004–2005)
Turnover Rate UsingProportion New = (NNew in 2005–2006)/
(TotalN in 2005–2006)
Growth: increase innumber of teachers
2004–2005: 6 teachers Turnover rate = 0/6 Turnover rate = 1/72005–2006: 7 teachers Turnover rate = 0 Turnover rate = 0.14(6 stayers, 1 mover)
Decline: decrease innumber of teachers
2004–2005: 7 teachers Turnover rate = 1/7 Turnover rate = 0/62005–2006: 6 teachers Turnover rate = 0.14 Turnover rate = 0(6 stayers)
Constant: number ofteachers is constant
2004–2005: 6 teachers Turnover rate = 1/6 Turnover rate = 1/62005–2006: 6 teachers Turnover rate = 0.17 Turnover rate = 0.17(5 stayers, 1 mover)
How Teacher Turnover Harms Student Achievement
19
by guest on January 26, 2013http://aerj.aera.netDownloaded from

have more high-achieving and Asian students; fewer low-income, Black, andHispanic students; and fewer student absences and suspensions.
Table 6 shows the estimates for the effects of teacher turnover on stu-dent ELA achievement by quartile of turnover; Table 7 summarizes resultsfor math achievement. The first column displays estimates for models em-ploying school-by-year fixed effects, while estimates in the second column
Table 5
School-Grade-Year Level Descriptive Statistics by Quartile of Lagged Attrition
Variable Quartile 1 Quartile 2 Quartile 3 Quartile 4
Lagged attrition 0.00 0.15 0.37
Math test score (standardized) 0.13 0.04 20.04
Proportion free lunch 0.63 0.68 0.69
Proportion Hispanic 0.34 0.40 0.39
Proportion Black 0.33 0.34 0.39
Proportion Asian 0.14 0.12 0.09
Proportion ‘‘other’’ race/ethnicity 0.00 0.00 0.01
Proportion female 0.51 0.51 0.52
Lagged number of absences 10.73 11.18 11.67
Lagged proportion suspended 0.01 0.01 0.02
Table 4
Estimates of the Effects of Teacher Turnover on Student Achievement, Using
School-by-Year Fixed Effects
Test Turnover Measure Model 1 Model 2
Math Lagged attrition 2.074** 2.074**
(.013) (.013)
Proportion new to school 2.096** 2.093**
(.012) (.012)
ELA Lagged attrition 2.060** 2.064**
(.013) (.013)
Proportion new to school 2.083** 2.082**
(.012) (.012)
School-by-year fixed effects x x
Grade indicators x x
Student, class, school controls x
Note. Each column corresponds to a different model in the analysis; x indicates which con-trols and fixed effects were included in each model. Standard errors in parentheses. ELA =English language arts.**p \ .01.
Ronfeldt et al.
20
by guest on January 26, 2013http://aerj.aera.netDownloaded from

come from models with school-by-grade fixed effects. All models control forstudent, classroom, and school characteristics. Depending on the model andsignal for turnover, students experiencing rates of teacher turnover in thefourth quartile have 2% to 4% of a standard deviation lower math achieve-ment as compared to students experiencing the least (bottom quartile)teacher turnover. In a given grade level with five teachers (mean value),this would suggest that reducing teacher attrition from two teachers leaving(40% turnover) to none leaving corresponds with an increase in studentmath achievement of 2% to 4% of a standard deviation. This effect is smallbut meaningful and it applies to all students in the grade. As an example,the magnitude is approximately the same as the magnitude of the coefficienton the student indicator variable for being eligible for free or reduced pricelunch (3%), our proxy for student poverty.13 With our identification strategy,we are probably underestimating the true effect of turnover since we areidentifying largely idiosyncratic turnover—variation across grades (withina school and year) or across years (within a grade and school) likely dueto chance. There likely exist, however, particular schools with persistentlyhigh turnover due to larger, more systemic issues (e.g., gang activity in thecommunity). Though such persistent turnover likely has additional negative
Table 6
Estimates of Effects of Teacher Turnover on Student Achievement in English
Language Arts (ELA) by Quartile of Teacher Turnover (Bottom Quartile Is
Reference Group)
Turnover Measures Model 1 Model 2
Lagged attrition Q2
Lagged attrition Q3 2.012** 2.012**
(.005) (.004)
Lagged attrition Q4 2.020** 2.017**
(.005) (.004)
Proportion new Q2
Proportion new Q3 2.009* 2.000
(.005) (.004)
Proportion new Q4 2.029** 2.016**
(.005) (.004)
Student, class, school controls x x
School-by-year fixed effects x
Grade indicators x
School-by-grade fixed effects x
Year indicators x
Note. Each column corresponds to a different model in the analysis; x indicates which con-trols and fixed effects were included in each model. Standard errors in parentheses.*p \ .05. **p \ .01.
How Teacher Turnover Harms Student Achievement
21
by guest on January 26, 2013http://aerj.aera.netDownloaded from

effects, our modeling approach does not account for these additional effects.Even though turnover rates may be persistently large across time for a givenschool-grade, we focus our analysis on year-to-year differences in turnoverwithin the same school-grade. Though the former may exist for systemic rea-sons, the latter likely represents chance variation around more systemiceffects.
Are the Effects Different for Different Kinds of Schools?
Prior literature suggests that the turnover rates are especially high inschools with more low-performing and minority students (Boyd et al.,2005, 2011b; Hanushek et al., 2004; Scafidi, Stinebrickner, & Sjoquist,2003). Moreover, it is typically more challenging to fill vacancies in thesekinds of schools with qualified teachers (Boyd et al., 2011a). Thus, manyhave argued that the effects of teacher turnover are probably most harmfulto students in schools with underserved student populations. However, esti-mates in the recent study by Hanushek and Rivkin (2010) suggest the oppo-site to be true—that turnover may exert a lower cost on schools with higherpopulations of low-achieving and Black students as compared to schoolswith fewer of these student populations.
Table 7
Estimates of Effects of Teacher Turnover on Student Achievement in Math by
Quartile of Teacher Turnover (Bottom Quartile Is Reference Group)
Turnover Measures Model 1 Model 2
Lagged attrition Q2
Lagged attrition Q3 2.009* 2.008*
(.005) (.004)
Lagged attrition Q4 2.026** 2.029**
(.005) (.004)
Proportion new Q2
Proportion new Q3 2.014** 2.010*
(.005) (.004)
Proportion new Q4 2.036** 2.033**
(.005) (.004)
Student, class, school controls x x
School-by-year fixed effects x
Grade indicators x
School-by-grade fixed effects x
Year indicators x
Note. Each column corresponds to a different model in the analysis; x indicates which con-trols and fixed effects were included in each model. Standard errors in parentheses.*p \ .05. **p \ .01.
Ronfeldt et al.
22
by guest on January 26, 2013http://aerj.aera.netDownloaded from
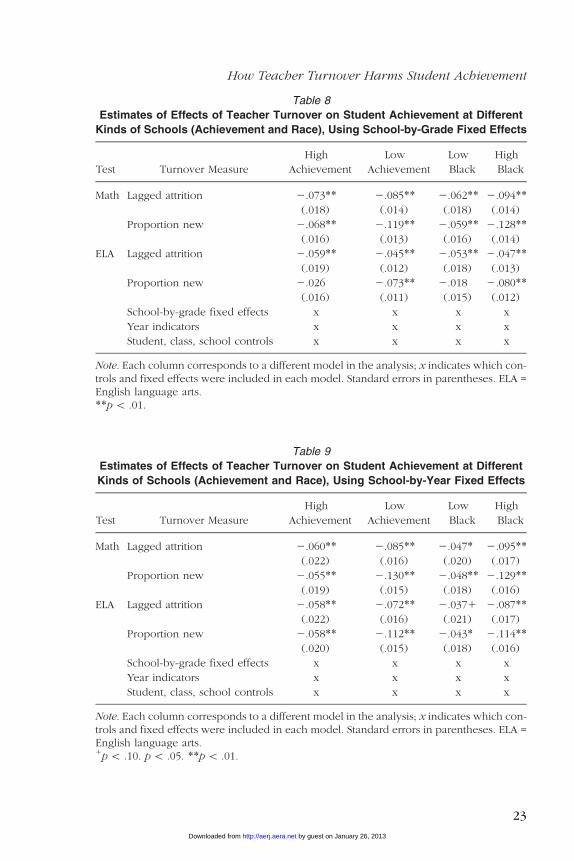
Table 8
Estimates of Effects of Teacher Turnover on Student Achievement at Different
Kinds of Schools (Achievement and Race), Using School-by-Grade Fixed Effects
Test Turnover Measure
High
Achievement
Low
Achievement
Low
Black
High
Black
Math Lagged attrition 2.073** 2.085** 2.062** 2.094**
(.018) (.014) (.018) (.014)
Proportion new 2.068** 2.119** 2.059** 2.128**
(.016) (.013) (.016) (.014)
ELA Lagged attrition 2.059** 2.045** 2.053** 2.047**
(.019) (.012) (.018) (.013)
Proportion new 2.026 2.073** 2.018 2.080**
(.016) (.011) (.015) (.012)
School-by-grade fixed effects x x x x
Year indicators x x x x
Student, class, school controls x x x x
Note. Each column corresponds to a different model in the analysis; x indicates which con-trols and fixed effects were included in each model. Standard errors in parentheses. ELA =English language arts.**p \ .01.
Table 9
Estimates of Effects of Teacher Turnover on Student Achievement at Different
Kinds of Schools (Achievement and Race), Using School-by-Year Fixed Effects
Test Turnover Measure
High
Achievement
Low
Achievement
Low
Black
High
Black
Math Lagged attrition 2.060** 2.085** 2.047* 2.095**
(.022) (.016) (.020) (.017)
Proportion new 2.055** 2.130** 2.048** 2.129**
(.019) (.015) (.018) (.016)
ELA Lagged attrition 2.058** 2.072** 2.0371 2.087**
(.022) (.016) (.021) (.017)
Proportion new 2.058** 2.112** 2.043* 2.114**
(.020) (.015) (.018) (.016)
School-by-grade fixed effects x x x x
Year indicators x x x x
Student, class, school controls x x x x
Note. Each column corresponds to a different model in the analysis; x indicates which con-trols and fixed effects were included in each model. Standard errors in parentheses. ELA =English language arts.1p \ .10. p \ .05. **p \ .01.
How Teacher Turnover Harms Student Achievement
23
by guest on January 26, 2013http://aerj.aera.netDownloaded from

Table 10
Estimates of Effects of Teacher Turnover on Student Achievement at Different
Kinds of Schools (Age and Size), Using School-by-Year Fixed Effects
Test Turnover Measure New Old Small Big
Math Lagged attrition 2.101 2.074** 2.089** 2.0411
(.067) (.013) (.016) (.022)
Proportion new 2.125* 2.091** 2.075** 2.122**
(.063) (.013) (.014) (.022)
ELA Lagged attrition 2.085 2.063** 2.063** 2.062**
(.053) (.014) (.017) (.021)
Proportion new 2.054 2.082** 2.076** 2.091**
(.058) (.012) (.015) (.021)
School-by-grade fixed effects x x x x
Year indicators x x x x
Student, class, school controls x x x x
Note. Each column corresponds to a different model in the analysis; x indicates which con-trols and fixed effects were included in each model. Standard errors in parentheses. ELA =English language arts.1p \ .10. *p \ .05. **p \ .01.
Table 11
Estimates of Effects of Teacher Turnover on Student Achievement at Different
Kinds of Schools (Age and Size), Using School-by-Grade Fixed Effects
Test Turnover Measure New Old Small Big
Math Lagged attrition 2.090* 2.082** 2.084** 2.078**
(.045) (.012) (.014) (.019)
Proportion new 2.107* 2.095** 2.094** 2.103**
(.043) (.011) (.013) (.018)
ELA Lagged attrition 2.007 2.051** 2.052** 2.046**
(.040) (.011) (.013) (.017)
Proportion new 2.033 2.053** 2.057** 2.046**
(.036) (.010) (.012) (.016)
School-by-grade fixed effects x x x x
Year indicators x x x x
Student, class, school controls x x x x
Note. Each column corresponds to a different model in the analysis; x indicates which con-trols and fixed effects were included in each model. Standard errors in parentheses. ELA =English language arts.*p \ .05. **p \ .01.
Ronfeldt et al.
24
by guest on January 26, 2013http://aerj.aera.netDownloaded from

To examine this matter further, we analyzed whether the effects of teacherturnover were similar or different in schools with more low-achieving andBlack students as compared to schools with fewer of these student popula-tions (see Methods section for more details). Table 8 presents results for mod-els using school-by-grade fixed effects, while Table 9 presents results formodels using school-by-year fixed effects. Across math and ELA, and acrossmeasures for teacher turnover, the negative effect of teacher turnover on stu-dent achievement was larger in schools with higher proportions of low-achieving and Black students.
Tables 10 and 11 compare estimates for old (existed in 2001) versus new(did not exist in 2001) schools and for big (four or more teachers per gradelevel) versus small schools (fewer than four teachers per grade level). Acrossmodels, estimates are negative and mostly significant, suggesting that turn-over has a harmful effect on student achievement across kinds of schools.Also, there are no clear differences in the magnitudes of the effects in bigversus small or old versus new schools. These results indicate that newschool reforms in NYC are not driving the negative effects of turnoverdescribed previously.
What Explains the Relationship Between Teacher Turnover and Student
Achievement?
There are many possible mechanisms by which teacher turnover canharm student achievement. As described in the Introduction, prior literatureoften focuses on the relationships between teacher turnover and teacherquality to explain this effect. The assumed causal mechanism is that teacherturnover changes the average effectiveness of teachers in schools, which inturn changes student outcomes. More specifically, the effect of turnover isdriven by the relative effectiveness of teachers who leave a school, as com-pared to those who replace them (compositional explanation). We includein our models two signals for teacher quality—experience and laggedvalue-added—to test whether changes in teaching experience or prior effec-tiveness at raising test scores explain the harmful effects of turnover on stu-dent achievement that we observe. Because the first year in a school may beespecially difficult, even for experienced teachers, we also add a control forwhether the teacher transferred from a different school. This allows us to testwhether changes in distribution of movers may explain observed effects.
Tables 12 and 13 show estimates for models examining whether teach-ing experience and migration explain the effects of teacher turnover on stu-dent achievement. We begin with the base model in Model 1, addexperience indicators in Model 2, and then add an indicator for whethera teacher transferred from another school (a mover) in Model 3. Table 14 de-scribes results for models using school-by-grade fixed effects; Table 15 de-scribes models using school-by-year fixed effects. In both tables, Model 2
How Teacher Turnover Harms Student Achievement
25
by guest on January 26, 2013http://aerj.aera.netDownloaded from
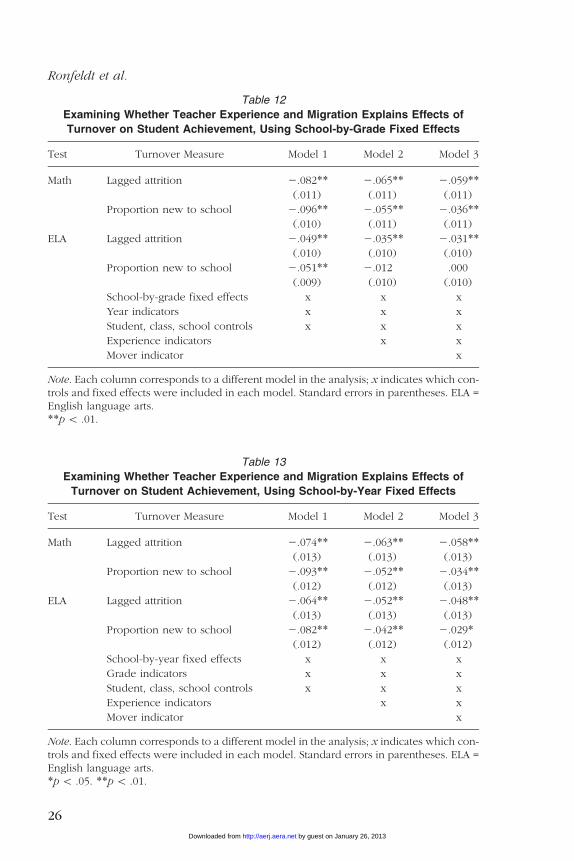
Table 12
Examining Whether Teacher Experience and Migration Explains Effects of
Turnover on Student Achievement, Using School-by-Grade Fixed Effects
Test Turnover Measure Model 1 Model 2 Model 3
Math Lagged attrition 2.082** 2.065** 2.059**
(.011) (.011) (.011)
Proportion new to school 2.096** 2.055** 2.036**
(.010) (.011) (.011)
ELA Lagged attrition 2.049** 2.035** 2.031**
(.010) (.010) (.010)
Proportion new to school 2.051** 2.012 .000
(.009) (.010) (.010)
School-by-grade fixed effects x x x
Year indicators x x x
Student, class, school controls x x x
Experience indicators x x
Mover indicator x
Note. Each column corresponds to a different model in the analysis; x indicates which con-trols and fixed effects were included in each model. Standard errors in parentheses. ELA =English language arts.**p \ .01.
Table 13
Examining Whether Teacher Experience and Migration Explains Effects of
Turnover on Student Achievement, Using School-by-Year Fixed Effects
Test Turnover Measure Model 1 Model 2 Model 3
Math Lagged attrition 2.074** 2.063** 2.058**
(.013) (.013) (.013)
Proportion new to school 2.093** 2.052** 2.034**
(.012) (.012) (.013)
ELA Lagged attrition 2.064** 2.052** 2.048**
(.013) (.013) (.013)
Proportion new to school 2.082** 2.042** 2.029*
(.012) (.012) (.012)
School-by-year fixed effects x x x
Grade indicators x x x
Student, class, school controls x x x
Experience indicators x x
Mover indicator x
Note. Each column corresponds to a different model in the analysis; x indicates which con-trols and fixed effects were included in each model. Standard errors in parentheses. ELA =English language arts.*p \ .05. **p \ .01.
Ronfeldt et al.
26
by guest on January 26, 2013http://aerj.aera.netDownloaded from

Table 14
Examining Whether Prior Value-Added Explains Effects of Turnover on Student
Achievement, Using School-by-Grade Fixed Effects
All Schools Low Achieving High Achieving
Test Turnover Measure Model 1 Model 2 Model 1 Model2 Model 1 Model 2
Math Lagged attrition 2.059** 2.040** 2.067** 2.049** 2.044* 2.024(.013) (.012) (.016) (.015) (.021) (.020)
Proportion new to school 2.048** 2.034** 2.082** 2.065** 2.015 2.007(.012) (.012) (.016) (.015) (.019) (.018)
ELA Lagged attrition 2.033** 2.027* 2.035* 2.028* 2.031 2.025(.012) (.012) (.014) (.014) (.022) (.021)
Proportion new to school 2.004 .000 2.027* 2.0231 .018 .021(.011) (.011) (.014) (.014) (.018) (.018)
School-by-grade fixed effects x x x x x xYear indicators x x x x x xStudent, class, school controls x x x x x xAverage prior value-added x x x
Note. Each column corresponds to a different model in the analysis; x indicates which con-trols and fixed effects were included in each model. Standard errors in parentheses. ELA =English language arts.1p \ .10. *p \ .05. **p \ .01.
Table 15
Examining Whether Prior Value-Added Explains Effects of Turnover on Student
Achievement, Using School-by-Year Fixed Effects
All Schools Low Achieving High Achieving
Test Turnover Measure Model 1 Model 2 Model 1 Model2 Model 1 Model 2
Math Lagged attrition 2.055** 2.034** 2.063** 2.049** 2.0451 2.016(.015) (.013) (.019) (.017) (.025) (.021)
Proportion new to school 2.045** 2.033** 2.101** 2.075** .008 .008(.015) (.013) (.019) (.017) (.022) (.019)
ELA Lagged attrition 2.036* 2.034* 2.042* 2.041* 2.031 2.025(.016) (.014) (.018) (.017) (.027) (.024)
Proportion new to school 2.037* 2.0241 2.073** 2.058** 2.006 .006(.014) (.013) (.018) (.016) (.023) (.020)
School-by-year fixed effects x x x x x xGrade indicators x x x x x xStudent, class, school controls x x x x x xAverage prior value-added x x x
Note. Each column corresponds to a different model in the analysis; x indicates which con-trols and fixed effects were included in each model. Standard errors in parentheses. ELA =English language arts.1p \ .10. *p \ .05. **p \ .01.
How Teacher Turnover Harms Student Achievement
27
by guest on January 26, 2013http://aerj.aera.netDownloaded from

estimates are consistently lower than those in Model 1 but still statisticallysignificant. These results indicate that changes in the distribution of teacherexperience explain some of the effect of teacher turnover on studentachievement, although a substantial amount of the effect remains unex-plained. Compared to Model 2, Model 3 estimates are also somewhat smallerbut still statistically significant. These results suggest that teachers whomigrated from other schools were, on average, less effective and that this ac-counted for some of the harmful effects of teacher turnover on studentachievement.14 However, Model 3 estimates remained statistically significant,indicating that other factors, beyond teaching experience and migration, alsoexplain the effects of teacher turnover on student achievement.
One of the most likely remaining explanatory factors is teachers’ prioreffectiveness at improving student achievement (Hanushek & Rivkin,2010). Tables 14 and 15 show estimates for models using only the subsampleof teachers for whom we have data on prior value-added. Model 1 includesestimates for the effect of teacher turnover on student achievement for thissubsample; Model 2 controls for teachers’ average prior value-added15 tosee if prior effectiveness explains any observed effects in Model 1. These ta-bles show that even with the subsample of teachers for whom we have dataon prior value-added, the estimates of the effects of teacher turnover on stu-dent achievement remain negative and mostly significant (Model 1, ‘‘AllSchools’’), though are somewhat smaller in magnitude as compared to thelarger sample. After controlling for teachers’ average prior value-added, esti-mate sizes reduce somewhat though remain statistically significant. These re-sults suggest that changes in the distribution of teachers’ effectivenessaccount for some of the observed relationship between teacher turnoverand student achievement, though an effect remains beyond this composi-tional explanation. The remaining effect may be a result of limitations inour methods to account for the compositional explanation. Given more per-fect signals for prior effectiveness, for instance, it is possible that no signifi-cant effect of turnover would remain. As described below, however, we findthat turnover significantly impacts the achievement of the students of stayers(teachers who remain in the same grade and school), suggesting a disruptiveeffect will remain regardless of how well we measure and account for com-positional effects.
Because we find the effects of teacher turnover to be especially delete-rious in lower-achieving schools, we reproduce the value-added analysesseparately in lower-achieving and higher-achieving schools. Tables 14 and15 shows that with the reduced sample, the turnover effect is negative andsignificant in lower-achieving schools but that there is no significant effectin higher-achieving schools. Moreover, the effect of teacher turnover re-mains negative and in most cases statistically significant even after control-ling for prior value-added. Thus, teachers’ prior effectiveness does not
Ronfeldt et al.
28
by guest on January 26, 2013http://aerj.aera.netDownloaded from

appear to explain fully the harmful effects of turnover on student achieve-ment in lower-achieving schools.
That the magnitudes for the effects of turnover are larger (even morenegative) before controlling for average prior value-added suggests the com-positional effect of turnover due to changes in the distribution of teachereffectiveness has a net negative effect. On average, students are harmedby the changing composition in teacher effectiveness that results fromteacher turnover, primarily in lower-performing schools. These findingsare consistent with studies that suggest underserved schools tend to fillvacancies with relatively less effective teachers.
Given that distributional changes in teacher experience, migration, andprior effectiveness do not fully explain the harmful effects of turnover onstudent achievement, particularly in lower-performing schools, what elsemight account for them? It is beyond the scope of this study to identifyand test all possible mechanisms by which turnover may harm studentachievement. However, we begin to identify how turnover impacts studentachievement by examining whether the effects of teacher turnover accrueonly to students who have teachers who are new to the grade-level teamin their school or whether the effects of turnover are also felt by studentswhose teachers had remained. If the students of stayers are harmed byteacher turnover, it would cast further doubt on the hypothesis that turnoverharms student achievement only through changing the relative effectivenessof the teachers who leave as compared to those that replace them. It wouldsuggest instead that the rotation of teachers has a disruptive influence thatreaches beyond just those students of teachers who were coming and goingto negatively impact even the students who were assigned to teachers whostayed in the same school from year to year. To test this, we examine the ef-fects of turnover separately for teachers who were stayers, movers, and roo-kies (first year) to see the extent to which the students of these groups ofteachers experienced the effects of turnover differently. Given prior evi-dence that the effect of turnover manifests primarily in lower-achievingschools, we continue to analyze low- and high-achieving schools separately.
Table 16 shows the results for models using school-by-grade fixed ef-fects while Table 17 shows results for models using school-by-year fixed ef-fects. On the left are estimates for the effects of teacher turnover on mathachievement—for all schools, for low-achieving schools, and for high-achiev-ing schools; on the right are estimates on ELA achievement organized in thesame way. Across models and measures, there is a consistent pattern—stu-dents of stayers perform significantly worse when turnover is greater, andthe negative effects are mostly found in lower-performing schools.16 For thestudents of movers, estimates trend negative (especially in school-by-gradefixed-effects models) but are generally nonsignificant and somewhat unstable.Given that only 4% of teachers in our sample are movers, we suspect that thereduced sample size and corresponding lack of power likely account for the
How Teacher Turnover Harms Student Achievement
29
by guest on January 26, 2013http://aerj.aera.netDownloaded from

instability of estimates. The substantially larger standard errors and unusuallylarge magnitudes on some coefficients are consistent with this explanation.Lastly, estimates for the effects of turnover on the achievement of studentsof first-year (rookie) teachers vary by model, turnover measure, schooltype, and subject being tested. Mostly estimates are nonsignificant, suggestingno significant effect of turnover on the students of rookies. Some estimates aresignificant and negative, suggesting a harmful effect. However, more researchis needed, as the instability of estimates may again be due to the diminishedsample (9% of teachers are rookies).
Discussion
This study finds some of the first empirical evidence for a direct effect ofteacher turnover on student achievement. Results suggest that teacher turn-over has a significant and negative impact on student achievement in bothmath and ELA. Moreover, teacher turnover is particularly harmful to theachievement of students in schools with large populations of low-perform-ing and Black students.
Table 16
Examining the Effect of Teacher Turnover on Stayers, Movers, and Leavers
(School-by-Grade Fixed Effects)
Math ELA
AllSchools
LowPerforming
HighPerforming
AllSchools
LowPerforming
HighPerforming
Stayers Lagged attrition 2.054** 2.053** 2.053** 2.035** 2.022 2.059**(.012) (.015) (.020) (.011) (.013) (.021)
Proportion new 2.030* 2.058** 2.000 .008 2.007 .022(.012) (.016) (.019) (.011) (.013) (.019)
Movers Lagged attrition 2.062 2.046 2.095 2.028 2.040 2.017(.040) (.050) (.060) (.038) (.043) (.068)
Proportion new 2.047 2.046 2.101 2.060 2.050 2.070(.040) (.053) (.062) (.042) (.052) (.069)
Rookies Lagged attrition 2.054* 2.082** .014 .014 2.015 .068(.026) (.031) (.047) (.026) (.031) (.045)
Proportion new 2.008 .008 2.027 .025 .026 .018(.026) (.031) (.049) (.024) (.029) (.041)
School-by-gradefixed effects
x x x x x x
Year indicators x x x x x xStudent, school,class controls
x x x x x x
Note. Models estimating the effects of turnover on the students of stayers, movers, andfirst-year teachers were run separately for each group. Each column corresponds to a dif-ferent model in the analysis; x indicates which controls and fixed effects were included ineach model. Standard errors in parentheses. ELA = English language arts.*p \ .05. **p \ .01.
Ronfeldt et al.
30
by guest on January 26, 2013http://aerj.aera.netDownloaded from

Much of the existing literature assumes that teacher turnover impactsstudent achievement by changing the distribution in quality of teachers inschools. That is, if the teachers who leave a school are worse than thosewho replace them, then turnover is assumed to have a net positive effect.In this view, stayers, and their students, are merely bystanders who do notaffect and are not affected by turnover. Although this study finds evidencethat changes in teacher quality explain some of the effect of turnover on stu-dent achievement, the results suggest there may be a disruptive impact ofturnover beyond compositional changes in teacher quality. First, resultsshow that turnover has a harmful effect on student achievement, even aftercontrolling for different indicators of teacher quality, especially in lower-performing schools. Also, we find that turnover negatively affects the stu-dents of stayers—those who remain in the same school from one year tothe next. Thus, turnover must have an impact beyond simply whetherincoming teachers are better than those they replaced—even the teachersoutside of this redistribution are somehow harmed by it.
Table 17
Examining the Effect of Teacher Turnover on Stayers, Movers, and Leavers
(School-by-Year Fixed Effects)
Math ELA
AllSchools
LowPerforming
HighPerforming
AllSchools
LowPerforming
HighPerforming
Stayers Lagged attrition 2.059** 2.069** 2.0471 2.056** 2.048** 2.074**(.014) (.017) (.024) (.014) (.017) (.025)
Proportion new 2.032* 2.090** .026 2.030* 2.054** 2.016(.014) (.019) (.022) (.014) (.017) (.023)
Movers Lagged attrition 2.256** 2.056 2.509* 2.041 .069 2.2131
(.094) (.079) (.215) (.072) (.097) (.121)Proportion new 2.055 .044 2.098 2.065 .076 2.037
(.090) (.079) (.154) (.078) (.103) (.126)Rookies Lagged attrition 2.029 2.039 .027 2.068 2.115* .067
(.045) (.055) (.072) (.045) (.058) (.060)Proportion new 2.054 2.127* .062 2.060 2.124* .051
(.045) (.051) (.083) (.043) (.051) (.072)School-by-yearfixed effects
x x x x x x
Grade indicators x x x x x xStudent, school,class controls
x x x x x x
Note. Models estimating the effects of turnover on the students of stayers, movers, andfirst-year teachers were run separately for each group. Each column corresponds to a dif-ferent model in the analysis; x indicates which controls and fixed effects were included ineach model. Standard errors in parentheses. ELA = English language arts.1p \ .10. *p \ .05. **p \ .01.
How Teacher Turnover Harms Student Achievement
31
by guest on January 26, 2013http://aerj.aera.netDownloaded from
Although this study does not identify the specific mechanism by whichturnover harms students, it provides guidance on where to look. The findingsindicate that turnover has a broader, harmful influence on student achieve-ment since it can reach beyond just those students of teachers who left orof those that replaced them. Any explanation for the effect of turnover mustpossess these characteristics. One possibility is that turnover negatively affectscollegiality or relational trust among faculty; or perhaps turnover results in lossof institutional knowledge among faculty that is critical for supporting studentlearning. More research is needed to identify the specific mechanism.
This study makes important methodological contributions. First, findingevidence for a disruptive influence beyond changing the distribution in qual-ity of teachers calls into question research that draws inferences about theeffects of teacher turnover based solely on compositional explanations.Future studies need to take a more comprehensive view on the mechanismsby which teacher turnover may influence student achievement. Second, weintroduce a unique identification strategy and modeling approach that im-proves on prior efforts to estimate the effects of teacher turnover on studentachievement. The effects of turnover are typically analyzed at the schoollevel, an approach that makes the questionable assumption that the effectsof turnover are comparable across different kinds of schools. Instead, we uti-lize two innovative modeling approaches that do not make this assumption.The first identifies turnover variation across years within the same grade leveland within the same school to examine whether students had better orworse test score gains in a given year, as compared to other years whenteacher turnover was at different rates. The second identifies turnover vari-ation across grade levels within the same year and within the same school toexamine whether students in grade levels with higher or lower turnoverrates also had higher or lower achievement gains. Though an improvementover school-level analyses, both of these methods also make questionableassumptions. The former assumes the effects of turnover rates within thesame grade and school are comparable across years; the latter assumesthat turnover effects within the same school and year are comparable acrossgrade levels. Despite concerns over potential bias introduced by these as-sumptions, findings were similar across methodological approaches, sug-gesting our analytic strategy to be valid and that we have detected a trueeffect.
Finally, the findings of this study have policy implications. Though theremay be cases where turnover is actually helpful to student achievement, onaverage, it is harmful. This indicates that schools would benefit from policiesaimed at keeping grade-level teams intact over time. One possibility mightbe to introduce incentive structures to retain teachers that might leave other-wise. Implementing such policies may be especially important in schoolswith large populations of low-performing and Black students, where turn-over has the strongest negative effect on student achievement.
Ronfeldt et al.
32
by guest on January 26, 2013http://aerj.aera.netDownloaded from

Acknowledgments
This research was made possible by generous financial support from a NationalCenter for Analysis of Longitudinal Data in Education Research (CALDER) grantand an Institution of Education Sciences (IES) postdoctoral fellowship. CALDER issupported by IES Grant R305A060018 to American Institutes of Research. The viewsexpressed in the article are solely those of the authors and may not reflect those ofthe funders. Any errors are attributable to the authors.
Notes1These are approximate values based on somewhat inconsistent sources. Ingersoll
(2003) uses year-to-year turnover rates (by level of experience) from nationally represen-tative data to estimate that 46% of teachers leave teaching within 5 years. These estimates,however, include private school teachers who have substantially higher rates of turnoverthan public school teachers and ignore the fact that many who leave teaching end up re-turning. Using Ingersoll’s estimates but adjusting for these factors, Darling-Hammond andSykes (2003) calculate a 5-year cumulative attrition rate of about 30% for public schoolteachers. Henke, Chen, Geis, and Knepper (2000) estimate that about 20% of teachersleave the profession within 5 years. However, these findings are focused only on teacherswho entered the profession immediately following college graduation, so are unlikely torepresent the broader population of teachers.
2On the other hand, they found that teachers with better preservice qualifications(LAST scores, competitiveness of undergraduate institution) were more likely to applyfor transfer.
3Altogether there were 864,451 student observations in English language arts (ELA)and 864,106 in math. Due to peculiarities in the New York City (NYC) administrativedata collected in 2002–2003, we were unable to identify the grade levels of all teachersin NYC that year. Since our analyses depend on grade-level information across the district,we included only years for which we could confidently identify grade level.
4We use work-history information collected in October of each academic year toidentify whether and where teachers are currently working. An anonymous reviewer sug-gested that midyear turnover might have a more substantial impact on student achieve-ment. Though we are unable to confidently identify midyear turnover at this point, webelieve the reviewer raises an important consideration that we hope to examine in thefuture.
5As described in the previous paragraph, our two methods for measuring turnovergenerate quite different values when the number of teachers in a given school and gradedo not remain constant over time. Where there is no turnover according to one measure,for example, there can be substantial variation according to the other measure. As a result,the correlation between the two measures is not large.
6We also ran models that included indicators for whether teachers switched gradelevels. Results were similar, suggesting the grade-level switching does not account forthe effects of grade-level turnover on student achievement.
7We use many classroom- and school-level characteristics as controls in the regres-sion models described in the following. Appendix Table S1 (in the online version ofthe journal) describes the variables used as school and classroom controls in analyses.
8We used 20% as the cutoff score as this was close to the median value. This assuredwe had similar number of observations in each group.
9We calculated teachers’ average value-added by estimating students’ test scores (ineither math or ELA) as a function of lagged scores (in both math and ELA); time-variantand invariant student characteristics; time-variant classroom characteristics; time-variantschool characteristics; indicators for teacher experience, year, and grade; and teacher fixedeffects. The coefficient on a given teacher’s effect is the estimate of his or her contributionto achievement gains across years—his or her ‘‘average value-added.’’ In our analyses, wecontrol only for teachers’ average value-added in years prior to the one in which the
How Teacher Turnover Harms Student Achievement
33
by guest on January 26, 2013http://aerj.aera.netDownloaded from

effects of turnover is being estimated, beginning in 2001—the earliest year for which wecould calculate value-added. For example, when estimating the effects of turnover on stu-dent achievement in 2005, we control for teachers’ average value-added from 2001 to2004. We adjust the coefficients using Empirical Bayesian shrinkage to account for mea-surement error.
10All first-year teachers are dropped from this analysis because we do not have stu-dent test score data in prior years. For experienced teachers we were unable to estimatevalue-added for all prior years. To keep our sample as large as possible we decided to usethe average of all prior value added estimates as a signal for prior effectiveness. The likeli-hood of having the data necessary to calculate any value-added estimate increases withexperience. As a result, teachers for whom we had prior value-added estimates had sub-stantially more experience (9.4 years), on average, than did teachers for whom we had noprior value-added estimates (5.0 years). We also found that a smaller percentage (55%) ofteachers in the value-added sample worked in low-performing schools than did the novalue-added sample (65%). Since less experienced teachers are more likely to work inlow-performing schools, differences in average experience likely explain the observed dif-ferences between groups in the proportion working in low-performing schools.
11Table 1 describes the student controls used in these models; Appendix Table S1 de-scribes the classroom and school controls.
12We examined grade-by-school level growth by creating a measure for the differencebetween years in the number of teachers per grade level per school: Difference = Numberof teachers (n) – Number of teachers (n – 1). By averaging difference scores across yearsand school-by-grade levels we calculated a mean difference score of about .3 for our sam-ple. This suggests an average yearly growth of .3 teachers within a grade level withina school.
13Here we use the coefficient on free or reduced priced lunch eligibility from thesame models used to estimate the effect of turnover on student achievement. These mod-els control for prior achievement, as well as other student characteristics, that capturesmuch of the effect of qualifying for free and reduced lunch. Thus, estimates are smallerthan they would be without such controls. That said, our estimates for the effects ofteacher turnover on student achievement would also increase in magnitude were wenot to control for prior achievement or other student characteristics. The effects of teacherturnover in previous years of schooling, for example, will be captured in prior achieve-ment scores. Since we are examining the effects of idiosyncratic turnover, rather thanlooking at the cumulative effects of turnover, it seems more appropriate to compare themagnitudes of our estimates for turnover to estimates on free or reduced lunch thatinclude controls for prior achievement and other student controls.
14The magnitude for turnover estimates decrease in Models 2 and 3, suggesting thatthe effects of turnover resulting from changing distributions in teacher experience andmigration have negative net effects.
15A teacher’s average prior value-added is the mean of his or her value-added acrossprevious years. See note 9 for more detail on how we estimate teachers’ value-addedscores.
16One possible explanation for this result is that principals assign more difficult stu-dents to stayers rather than to rookies or migrating teachers. We try to account for this pos-sibility in our modeling approach by controlling for prior achievement and priorsuspension records, among many other observable student characteristics. Even so, weacknowledge the possibility that such sorting may be occurring on other nonobservablestudent characteristics. Furthermore, one of our reviewers speculated that more experi-enced teachers may be better able to ‘‘weather’’ the effects of turnover. To test this wereran analyses separately for stayers with 5 or fewer years of experience and for stayerswith more than 5 years of experience. Estimates were similar for these two groups andare available upon request from the authors. These results indicate that more experiencedstayers were no better or worse at weathering the effects than less experienced stayers;that is, students of stayers, regardless of experience, were harmed by turnover.
Ronfeldt et al.
34
by guest on January 26, 2013http://aerj.aera.netDownloaded from

References
Abelson, M. A., & Baysinger, B. D. (1984). Optimal and dysfunctional turnover:Toward an organizational level model. The Academy of Management Review,9(2), 331–341.
Barnes, G., Crowe, E., & Schaefer, B. (2007). The costs of turnover in five districts. Apilot study. Washington, DC: National Commission on Teaching and America’sFuture.
Boyd, D., Lankford, H., Loeb, S., Ronfeldt, M., & Wyckoff, J. (2011a). The effect ofschool neighborhoods on teacher career decisions. In R. Murnane &G. Duncan (Eds.), Whither opportunity? Rising inequality and the uncertainlife chances of low-income children. New York, NY: Russell Sage Foundation.
Boyd, D., Lankford, H., Loeb, S., Ronfeldt, M., & Wyckoff, J. (2011b). The role ofteacher quality in retention and hiring: Using applications-to-transfer to uncoverpreferences of teachers and schools. Journal of Policy and Management, 30(1),88–110.
Boyd, D., Lankford, H., Loeb, S., & Wyckoff, J. (2005). Explaining the short careers ofhigh-achieving teachers in schools with low-performing students. AmericanEconomic Review, 95(2), 166–171.
Bryk, A. S., Camburn, E., & Seashore Louis, K. (1999). Professional community inChicago elementary schools: Facilitating factors and organizational consequen-ces. Educational Administration Quarterly, 35, 751–781.
Bryk, A. S., Lee, V. E., & Holland, P. B. (1993). Catholic schools and the commongood. Cambridge, MA: Harvard University Press.
Bryk, A. S., & Schneider, B. (2002). Trust in schools: A core resource for improvement.New York, NY: Russell Sage Foundation.
Carroll, S., Reichardt, R., & Guarino, C. (2000). The distribution of teachers amongCalifornia’s school districts and schools. Santa Monica, CA: RAND Corporation.
Clotfelter, C. T., Ladd, H. F., Vigdor, J. L., & Wheeler, J. (2007). High-poverty schoolsand the distribution of teachers and principals (CALDER Working Paper 1).Washington, DC: Urban Institute.
Darling-Hammond, L., & Sykes, G. (2003). Wanted: A national teacher supply policyfor education: The right way to meet the ‘‘Highly Qualified Teacher’’ challenge.Education Policy Analysis Archives, 11(33). Retrieved from http://epaa.asu/epaa/v11n33/
Goldhaber, D., Gross, B., & Player, D. (2007). Are public schools really losing their‘‘best’’? Assessing the career transitions of teachers and their implications forthe quality of the teacher workforce. Washington, DC: National Center forAnalysis of Longitudinal Data in Education Research.
Guin, K. (2004). Chronic teacher turnover in urban elementary schools. EducationalEvaluation and Policy Analysis, 12(42), 1–25.
Hanselman, P., Grigg, J., Bruch, S., & Gamoran, A. (2011). The consequences of prin-cipal and teacher turnover for school social resources (Working paper).Retrieved from http://ssc.wisc.edu/~sbruch/pdf/Hanselman.et.al.2011.social.resources.pdf
Hanushek, E. A., Kain, J. F., & Rivkin, S. G. (1999). Do higher salaries buy betterteachers? (Working Paper No. 7082). Cambridge, MA: National Bureau ofEconomic Research.
Hanushek, E., Kain, J., & Rivkin, S. (2004). Why public schools lose teachers. Journalof Human Resources, 39(2), 326–354.
How Teacher Turnover Harms Student Achievement
35
by guest on January 26, 2013http://aerj.aera.netDownloaded from

Hanushek, E., & Rivkin, S. (2010). Constrained job matching: Does teacher job searchharm disadvantaged urban schools? (Working Paper No. 15816). Cambridge,MA: National Bureau of Economic Research.
Hemphill, C., Nauer, K., Zelon, H., & Jacobs, T. (2009). The new marketplace: Howsmall-school reforms and school choice have reshaped New York City’s highschools. New York, NY: The New School Center for New York City Affairs.
Henke, R., Chen, X., Geis, S., & Knepper, P. (2000). Progress through the teacher pipe-line: 1992–1993 college graduates and elementary/secondary school teaching asof 1997. Washington, DC: National Center for Educational Statistics.
Ingersoll, R. (2001). Teacher turnover and teacher shortages: An organizational anal-ysis. American Educational Research Journal, 38, 499–534.
Ingersoll, R. (2003). Is there really a teacher shortage? Washington, DC: Center for theStudy of Teaching and Policy.
Ingersoll, R., & Rossi, R. (1995). Which types of schools have the highest teacher turn-over? (Policy Brief 95-778). Washington, DC: National Center for EducationStatistics.
Jackson, K. (2010). Match quality, worker productivity, and worker mobility: Directevidence from teachers (Working Paper No. 15990). Cambridge, MA: NationalBureau of Economic Research.
Johnson, S. M., Berg, J. H., & Donaldson, M. L. (2005). Who stays in teaching andwhy: A review of the literature on teacher retention. Cambridge, MA: HarvardGraduate School of Education. Retrieved from http://assets.aarp.org/www.aarp.org_/articles/NRTA/Harvard_report.pdf
Little, J. W. (1982). Norms of collegiality and experimentation: Workplace conditionsof school success. American Educational Research Journal, 19(3), 325–340.
Louis, K. S., & Marks, H. M. (1998). Does professional community affect the class-room? Teachers’ work and student experiences in restructuring schools.American Journal of Education, 106, 532–575.
McCaffrey, D. F., Lockwood, J. R., Koretz, D., Louis, T. A., & Hamilton, L. (2004).Models for value-added modeling of teacher effects. Journal of Educationaland Behavioral Statistics, 29(1), 67–101.
Murnane, R. J. (1984). Selection and survival in the teacher labor market. The Reviewof Economics and Statistics, 66(3), 513–518.
Newman, F., Smith, B., Allensworth, E., & Bryk, A. S. (2001). School instructional pro-gram coherence: Benefits and challenges. Chicago, IL: Consortium on ChicagoSchool Research.
Scafidi, B., Stinebrickner, T., & Sjoquist, D. L. (2003). The relationship between schoolcharacteristics and teacher mobility. Working paper, Georgia State University.
Shields, P. M., Esch, C., Humphrey, D. C., Young, V. M., Gaston, M., & Hunt, H.(1999). The status of the teaching profession: Research findings and policy rec-ommendations. Santa Cruz, CA: The Center for the Future of Teaching andLearning.
Shields, P. M., Humphrey, D. C., Wechsler, M. E., Riel, L. M., Tiffany-Morales, J.,Woodworth, K., . . . Price, T. (2001). The status of the teaching profession 2001.Santa Cruz, CA: The Center for the Future of Teaching and Learning.
Manuscript received July 1, 2011Final revision received June 14, 2012
Accepted August 3, 2012
Ronfeldt et al.
36
by guest on January 26, 2013http://aerj.aera.netDownloaded from