american public transportation association high speed and
TRANSCRIPT

High-Speed Rail International, USA and California
High Speed Rail:
The Fast Track to Sustainability By
Hon. Rod Diridon Sr.
Chair Intercity and High Speed Rail Committee
American Public Transit Association
Member/Chair Emeritus California High Speed Rail Authority Board
** Created by Mineta Transportation Institute

High Speed Rail System in Asian Countries
Korea: KTX Japan : Shinkansen Taiwan: HSR 700T China: CRH Systems
Created by Mineta Transportation Institute

High Speed Rail in Japan Shinkansen System
• Opened in 1964 • Total Service Mileage: 1,350 miles • Operated by 4 Japan Railway
Companies • Total Fleet approx. 4,000 cars • Max. 12 Trains during peak hour • Up to 350 km/h operation
Created by Mineta Transportation Institute

High Speed Rail in Japan Route Map
Created by Mineta Transportation Institute

High Speed Rail in Japan New Train set N700 Series
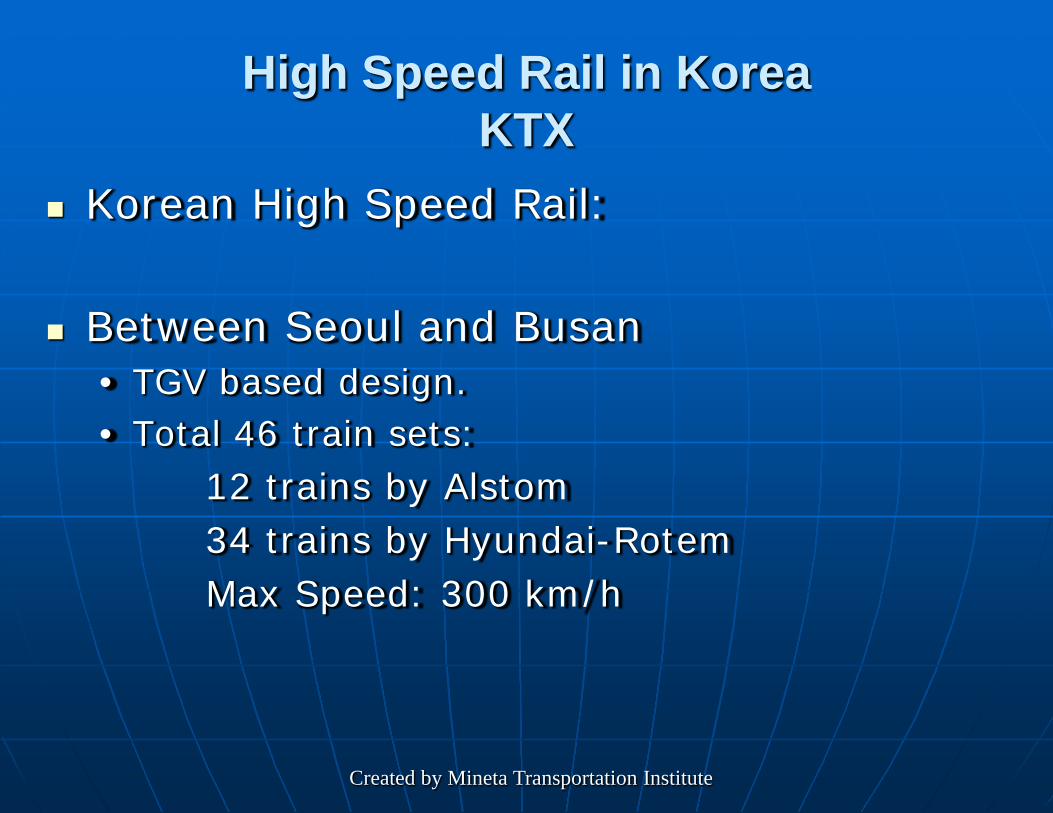
High Speed Rail in Korea KTX
Korean High Speed Rail:
Between Seoul and Busan • TGV based design. • Total 46 train sets:
12 trains by Alstom 34 trains by Hyundai-Rotem Max Speed: 300 km/h
Created by Mineta Transportation Institute


High Speed Rail in Taiwan
• Opened: January 5, 2007 • Total length: 345 km • Max Speed: 300+ km/h • 12 car trains, total 30 train sets
Created by Mineta Transportation Institute

High Speed Rail in Taiwan Route Map
Created by Mineta Transportation Institute

High Speed Rail in Taiwan HSR 700T Series
Created by Mineta Transportation Institute

High Speed Rail in China
Mid to Long Range Rail Transportation
Improvement Plan is on-going.
200 – 250 km/h Lines: 11,000 km, mostly dedicated for passenger, some freight.
360 km/h Lines: 10,000 km, dedicated for
passenger services
Created by Mineta Transportation Institute

High Speed Rail in China Route Map
Created by Mineta Transportation Institute


European HSR Major players: - Spain - France - Germany - Italy
Other countries with HSR: - Holland - Belgium - England
Units: 200 kph - 125 mph 250 kph - 155 mph 300 kph - 186 mph 350 kph - 217 mph
Created by Mineta Transportation Institute


RENFE Spain 1st HSR 1992
Lines built : Distance Trip time old alignment • Madrid - Seville: 472 km 2hr 15min 6 hr • Madrid - Barcelona: 635 km 2hr 38min
7 hr • Madrid – Valladolid: 180 km 1hr • Cordoba - Malaga: 170 km 1hr
Under construction
• Barcelona Perpignan (French border) 340 km
Created by Mineta Transportation Institute

Spain: Rolling Stock for >= 300 kph
AVE S 100
AVE S 102
AVE S 103 (ICE-3)
Created by Mineta Transportation Institute

SNCF France 1st HSR 1981
Lines built : Distance Trip time old alignment • Paris - Lyon: 427 km 2hr 3hr 50min • Paris - Tours: 282 km 1hr 10min 2hr 15min • Paris - Calais: 329 km 1hr 30min 3hr • Lyon - Marseille: 251 km 1hr 40min 3hr • Paris - Metz: 300 km 1hr 25min 2hr 45min • Paris - London: (480 km) 2hr 15min 6hr 30min • London – Bruxelles (~350 km) 2hr 5hr
Under construction
• Dijon – Mulhouse 425km (2012) • Metz – Strasbourg 96 km (2014) • Tours – Bordeaux 303 km (2015)
Approximately 3 hrs travel time
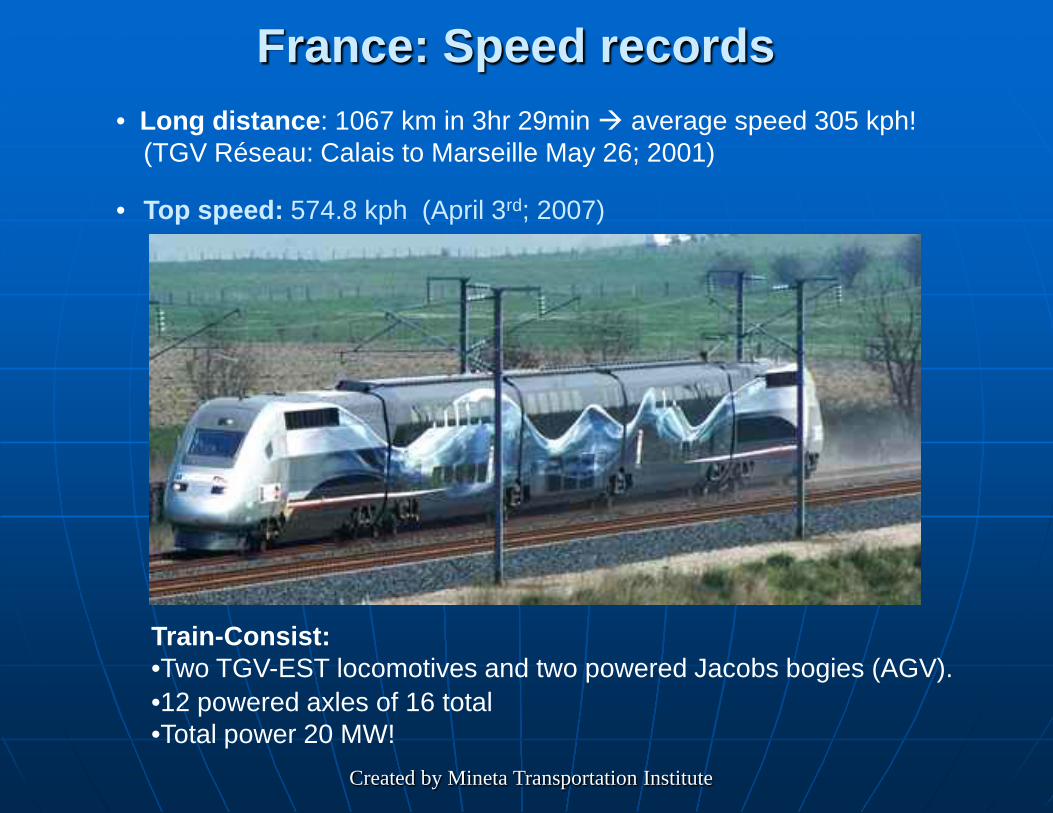
France: Speed records
Train-Consist: •Two TGV-EST locomotives and two powered Jacobs bogies (AGV). •12 powered axles of 16 total •Total power 20 MW!
• Long distance: 1067 km in 3hr 29min average speed 305 kph! (TGV Réseau: Calais to Marseille May 26; 2001)
• Top speed: 574.8 kph (April 3rd; 2007)
Created by Mineta Transportation Institute

Next Generation TGV = AGV
Major differences: • Distributed power
(EMU rather than locomotive design)
• Powered Jacobs-Bogie • Reduced axle load • Permanent magnet motors
(synchronous motors) • Improved aero-dynamics • More passenger space (no
locomotive)
Created by Mineta Transportation Institute

DB Germany 1st HSR 1991
Lines built : • Frankfurt - Köln: 177 km • Ingolstadt - Nürnberg: 89 km
Under construction • Ebensfeld – Erfurt: 122 km • München-Leibzig-Berlin planned opening
2017
Most HSR lines are operated at 250 kph
Only lines with max speed 300 kph are listed here
Created by Mineta Transportation Institute

Germany: Rolling Stock Type Design Vmax Trains In Service
ICE-1 Siemens 280 kph 60 1982 ICE-2 Siemens 280 kph 44 1989 ICE-3 Siemens 330 kph 72 2000
ICE-2
ICE-3

FS Italy 1st HSR 2005 (300kph)
Lines built : Distance Trip time note • Roma - Napoli: 200 km 1hr 30min 25 kV • Turin - Novara: 84 km 25 kV • Milano – Treviglio: 24 km 3 kVdc • Padua - Mestre: 24 km 3 kVdc
Under construction
• Milano - Bologna - Firenze
Italy has an extensive alignment of 200+ kph. It had trains running at 200 to 250 kph starting in the 1970ies.
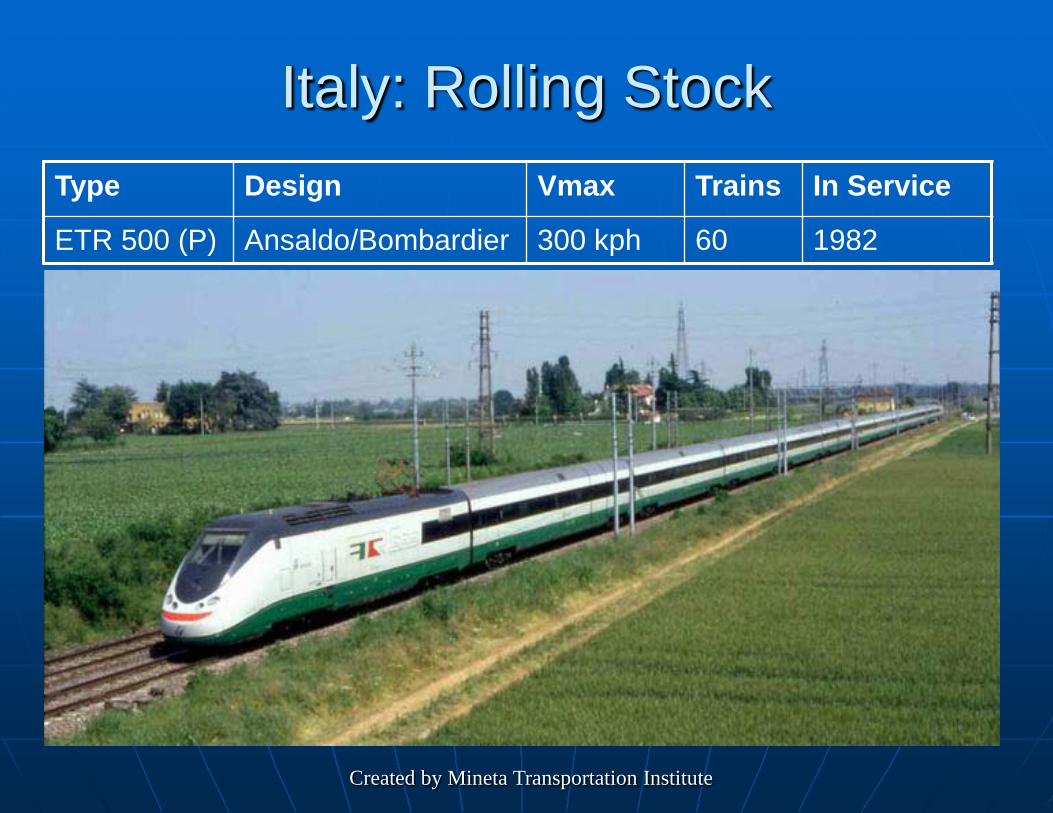
Italy: Rolling Stock Type Design Vmax Trains In Service
ETR 500 (P) Ansaldo/Bombardier 300 kph 60 1982
Created by Mineta Transportation Institute

Congressionally Designated Steel Wheel on Rail Systems
Total System Cost
New York (Empire) $1.5
Pennsylvania (Keystone) $1.3
New England Rail $2.8
Southeast High Speed Rail $4.9
South Central Corridor $2.9
Florida High Speed Rail $14.4
Midwest Regional Rail $8.6
Ohio-Cleveland Hub $3.9
California High Speed Rail $33.0
Pacific Northwest $2.4
Gulf Coast $5.2
Total Costs $80.9
(All costs in 2007$ Billions)
Created by Mineta Transportation Institute

Intermediate and High Speed Rail Corridor Designations
Intermediate Speed Rail
High Speed Rail
Created by Mineta Transportation Institute

California High-Speed Rail Authority
Authorized by legislation in 1996 Nine-member authority board - five
appointed by Governor, two by State Senate, two by State Assembly
Budget expended in state/federal funds to date, $200+M
Program level Environmental Clearance certified on July 9, 2008
Created by Mineta Transportation Institute

CHSRA 2009 Fiscal Summary Business plans by Charles River Associates, 2001,
expanded upon by Cambridge Systematics, 2008 Expected performance, at $55 per direction, of the
starter line from Anaheim via Los Angeles, the Central Valley, Gilroy, San Jose, to San Francisco: • Completion – 2018-2020 • Ridership – 45 to 55 million per year • Gross revenue - $2.4B • Net after O and M - $1.1B
Design, construction and rolling stock (year of construction values) • Federal - $17 to $19B • State - $9 B • Public/private partnership - $10 to $12B • Local cost sharing - $4 to $5 B

California’s Existing & Projected Population
29.933.9
4045
5259
0
10
20
30
40
50
60
1990 2000 2010 2020 2030 2040
Sources: 1990 and 2000 - U.S. Census Bureau; Projections - CA Dept. of Finance, 1998
(in Millions)

Optimal Express Trip Times between City Pairs (220 mph [350 kph] maximum speed)
HIGH-SPEED TRAIN TRAVEL TIMES
High-speed trains will provide Californians with safe, predictable, consistent and competitive region-to-region transportation.
Los Angeles
N/A
2:38
2:09
1:18
2:11
1:24
0:54
0:33
0:20
Los Angeles San Francisco San Jose San Diego Sacramento Fresno Bakersfield Riverside Anaheim
San Francisco
2:38
N/A
0:30
3:56
1:06
1:20
1:51
3:10
2:57
San Jose
2:09
0:30
N/A
3:27
0:52
0:51
1:21
2:41
2:28
San Diego
1:18
3:56
3:27
N/A
3:29
2:42
2:12
0:48
N/A
Sacramento
2:11
1:06
0:52
3:29
N/A
0:53
1:23
2:43
2:37
Fresno
1:24
1:20
0:51
2:42
0:53
N/A
0:37
1:56
1:43
Bakersfield
0:54
1:51
1:21
2:12
1:23
0:37
N/A
1:26
1:13
Riverside
0:33
3:10
2:41
0:48
2:43
1:56
1:26
N/A
N/A
Anaheim
0:20
2:57
2:28
N/A
2:37
1:43
1:13
N/A
N/A
Travel Time (Hrs:Min)

Sources of HSR Ridership (Interregional Trips)
Created by Mineta Transportation Institute

California’s 2050 population estimated at 60M+ Alternatives to meet that need:
Key variables
Highway/Airport Alternatives: 3,000 added lanes/miles of freeway and 2 new international airports
California High Speed Rail Alternative: 790 miles of California High Speed Rail
Cost $100 Billion $40 Billion
Capacity beyond 2050
None Adequate until 2100
Energy 22 million barrels of petroleum per year more than HSR
Electric power: 1/5 the energy of a car, 1/3 energy of a plane per seat/mile
Pollution Creates 18 billion more pounds per year of CO2 than HSR
Base Case
Safety 43,000 people killed and hundreds of thousands injured on US highways in 2007
No fatalities in 45 years of Japanese Shenkansen and more than 25 years of French TGV. Created by Mineta Transportation Institute

ECONOMIC BENEFITS Like past major infrastructure projects – California’s water, university and highway systems – the high-speed train system would be an economic stimulant and smart investment in California’s infrastructure.
Creating 160,000 construction-related jobs lasting decades.
High-speed trains improve California’s economy, resulting in an additional 450,000 new permanent jobs by 2035.
Cost benefit analysis based upon “investment grade” ridership forecasts concluded that the high-speed train system benefits would be more than two times its cost.


Anaheim, CA

Fresno, CA

40
Program Management Dominic Spaethling
SF to San Jose
Tim Cobb, PE, HNTB
Altamont
Brent Ogden, AECOM
Gary Kennerly SJ to Central Valley
Dave Mansen, Parsons
Tom Tracy, PE
Fresno to Palmdale
Bob Schaevitz, URS/Hatch Mott/ARUP
Sac to Fresno
Ken Sislak, AECOM
Jose Martinez, PE LA to San Diego
Mike Zdon, HNTB
Bruce Armistead, PE
LA to Anaheim
Eugene Kim, STV
Palmdale to LA
Dan Tempelis, Hatch Mott/URS.ARUP
Created by Mineta Transportation Institute


Contact Information California High-Speed Rail
Authority 925 L Street, Suite 1425 Sacramento, CA 95814
Telephone (916) 324-1541
Fax (916) 322-0827
www.cahighspeedrail.ca.gov Created by Mineta Transportation Institute