american tower announces viom transaction transaction highlights 3 portfolio › ~42,200 towers and...
TRANSCRIPT

American Tower Announces Viom Transaction October 21, 2015

Forward-Looking Statements “Safe Harbor” Statement under the Private Securities Litigation Reform Act of 1995: This presentation contains forward-looking statements concerning our goals, beliefs, strategies, future operating results and underlying assumptions. Actual results may differ materially from those indicated by these forward-looking statements as a result of various important factors, including those described in the appendix attached hereto, Item 1A of our Form 10-K for the year ended December 31, 2014 under the caption “Risk Factors” and other filings we make with the SEC. We undertake no obligation to update the information contained in this presentation to reflect subsequently occurring events or circumstances. Definitions are provided at the end of the presentation and reconciliations to GAAP measures are available on our website at www.americantower.com.
2

Viom Transaction Highlights
3
Portfolio
› ~42,200 towers and ~200 Indoor DAS systems w/ avg. tenancy of ~2.3
› Low overlap with existing Indian assets
› Nearly half of sites in densely populated Metro and Circle A areas
› Capacity for at least one incremental tenant with minimal augmentation capex
Transaction is expected to close by mid-2016
Strategic Implications
› Extends relationships with key customers
› Meaningful opportunity for incremental revenue, expense and SG&A synergies
› Enhances AMT’s role in Digital India Initiative
Consideration
› Acquisition of 51% interest for total cash consideration of INR ~76 Billion
› Options to acquire up to remaining 49% stake, beginning in 2018-2019
› Results will be consolidated in AMT’s financials
› Viom has INR ~58B in existing INR-denominated debt(1)
Financial Impact
› Immediately accretive to AFFO/share
› Expected to be financed in a manner consistent with maintaining AMT’s investment grade credit rating
› AMT remains committed to previously announced deleveraging path
(1) As of September 30, 2015.

Country Overview › Largest free market democracy in the world › Population of nearly 1.3 billion, with over half under the age of 25 › Average Annual Real GDP growth of over 7% from 2010-2014
Market Overview - India
4
Wireless Overview
› Mobile usage growing rapidly › Nearly 90% of Internet connections still made on 2G › Smartphone and 3G/4G penetration of under 25% › Fixed-line penetration of less than 5% › Sub-$100 smartphones increasingly available
› Major carriers investing actively in networks › Increasingly favorable wireless regulatory environment › Industry ARPU is growing(1) › Successful spectrum auction completed in early 2015 › Major carriers have announced aggressive near-term 3G/4G investments › Wireless capital expenditures expected to grow at 15% CAGR from 2015-2019
Sources: Altman Vilandrie & Co, Bank of America Merrill Lynch Wireless Matrix, GSMA Intelligence, Cisco VNI Report, 2014, Internet and Mobile Association of India, Deloitte & Touche June 2015 Indian Tower Industry Report.
Long Term Growth
Opportunity
Early Stage Networks
~1.3 Billion People
(1) ARPU is defined as average revenue per user.

Indian Wireless Trends
5
Smartphone Penetration
Mobile Data Usage(1)
13%
58%
2014 2015E 2016E 2017E 2018E 2019E 2020E
94
1,869
2014 2015E 2016E 2017E 2018E 2019E 2020E
849
1,603
32% 32%
2009 2010 2011 2012 2013 2014 2015E
Positive Backdrop for Incremental Wireless Network Investments
Sources: Bank of America Merrill Lynch Wireless Matrix, Deloitte & Touche June 2015 Indian Tower Industry Report.
(1) In petabytes/month. (2) In INR billions. Reflects averages or summations for Reliance, Vodafone, Bharti Airtel and Idea Cellular’s wireless capex spend in India.
EBITDA Margin %
Wireless Service Revenue(2)
Wireless Capex(2)
208 245
25%
15%
2009 2010 2011 2012 2013 2014 2015E
Capex as % of Service Revenue

Merger of ATC India and Viom Creates Strategic Pan-India Tower Footprint
6
Pan-India Footprint Supports Expansion of Mobile Broadband Throughout the Country
› Transaction provides transformative presence
› Positions AMT to benefit from aggressive 3G/4G deployments following recent spectrum auctions
› Portfolio focused in and around key population centers
› Average tenancy of ~2.2 tenants per tower
› Revenue primarily from leading national Indian mobile operators
› Gross margin excluding pass-through of ~68%(1)
Pro Forma Portfolio Highlights
VIOM Legacy AMT
(1) Reflects annualized operating results as of June 30, 2015, pro forma for full quarter contribution from VIOM assets, at 2Q 2015 average fx rates.

Pro Forma Global Portfolio Highlights(1)
66% 13%
6%
5%
3% 7%
Rental & Management Revenue Excludes Pass-Through Revenue
U.S.IndiaBrazilMexicoNigeriaOther
010,00020,00030,00040,00050,00060,00070,00080,00090,000
100,000
2007 2008 2009 2010 2011 2012 2013 2014 2015
Tower Count
International U.S.
(1) Pro forma includes the annualized impacts of the Company’s recently completed Airtel Nigeria acquisition and annualized quarterly Viom operating results for the quarter ended June 30, 2015.
› Pro forma global tower count of nearly ~140K towers with ~2.0 tenants per tower
› Continued focus on partnering with large, multi-national mobile network operators
› Leading presence in markets with wireless networks in early stages of development should help strengthen and extend our long term growth
7
Focused on Generating Optimal Global Risk-Adjusted Stockholder Returns

Key Takeaways American Tower continues to pursue its growth strategy in support of its vision to be the premier independent owner, operator and developer of wireless and broadcast communications real estate globally
Strategic Benefits: › Expected to be immediately accretive to AFFO per share
› Significantly enhances presence in the most populous free market democracy in the world
› Positions American Tower to benefit from accelerating network investments by major Indian wireless carriers while supporting the Digital India Initiative
› Enables meaningful expansion while preserving commitment to investment grade rating
8
Definitions are provided at the end of this presentation.

Appendix Appendix
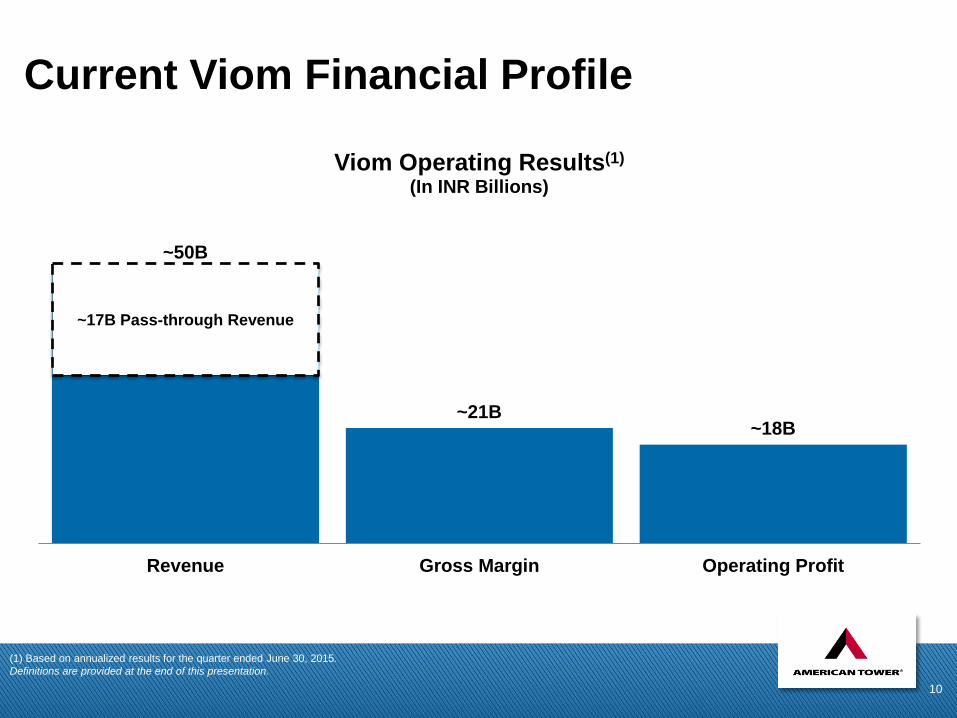
Current Viom Financial Profile
10
~50B
~21B ~18B
Revenue Gross Margin Operating Profit
Viom Operating Results(1)
(In INR Billions)
~17B Pass-through Revenue
(1) Based on annualized results for the quarter ended June 30, 2015. Definitions are provided at the end of this presentation.

Viom Portfolio Characteristics(1)
11
Rooftop 40%
Ground Based 60%
Tower Type Metros
11%
Circle A 36% Circle B
40%
Circle C 13%
Circle
1 or less 39%
2 25%
3 18%
4 or more 18%
# of Tenants
0-3 9%
3-5 54%
5-7 24%
>7 14%
Years in Portfolio
(1) All metrics as of June 30, 2015.

Additional Portfolio Metrics(1)
12
Legacy AMT India Viom Pro Forma
24%
20%
17%
12%
8%
20%
Revenue by Customer
Vodafone
Idea
Bharti Airtel
Aircel
Tata
Other
12%
14%
9%
9% 30%
8%
18%
Revenue by Customer
VodafoneIdeaBharti AirtelUninorTataAircelOther
43%
68%
Gross Margin % Gross Margin % Ex PT
Margin Profile
1.9 tenants
3.4 years
Tenancy Avg. Remaining Term
Tenant Characteristics
2.2 tenants
5.4 years
Tenancy Avg. Remaining Term
Tenant Characteristics
8% 12%
11%
7% 37%
25%
Revenue By Customer
Vodafone
Idea
Uninor
Aircel
Tata
Other
42% 64%
Gross Margin % Gross Margin % Ex PT
Margin Profile
2.3 tenants
6.1 years
Tenancy Avg. Remaining Term
Tenant Characteristics
(1) All metrics reflect operating results for the quarter ended June 30, 2015.
47%
80%
Gross Margin % Gross Margin % Ex PT
Margin Profile

Recent ATC India Growth Highlights(1)
13
435
624
Q114 Q214 Q314 Q414 Q115 Q215
New Builds
(1) Reflects existing ATC India portfolio. Excludes Viom. (2) Excludes pass-through revenue.
1.79
1.94
Q114 Q214 Q314 Q414 Q115 Q215
Tenants Per Tower
601
660
Q114 Q214 Q314 Q414 Q115 Q215
Tenant Revenue Per Tower (In INR 000’s)(2)
Recent Trends in India Have Supported Strong Growth for ATC

Definitions Adjusted EBITDA: Net income before Income (loss) on discontinued operations, net; Income (loss) from equity method investments; Income tax benefit (provision); Other income (expense); Gain (loss) on retirement of long-term obligations; Interest expense; Interest income; Other operating income (expense); Depreciation, amortization and accretion; and Stock-based compensation expense.
Adjusted EBITDA Margin: the percentage that results from dividing Adjusted EBITDA by total revenue.
Adjusted Funds From Operations, or AFFO: NAREIT Funds From Operations before (i) straight-line revenue and expense, (ii) stock-based compensation expense, (iii) the non-cash portion of our tax provision, (iv) non-real estate related depreciation, amortization and accretion, (v) amortization of deferred financing costs, capitalized interest, debt discounts and premiums and long-term deferred interest charges, (vi) other income (expense), (vii) gain (loss) on retirement of long-term obligations, (viii) other operating income (expense), and adjustments for (ix) unconsolidated affiliates and (x) noncontrolling interest, less cash payments related to capital improvements and cash payments related to corporate capital expenditures. AFFO per Share: Adjusted Funds From Operations divided by the diluted weighted average common shares outstanding.
Segment Gross Margin: segment revenue less segment operating expenses, excluding stock-based compensation expense recorded in costs of operations; depreciation, amortization and accretion; selling, general, administrative and development expense; and other operating expenses. International rental and management segment includes interest income, TV Azteca, net.
Segment Gross Margin Conversion Rate: the percentage that results from dividing the change in gross margin by the change in revenue.
Segment Operating Profit: Segment gross margin less segment selling, general, administrative and development expense attributable to the segment, excluding stock-based compensation expense and corporate expenses. International rental and management segment includes interest income, TV Azteca, net.
Pass-through Revenues: In several of our international markets we pass through certain operating expenses to our tenants, including in Latin America where we primarily pass through ground rent expenses, and in India and South Africa, where we primarily pass through fuel costs. We record pass-through as revenue and a corresponding offsetting expense for these events.
14

Risk Factors This presentation contains "forward-looking statements" concerning our goals, beliefs, expectations, strategies, objectives, plans, future operating results and underlying assumptions, and other statements that are not necessarily based on historical facts. Examples of these statements include, but are not limited to, statements regarding the proposed closing of the transaction, expected financial projections for the portfolio, the expected cash consideration and the expected sources of funds to pay for the transaction. Actual results may differ materially from those indicated in our forward-looking statements as a result of various important factors, including: (1) decrease in demand for our communications sites would materially and adversely affect our operating results, and we cannot control that demand; (2) if our tenants share site infrastructure to a significant degree or consolidate or merge, our growth, revenue and ability to generate positive cash flows could be materially and adversely affected; (3) increasing competition for tenants in the tower industry may materially and adversely affect our pricing; (4) competition for assets could adversely affect our ability to achieve our return on investment criteria; (5) our business is subject to government regulations and changes in current or future laws or regulations could restrict our ability to operate our business as we currently do; (6) our leverage and debt service obligations may materially and adversely affect us; (7) failure to successfully and efficiently integrate acquired or leased assets, including those leased from Verizon, into our operations may adversely affect our business, operations and financial condition; (8) our expansion initiatives involve a number of risks and uncertainties that could adversely affect our operating results, disrupt our operations or expose us to additional risk; (9) our foreign operations are subject to economic, political and other risks that could materially and adversely affect our revenues or financial position, including risks associated with fluctuations in foreign currency exchange rates; (10) a substantial portion of our revenue is derived from a small number of tenants, and we are sensitive to changes in the creditworthiness and financial strength of our tenants; (11) new technologies or changes in a tenant’s business model could make our tower leasing business less desirable and result in decreasing revenues; (12) if we fail to remain qualified as a REIT, we will be subject to tax at corporate income tax rates, which may substantially reduce funds otherwise available; (13) complying with REIT requirements may limit our flexibility or cause us to forego otherwise attractive opportunities; (14) certain of our business activities may be subject to corporate level income tax and foreign taxes, which reduce our cash flows and may create deferred and contingent tax liabilities;
15

Risk Factors (continued)
(15) we may need additional financing to fund capital expenditures, future growth and expansion initiatives and to satisfy our REIT distribution requirements; (16) if we are unable to protect our rights to the land under our towers, it could adversely affect our business and operating results; (17) if we are unable or choose not to exercise our rights to purchase towers that are subject to lease and sublease agreements at the end of the applicable period, our cash flows derived from such towers will be eliminated; (18) restrictive covenants in the agreements related to our securitization transactions, our credit facilities and our debt securities could materially and adversely affect our business by limiting flexibility, and we may be prohibited from paying dividends on our common stock if we fail to pay scheduled dividends on our preferred stock, which may jeopardize our qualification for taxation as a REIT; (19) our costs could increase and our revenues could decrease due to perceived health risks from radio emissions, especially if these perceived risks are substantiated; (20) we could have liability under environmental and occupational safety and health laws; and (21) our towers, data centers or computer systems may be affected by natural disasters and other unforeseen events for which our insurance may not provide adequate coverage. For additional information regarding factors that may cause actual results to differ materially from those indicated in our forward-looking statements, we refer you to the information contained in Item 1A of our Form 10-K for the year ended December 31, 2014. We undertake no obligation to update the information contained in this presentation to reflect subsequently occurring events or circumstances.
16