american water works association · american water works association washington, dc . 1...
TRANSCRIPT

American Water Works Association Study on Private Activity Bonds and Water Utilities
June 2009
San Francisco
50 California Street Suite 2300
San Francisco, CA 94111
415-982-5544 415-982-4513 fax
www.pfm.com
Philadelphia Two Logan Square, Suite 1600
18th & Arch Streets Philadelphia, PA 19103
215-567-6100
215-567-4180 fax www.pfm.com
Washington, D.C. 601 Pennsylvania Avenue, NW
Suite 900 South Building Washington, D.C. 20004
202-220-3168
292-639-8238 fax www.pfm.com
Seattle 1202 Third Avenue
Suite 5380 Seattle, WA 98101
206-264-8900
206-264-9699 fax www.pfm.com
Prepared by The PFM Group

Table of Contents Introduction PAGE
I. Executive Summary .............................................................................. 1
II. Changes to the Municipal Bond Market ............................................ 3
III. Specific Discussion of AWWA’s Research Questions .................... 4
IV. Conclusions ........................................................................................... 20

Steering Committee for AWWA Study of Private Activity Bonds
Chair Aurel Arndt General Manager Lehigh County Authority Wescosville, Pennsylvania Joe Bella Executive Director Passaic Valley Water Comm. Clifton, New Jersey Gary Breaux Director of Finance East Bay Municipal Utility District Oakland, California Patrick Cairo Executive Vice President United Water New Jersey Harrington Park, New Jersey Steven C. Hellman, CPA, CGFM Superintendent Business Services Greater Cincinnati Water Works Cincinnati, Ohio Lendel G. Jones Director Governmental Affairs American Water Voorhees, New Jersey
Contractor staff: Dean Kaplan Managing Director Public Financial Management, Inc. Philadelphia, Pennsylvania Stephen T. Wisloski Senior Managing Consultant Public Financial Management, Inc. San Francisco, California Roan Blacker Senior Managing Consultant Public Financial Management, Inc. Seattle, Washington AWWA Staff: Tom Curtis Deputy Executive Director for Government Affairs American Water Works Association Washington, DC Tommy Holmes Legislative Director American Water Works Association Washington, DC

1
Introduction In August of 2008, the American Water Works Association (AWWA) commissioned Public Financial Management (PFM) to conduct a study of private activity bonds (PABs) used to finance drinking water or wastewater infrastructure projects. Much of this report was written by PFM, with some portions written by the project steering committee, which oversaw the study, or by AWWA staff. Specifically, AWWA set out to learn more about (1) PABs and how they are used; (2) how the Federally-mandated volume cap allocates PABs to states, and then how states distribute their PAB allocations to local governments and projects; and (3) the possible advantages and disadvantages to the water and wastewater community – private water companies, municipal governments, and utility customers – if PABs used for water infrastructure projects were removed from the volume cap. Fundamental to AWWA’s inquiry was whether removing the volume cap would remove barriers to, and provide more investment capital for the completion of water and sewer projects. This Study on Private Activity Bonds and Water Utilities (hereafter, the “Study”) provides the results of PFM’s research. This Study does not contemplate the impacts of the American Recovery and Reinvestment Act of 2009 (aka, the “Stimulus Act”), signed into law on February 17, 2009, after this Study was substantively completed. Among other provisions, the Stimulus Act provides for “temporary modification of alternative minimum tax limitations on tax-exempt bonds (§1503).” Among these modifications is the removal of PABs from the Alternative Minimum Tax (AMT) during 2009 and 2010, which in turn allows tax-exempt PABs to share the same tax advantage that is currently enjoyed by tax-exempt governmental bonds. It also goes further in removing interest on any tax-exempt bond from the adjustment to current earnings for corporations. Executive Summary AWWA posed a number of questions in its Request for Proposals, and the following discussion explores each of these in the order they were presented. The report then provides several conclusions with respect to possible policy changes. To begin, however, we can provide some general observations. With respect to basic information, some of the more salient items from PFM’s research were:
1. As anticipated by AWWA’s RFP, PABs have traditionally provided a considerable yield advantage, of more than a full percentage point, when compared to similar taxable debt, and this advantage is even more pronounced for lower investment grade credits (e.g., those rated in the A and BBB categories, which is similar to most private water companies, as opposed to the highest rated AAA and AA categories);
2. PABs issuance subject to the volume cap is dominated by housing and housing-related purposes,
comprising some 65% or $18.2 billion of total PABs issued in 2007. By comparison, PABs for water and sewer related purposes comprised only 1.3% of issuance ($374.1 million) in 2007;
3. The total PAB issuance subject to the volume cap, $28 billion in 2007, was dwarfed by the overall
municipal market bond issuance of $427.6 billion during the same year; and

2
4. Individual states have widely-varying allocation procedures and PAB utilization levels, as measured by the percentage of PABs carried over as compared to overall volume cap. However, in almost every case, housing and state-level housing finance agencies (HFAs) comprise the majority of PAB issuance, and often HFAs serve as the default “warehouse” for unused PAB allocation.
With respect to advantages and disadvantages, we conclude that private water companies, public/private partnerships, vendors, contractors and other private entities, and municipalities or governmentally owned-utilities that otherwise utilize PABs as part of their overall financing strategies could benefit if PABs were removed from the volume cap, for several reasons. First, PAB users would not have to contend with state allocation procedures and limitations (which can include a bias toward other purposes, compressed timelines to commence with projects, and small available par amount insufficient for large-scale water conveyance and treatment projects), and second, they should be able to attain a lower overall cost of borrowing. Utility customers, to the extent they are served by private water companies, should benefit from their utility companies’ lower borrowing costs due to the regulatory guidelines employed by public utilities commissions (PUCs). Specifically, because PUCs regulate private water companies’ weighted average cost of capital (WACC), decreased borrowing costs should result either in benefits being passed along to utility customers in the form of lower rates, and/or because companies would be better-positioned to absorb increased costs in other areas (such as operating costs) before needing to pass these costs along to customers. Less clear is whether customers will benefit directly, or at least immediately, in cases where public entities maintain control of the rate-setting mechanism (e.g., in a fee-for-service agreement with a private water company). The impacts to municipal governments and other entities that do not plan to utilize PABs are the least clear-cut, but are expected to be minimal. In general, removing water and wastewater infrastructure projects from the volume cap should increase overall PAB issuance, as debt issuers shift to using PABs in lieu of more expensive taxable bonds. However, increased PAB issuance generally should not increase municipalities’ borrowing costs for at least two reasons. First, municipalities generally issue non-AMT tax-exempt bonds, as opposed to PABs (which are subject to the Alternative Minimum Tax, or AMT), and these two types of bonds generally appeal to different investors. Second, the large size of the municipal market (almost $428 billion of bonds sold in 2007) relative to the aggregate size of private water company outstanding debt ($7 billion for eleven of the largest companies combined) suggests that even elevated issuance by private companies should not distort the overall level of municipal bond yields. Finally, with respect to the water and wastewater industry as a whole, we conclude that the removal of PABs from the volume cap on balance would benefit the industry, in that a lower cost of borrowing could provide greater leverage of private equity than is currently available, and thus bring more capital (whether fully private, or in the form of public-private partnerships) into the market for water and wastewater projects. However, we caution that any conclusions based upon historical market data must include the caveat that future market conditions are very uncertain. During the time period when this Study was being written, the financial markets generally and the municipal bond market in particular have been undergoing turmoil unprecedented in the post-World War II period. Since much of this turmoil has developed following the bankruptcy of Lehman Brothers, Inc. on September 15, 2008, this topic was not contemplated in AWWA’s RFP. Nonetheless, we believe this subject warrants discussion due to the magnitude of its impacts to the municipal bond market and implications for the policy prescriptions discussed in this Study. We provide a brief review of these impacts in the following section.

3
Changes to the Municipal Bond Market For at least the past 10 years, the municipal bond market functioned in a relatively consistent manner. Notwithstanding the notable events during that period, including the Asian currency crisis, the failure of hedge fund Long Term Capital Management, the “dotcom” stock market crash, the 9/11 terrorist attacks, the economic recession of 2002-2003, and the wars in Iraq and Afghanistan, the primary features of the market remained the same. Total annual bond issuance trended upward during this period, from a low of $200 billion issued in 2000 to a record $428 billion issued in 2007. Underwriting was dominated by ten to twelve investment banks that controlled over 80% of market share. Well over half of all bonds were sold with credit enhancement from one of seven “monoline” bond insurers, which provided “AAA” ratings and a commoditization of municipal bonds generally. Long-term municipal bond yields held relatively steady at near-record lows during this period, drifting between the low 4.00% to high 5.00% range. Beginning in June of 2007, however, the financial markets have experienced a level of disruption not seen since the 1930s, and the turmoil accelerated following the bankruptcy of Lehman Brothers, Inc., which at the time was the fourth-largest investment bank on the United States. This turmoil is ongoing with no indication of when the more “normalized” market conditions of the previous decade will return. In order to assist with our responses to a number of AWWA’s questions, PFM surveyed investment bankers from several of the largest remaining underwriting firms including Citigroup, JP Morgan Chase, Morgan Stanley and Goldman Sachs. We found a uniformity of opinion among these firms that the municipal market has fundamentally changed going forward. These changes include:
1. The exit, bankruptcy, merger, change in status of, or substantial injection of Federal government funds into seven of the top ten municipal underwriting firms, and widespread layoffs of personnel are resulting in diminished underwriting capacity (both in terms of capital and of staff);
2. The multiple ratings downgrades and effective exit from the market of five of the top seven bond insurers, the merger of the remaining two insurers, and resulting uncertainty regarding the long-term value of bond insurance, is ending muni bond “commoditization” and causing far greater investor scrutiny of individual credits;
3. The collapse of the auction rate bond market, and unavailability of liquidity and credit support for new variable rate demand bonds, has left many issuers (particular those rated below the AAA and AA categories) unable to access the variable rate debt market, and therefore with few financing alternatives to short-term notes and long-term fixed-rate debt;
4. Interest rate volatility has caused large portfolio losses among non-traditional (and often leveraged) purchasers of municipal bonds, triggering forced selling and a large supply of bonds being offered in the secondary market, with resulting decreases in bond prices and corresponding increases in interest rates. This increase in rates is exacerbated by the knowledge that insurer AIG held a portfolio of municipal bonds estimated to be $65 billion as of its effective Federal takeover, that is expected to be liquidated over the next two years;
5. The credit crisis (and decreased ability to trade on margin) has forced some of these same leveraged non-traditional players to the sidelines, causing bond issuers to rely on more traditional “retail” and

4
“buy-and-hold” investors (e.g., individuals and mutual funds) who tend to purchase smaller blocks of securities, rendering large bond sales more difficult; and finally,
6. The deterioration of economic conditions generally is having a severe impact on municipal government budgets, due to decreased property tax revenues from a lower assessed value base, diminished sales tax revenues, lower income tax collections due to sharply higher unemployment, or myriad other impacts to governmental revenue sources. This may require governments to address budget shortfalls via deficit financing and/or debt restructuring, but in the near term will also result in project financings being deferred, either because projects are no longer required due to slower growth, or due to inability to access the financial markets.
The net effect of these changes – greater reliance on fixed-rate debt, a backlog of primary market supply of municipal bonds, a glut of secondary market supply, a sharp reduction in institutional and non-traditional investor demand, and fiscal stress for state and local governments – is expected to be a period of significantly higher long-term fixed interest rates, much greater effort marketing individual credits due to the reduced usage of bond insurance, and more difficulty selling large (generally characterized as >$500 million) bond issues due to the reliance on retail investors. Indeed, PFM is observing these conditions in the current market (4th quarter of 2008), with bond yields on new issues near 6.00% for AAA and AA rated credits, to over 8.00% for BBB and non-rated credits. Given that much of AWWA’s focus concerned the possible market impacts of changes to PAB policy, we felt it necessary to emphasize that broad structural changes occurring in the markets were of such magnitude as to potentially overwhelm policy changes related to PABs. In our responses to AWWA’s questions, where the answers contain a component that is dependent upon market conditions, we have tried to comment both with respect to the “normal” market conditions observed over the past decade, and what would be the case should current, comparatively abnormal market conditions persist. Specific Discussion of AWWA’s Research Questions 1. What are private activity bonds and how are they used? Private activity bonds (PABs) are a type of municipal bond. As their name implies, instead of being issued to finance facilities for general public use (such as bridges, fire stations, courthouses, and so forth), they are issued for the benefit of, or due to the substantial participation of, a private (nongovernmental) entity. Certain types of PABs, including those described in the federal tax code as being issued to fund “facilities for the furnishing of water” and “sewage facilities,” qualify for tax-exemption. Municipal bonds generally are described as “tax-exempt” because the interest payments to bond investors are, to use the tax code’s phrasing, “not includable in their gross income for federal income tax purposes.” In most cases, municipal bonds are exempt from the issuer’s jurisdictional state income tax as well; for example, a tax-exempt bond issued by San Francisco will be exempt from federal and California state tax, but not from New Jersey state tax. As such, municipal bond investors will accept interest rates that are lower than those on taxable bonds of comparable credit quality and business terms. The basic formula that expresses this relationship is:
Taxable Equivalent Yield = Tax Exempt Yield / (1 – Investor’s Marginal Tax Rate)

5
As an example, if a tax-exempt bond has a yield of 4.50%, and an investor has a marginal income tax rate in the top income tax bracket of 35%, then the Taxable Equivalent Yield (TEY) is:
TEY = 4.50% / (1 – 0.35) = 6.92%
This means the investor would be indifferent between a tax-exempt bond yielding 4.50% and a taxable bond yielding 6.92%. This implies that, all things being equal, the tax exemption of municipal debt provides governments and related entities with a lower cost of borrowing than that available to PAB issuers. In reality, the yield difference between PABs and taxable bonds varies due to a number of factors in addition to tax rates, and the observed difference between the PABs and tax-exempt yields is often less than implied by taxes alone. Also, for the purpose of AWWA’s study, it is important to note that while most governmental bonds are fully tax-exempt, PABs generally are subject to the federal alternative minimum tax (AMT). In practice there is somewhat less demand for PABs than for fully tax-exempt bonds, since many investors (who would otherwise purchase municipal bonds) are subject to the AMT, and are required to pay federal income tax on PAB interest. As a result, when observed over the past five years, PABs have somewhat higher yields, of approximately 0.50% across the yield curve, than fully tax-exempt bonds. PFM determined this figure by analyzing data from Thompson Municipal Market Monitor, a widely-used municipal pricing service. However, since the market turmoil of mid-September 2008, we have observed yields on AMT bonds to be in excess of 200 basis points (2.00%) above tax-exempt bonds. Comparing PABs yields to those of taxable bonds, from the past of five years of data, we see that PAB yields were substantially lower:
Table 1-A: Average PAB versus Taxable Yields, A-Rated Credits, From January 2003 to December 2008
Maturity Private Activity Taxable YieldIn Years Bonds Bonds Difference
2 3.20% 4.38% 1.17%5 3.73% 4.90% 1.16%10 4.33% 5.46% 1.13%30 4.93% 6.06% 1.13%
Source: Thomson Municipal Market Monitor The rates in the above table are for A-rated credits described as medium investment grade by Standard & Poor’s Ratings Group (S&P), Moody’s Investors Service (Moody’s), and Fitch Ratings (Fitch). We chose A-rated indices because these ratings correspond closely to those of the largest private water companies (see following Table 8). Both the private activity bond and taxable bond yields shown above are for general obligation municipal credits, which by convention are the industry benchmark; it is probable that yield spreads for private water companies are if anything wider than the ones observed above. Since mid-September, however, this relationship has changed, and yields are much more dependent upon underlying credit than upon tax status, and yield relationships sometimes defy explanation. For example, as shown below, the yield on 30-year A-rated AMT bonds has been higher than similar-rated taxable debt:

6
Table 1-B: Average PAB versus Taxable Yields, A-Rated Credits, September 15 to December 22, 2008
Maturity Private Activity Taxable YieldIn Years Bonds Bonds Difference
2 3.82% 4.22% 0.40%5 4.78% 4.94% 0.17%10 5.88% 6.05% 0.16%30 6.91% 6.62% ‐0.29%
Source: Thomson Municipal Market Monitor Finally, the issuance of certain “qualified” private activity bonds – including those used to finance drinking water or wastewater infrastructure projects – is further constrained by a federally-mandated “volume cap” that is determined by population-based and inflation-indexed formula, and applied to each of the 50 states and the District of Columbia. Table 2 below summarizes the types of PABs that are and are not subject to the volume cap:
Table 2: Qualified PABs Subject and Not Subject to the Volume Cap
PABs Subject to Volume Cap PABs Not Subject to Volume Cap
‐ EXEMPT FACILITY BONDS, including: ‐ EXEMPT FACILITY BONDS, including: ‐‐ Mass Commuting FACILITIES ‐‐ Airports ‐‐ Facilities for the Furnishing of Water ‐‐ Docks and Wharves ‐‐ Sewage Facilities ‐‐ Environmental Enhancements of Hydro‐electric ‐‐ Solid Waste Disposal Facilities ‐‐ Qualified Public Educational Facilities ‐‐ Qualified Residential Rental Projects ‐‐ Governmentally Owned Solid Waste Disposal Facilities ‐‐ Facilities for local furnishing of electric energy or gas ‐‐ Governmentally Owned High‐Speed Intercity Facilities ‐‐ Local District Heating or Cooling Facilities ‐‐ Privately Owned High‐Speed Intercity Facilities ‐‐ Qualified Hazardous Waste Facilities (only 75% of bond proceeds) ‐‐ Privately Owned High‐Speed Intercity Rail Facilities (only 25% of bond proceeds) ‐ QUALIFIED VETERANS' MORTGAGE REVENUE BONDS ‐‐ Qualified Enterprise Zone and Empowerment Zone
‐ QUALIFIED 501(c)(3) BONDS *‐ QUALIFIED MORTGAGE REVENUE BONDS (i.e., Hospitals, Higher Education Facilities, and
Non‐Profits)‐ QUALIFIED SMALL ISSUE BONDS
‐ QUALIFIED REDEVELOPMENT BONDS
Source: IRS Tax‐Exempt Private Activity Bonds Guide* Qualified 501(c)(3) Bonds are fully tax‐exempt, and not subject to AMT
2. What is the volume cap on PABs and how is it allocated to states/cities/projects? The federal government allocates the volume cap to the states, and then each state uses its own unique procedure to further allocate PABs to municipalities and projects. Federal Allocations to States: The Internal Revenue Service (IRS) uses a set formula to determine PAB volume cap allocations to the states. In 2008, the volume cap for each state was equal to the greater of $85 per capita using 2007 population data from the U.S. Census Bureau, or $262,095,000. In late October 2008, the IRS announced in Revenue Procedure 2008-66 that the volume cap formula for 2009 will be the greater of $90 per capita, or $273,270,000. The per capita number is revisited annually and adjusted for inflation, but is only changed in increments of $5, so 2009 marks the first change to the per capita component since 2004, when it was raised to $85 from $80.

7
As an example volume cap computation for 2008, the State of California, with a 2007 population of 36,553,215, had a PAB volume cap allocation of:
PAB Allocation = $85 * 36,553,215 = $3,107,023,000 Likewise in 2008, the 22 states with populations below 3,083,470 each received the minimum PAB volume cap allocation of $262,095,000. Unused cap may be carried forward for up to three years, and if it remains unused then expires. State Allocation to Municipalities and Projects: As we describe in more detail in Question 5, each state has its own unique allocation process, and these processes can vary substantially, from “first come, first served” to precise percentages for various purposes that are rank-ordered and prescribed by state law. One obvious trend emerges from the data, however: the preponderance of volume cap allocated to housing-related activity. This is especially interesting in light of the inclusion of an additional $11 billion of private activity bond allocation to housing included in the Housing and Economic Recovery Act of 2008 (H.R. 3221), which was enacted into law on July 30, 2008. This lifted each state’s PAB allocation by 38.6%. As shown in the following table, from a report on 2007 volume cap allocation and utilization conducted by the Council of Development Finance Agencies (CDFA), PAB utilization was highly concentrated in either housing (single-family mortgage revenue bonds or multifamily) or student loans (almost 80% of the total):
Table 3: PABs Issued By Category, 2007
Volume VolumeCategory ($000s) %Mortgage Revenue Bonds 9,475,700 33.8%Multi‐family Housing 5,743,000 20.5%Student Loans 4,423,400 15.8%IDBs 2,932,600 10.5%Exempt Facilities 2,661,900 9.5%Housing (not broken out) 1,983,300 7.1%Other 559,000 2.0%Mortgage Credit Certificates 247,100 0.9%
28,026,000 100.0%Source: CDFA Report, May 29, 2008
Further, less than 10% of allocation was to “Exempt Facilities,” a very broad category for which water and sewer projects are only two of ten possible uses (see Table 2). In order to understand what fraction of the 10% of Exempt Facilities issuance comprised water and sewer projects, PFM collected AMT bond data from January 2003 through September 2008 inclusive, from Securities Data Corporation (SDC), an industry-standard bond issue database. Specifically, we identified all bonds that were issued in relation to water, wastewater, and combined water/wastewater projects. For comparison, at the suggestion of the Steering Committee, we also included solid waste projects; referring back to Table 3, certain types of governmentally-owned solid waste projects are in the “Exempt Facilities” category and yet not subject to the PAB volume cap.
8
The SDC data included 219 bond issues with a total par amount of $4.8 billion. Of these, 145 (65%) comprising $3.1 billion par amount (66%) were for solid waste projects. This is approximately twice as many bonds, and twice the par amount, of all water, wastewater, and water/wastewater projects combined.
Table 4: AMT Bonds Issued for Water, Wastewater, and Solid Waste from Jan ‘03 to Sep ‘08
Category $000 % No. %Water 1,255.22 26.3% 51 23.3%Wastewater 196.80 4.1% 18 8.2%Water/Wastewater 210.61 4.4% 5 2.3%Subtotal Water/WW related 1,662.63 34.9% 74 33.8%
Solid Waste 3,103.43 65.1% 145 66.2%Total AMT Bonds 4,766.06 219
Par Amount Bond Issues
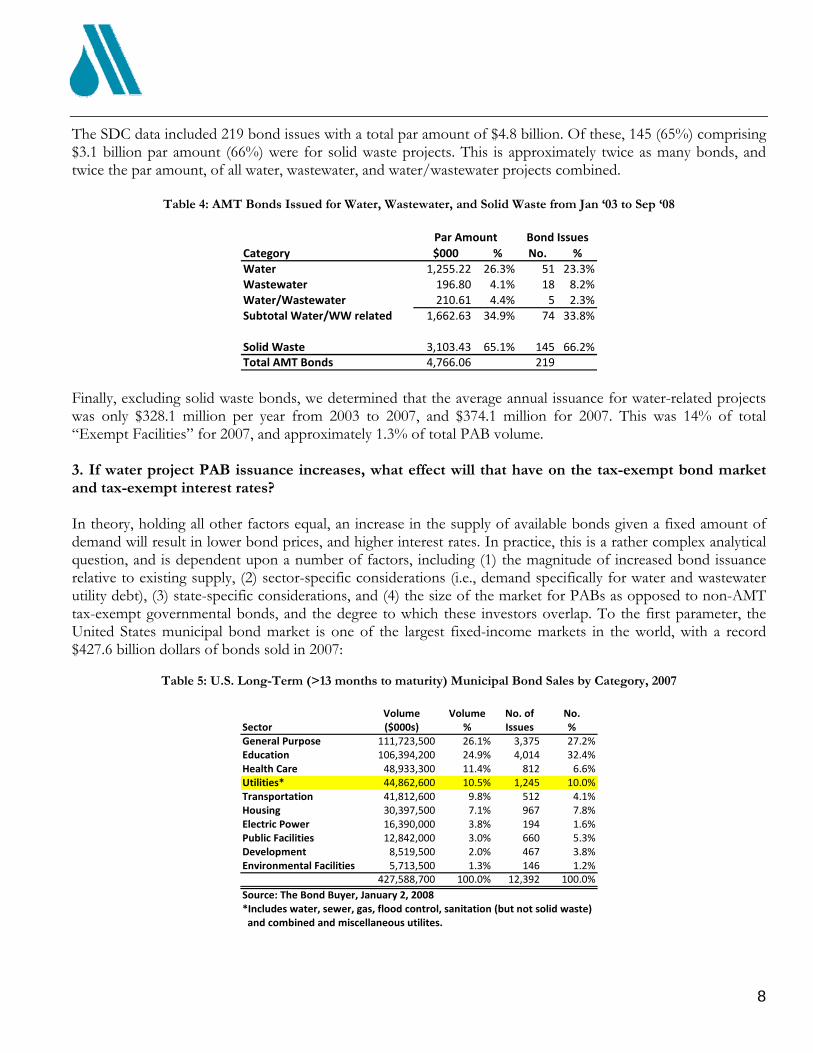
Finally, excluding solid waste bonds, we determined that the average annual issuance for water-related projects was only $328.1 million per year from 2003 to 2007, and $374.1 million for 2007. This was 14% of total “Exempt Facilities” for 2007, and approximately 1.3% of total PAB volume. 3. If water project PAB issuance increases, what effect will that have on the tax-exempt bond market and tax-exempt interest rates? In theory, holding all other factors equal, an increase in the supply of available bonds given a fixed amount of demand will result in lower bond prices, and higher interest rates. In practice, this is a rather complex analytical question, and is dependent upon a number of factors, including (1) the magnitude of increased bond issuance relative to existing supply, (2) sector-specific considerations (i.e., demand specifically for water and wastewater utility debt), (3) state-specific considerations, and (4) the size of the market for PABs as opposed to non-AMT tax-exempt governmental bonds, and the degree to which these investors overlap. To the first parameter, the United States municipal bond market is one of the largest fixed-income markets in the world, with a record $427.6 billion dollars of bonds sold in 2007:
Table 5: U.S. Long-Term (>13 months to maturity) Municipal Bond Sales by Category, 2007
Volume Volume No. of No.
Sector ($000s) % Issues %General Purpose 111,723,500 26.1% 3,375 27.2%Education 106,394,200 24.9% 4,014 32.4%Health Care 48,933,300 11.4% 812 6.6%Utilities* 44,862,600 10.5% 1,245 10.0%Transportation 41,812,600 9.8% 512 4.1%Housing 30,397,500 7.1% 967 7.8%Electric Power 16,390,000 3.8% 194 1.6%Public Facilities 12,842,000 3.0% 660 5.3%Development 8,519,500 2.0% 467 3.8%Environmental Facilities 5,713,500 1.3% 146 1.2%
427,588,700 100.0% 12,392 100.0%Source: The Bond Buyer, January 2, 2008*Includes water, sewer, gas, flood control, sanitation (but not solid waste) and combined and miscellaneous utilites.

9
Municipal bond sales volume has averaged approximately $32 billion per month from 2001 through 2007, and based upon recent observations, “moving the market” for supply-driven reasons requires increased issuance in the billions to tens of billions of dollars in a relatively short period of time, such as 1-2 weeks. While PABs are employed by both private water companies and governmental entities, but under the assumption that private companies could be one of the larger sources of potential PAB issuance, we note that the largest private water company for which we found financial information, American Water Works Company, Inc., had $4.7 billion of long-term debt outstanding, followed by Aqua America, Inc. with $1.2 billion. While these are very large absolute numbers, in terms of the broad municipal market, this type of volume would only be market-moving if sold all at the same time. The investment banks we surveyed tended to agree with this characterization. Further, with respect to sector, it has been PFM’s experience and it is generally understood in the market that water and wastewater revenue bonds are financed and supported by “essential services,” and these bonds are seen as particularly high-quality credits similar in security to governmental general obligation bonds. One of the investment bankers we spoke with offered a different view, reporting that investors outside the U.S., particularly in Europe, used to accept “essential services” as a selling point, but are much less apt to do so in the current market. As discussed in the introduction, it is important to add a note of caution given the pronounced deterioration in market conditions since September 2008. Between September and December, municipal bond volume has decreased to an average of approximately $22 billion per month; were this trend to persist through 2009, it would imply total annual volume of $264 billion, which would be a drop of almost 40% from the record volume of calendar year 2007. In such a difficult environment, it is possible that more bond supply, regardless of whether AMT or non-AMT, could weigh on the market and cause municipal yields to rise. We also note that from discussions with investment banks and based upon PFM’s recent experience with several airport credits, AMT bonds generally are difficult to sell in the current market. In addition to the market impacts already addressed, it appears that mutual funds are moving away from AMT bonds since more and more individuals are subject to the alternative minimum tax. It should be noted that this does not necessarily impact municipal entities, because they issue fully tax-exempt bonds (i.e., non-AMT) as opposed to PABs. 4. Would removing water and wastewater projects from the volume cap increase the supply of investment capital for water and wastewater projects? If so, what are the capital market consequences of that increase? PFM explored this question with several investment banks, and their general consensus was that such a move might increase capital to the extent it was connected to public-private partnership (P3) initiatives. There is some belief that infrastructure funds are “sitting on the sidelines” waiting for opportunities to become available; to the extent additional PAB availability helped move projects forward, then it seems possible. We discuss P3s and their relationship to PABs in more detail in Question 10. 5. What limits the current use of PABs for water and wastewater projects? Looking at five representative states, what are the primary reasons that those states did not use their current volume of PABs for these projects, considering the unused PAB cap in many states? To explore this question, PFM re-organized the data from the 2007 CDFA report, to determine which states had the highest percentage of carry-forward as a percent of volume cap allocation:

10
Table 6: PAB Utilization for 27 States with >$256.2 Million Minimum Allocation, 2007 Carry‐
2007 Cap Forward Carry‐FwdState Allocation Agency ($000s) ($000s) as % of Cap Oregon State Treasurer's Office, PAB Committee 314.6 739.9 235%Alabama Industrial Development Authority 390.9 747.5 191%Wisconsin Department of Commerce / Housing and Economic Development Authority 472.3 751.1 159%Maryland (d) Dept. of Business & Economic Development 477.3 617.9 129%Florida Division of Bond Finance 1,537.6 1,897.2 123%Georgia Department. of Community Affairs 795.9 936.3 118%New Jersey Department of Treasury, Office of Public Finance 741.6 628.3 85%Louisiana Governor’s Office / State Bond Commission 364.5 285.9 78%Michigan Department of Treasury 858.1 581.8 68%Colorado Department of Local Affairs 404.0 254.9 63%North Carolina Department of Commerce 752.8 470.5 63%Virginia Small Business Financing Authority 649.6 358.7 55%California Debt Limit Allocation Committee 3,098.9 1,438.8 46%Tennessee Commissioner of Economic and Community Development 513.3 222.0 43%South Carolina State Budget and Control Board 367.3 136.2 37%Texas Bond Review Board 1,998.2 729.2 36%Pennsylvania Dept. of Community and Economic Development 1,057.4 313.1 30%Minnesota Department of Finance 439.2 117.9 27%Oklahoma State Bond Advisor's Office 304.2 78.3 26%Missouri Department of Economic Development 496.6 96.8 19%New York Division of the Budget/Department of Economic 1,641.0 269.0 16%Washington Department of Community, Trade and Economic Development 543.6 41.9 8%Connecticut Office of Policy and Management 297.9 22.7 8%Massachusetts Executive Office for Administration and Finance 547.2 37.2 7%Indiana Finance Authority 536.6 ‐ 0%Arizona Department of Commerce 524.1 ‐ 0%Kentucky Office of Financial Management 357.5 ‐ 0%
Total Dollars, Average Pct: 20,482.2 11,773.1 62%Source: Council of Development Finance Agencies (CDFA) Report, May 29, 2008
We omitted the states with the minimum allocation of $262.1 million, under the premise that their carry-forward could in some measure be due to the larger per-capita capacity and that this would have distorting effects. Also, the 27 remaining states in this sample represent over 70% of the total PAB allocation, and thus are representative of the broader market.
Next, working with the AWWA project Steering Committee, we selected six states – Arizona, California, Florida, New Jersey, Pennsylvania and Texas – that were generally large, widely geographically distributed and representing distinct regions of the continental United States (northeast, southeast, southwest and west), and finally that had varying carry-forward utilization ratios ranging from 123% for Florida (representing lower utilization of its PAB volume cap allocation) down to 0% for Arizona (representing complete utilization). From PFM’s research and interviews with the staff of most of the statewide allocating agencies listed below, we found that the policies, procedures and priorities vary widely. Specifically, we discovered the following with respect to each of these six states: (1) State of Arizona (Department of Commerce) 2007 Volume Cap: $527.1 million Carry-Forward Ratio: 0% Arizona distributes its PAB allocation via two annual lotteries, in January and July, with the only apparent restriction that 10% of the State’s volume cap is allocable at the discretion of the director of the Department of Commerce. The State maintains detailed statistics regarding the name, size, and category of bonds as well as the date they were allocated, and whether or not the bonds have closed. The State’s records show that it allocated its entire volume cap for both 2007 and 2006. Of these allocations, in 2006, $177.6 million representing 37.4% of total volume cap for that year was carried forward under four projects, and in 2007, $40.8 million representing 7.8% of its total cap for that year was carried forward under four projects. Also in 2007, three bond issues

11
totaling $46.3 million, or 8.8% of the State’s volume cap, were allocated to water projects, none of which was as a result of discretionary allocation by the Department of Commerce. Through July 2008, the State had allocated $134.9 million or 25% of its 2008 volume cap, for which 100% of the related bond issues had closed; however, the State received an additional $204.2 million of housing volume cap under H.R. 3221 (the Federal housing package described in our earlier discussion regarding Question 2), which had not been allocated. In response to a follow-up question from the Steering Committee, PFM researched specific allocations made to Global Water Resources, LLC through the Pima County Industrial Development Authority (IDA). Global Waster received a $60 million allocation in 2006 that was carried over, and then received another $20 million allocation in 2007, and the IDA issued $54.135 million of bonds for which the proceeds were “loaned to (Global Water) to pay or reimburse the cost of acquisition, construction and equipping of water and wastewater conveyance and treatment facilities to be owned and utilized by the Company or its indirectly wholly-owned subsidiaries.” This appears to be a case, described by several state agencies, of entities with large-scale projects needed to collect several years of allocation and carry-over in order to accumulate enough par amount of bond authorization for the project. (2) State of California (Debt Limit Allocation Committee) 2007 Volume Cap: $3,098.9 million Carry-Forward Ratio: 46% California follows a complex allocation process featuring almost monthly meetings of the allocation committee, and competitive applications for volume cap. The State’s reported “reservation amount” for exempt facilities in 2007 was listed as $440 million, or 14.2% of the State’s available allocation for that year. A closer examination of approved exempt facility projects shows a preponderance of pollution control, waste management and recycling initiatives, and this was corroborated by PFM’s AMT bond research. Specifically, from our water/wastewater/solid waste database described in Question 3 previously, we identified 41 California AMT bonds representing $776 million par amount issued between January 2003 and September 2008. Of these, only five, representing $276.5 million, were for other than solid waste projects. Our discussion with the State’s staff confirmed that water and wastewater companies are infrequent users of the State’s volume cap, and staff suggested one reason was that these issuers have a variety of legal and regulatory hurdles, such as Environmental Impact Reports (EIRs) and California Environmental Quality Act (CEQA) permitting requirements. In general, these additional requirements seem to prevent water and wastewater issuers from being “nimble” enough to close bonds using their PAB volume cap allocation, which the State generally requires that they demonstrate within 90 days of award; if allocations are not committed in this timeframe, they risk being taken away and given to another entity. State staff indicated that allocations are made every other month from January to September, and that issuers are strongly urged to have projects ready to commence, as the State is aggressive about reclaiming allocations that are not used promptly. Finally, any carry-over is automatically allocated to California’s Housing Finance Agency (CalHFA), adding a further structural impediment to usage for water projects. As a follow-up to a specific question from the Steering Committee, the State’s PAB allocation committee is a 3-person board consisting of the State Treasurer, State Controller, and the Governor (almost always a designee in the latter case).

12
(3) State of Florida (Division of Bond Finance) 2007 Volume Cap: $1,537.6 million Carry-Forward Ratio: 123% Florida had the largest carry-over percentage of the states surveyed, and has one of the more specific bond allocation procedures, also set forth in State law. Specifically, Florida mandates that:
1. The first $97.5 million of allocation goes to manufacturing projects; 2. 50% of the remaining allocation is distributed among the counties on a per-capita basis, and allocated
first come, first served to any permitted purpose (including water and wastewater); 3. 25% of the remaining allocation is applied to single-family or multi-family housing; 4. 20% of the remaining allocation is applied to tourism, trade and economic development; 5. 5% remaining allocation is held until May 1, and applied to “priority projects” which include water and
wastewater. The State’s Division of Bond Finance staff indicated that its very large carry-over was due to a number of factors, most notably the history of the State’s Housing Finance Authority being the “default user” of PAB volume cap allocation, and given that there were many project delays in the housing sector, which stands to reason given the severe decline in home prices and sales in the State. State staff shared their list of 2008 allocations to date, and with few exceptions these were almost exclusively comprised of multifamily housing projects. State staff also indicated that some users “bank” multiple years of allocation for larger projects. (4) State of New Jersey (Office of Public Finance) 2007 Volume Cap: $741.6 million Carry-Forward Ratio: 85% PFM interviewed State Office of Public Finance staff, who indicated that the state does not have formal volume cap allocation procedures or pre-set percentages for any given sector, and instead allocates on a “first come, first served” basis. However, staff acknowledged that historically the preponderance of volume cap has been applied to housing-related projects. The State attributes its large carry-forward to lack of utilization by prospective borrowers, and also to the pronounced slowdown in housing construction activity. (5) Commonwealth of Pennsylvania (Department of Economic & Community Development) 2007 Volume Cap: $1,057.4 million Carry-Forward Ratio: 30% Pennsylvania has formal application procedures for volume cap, and approval for volume cap is entirely at the discretion of the allocating committee Board of Directors and the Governor. The Board meets three times per year, in March, July and November to approve projects. The Board and the Governor have published allocation guidelines for calendar year 2008 that include $518.911 million (49.1% of the Commonwealth’s 2008 allocation) for exempt facilities. Of the states surveyed, Pennsylvania has the largest targeted allocation toward the class of facilities that includes water and sewer projects. (6) State of Texas (Bond Review Board) 2007 Volume Cap: $1,998.2 million Carry-Forward Ratio: 36%

13
Similar to Florida, Texas has a very specific allocation procedure that is set forth in State statutes. For the 2007 program year, the volume cap allocations were:
1. 28% for single-family housing, distributed among various State agencies; 2. 8% for issues authorized by State constitutional amendment, including up to $125,000,000 toward
“large-scale water projects;” 3. 2% for industrial development bonds and empowerment zones; 4. 22% for residential rental projects; 5. 10.5% for student loans; and 6. 29.5% for all other bonds, but limited to $50 million per project.
Texas Bond Review Board staff indicated that the reason for their relatively low carryover amount was “huge” demand, and also their process. The State conducts a lottery each November to allocate the upcoming year’s volume cap (they received over 100 applications in 2007), and awards allocations on the first business day of January. Allocation recipients are then required to sell bonds as quickly as possible (“Use it or lose it,” to quote staff), and are given either 120, 150 or 180 days to do so. State staff also generally concurred with PFM’s research that relatively few PABs are issued for water/wastewater purposes. From January 2003 to September 2008, we identified only five bonds issues totaling $114.4 million par amount that were sold for water and wastewater projects. 6. To whom do the benefits of tax-exempt PAB financing inure, private shareholders or water and wastewater customers? How could this be managed if the volume of PABs increases? The answer to this question depends upon what type of entity – a public/municipal or a private water company – sets the water and wastewater customers’ rates. In the former case, if a public or municipal water company enters into a fee-for-service arrangement or other operations and maintenance contract with a private water company that in turn uses PABs, but the public company maintains control of the rate setting mechanism, then it is possible that the public entity benefits from a lower borrowing cost (assuming that issuing non-AMT debt itself had not otherwise been preferable), and that there is no specific requirement to return this benefit to rate payers. This is in contrast to the latter case, under which a private water company sets rates. The framework under which Public Utilities Commissions (PUCs) regulate private water companies is designed to ensure that reductions in borrowing costs are passed along to customers, and this should be the case regardless of the volume of PAB issuance. To explore this question, at the recommendation of the PAB Steering Committee PFM spoke with representatives of the National Association of Regulatory Utility Commissioners (NARUC), who in turn referred us to the Institute of Public Utilities and several academic sources. From our discussions, it is our understanding that PUCs regulate private water companies based upon their weighted average cost of capital (WACC). WACC can be expressed by the following equation:
WACC = WD * RD * (1-T) + WE * RE, where WD = Weight of Debt (book value of debt divided by book value of debt and equity)

14
RD = Rate of return required by debt holders (average) T = Marginal Tax Rate WE = Weight of Equity (i.e., book value of equity divided by book value of debt and equity) RE = Rate of return required by equity holders
As shown previously in Table 2, PABs should offer a lower after-tax financing cost than taxable bonds of at least 1% on average (a reduction in the RD component). From our discussions we understand that determination of the cost of debt is based upon a weighted average of the actual issuance cost, which is formulaic and therefore not subject to interpretation or negotiation between PUCs and private water companies. This is in contrast to the cost of equity, which can vary from company to company and is subject to negotiation. Therefore, any reduction in RD should immediately be captured in the rate review process, and passed along to customers. Likewise, when private water companies issue new debt, they generally need to seek permission from PUCs to do so, and so any increase in the volume of PAB issuance will still be part of the regulatory process, and reductions in WACC captured and passed along to consumers with little or no time lag. A general question posed by the Steering Committee was whether PABs are used in State Revolving Fund (SRF) programs. PFM did not find any reference to SRFs in our 5-year database of AMT bonds, nor do PFM personnel who work extensively with SRFs recall specific examples of PABs in these programs. The observation was made that occasionally small private use items are paid for through SRF programs, but that these can fall within the 5% “private activity” allowance for bond issues generally, and as such are not governed by the volume cap. 7. What would be the effect on the demand for municipal bonds if volume caps for water and wastewater projects were lifted? From discussions with investment banks, the general consensus is that there would not be a significant impact for several reasons, some of which have been mentioned previously if in different contexts. First, governmental debt (as opposed to PABs) is fully tax-exempt, and as such does not compete directly with PAB debt subject to the AMT. Second, to identify one possible source of new PAB issuance, the overall amount of large private water company debt in the United States appears to be less than $8 billion (see following Table 8). Even if several times this amount were brought to market, such sale volume could be managed without a serious market impact if sold over a period of several months. That said, as previously noted, bond issues in excess of $500 million are having difficulty selling in the current market due to heavy reliance on retail (i.e., individual and mutual fund) investors. 8. What would be the effect on the bond ratings of cities issuing PABs if caps on PABs for water and wastewater projects were lifted? In large measure, this question depends upon the structure of a given financing or contract, the security and/or source of payments, and the relationships between the parties. For example, in the case where a municipality issues bonds as a conduit on behalf of a private water company, there should not be any direct effect on municipal credit ratings (and vice-versa) as long as the private water company is clearly identified in both the bond (indenture) and disclosure (official statement/offering circular) documents as providing the security and source of payments for the PABs. That said, it is important to note the effect of credit rating on borrowing costs; for example, if a greater volume of PABs were to result in higher interest rates for both public and private water companies, then credit metrics

15
related to the cost of debt (such as revenue to debt service coverage ratios) could suffer. An illustration of the impact of credit ratings on borrowing costs is shown in the following table:
Table 7: Average PAB Yields for Different Credit Ratings, January 2003 through December 2008
MaturityIn Years BBB A AA AAA
2 3.62% 3.24% 3.05% 2.98%5 4.20% 3.83% 3.58% 3.49%10 4.84% 4.47% 4.20% 4.10%30 5.38% 5.09% 4.87% 4.78%
Source: Thomson Municipal Market Monitor To further explore these questions, PFM interviewed rating analysts at S&P, Fitch Ratings and Moody’s, and also reviewed several publications they provided. In general, the rating analysts’ reaction to potential impacts on municipalities from greater PAB issuance was identical to PFM’s, in that as long as the structure of the financing is clear that a municipality is not providing direct or indirect credit support to a private water company, the municipal’s ratings should not be affected. However, rating agencies necessarily limit the scope of their ratings analysis to individual bond issues or revenue sources. After lengthy discussion, the Steering Committee concluded that in practice, when contemplating possible rating impacts on a municipality, both financial and political factors need to be weighed. With respect to financial factors, the fundamental issue may not be who is obligated to pay a given cash flow stream for a specific bonds issue, but rather who owns the facility. For example, if a municipality has a DBOM (design, build, operate, maintain) contract with a private company, then lack of performance by either entity ultimately impacts the municipality. The larger the municipality’s ownership stake, then the greater the potential impact to it, regardless of a specific financing structure or contractual arrangement. With respect to political factors, the view was also expressed that municipalities always have an implied obligation to serve their residents. Thus, even if a municipal government has no ownership stake in a failing private enterprise, if that enterprise provides an essential service, the municipality may need to step in. This would be especially true of water and sewer services as opposed to, for example, solid waste, which can be (and often is) disposed of far from a given service area. As an aside, starting in September, Moody’s dramatically revised past rating practices and announced its shift to a “global” ratings scale, that is, municipal and corporate credits will be rated using identical as opposed to separate criteria. Likewise, in July Fitch released a white paper stating its intention to “recalibrate” its ratings to an “international” scale. Both firms indicate that this should result in ratings upgrades of up to two “notches” for several BBB and A rated credits, so for example an A3 (Moody’s) or A- (Fitch) rated issuer can anticipate an upgrade to A2 or A1, and A or A+ respectively. This development, to the extent it is not offset by the impact of deteriorating market conditions on the financial strength of water utilities, could also offset any negative impact from increased PAB debt issuance. 9. Would lifting the PAB caps for water and wastewater projects facilitate more multi-year water and wastewater projects? Acknowledging that more projects, multi-year or otherwise, are possible due to a lower cost of funds, PFM also theorized that lifting the PAB cap could facilitate more multi-year projects under two circumstances, (1) if it

16
were the case that PABs had different characteristics than taxable debt, in particular longer maturities and thus a greater time period to repay debt with related project revenues (i.e., long-lived asset/liability matching), and (2) if the larger bond issue size available absent cap constraints would facilitate project finance, by eliminating the need to accumulate PAB authorization over multiple years. To explore the first question, PFM examined the AMT bonds from our 5-year database, and also collected information regarding of taxable water company bonds from BloombergTM Financial Markets. We found that taxable bonds were just as likely to have long-dated (i.e., 20 to 30 year) maturities as were AMT bonds. As such, expanded use of PABs would not appear to provide functionally longer-dated debt than is already issued on a fully taxable basis. To the second question, however, it is clear from interviews with state allocating agencies and from the specific example of Pima/Global Water in Arizona, that would-be PAB issuers regularly accumulate volume cap over multi-year periods to collect enough authorized par to complete projects. Since unused cap expires after three years, and since several states insist that issuers “use or lose” their allocations in the current year, removal of the PAB cap would clearly seem to facilitate larger (and potentially multi-year) projects. 10. Would lifting the PAB caps for water and wastewater projects facilitate more public/private partnerships or privatization of water and wastewater utilities? In general, lifting PAB caps should facilitate more P3s in a variety of forms, and possibly privatizations, because of PAB’s normally lower after-tax borrowing cost than both taxable debt and equity. However, the benefits (and thus incentives), depend heavily upon the structure of the specific transaction, and its attendant impact on tax-deductibility of interest and depreciation, as well as on market conditions and yield relationships between non-AMT, AMT and taxable bonds. One consideration raised by the Steering Committee was that, to the extent private water companies are able to deduct private activity bond interest expense at U.S. corporate income tax rates (in 2008, this rate was 35% on taxable income above $18,333,333), then their effective borrowing cost for long-term debt would be lower than that for traditional, non-AMT governmental bonds. While detailed analysis of the impact of corporate tax rates is beyond the scope of this Study, it seems possible that PABs could facilitate a lower after-tax borrowing cost than governmental bonds. This is even more likely in cases where operating contracts or agreements are structured between municipalities and private water companies to enable financing using non-AMT governmental bonds; under such a structure, a private water company could make “lease payments” to a public company that are effectively at a governmental borrowing cost. To the extent these lease payments are in turn tax-deductible, then the private water company would achieve a very low borrowing cost. From discussions with investment banks, there is general agreement that, by definition, a lower cost of debt facilitates greater leverage for a given amount of equity. This implies that PABs, available in unlimited amount, would provide private investors with greater capacity to facilitate public/private partnerships (P3s) and enable privatization of water and wastewater utilities (assuming willing transaction participants). Another factor is the impact of PABs on depreciation; with PABs, the private infrastructure investor (in particular in a P3) cannot use accelerated depreciation, but rather must use straight line depreciation, if they can take any depreciation at all. This partially offsets the lower debt interest cost. As such, PABs under “normal” market conditions still are less costly than taxable debt, but not by the magnitude that a comparison based entirely on interest rates might indicate. PABs are certainly less costly than private equity, however. As

17
previously mentioned, several bankers have indicated that a large pool of infrastructure capital is already “sitting on the sidelines” in the current market, possibly due to the inability to access loans and leverage through traditional means. It is possible, then, that PAB use could be an even greater catalyst to P3 investment. It should also be the case that with respect to P3s where the private investor provides an upfront payment in exchange for a concession (e.g., similar to the Chicago Skyway or the Indiana Toll Road), the recipient governmental entity should receive a larger upfront payment if PABs could be used in lieu of taxable debt or equity. This is because the upfront payment is based upon the present-valuing of future expected concession revenues discounted at the private investor’s borrowing cost. Given that an investor’s equity cost could be 11%-12%, the use of PABs could substantially lower borrowing costs, and thus discount rates and upfront payments. From PFM’s experience, P3s (and by extension, PABs) are best viewed comprehensively with respect to project development and implementation including design, construction, operations, maintenance, and management as well as financing. P3s do not necessarily bring significant additional capital for projects because ultimately revenues come from the same source, i.e., rate payers. The benefit from private participation arises not because of financing, but rather because of efficiencies that private companies might bring with respect to design, construction, operations or maintenance, or to the extent that governmental and private entities can share project risk. In this view, the most advantageous financing structure is one under which a given revenue stream is leveraged by a governmental entity using tax-exempt debt via private activity bonds. With PABs, as opposed to governmental purpose bonds, the private sector can fully participate via long term contracts in all aspects of project development and implementation while the project (and rate payers) can still benefit from lower tax-exempt borrowing costs. In addition to the private activity bond volume cap, the Internal Revenue Code also imposes limitations on the issuance of tax-exempt private activity bonds to acquire existing property (the “Existing Property Limitation”). The Existing Property Limitation generally prohibits the use of tax-exempt private activity bonds to acquire property unless the first use of that property is pursuant to that acquisition. As a result, private activity bonds generally cannot be used by a private entity to acquire an existing project from a governmental person. The only exception to the Existing Property Limitation is if the purchaser of the property performs specified amounts of rehabilitation within two years of the acquisition of the acquired property. In the case of a building, the amount of rehabilitation required is 15 percent of the amount of tax-exempt proceeds spent on the acquisition. In the case of a structure other than a building, the amount of rehabilitation required is 100 percent of the amount of tax-exempt proceeds spent on the acquisition. Qualifying rehabilitation expenditures do not include costs attributable to expanding a facility. For an integrated operation contained in a building before its acquisition, qualifying rehabilitation expenditures include rehabilitating or replacing equipment in the building. Proposals to eliminate the application of the private activity bond volume cap for bonds issued for water and wastewater treatment facilities would not eliminate the Existing Property Limitation and that provision would continue to significantly restrict the ability of nongovernmental entities to use tax exempt bonds to acquire governmentally owned water and wastewater facilities. In particular, although each property would have to be analyzed on a case-by-case basis, it is likely that most water and wastewater treatment facilities would involve “structures other than buildings” and be subject to the requirement that an amount equal to 100 percent of the related acquisition cost financed with tax-exempt bonds be spent on rehabilitation within two years of the acquisition. It is also worth noting that it is likely that most governmentally owned water and wastewater treatment facilities will have outstanding tax-exempt bonds associated with them. In such cases, the sale of the bond-financed

18
assets to a nongovernmental person will result in the loss of the tax-exempt status of the related bonds unless the governmental owner takes a permitted remedial action. Typically, this will necessitate that the governmental owner redeem or defease the outstanding tax-exempt bonds associated with the project being sold, which, depending on the circumstances, could prevent the sale of the project or make the sale considerably more expensive. 11. Generally what benefits, both from a municipal and private perspective, would be expected to be gained by utility customers, cities and to the water and wastewater community from lifting the PAB cap for water and wastewater projects? As discussed above, it seemed there were at least three benefits to PAB issuers from removing the volume cap: (1) avoiding constraints imposed by the private activity cap limit generally and state allocation criteria specifically, (2) lowered cost of borrowing, and (3) possible encouragement of public-private partnerships. Further, there was at least one benefit to utility customers, in the form of lower rates or less need to raise rates. Based upon PFM’s research of state allocating agencies, it seems almost certain that removal of the volume cap could help streamline the funding process by removing application procedures, creating greater certainty as to availability of funds, and increasing the size of projects that can be financed. Likewise, with respect to borrowing costs, PABs will provide lower interest rates than similarly-structured taxable bonds, however current market conditions have caused a considerable rise in AMT bond yields and could blunt this benefit. Further, on balance the lower cost of borrowing should lower the cost of P3 initiatives, but the benefits could inure due to more efficient and effective project development and implementation due to greater private involvement and risk sharing, as opposed to significantly more or significantly cheaper capital. Finally, if private water companies receive a lower cost of borrowing, then the WACC-based regulatory framework administered by PUCs, should ensure that benefits inure to utility rate payers. 12. Generally what disbenefits or risks would be expected by utility customers, cities, and the water and wastewater community from lifting the PAB cap for water and wastewater projects? The biggest perceived risk of lifting the PAB cap for water and wastewater projects would be the potential negative impacts related to an increased supply of bonds: (1) greater competition for investment capital, (2) increased borrowing costs for public water companies, (3) greater use of debt by private water companies, and deteriorating coverage ratios for municipals resulting from higher borrowing costs, potentially resulting in downward pressure on credit ratings. 13. What is the expected market volume increase for water/wastewater PABs? What will be the short-term and long-term effects (i.e., higher interest rates due to fewer buyers, bond rating agencies insights, etc.) from both a municipal and private perspective, of the increased volume of tax-exempt bonds in the market place? Water/wastewater PABs are employed by a variety of issuers, both governmental and private. However, identifying the expected volume increase of PABs in the case of governmental entities is rather difficult, as it requires an issue-by-issuer review of bond documents to determine ownership and security structures, and because the instances where these issuers benefit from using PABs, as opposed to fully tax-exempt debt, are difficult to assess quantitatively.

19
In the latter case, however, private companies would, under most circumstances, benefit from using PABs as opposed to taxable debt. As such, an estimate of the amount of overall private water company debt provides a reasonable proxy for a large component of prospective additional PAB issuance, were the volume cap to be removed. PFM constructed an overall understanding of the number and size of private water companies nationwide, and then collecting financial information for a representative sample of these companies with a focus on their level of debt utilization. At the recommendation of the PAB Steering Committee, we contacted the National Association of Water Companies (NAWC), and confirmed that of their private water company membership of over 200 firms, their top six organizations represent approximately 86% of gross water revenues. All six of these organizations, plus several others, are represented in Table 8 below. We understand these to be generally the largest private water companies in the United States, and that on a combined basis these companies have issued the overwhelming majority of outstanding private water company debt:
Table 8: Debt Utilization by Selected Private Water Companies Connections or Credit Long‐Term Common Debt/
Company Name Stock Listing People Served Rating* Debt Equity (Debt+Equity)American Water Works Company, Inc. NYSE:AWK 15.6 million BBB+ 4,674,837 4,542,046 51%United Water (Suez Environnement) Euronext:SEV 7 million A‐Aqua America, Inc. NYSE:WTR 950,732 A+ 1,238,980 976,298 56%California Water Services Group NYSE:CWT 487,600 A+ 291,921 389,913 43%American States Water Company NYSE:AWR >1 million A 267,226 302,129 47%San Jose Water Company NYSE:SJW 1 million none 236,934 216,312 52%SouthWest Water Company NASDAQ:SWWC 162,337 none 145,353 159,194 48%Middlesex Water Company NASDAQ:MSEX >400,000 A‐ 116,675 134,637 46%Connecticut Water NASDAQ GS:CTWS 84,418 A 92,285 100,098 48%Artesian Resources Corporation NASDAQ:ARTNA 73,800 none 91,757 85,132 52%The York Water Company NASDAQ:YORW 60,000 A‐ 70,582 67,746 51%
Totals: 26,818,887 7,226,550 6,973,505 51%Averages: 2,927,232 722,655 697,351 51%
Sources: Company Annual Reports, S.E.C. 10‐Q and 10‐K filings, World Wide Websites.*Standard & Poor's long‐term debt ratings as of September 23, 2008.
Not Separately Reported
Based upon this research, we are not aware of any other large private water companies, whether publicly listed or privately held, that would represent a substantial increase in the $7.2 billion of total debt outstanding for the companies listed above. As discussed in Question 3, total municipal issuance in 2007 was almost $428 billion, so even if the above companies moved to using all PABs for debt funding, as long as this was done over a period of several months, the impact on the overall municipal market is expected to be minimal. In practice, PAB usage would be limited to new projects, and as such these companies would not be a position to refinance their debt en masse regardless. To use an extreme formulation, even assuming that private water companies shifted their percentage of debt to 80% (which would represent an increase in total debt to $28 billion, assuming a fixed $7 billion of common equity), from our discussions with investment banks, they uniformly believed that the municipal bond market could absorb this debt over a period of months with negligible impact to the overall level of rates. The underwriters also pointed out that when bringing debt issues to market, they are aware of other large sales on the industry’s sale calendar, and plan and coordinate the timing of their bond sales accordingly to avoid, as much as possible, saturating the market.

20
Conclusions Several conclusions emerge from the research described above. First, removing the PAB volume cap for water and sewer projects would eliminate a significant restriction on the use of tax exempt private activity bonds for these projects. The removal of water projects from the volume cap would be expected to enlarge the pool of capital available for investment in the water and wastewater arena. Second, removing water projects from the cap should not increase borrowing costs to municipalities, both because PABs are not fully tax-exempt, and because the relative volume of prospective PAB debt to the overall municipal finance market is relatively small. As noted, however, in the current difficult market conditions, any additional supply of bonds could put pressure on rates. Third, removing water projects from the PAB volume cap could facilitate more public-private partnerships (P3s) by expanding the pool of capital available through PABs. This does not necessarily mean more capital will be created, but if PAB debt is substituted for equity capital or taxable debt, the cost of capital will be reduced and equity capital will be freed up for other purposes. Fourth, removal of water projects from the PAB volume cap could facilitate larger (and potentially multi-year) PAB financing. Current state-by-state volume cap procedures complicate prospective issuers’ ability to utilize PABs effectively. PAB issuers often have to accumulate volume cap over multi-year periods to collect enough PAB bonding authority to complete projects. Unused cap expires after three years, and several states insist that issuers “use or lose” their allocations in the current year. These restrictions limit the ability to use PABs to finance larger and multi-year projects. Fifth, the benefits of a greater use of PABs, in the form of lower-cost capital, will generally benefit water consumers rather than the owners of private water companies. This is because of the way state regulatory authorities use the weighted average cost of capital (WACC) in setting rates and tariffs. This conclusion was affirmed in correspondence from the National Association of Regulatory Utility Commissioners (NARUC).
Finally, this research did not completely resolve questions about whether increased use of PABs would facilitate greater privatization in the water business. Given the discussion under question 10, it appears possible that removing the volume cap could have an affect on privatization, but the effect is likely to be highly conditional, debatable, and small compared to many other factors that must be weighed in any community’s decision on whether to privatize its water system.