americas: beverages: soft drinks · pdf file2015 2016 2017 2018 2019 2020 ... 2014 americas:...
TRANSCRIPT

November 14, 2014
Americas: Beverages: Soft Drinks
Equity Research
Will Keurig Cold be another disruptive innovation? Buy GMCR
We believe Keurig Cold has potential to be a disruptive innovation
We reaffirm our Buy rating on GMCR and maintain our above-consensus
estimates in the out-years. Our bullish view is partly based on the potential
sales and profit contribution from the upcoming launch of Keurig Cold
system. We believe (1) the Cold adoption rate could be meaningfully higher
than the 1% level SodaStream commands; (2) the economics of Cold pod
could be compelling, with per unit profit similar to that of Hot and incremental
$7.59-$12.69 in EPS from Cold alone by 2020. Our $185, 12-month price
target (from $166) reflects roll forward of estimates and higher multiples (35X
from 34X) due to an increase in peer multiples. Our options strategists
highlight options price in less than a 10% chance of our bull case on shares,
and recommend buying January 2016 $190 Calls ahead of the Cold launch.
Prior adoption barriers are not a hurdle for Keurig Cold
While SodaStream has achieved only 1% household penetration in the US,
we believe the Keurig system has hurdled key barriers of adoption,
including (1) instant cold, (2) integrated carbonation, (3) a deep bench of
brands through the partnership with KO; and (4) the already well-known
Keurig brand. We estimate Keurig Cold to reach 4.5% of household
penetration by 2017 and increase further to around 14% by 2020.
System profit pool for cold could be 3X traditional RTD per serving
We believe the cold opportunity represents a sizable profit contribution
opportunity for all parties involved. Our analysis shows a potential
system profit of $0.17/12-oz. serving (vs. 12-oz. packaged CSD of
$0.06). We estimate that GMCR will garner about 52% (or $0.09/pod) of the
profit pool, with KO and the bottlers garnering the remainder ($0.08/pod).
Implications for other soft drink firms: modestly positive for KO; mixed for PEP/DPS/COT depending on the level of participation
KO should benefit from its equity investment in GMCR as well as
potentially higher per unit economics around Cold pods.
PEP is planning to conduct limited testing with SodaStream but may need
to seek a bigger presence if Keurig Cold system begins to gain traction.
DPS already has partnership with Keurig Hot System with Snapple, and
could broaden the relationship to include CSD brands.
COT could be in position to contract manufacture concentrates over time.
Judy E. Hong (212) 902-0490 [email protected] Goldman, Sachs & Co. Goldman Sachs does and seeks to do business with
companies covered in its research reports. As a result, investors should be aware that the firm may have a conflict of interest that could affect the objectivity of this report. Investors should consider this report as only a single factor in making their investment decision. For Reg AC certification and other important disclosures, see the Disclosure Appendix, or go to www.gs.com/research/hedge.html. Analysts employed by non-US affiliates are not registered/qualified as research analysts with FINRA in the U.S. This report is intended for distribution to GS institutional clients only.
Ivan Holman (917) 343-4058 [email protected] Goldman, Sachs & Co. Katherine Fogertey (212) 902-6473 [email protected] Goldman, Sachs & Co. John Marshall (212) 902-6848 [email protected] Goldman, Sachs & Co.
The Goldman Sachs Group, Inc. Global Investment Research

November 14, 2014 Americas: Beverages: Soft Drinks
Goldman Sachs Global Investment Research 2
PM summary: Is Keurig Cold another disruptive innovation?
We continue to see GMCR pivoting to a multi-platform, multi-year growth story with
robust sales and earnings growth over the next several years. A key driver behind our
above-consensus estimates is the sales and profit contribution from the Keurig Cold
platform that is expected to launch in FY15. In this note, we take a deep dive into the
Cold pod opportunity and size up potential sales and profit impact for GMCR as well
as other soft drink companies. We maintain our Buy rating on GMCR, Neutral rating
on KO, PEP, and COT, and Sell rating on DPS.
The Cold opportunity is a key point of debate in assessing GMCR’s future earnings
power – One key push-back to our Buy recommendation on GMCR has been our bullish
view on the Cold opportunity. Given the lack of details around the system itself and limited
comparables, investors are asking questions about (1) the value proposition; (2) potential
household penetration of the Cold system; and (3) the economics and potential profit
impact for GMCR/KO and implications for other soft drink players. Based on our analysis,
we believe that Keurig Cold has potential to be a disruptive innovation, driving
sizable sales and profit lift for GMCR in the coming years.
Keurig Cold hurdles key barriers and could command a much higher adoption
rate than SodaStream – First, Keurig Cold will not need separate CO2 cartridges,
but rather will have a built-in CO2 within the cold pod. Second, the system already
has a global partnership with The Coca-Cola Company. Third, the pods should
provide a consistency of product and the machine will ensure the convenience of
making cold beverages in less than 60 seconds. Finally, the Keurig brand is already
in more than 15% of all US households.
Pods could potentially generate a larger profit pool versus ready-to-drink
(RTD) packaged beverage offerings – We estimate that unit economics of the
pod could be more favorable on a per serving basis than comparable RTD offering.
Our analysis based on a retail Cold pod price of $0.50 per 12-oz. serving
(admittedly speculative given the dearth of details at this point) points to nearly 3X
larger profit per serving. We note that there are potentially more profit participants
(GMCR/KO/bottlers), but all parties could end up with attractive economics given
larger profit per serving potential.
Exhibit 1: We estimate Keurig Cold could reach 14%
household penetration by 2020
HH Penetration (Keurig Cold)
Exhibit 2: We estimate Cold economics could be
attractive to GMCR/KO/bottlers
Cold pod economics analysis
Source: Goldman Sachs Global Investment Research
Source: Goldman Sachs Global Investment Research
0.0%
2.0%
4.0%
6.0%
8.0%
10.0%
12.0%
14.0%
16.0%
2015 2016 2017 2018 2019 2020
HH Penetration, cold
Cold Pod Economics Coke 12‐oz serv.
Retail Sales Price $0.50
GMCR revenue $0.35
Gross Profit $0.16
Operating Profit $0.09
Profit per 12oz
KO $0.05
Bottlers $0.03
GMCR $0.09
System 0.17

November 14, 2014 Americas: Beverages: Soft Drinks
Goldman Sachs Global Investment Research 3
Evaluating discovery value: Bull case points to sales of $7-$12 billion, operating profit
of $1.8-$3.1 billion, equating to $7.59-$12.69 of incremental EPS for GMCR from Cold
alone by 2020 – We believe a bull case scenario for Cold is household penetration above
20%+ (SodaStream’s household penetration in Sweden is 25%) and an attachment rate of
2.45X-2.95X. Our FY 16 EPS estimate of $5.58 is already 3.8% above consensus as we
incorporate 2.5% household penetration, a 2.11X attachment rate and $0.06 in EBIT/cup.
Exhibit 3: Our Base case scenario analysis points to
potential sales of $4-$5 billion by 2020… GMCR Cold scenario analysis, Sales sensitivity
Exhibit 4: …Implying $255 share in value
Bull vs. Base vs. Bear case GMCR share value
Source: Goldman Sachs Global Investment Research
Source: Goldman Sachs Global Investment Research
For the major soft drink companies, we see mixed implications, depending on the
level of participation in the Cold system:
Coca-Cola: A potential win/win – We believe KO’s equity investment in GMCR
allows some participation in GMCR’s profit growth. We further see potential for
incremental consumption occasion, bringing some excitement to soda, as well as
premiumizing the category. From a pure profit flow-through, our analysis points to
a profit per serving of ~$0.05 for KO, vs. a profit per 12-oz. of $0.03 for traditional
RTD beverages. Although there may be some cannibalization of sales as a result,
we do not believe this is necessarily a negative from a profit contribution basis.
PepsiCo: Testing with SodaStream, but is it enough? – PEP recently announced
that it will be doing a limited testing of home-made Pepsi soda with SodaStream.
Given the limited nature of the test at this point and SodaStream’s new strategy of
focusing on sparkling water, we do not envision the PEP/SODA relationship having
a meaningful impact in the near term. We also believe GMCR has every incentive
to get PEP on its platform; but whether or not KO could get in the way of that
remains to be seen. Even if pods do not prove to be as disruptive as we expect, we
think the potential halo and buzz effect of the platform is at least enough to
warrant action on the part of PEP to make sure it is not left behind as pods become
a competitive reality (particularly given the attractive system profit economics).
Dr. Pepper Snapple: Likely to get involved – DPS already sells Snapple branded
K-cups through the traditional Keurig coffee system. Given that DPS’s soda brands
are less of a direct threat to the KO portfolio, we believe DPS would get involved
with the Keurig Cold.
Cott Corporation: A new opportunity? – Cott is already a supplier of concentrate
for SodaStream. While the prospects for that deal may be unclear pending the
launch of Keurig Cold and SODA’s new strategy, we believe Cott is likely to be
involved in making private label concentrate for the Keurig system over time.
0.95 1.45 1.95 2.45 2.95
Bear case ‐> 3% 472 721 969 1218 1466
6% 945 1442 1939 2436 2933
10% 1574 2403 3231 4059 4888
Base Case ‐> 14% 2200 3358 4516 5673 6831
18% 2834 4325 5816 7307 8798
22% 3464 5286 7108 8931 10753
Bull Case ‐> 25% 3936 6007 8078 10148 12219
HH Penetration
Attachment rate Bull Base Bear
GS 2016 Hot EPS baseline $5.12 $5.12 $5.12
Cold scenario $7.90 $3.68 $1.03
Combined EPS base $13.02 $8.80 $6.15
Assigned multiple 32.0X 29.0X 20.0X
Blended value $417 $255 $123
Upside 170% 65% ‐20%
November 14, 2014 Americas: Beverages: Soft Drinks
Goldman Sachs Global Investment Research 4
The Cold pod opportunity could be significant
Our base case calls for the Keurig Cold system to account for 14% household
penetration by 2020. Clearly, this is a significant adoption rate compared with the roughly
1% penetration that SodaStream commands today. However, in our view, SodaStream’s
trajectory as a niche product may be due to the lack of mass market brands as well as a
product positioning and value equation miss-execution.
Our optimism around the Cold system is based on several factors – We believe the
addressable market for the Cold at-home dispensing system is significantly larger than that
for Hot owing to substantially higher consumption occasions (including tap water). In
addition, GMCR’s partnership with Coke will be critical in driving adoption rates growth.
We are further positively inclined as GMCR is well positioned with key brand points of
differentiation (the KO brand portfolio) vs. competitors.
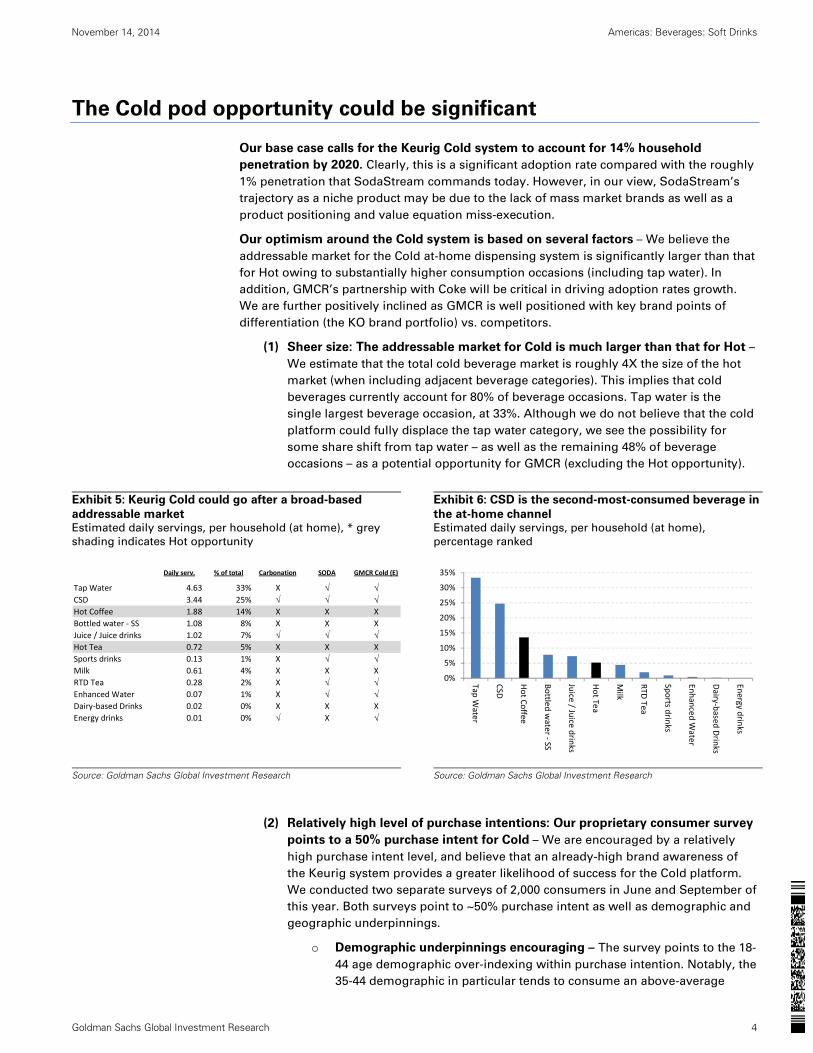
(1) Sheer size: The addressable market for Cold is much larger than that for Hot –
We estimate that the total cold beverage market is roughly 4X the size of the hot
market (when including adjacent beverage categories). This implies that cold
beverages currently account for 80% of beverage occasions. Tap water is the
single largest beverage occasion, at 33%. Although we do not believe that the cold
platform could fully displace the tap water category, we see the possibility for
some share shift from tap water – as well as the remaining 48% of beverage
occasions – as a potential opportunity for GMCR (excluding the Hot opportunity).
Exhibit 5: Keurig Cold could go after a broad-based
addressable market Estimated daily servings, per household (at home), * grey
shading indicates Hot opportunity
Exhibit 6: CSD is the second-most-consumed beverage in
the at-home channel Estimated daily servings, per household (at home),
percentage ranked
Source: Goldman Sachs Global Investment Research
Source: Goldman Sachs Global Investment Research
(2) Relatively high level of purchase intentions: Our proprietary consumer survey
points to a 50% purchase intent for Cold – We are encouraged by a relatively
high purchase intent level, and believe that an already-high brand awareness of
the Keurig system provides a greater likelihood of success for the Cold platform.
We conducted two separate surveys of 2,000 consumers in June and September of
this year. Both surveys point to ~50% purchase intent as well as demographic and
geographic underpinnings.
o Demographic underpinnings encouraging – The survey points to the 18-
44 age demographic over-indexing within purchase intention. Notably, the
35-44 demographic in particular tends to consume an above-average
Daily serv. % of total Carbonation SODA GMCR Cold (E)
Tap Water 4.63 33% X √ √CSD 3.44 25% √ √ √Hot Coffee 1.88 14% X X X
Bottled water ‐ SS 1.08 8% X X X
Juice / Juice drinks 1.02 7% √ √ √Hot Tea 0.72 5% X X X
Sports drinks 0.13 1% X √ √Milk 0.61 4% X X X
RTD Tea 0.28 2% X √ √Enhanced Water 0.07 1% X √ √Dairy‐based Drinks 0.02 0% X X X
Energy drinks 0.01 0% √ X √
0%
5%
10%
15%
20%
25%
30%
35%
Tap W
ater
CSD
Hot C
offee
Bottle
d wate
r ‐ SS
Juice / Ju
ice drin
ks
Hot Te
a
Milk
RTD
Tea
Sports d
rinks
Enhanced W
ater
Dairy‐b
ased Drin
ks
Energy d
rinks

November 14, 2014 Americas: Beverages: Soft Drinks
Goldman Sachs Global Investment Research 5
number of pods within the Hot platform, a potential positive if this similar
demographic yields high adoption rates within the Cold platform.
o Geographic underpinnings encouraging – Digging deeper in the survey
data reveals that purchase intentions appear relatively evenly spread out
across geographies. We believe this speaks to the broad national appeal
of the Coke and Pepsi platforms – a key driver of potential adoption levels.
Exhibit 7: Just under 50% of consumers indicated interest
in purchasing a branded Cold beverage system Question: ”If Coca-Cola or Pepsi-Cola branded disks, cups or
pods were available for single serve machines that make cold
beverages, would you be interested in buying a machine?”,
Percentage responding:
Exhibit 8: Brand name CSD offerings resonate well with
the 25-44 age bracket Question: ”If Coca-Cola or Pepsi-Cola branded disks, cups or
pods were available for single serve machines that make cold
beverages, would you be interested in buying a machine?”,
% responding: ”I would purchase a machine to make either
Coke or Pepsi branded beverages at home”, by age
segmentation:
Source: Goldman Sachs Global Investment Research
Source: Goldman Sachs Global Investment Research
Exhibit 9: Respondents indicating interest in a Pepsi or
Coke platform are evenly spread geographically Question: ”If Coca-Cola or Pepsi-Cola branded disks, cups or
pods were available for single serve machines that make cold
beverages, would you be interested in buying a machine?”,
% responding: ”I would purchase a machine to make either
Coke or Pepsi branded beverages at home”, by geographic
segmentation:
Exhibit 10: Relatively high interest level from lower
income consumers for the Cold system Question: ”If Coca-Cola or Pepsi-Cola branded disks, cups or
pods were available for single serve machines that make cold
beverages, would you be interested in buying a machine?”,
% responding: ”I would purchase a machine to make either
Coke or Pepsi branded beverages at home”, by income
segmentation:
Source: Goldman Sachs Global Investment Research
Source: Goldman Sachs Global Investment Research
Yes for Coke,
19 %Yes for Pepsi,
9 %
Yes for both,
18 %
Already
Sodastream
system, would
switch to
KO/PEP, 3 %
No, 52 %
0%
5%
10%
15%
20%
25%
30%
18-24 25-34 35-44 45-54 55-64 65+
Most receptive
to brand name
offerings
0%
5%
10%
15%
20%
25%
Northeast Northwest Midwest Southeast Southwest
0%
5%
10%
15%
20%
25%
Under
$30K
$30K to
$49,999
$50K to
$69,999
$70K to
$89,999
$90K to
$119,999
$120K or
above
November 14, 2014 Americas: Beverages: Soft Drinks
Goldman Sachs Global Investment Research 6
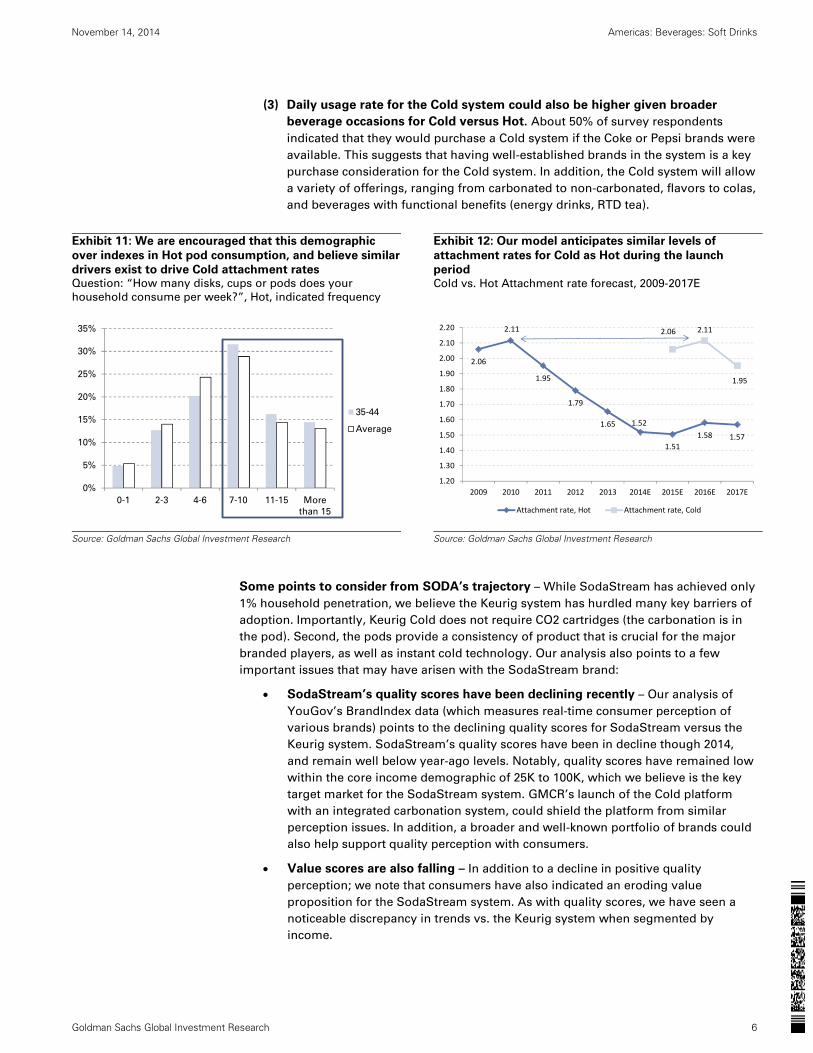
(3) Daily usage rate for the Cold system could also be higher given broader
beverage occasions for Cold versus Hot. About 50% of survey respondents
indicated that they would purchase a Cold system if the Coke or Pepsi brands were
available. This suggests that having well-established brands in the system is a key
purchase consideration for the Cold system. In addition, the Cold system will allow
a variety of offerings, ranging from carbonated to non-carbonated, flavors to colas,
and beverages with functional benefits (energy drinks, RTD tea).
Exhibit 11: We are encouraged that this demographic
over indexes in Hot pod consumption, and believe similar
drivers exist to drive Cold attachment rates Question: “How many disks, cups or pods does your
household consume per week?”, Hot, indicated frequency
Exhibit 12: Our model anticipates similar levels of
attachment rates for Cold as Hot during the launch
period Cold vs. Hot Attachment rate forecast, 2009-2017E
Source: Goldman Sachs Global Investment Research
Source: Goldman Sachs Global Investment Research
Some points to consider from SODA’s trajectory – While SodaStream has achieved only
1% household penetration, we believe the Keurig system has hurdled many key barriers of
adoption. Importantly, Keurig Cold does not require CO2 cartridges (the carbonation is in
the pod). Second, the pods provide a consistency of product that is crucial for the major
branded players, as well as instant cold technology. Our analysis also points to a few
important issues that may have arisen with the SodaStream brand:
SodaStream’s quality scores have been declining recently – Our analysis of
YouGov’s BrandIndex data (which measures real-time consumer perception of
various brands) points to the declining quality scores for SodaStream versus the
Keurig system. SodaStream’s quality scores have been in decline though 2014,
and remain well below year-ago levels. Notably, quality scores have remained low
within the core income demographic of 25K to 100K, which we believe is the key
target market for the SodaStream system. GMCR’s launch of the Cold platform
with an integrated carbonation system, could shield the platform from similar
perception issues. In addition, a broader and well-known portfolio of brands could
also help support quality perception with consumers.
Value scores are also falling – In addition to a decline in positive quality
perception; we note that consumers have also indicated an eroding value
proposition for the SodaStream system. As with quality scores, we have seen a
noticeable discrepancy in trends vs. the Keurig system when segmented by
income.
0%
5%
10%
15%
20%
25%
30%
35%
0-1 2-3 4-6 7-10 11-15 More
than 15
35-44
Average
2.06
2.11
1.95
1.79
1.65 1.52
1.51
1.58 1.57
2.06 2.11
1.95
1.20
1.30
1.40
1.50
1.60
1.70
1.80
1.90
2.00
2.10
2.20
2009 2010 2011 2012 2013 2014E 2015E 2016E 2017E
Attachment rate, Hot Attachment rate, Cold

November 14, 2014 Americas: Beverages: Soft Drinks
Goldman Sachs Global Investment Research 7
Exhibit 13: The SodaStream system appears to be
suffering from a quality perception issue SodaStream (LHS) vs. Keurig Green Mountain (RHS) –
Positive quality scores, aggregate
Exhibit 14: This is particularly noticeable within the
companies’ core 25k-100k income demographic SodaStream (LHS) vs. Keurig Green Mountain (RHS) –
Positive quality scores, Household income 25K-100K
Source: Goldman Sachs Global Investment Research, Yougov
Source: Goldman Sachs Global Investment Research, Yougov
Exhibit 15: SodaStream has also seen a relative decline in
value scores SodaStream (LHS) vs. Keurig Green Mountain (RHS) –
Positive value scores, aggregate
Exhibit 16: Although this has improved recently, gains
within the GMCR system have outpaced SODA within
core income demographics SodaStream (LHS) vs. Keurig Green Mountain (RHS) –
Positive value scores, aggregate
Source: Goldman Sachs Global Investment Research, Yougov
Source: Goldman Sachs Global Investment Research, Yougov
Opportunity for Keurig Cold to step in? – We view SODA’s recent pivot away
from the at-home CSD opportunity as an opportunity for the Keurig Cold launch.
Google trends indicate that search frequency for SodaStream declined at its peak
during the holiday 2013 period, following several years of fresh highs. In contrast,
though “Keurig Cold” has not launched formally, search terms for it have
increased in recent months, potentially indicating preliminary interest from
consumers searching for an alternative to current products within the at-home
beverage space.
8
9
10
11
12
13
14
50
70
90
110
130
150
170
190
210
230
01‐31‐2014
02‐14‐2014
02‐28‐2014
03‐14‐2014
03‐28‐2014
04‐11‐2014
04‐25‐2014
05‐09‐2014
05‐23‐2014
06‐06‐2014
06‐20‐2014
07‐04‐2014
07‐18‐2014
08‐01‐2014
08‐15‐2014
08‐29‐2014
09‐12‐2014
09‐26‐2014
10‐10‐2014
10‐24‐2014
Sodastream Keurig ‐ Green Mountain
8
28
48
68
88
108
128
148
168
50
60
70
80
90
100
110
120
130
01‐31‐2014
02‐14‐2014
02‐28‐2014
03‐14‐2014
03‐28‐2014
04‐11‐2014
04‐25‐2014
05‐09‐2014
05‐23‐2014
06‐06‐2014
06‐20‐2014
07‐04‐2014
07‐18‐2014
08‐01‐2014
08‐15‐2014
08‐29‐2014
09‐12‐2014
09‐26‐2014
10‐10‐2014
10‐24‐2014
Sodastream Keurig ‐ Green Mountain
0
1
2
3
4
5
6
7
020406080
100120140160180200
01‐31‐2014
02‐14‐2014
02‐28‐2014
03‐14‐2014
03‐28‐2014
04‐11‐2014
04‐25‐2014
05‐09‐2014
05‐23‐2014
06‐06‐2014
06‐20‐2014
07‐04‐2014
07‐18‐2014
08‐01‐2014
08‐15‐2014
08‐29‐2014
09‐12‐2014
09‐26‐2014
10‐10‐2014
10‐24‐2014
Sodastream Keurig ‐ Green Mountain
0102030405060708090100
0102030405060708090
100
01‐31‐2014
02‐14‐2014
02‐28‐2014
03‐14‐2014
03‐28‐2014
04‐11‐2014
04‐25‐2014
05‐09‐2014
05‐23‐2014
06‐06‐2014
06‐20‐2014
07‐04‐2014
07‐18‐2014
08‐01‐2014
08‐15‐2014
08‐29‐2014
09‐12‐2014
09‐26‐2014
10‐10‐2014
10‐24‐2014
Sodastream Keurig ‐ Green Mountain

November 14, 2014 Americas: Beverages: Soft Drinks
Goldman Sachs Global Investment Research 8
Exhibit 17: SodaStream’s product cycle might be turning, offering an opportunity for
GMCR to step in and fill the void SodaStream Google Trends, Keurig Cold Google Trends, 2009 to present
Source: Goldman Sachs Global Investment Research, Google Trends
Assessing the value proposition for Cold pods
In our view, how GMCR/KO prices the pods at retail in the context of its value
proposition will be a key determinant of the adoption rate for the Cold system. While
coffee tends to benefit from a ritualistic consumption pattern and the rise of gourmet
coffee bars, soft drink consumption is already an affordable, familiar and easy process;
thus we think other value drivers are needed to justify premium price point for Cold pods.
What we know about Keurig Cold:
Both carbonated and non-carbonated beverage functionality
Instant cold – The Keurig Cold is expected to use a flash chilling system,
dispensing cold beverages within 60 seconds.
No CO2 cartridges – The pods for carbonated beverages are going to be filled
with a pre-form carbonation in a separate chamber from the beverage syrup
Understanding the value proposition from a consumer’s standpoint – SodaStream
calls out five major “mega-trends” that its product proposition attempts to meet. Below we
look at those trends in the context of Keurig Cold and whether they are truly met.
1. (+/-) Convenience:
o Consumption: less convenient – Making a soda is more cumbersome
than opening a ready-to-drink offering. However, Keurig Cold is expected
to make a significant leap forward versus SodaStream in this area by
eliminating the need for CO2 cartridge.
o Purchasing: more convenient – Pods are small and light, making a
grocery trip far less strenuous versus carrying home the traditional 2-liter
format. Additionally, pods lend themselves very well to E-commerce,
which could cut out the grocery store purchase of soft drinks altogether.
0.0
1.0
2.0
3.0
4.0
5.0
6.0
7.0
8.0
9.0
0
20
40
60
80
100
120
1/4/2009 1/4/2010 1/4/2011 1/4/2012 1/4/2013 1/4/2014
sodastream keurig cold

November 14, 2014 Americas: Beverages: Soft Drinks
Goldman Sachs Global Investment Research 9
o Variety: more convenient – It is far easier to commit to buying a pod of a
new or often bypassed offering than it is to buying a 12-pack or 2-liter.
Pods lend themselves to variety.
2. (+) Sustainability:
o The surface area of a 12-oz. PET bottle is about 3.5X greater than that of a
K-cup yielding the same serving size. Also, K-cups would reduce both the
amount of distribution needed and the weight of the load a truck has to
carry, as the water volume is de facto eliminated.
3. (+/-) Health & wellness:
o Pods cannot make Coke healthier on an absolute basis or reduce the
artificial sweetener component in Diet offerings. Additionally, there may
be some push-back against having a CO2 cartridge within the pod. On the
positive side, consumers should be able to choose from additional health
& wellness varieties that have lower calories, all-natural sweeteners and
functional benefits (vitamins, antioxidants, etc).
4. (+) Personalization:
o While pods will likely start out with simply a Coke pod or a Diet Sprite pod,
we believe that, over time, suppliers such as KO will try to replicate the
experience of something like their KO Freestyle vending machine, which
allows mixing of flavors and soda types.
5. (+/-) Value for money:
o Soft drink pods will not be like coffee pods in that we do not believe they
will be selling at multiples higher prices vs. their traditional (drip brewing
in the case of coffee) offering. In addition, there is still the upfront cost of
the machine. Whether the intangible benefits of convenience,
personalization, and sustainability are enough to offset the upfront cost
will depend on the individual consumer.
We attempt to determine what may be an appropriate price point for a Cold pod and
estimate a retail price of $0.50 per 12-oz. serving Cold pod, though we acknowledge
that the ultimate price point GMCR chooses may be very different.
We believe Cold pods are likely to be priced at a significant premium to KO’s
take-home, value pack pricing – Average retail price per 12-oz. servings for KO’s
CSD brands is $0.53 across all channels, but price per servings vary across pack
sizes and channels. The 2-liter bottle and a case of 12-oz. cans typically command
the lowest price per servings, ranging from $0.25 to $0.30 per 12-oz. servings;
meanwhile, mini-cans are priced at around $0.64 per 12-oz. serving and immediate
consumption bottles sold in convenience stores or vending machines range from
$0.85 to well over $1.00 per 12-oz. servings. Given that Cold pods are likely to be
for at-home consumption, we do not envision price points mirroring those of the
immediate consumption channel. However, we see GMCR/KO pricing at a
significant premium to 2-liter, multi-pack 12-oz. cans given the convenience and
immediate cold value proposition.
SodaStream’s price per servings – We estimate that SodaStream comparable
products are currently priced at a range of $0.44 to $0.18 per 12oz. serving. Our
estimates for pricing focus on a range from SodaStream branded products to
external branded offerings (Kool-Aid). We note that delta between SodaStream
branded product and externally branded products is ~35% to 40%.

November 14, 2014 Americas: Beverages: Soft Drinks
Goldman Sachs Global Investment Research 10
We do not expect Keurig Cold pods to be priced at massive premiums to RTD offering,
such as the premiums prevailing for K-cups versus drip coffee options – We estimate
that Folgers drip coffee costs $0.04 per 8-oz. serving, versus $0.69 (17.5X multiplier) for its
equivalent K-cup offering. Premium brands such as Starbucks Donuts command a lesser
premium but K-cups are still 2.9X times higher than drip coffee offerings.
Exhibit 18: We expect Keurig Cold pods to be priced
above take-home, value CSD packs but below immediate
consumption packs Average cost per 12-oz. serving, across channels
Exhibit 19: We do not expect Keurig Cold pods to be
priced at the massive premiums seen in coffee K-cup cost vs. drip brewing cost; estimated multiple premium
vs. tradition drip brewing cost per cup
Source: Goldman Sachs Global Investment Research
Source: Goldman Sachs Global Investment Research
Pod Profit 101: The economics of pods could be compelling
We believe the economics of the Cold pods could be compelling, with system-wide
economics similar to those for the Hot pods on a 12-oz. serving basis. This implies
that profit contribution from Cold could be meaningful for GMCR (particularly since
most of it should be incremental) over time if adoption rates ramp up as we expect.
In addition, the pod economics also appear attractive to KO and the bottlers, even if
we assume that the Cold pods fully cannibalize the packaged beverage offerings.
Evaluating unit economics – There are many ways the economics of KO’s relationship
with GMCR could potentially be structured, but we make our best estimation and make the
following assumptions:
The pod sells at around $0.50 per 12-oz. servings at retail
The bottler either acts as a distributor or takes in a “territory fee” even if it is not
directly involved in the value chain
GMCR manufactures the concentrate (vs. purchasing it from KO), adds the
carbonation, and packages the syrup in the pods, but pays a brand licensing fee to
KO
Our analysis points to attractive per unit profitability – Based on the $0.50 per pod retail
price, we estimate $0.17 of profit per Cold pod for the system over time, similar to the
profit per K-cup on the Hot side. Our analysis is based on our understanding of the Hot K-
cup economics as well as the packaged CSD economics. Key assumptions include:
Retail price per Cold pod of $0.50 and retail mark-up of 28%
GMCR’s revenue per pod of $0.35, after paying KO and bottlers licensing and
territory fees
1.00
0.640.50 0.44
0.33 0.31 0.31 0.310.24 0.18 0.18
0.00
0.20
0.40
0.60
0.80
1.00
1.20
Coke 12
0z. V
ending M
achine
Coke M
ini‐C
ans
GMCR (39
% retailer m
argin)
Diet V
ariety Pack So
dastream
Caps
Coke R
(RTD
): All p
acks
SodaStream
Cola C
aps (8
)
Kool‐A
id So
dastream
Caps
Coke R
: 12 p
ack of can
s
Soda Stream
Crystal Ligh
tLem
onade (b
randed
Mixer)
Sodastream
TM Cola M
ix
Sodastream
TM Diet co
la(M
ixer)0.0X
2.0X
4.0X
6.0X
8.0X
10.0X
12.0X
14.0X
16.0X
18.0X
20.0X
Starbucks FolgersPod vs. drip premium, m
ultiple basis

November 14, 2014 Americas: Beverages: Soft Drinks
Goldman Sachs Global Investment Research 11
Total COGS of $0.19/pod: we estimate concentrate costs on par with traditional
KO CSD ($0.03), but include $0.04 of carbonation within the cup and packaging
costs that are 50% higher than the packaging costs for the hot platform given a
dual chamber carbonation pod integrated into the pods. Labor and overhead is
expected to be similar to that for the hot system, particularly as GMCR ramps up
its manufacturing capabilities and levers fixed costs. Distribution costs could be
lower as GMCR utilizes KO/bottlers for distribution of pods.
Operating expenses of $0.07/pod: we estimate that operating expenses could be
lower than the current $0.09/K-cup cost as GMCR is able to get some leverage
from the Hot infrastructure. Indeed, we believe even $0.07/cup operating costs
could come down over time as GMCR builds scale for both Hot and Cold systems.
Exhibit 20: We estimate total profit of $0.17 per 12-oz. serving, with GMCR’s EBIT/pod of
$0.09 and KO/Bottlers’ EBIT/pod of $0.08
Cold Pod unit economics
Source: Company data, Goldman Sachs Global Investment Research
Profit split likely to be relatively equitable, with GMCR taking in $0.09/pod – We
forecast system profit of $0.17, with GMCR garnering ~52% of the profit pool ($0.09/pod),
KO garnering 29% ($0.05), and bottlers receiving 19% ($0.03). The bottlers are in the
position of lowest leverage as they are not necessarily needed, but we believe KO will keep
them involved in some fashion to manage relationships and the legacy CSD business. For
now, given that KO owns a majority of the North American bottling operation, KO should
be in position to enjoy higher profitability per pod from the Cold system.
Comparing Cold economics to Hot and traditional packaged CSDs – Overall, we
estimate that the Cold profit pool should be comparable to the Hot profit pool, while higher
than the traditional packaged CSDs.
Cold pod CSD analysis Cold Pod ‐ 12oz Serving
Retail Sales Price $0.50
Retail Markup $0.14
% of retail price 28%
Wholesale Revenue $0.43
Wholesale mark‐up $0.03
KO royalty fee $0.05
GMCR revenue $0.35
Concentrate costs $0.03
Carbonation costs $0.04
Packaging costs $0.06
Labor/Overhead $0.04
Distribution/Logistics $0.01
Others $0.01
Total COGS $0.19
Gross Profit $0.16
Gross Margin 45%
Operating Expenses $0.07
Operating Profit $0.09
Operating Margin 25%
Profit per 12oz
KO $0.05
Bottlers $0.03
GMCR $0.09

November 14, 2014 Americas: Beverages: Soft Drinks
Goldman Sachs Global Investment Research 12
Exhibit 21: We estimate $0.17 in system profit from hot
pods Estimated GMCR pod level profitability analysis, Hot pods
Exhibit 22: We estimate $0.06 in system profit from
packaged KO CSDs Estimated KO CSD profitability analysis
Source: Goldman Sachs Global Investment Research
Source: Goldman Sachs Global Investment Research
Hot system profit pool is compelling – We estimate Hot system profit pool of
$0.17/cup, with GMCR’s share of $0.10 per K-cup. Our analysis assumes an
average retail price of $0.57 for an 8-oz. serving (based on the Nielsen data),
incorporating a 28% retail mark-up. Based on GMCR’s reported revenue/cup of
$0.37, we estimate roughly $0.11 in wholesale mark-up as well as the licensing fee
that GMCR pays to its partners across the system. GMCR discloses pod level
COGS, including ingredient costs (38%), packaging (22%), labor/overhead (19%),
distribution/logistics (16%) and other (5%). From this cost structure our analysis
points to a ~50% GPM, and a 27% EBIT margin at a pod level, or $0.10 per cup
profit for GMCR. We assume wholesale mark-up of $0.03-0.04, leaving $0.07 in
average profit/K-cup for GMCR’s partners, by our estimate.
Traditional RTD system carries a more modest system profit pool – We
estimate system profit for traditional RTD 12-oz. servings to equate to ~$0.06, split
evenly between bottlers and KO. Within this structure, KO generates $0.03 in profit
through the sale of concentrate (~65% margin). We estimate concentrate costs of
$0.03, based on bottler economics, packaging costs of $0.08, sweetener costs of
$0.02, and other costs of $0.04. We estimate this yields a system profit of $0.06, or
15%, which compares to KO’s current North American margins of 12.8% (assume
CSD margins are higher than non-CSDs).
Hot ‐ pod analysis GMCR Pod, 8oz Serving
Retail Sales Price $0.57
Retail Mark Up 0.16
% of retail price 28%
Wholesale Revenue $0.48
Wholesale mark‐up/net adj $0.11
GMCR Revenue $0.37
Coffee/Ingredient cost $0.07
Packaging $0.04
Labor/Overhead $0.04
Distribution/Logistics $0.03
Others $0.01
Total COGS $0.19
Gross Profit 0.19
Gross Margin 50%
Operating Expenses $0.09
Operating Profit (GMCR) $0.10
Operating Margin 27%
Profit per 8oz
GMCR 0.10
Partners 0.07
System 0.17
Bottle/Can CSD Analysis Coke ‐ 12oz Serving
Retail Sales Price Per 12oz can 0.53
Retail Markup 0.15
% of retail price 28%
Bottler Revenue 0.38
Bottler GM 44%
Concentrate Revenue 0.08
Concentrate costs 0.03
Packaging costs 0.08
Sweetener 0.02
Others 0.04
Total COGS 0.17
Gross Profit 0.22
Gross Margin 56%
Operating Expenses 0.16
Operating Profit 0.06
Operating Margin 15%
Profit per 12oz
KO 0.03
Bottlers 0.03
System 0.06

November 14, 2014 Americas: Beverages: Soft Drinks
Goldman Sachs Global Investment Research 13
Bull case on Cold points to $400+ share price for GMCR
Our base case calls for Keurig Cold penetration of mid-single-digits and accounting
for 15% of total pod volumes for GMCR by 2017 – We remain primarily differentiated vs.
consensus on our assumptions for the Cold platform, which is expected to launch in FY15.
Notably, we model a more conservative adoption rate for the Cold platform versus Hot,
and assume a penetration rate of 4.5% of all households by FY17. This equates to roughly
5.6 million Cold units within GMCR’s installed and active base, and would account for
roughly 25% of brewer sales by 2017. Based on an attachment rate of 1.95X and EBIT/cup
of $0.06 (versus Hot attachment rate of 1.57X and EBIT/cup of $0.08), we estimate Cold pod
sales could be around $1.8 billion and EBIT of about $200 million-plus by 2017.
Exhibit 23: We expect household penetration to achieve
mid-single digits by 2017 Estimated cold household penetration vs. Cold installed base
Exhibit 24: Cold system could account for 25% of brewer
volumes by 2017 Brewers Cold, vs. Hot % of brewer sales
Source: Goldman Sachs Global Investment Research
Source: Goldman Sachs Global Investment Research
Exhibit 25: We expect pod sales to reach $1.1 billion by
2017… Hot Pods vs. Cold Pods, Sales
Exhibit 26: …Representing ~14% of Pod $ sales Hot Pods vs. Cold Pods, % of sales
Source: Goldman Sachs Global Investment Research
Source: Goldman Sachs Global Investment Research
1.0%
2.6%
4.5%
0.0%
0.5%
1.0%
1.5%
2.0%
2.5%
3.0%
3.5%
4.0%
4.5%
5.0%
0
2000
4000
6000
8000
10000
2015 2016 2017
Cold, Active brewers HH Penetration, cold
0%
10%
20%
30%
40%
50%
60%
70%
80%
90%
100%
2009 2010 2011 2012 2013 2014E 2015E 2016E 2017E
Brewers, unit volume ‐ Hot Platform Brewers, unit volume ‐ Cold Platform
0
1000
2000
3000
4000
5000
6000
7000
8000
9000
2011 2012 2013 2014E 2015E 2016E 2017E
Hot Cold
75%
80%
85%
90%
95%
100%
2011 2012 2013 2014E 2015E 2016E 2017E
Hot Pods Cold Pods
November 14, 2014 Americas: Beverages: Soft Drinks
Goldman Sachs Global Investment Research 14
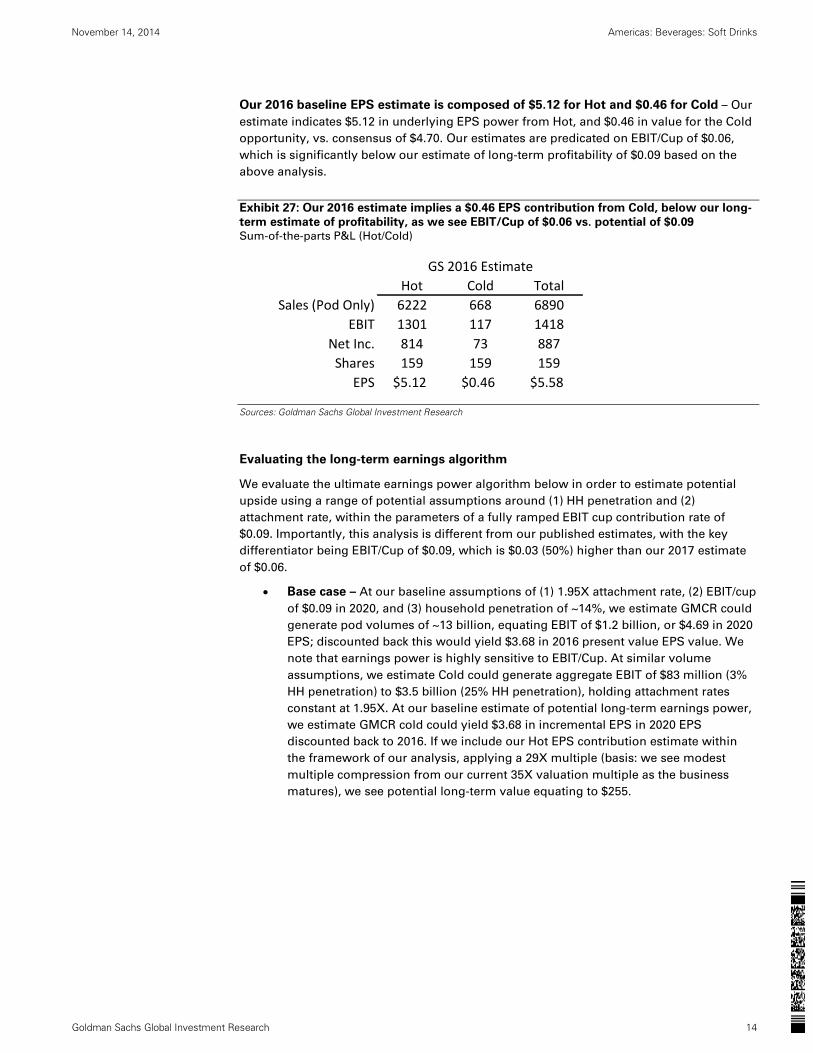
Our 2016 baseline EPS estimate is composed of $5.12 for Hot and $0.46 for Cold – Our
estimate indicates $5.12 in underlying EPS power from Hot, and $0.46 in value for the Cold
opportunity, vs. consensus of $4.70. Our estimates are predicated on EBIT/Cup of $0.06,
which is significantly below our estimate of long-term profitability of $0.09 based on the
above analysis.
Exhibit 27: Our 2016 estimate implies a $0.46 EPS contribution from Cold, below our long-
term estimate of profitability, as we see EBIT/Cup of $0.06 vs. potential of $0.09
Sum-of-the-parts P&L (Hot/Cold)
Sources: Goldman Sachs Global Investment Research
Evaluating the long-term earnings algorithm
We evaluate the ultimate earnings power algorithm below in order to estimate potential
upside using a range of potential assumptions around (1) HH penetration and (2)
attachment rate, within the parameters of a fully ramped EBIT cup contribution rate of
$0.09. Importantly, this analysis is different from our published estimates, with the key
differentiator being EBIT/Cup of $0.09, which is $0.03 (50%) higher than our 2017 estimate
of $0.06.
Base case – At our baseline assumptions of (1) 1.95X attachment rate, (2) EBIT/cup
of $0.09 in 2020, and (3) household penetration of ~14%, we estimate GMCR could
generate pod volumes of ~13 billion, equating EBIT of $1.2 billion, or $4.69 in 2020
EPS; discounted back this would yield $3.68 in 2016 present value EPS value. We
note that earnings power is highly sensitive to EBIT/Cup. At similar volume
assumptions, we estimate Cold could generate aggregate EBIT of $83 million (3%
HH penetration) to $3.5 billion (25% HH penetration), holding attachment rates
constant at 1.95X. At our baseline estimate of potential long-term earnings power,
we estimate GMCR cold could yield $3.68 in incremental EPS in 2020 EPS
discounted back to 2016. If we include our Hot EPS contribution estimate within
the framework of our analysis, applying a 29X multiple (basis: we see modest
multiple compression from our current 35X valuation multiple as the business
matures), we see potential long-term value equating to $255.
Hot Cold Total
Sales (Pod Only) 6222 668 6890
EBIT 1301 117 1418
Net Inc. 814 73 887
Shares 159 159 159
EPS $5.12 $0.46 $5.58
GS 2016 Estimate

November 14, 2014 Americas: Beverages: Soft Drinks
Goldman Sachs Global Investment Research 15
Exhibit 28: Pod volumes are driven linearly by the
relationship between attachment rate and household
penetration GMCR Cold scenario analysis, pod volume (billions)
sensitivity
Exhibit 29: We assume a long-term potential of $0.09 in
EBIT contribution per Cold pod, vs. current Hot of $0.10 GMCR Cold scenario analysis, baseline EBIT$ sensitivity
Source: Goldman Sachs Global Investment Research
Source: Goldman Sachs Global Investment Research
A bull case scenario for Cold points to $7.59 to $12.69 in EPS contribution by 2020
Bull case – We further evaluate the case for a bull scenario unfolding. We define
the parameters of this scenario as HH penetration of 18% to 25%, and attachment
rates of 2.45X to 2.95, with EBIT/Cup constant at $0.09. We estimate this could
yield 2020 EPS discounted back to 2016 of $5.95 to $9.95 (2020 of $7.59 to $12.69).
We estimate that at a forward multiple of 32X, this could yield consolidated value
per share of $417.
Exhibit 30: We estimate this could generate 2020 EPS
ranges of $0.49 to $12.69 GMCR Cold scenario implied 2020 EPS at baseline EBIT/cup
($0.09) vs. HH penetration vs. Attachment rate sensitivity
Exhibit 31: Underlying profitability is highly levered to
EBIT/Cup GMCR Cold scenario implied EBIT at EBIT/Cup vs. HH
penetration vs. baseline Attachment rate (1.95X) sensitivity
Source: Goldman Sachs Global Investment Research
Source: Goldman Sachs Global Investment Research
Exhibit 32: Discounted back to 2016, our baseline
assumptions yield EPS outcomes of $5.95 to $9.95 for a
Bull case scenario GMCR Cold scenario implied 2016 EPS at baseline EBIT/cup
($0.09) vs. HH penetration vs. Attachment rate sensitivity
Exhibit 33: At different multiple assumption rates, we see
potential upside/downside of +170% to -20% from
current levels Bull vs. Base vs. Bear case GMCR share value
Source: Goldman Sachs Global Investment Research
Source: Goldman Sachs Global Investment Research
0.95 1.45 1.95 2.45 2.95
3% 1349 2059 2769 3479 4189
6% 2699 4119 5539 6959 8379
10% 4498 6865 9232 11598 13965
14% 6286 9594 12901 16209 19517
18% 8097 12357 16617 20877 25137
22% 9896 15103 20309 25516 30723
25% 11245 17162 23079 28995 34912
Attachment rate
HH Pen
etration
0.95 1.45 1.95 2.45 2.95
3% 121 185 249 313 377
6% 243 371 499 626 754
10% 405 618 831 1044 1257
14% 566 863 1161 1459 1756
18% 729 1112 1496 1879 2262
22% 891 1359 1828 2296 2765
25% 1012 1545 2077 2610 3142
Attachment rate
HH Pen
etration
0.95 1.45 1.95 2.45 2.95
3% 0.49$ 0.75$ 1.01$ 1.26$ 1.52$
6% 0.98$ 1.50$ 2.01$ 2.53$ 3.04$
10% 1.63$ 2.49$ 3.35$ 4.21$ 5.07$
14% 2.28$ 3.49$ 4.69$ 5.89$ 7.09$
18% 2.94$ 4.49$ 6.04$ 7.59$ 9.13$
22% 3.60$ 5.49$ 7.38$ 9.27$ 11.16$
25% 4.09$ 6.24$ 8.39$ 10.54$ 12.69$
Attachment rate
HH Penetration
0.03 0.07 0.09 0.11 0.15
3% 83 194 249 305 415
6% 166 388 499 609 831
10% 277 646 831 1015 1385
14% 387 903 1161 1419 1935
18% 499 1163 1496 1828 2493
22% 609 1422 1828 2234 3046
25% 692 1616 2077 2539 3462
HH Penetration
EBIT/Cup, 1.95 Attachment rate
0.95 1.45 1.95 2.45 2.95
3% 0.38$ 0.59$ 0.79$ 0.99$ 1.19$
6% 0.77$ 1.17$ 1.58$ 1.98$ 2.39$
10% 1.28$ 1.96$ 2.63$ 3.31$ 3.98$
14% 1.79$ 2.74$ 3.68$ 4.62$ 5.56$
18% 2.31$ 3.52$ 4.74$ 5.95$ 7.17$
22% 2.82$ 4.31$ 5.79$ 7.27$ 8.76$
25% 3.21$ 4.89$ 6.58$ 8.27$ 9.95$
Attachment rate
HH Penetration
Bull Base Bear
GS 2016 Hot EPS baseline $5.12 $5.12 $5.12
Cold scenario $7.90 $3.68 $1.03
Combined EPS base $13.02 $8.80 $6.15
Assigned multiple 32.0X 29.0X 20.0X
Blended value $417 $255 $123
Upside 170% 65% ‐20%
November 14, 2014 Americas: Beverages: Soft Drinks
Goldman Sachs Global Investment Research 16
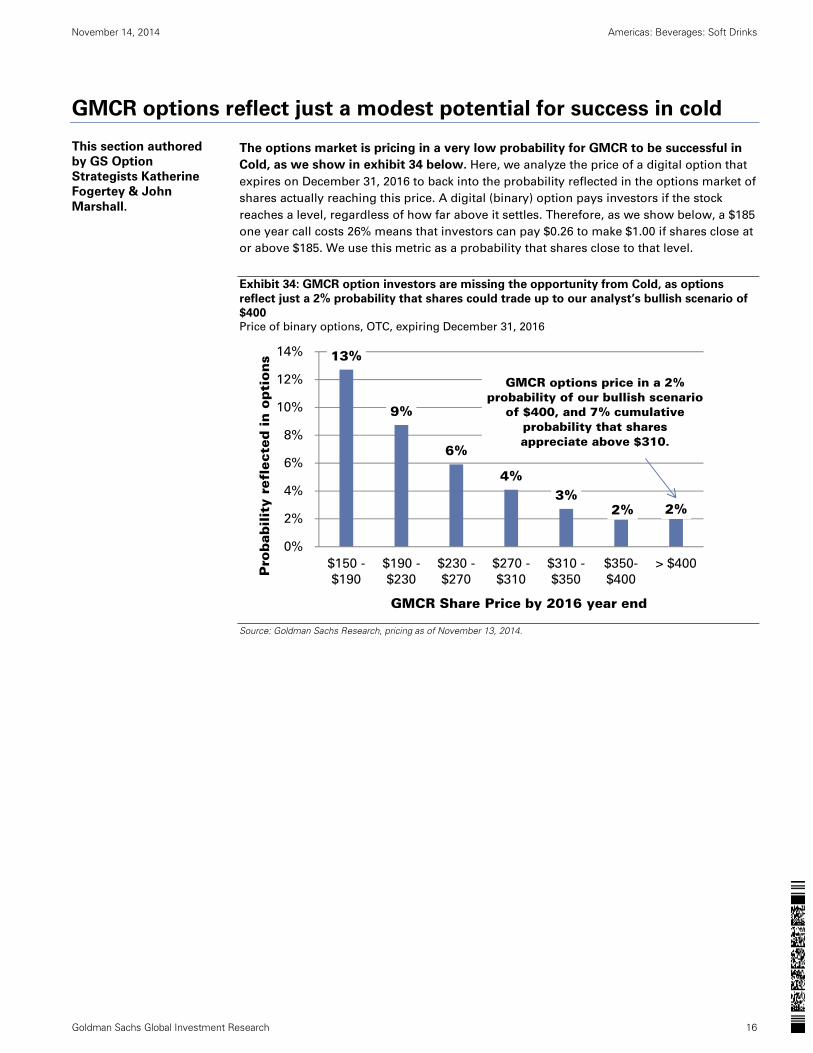
GMCR options reflect just a modest potential for success in cold
The options market is pricing in a very low probability for GMCR to be successful in
Cold, as we show in exhibit 34 below. Here, we analyze the price of a digital option that
expires on December 31, 2016 to back into the probability reflected in the options market of
shares actually reaching this price. A digital (binary) option pays investors if the stock
reaches a level, regardless of how far above it settles. Therefore, as we show below, a $185
one year call costs 26% means that investors can pay $0.26 to make $1.00 if shares close at
or above $185. We use this metric as a probability that shares close to that level.
Exhibit 34: GMCR option investors are missing the opportunity from Cold, as options
reflect just a 2% probability that shares could trade up to our analyst’s bullish scenario of
$400 Price of binary options, OTC, expiring December 31, 2016
Source: Goldman Sachs Research, pricing as of November 13, 2014.
13%
9%
6%
4%3%
2% 2%
0%
2%
4%
6%
8%
10%
12%
14%
$150 -
$190
$190 -
$230
$230 -
$270
$270 -
$310
$310 -
$350
$350-
$400
> $400
Pro
bab
ilit
y re
flec
ted in o
pti
ons
GMCR Share Price by 2016 year end
GMCR options price in a 2%probability of our bullish scenario
of $400, and 7% cumulativeprobability that shares appreciate above $310.
This section authored
by GS Option
Strategists Katherine
Fogertey & John
Marshall.

November 14, 2014 Americas: Beverages: Soft Drinks
Goldman Sachs Global Investment Research 17
Upcoming catalyst to watch for:
Earnings 19-November: Options are implying a +/-9% move on earnings, which is
significantly below the 8 quarter average move of +/-15%. While some investors may be
wary of holding GMCR shares for earnings due to high multiple and high growth profile,
we note that this has been a very important time to hold shares historically. In fact, looking
back to 2004, owning shares for the one week earnings period (5 days before to 1 day after)
has averaged 32% returns, and as been profitable in 9 out of 11 years. This is the same
return that was generated for holding the stock in all days outside of earnings; however the
return outside of earnings was less consistently profitable.
Holiday sales, particularly of Keurig 2.0: Keurig revamped its hot machine to allow for
larger brew sizes. Sales could be driven by holiday demand.
Launch of Cold Beverage Machine in 2015. We look forward to this launch, and a
potential event for the investor community.
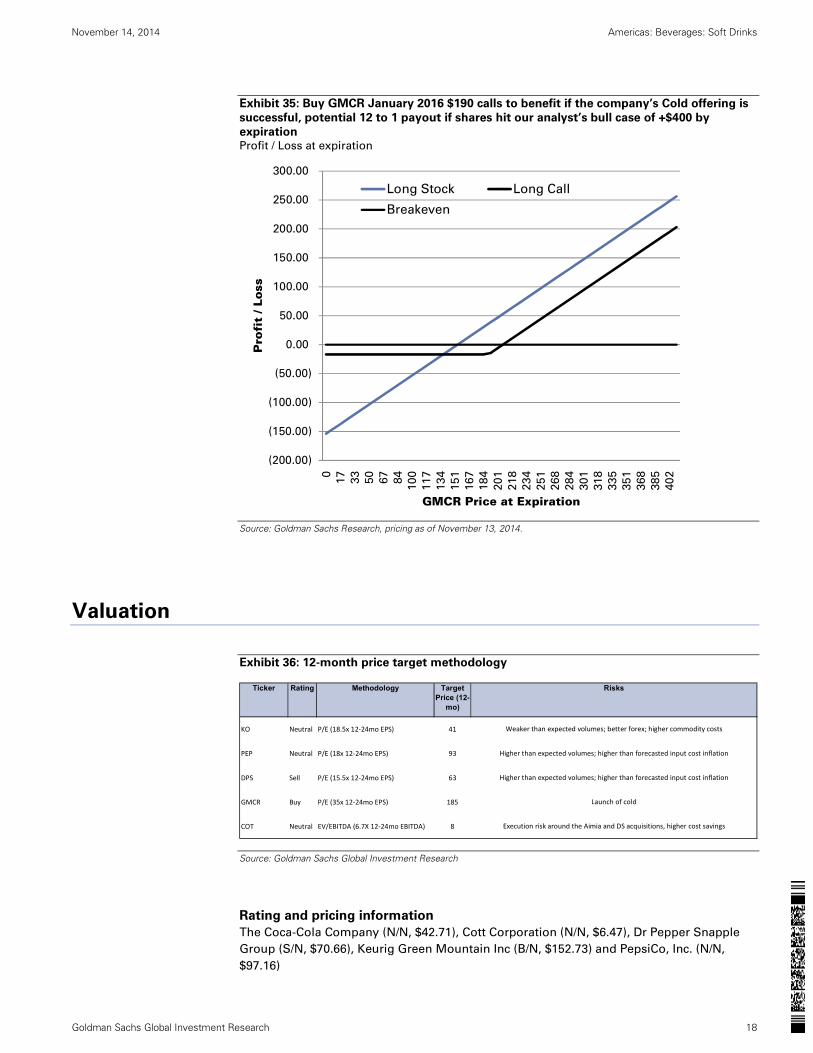
Buy GMCR Calls for earnings, holidays + cold launch
Buy January 2016 $190 calls, pay $16.95 (11%, stock $153.91). As we outline above, we
believe the options market dramatically underestimates the potential for the bull case on
shares to materialize. As such, we see value in owning longer dated options to capture
earnings and holiday, but also the launch of Keurig Cold. While this premium might shy
some investors away, we note that this is a one year option, and the implied vol of 41% is
below average levels for the year of 45%, and 4 points below 1 yr realized ahead of a key
product launch in FY15. Further, despite our analyst’s view that Cold could represent a
significant disruptive innovation for the company and industry, this implied volatility is
trading inline with larger cap consumer stocks DDS, LULU, and AVP. We chose this strike
as these calls could return 12 to 1 in our analyst’s bull case that shares trade above $400,
and 4 to 1 payout if shares trade up to our analyst’s base case of $255, by January 2016
expiration. Call buyers risk losing premium paid if shares close below the strike price at
expiration.
November 14, 2014 Americas: Beverages: Soft Drinks
Goldman Sachs Global Investment Research 18
Exhibit 35: Buy GMCR January 2016 $190 calls to benefit if the company’s Cold offering is
successful, potential 12 to 1 payout if shares hit our analyst’s bull case of +$400 by
expiration Profit / Loss at expiration
Source: Goldman Sachs Research, pricing as of November 13, 2014.
Valuation
Exhibit 36: 12-month price target methodology
Source: Goldman Sachs Global Investment Research
Rating and pricing information
The Coca-Cola Company (N/N, $42.71), Cott Corporation (N/N, $6.47), Dr Pepper Snapple
Group (S/N, $70.66), Keurig Green Mountain Inc (B/N, $152.73) and PepsiCo, Inc. (N/N,
$97.16)
(200.00)
(150.00)
(100.00)
(50.00)
0.00
50.00
100.00
150.00
200.00
250.00
300.00
0
17
33
50
67
84
10
0
11
7
13
4
15
1
16
7
18
4
20
1
21
8
23
4
25
1
26
8
28
4
30
1
31
8
33
5
35
1
36
8
38
5
40
2
Pro
fit
/ Lo
ss
GMCR Price at Expiration
Long Stock Long Call
Breakeven
Ticker Rating Methodology Target Price (12-
mo)
KO Neutral P/E (18.5x 12‐24mo EPS) 41
PEP Neutral P/E (18x 12‐24mo EPS) 93
DPS Sell P/E (15.5x 12‐24mo EPS) 63
GMCR Buy P/E (35x 12‐24mo EPS) 185
COT Neutral EV/EBITDA (6.7X 12‐24mo EBITDA) 8
Launch of cold
Execution risk around the Aimia and DS acquisitions, higher cost savings
Risks
Weaker than expected volumes; better forex; higher commodity costs
Higher than expected volumes; higher than forecasted input cost inflation
Higher than expected volumes; higher than forecasted input cost inflation

November 14, 2014 Americas: Beverages: Soft Drinks
Goldman Sachs Global Investment Research 19
Disclosure Appendix
Reg AC
We, Judy E. Hong, Ivan Holman, Katherine Fogertey, John Marshall and Freda Zhuo, hereby certify that all of the views expressed in this report
accurately reflect our personal views about the subject company or companies and its or their securities. We also certify that no part of our
compensation was, is or will be, directly or indirectly, related to the specific recommendations or views expressed in this report.
Unless otherwise stated, the individuals listed on the cover page of this report are analysts in Goldman Sachs' Global Investment Research division.
Investment Profile
The Goldman Sachs Investment Profile provides investment context for a security by comparing key attributes of that security to its peer group and
market. The four key attributes depicted are: growth, returns, multiple and volatility. Growth, returns and multiple are indexed based on composites
of several methodologies to determine the stocks percentile ranking within the region's coverage universe.
The precise calculation of each metric may vary depending on the fiscal year, industry and region but the standard approach is as follows:
Growth is a composite of next year's estimate over current year's estimate, e.g. EPS, EBITDA, Revenue. Return is a year one prospective aggregate
of various return on capital measures, e.g. CROCI, ROACE, and ROE. Multiple is a composite of one-year forward valuation ratios, e.g. P/E, dividend
yield, EV/FCF, EV/EBITDA, EV/DACF, Price/Book. Volatility is measured as trailing twelve-month volatility adjusted for dividends.
Quantum
Quantum is Goldman Sachs' proprietary database providing access to detailed financial statement histories, forecasts and ratios. It can be used for
in-depth analysis of a single company, or to make comparisons between companies in different sectors and markets.
GS SUSTAIN
GS SUSTAIN is a global investment strategy aimed at long-term, long-only performance with a low turnover of ideas. The GS SUSTAIN focus list
includes leaders our analysis shows to be well positioned to deliver long term outperformance through sustained competitive advantage and
superior returns on capital relative to their global industry peers. Leaders are identified based on quantifiable analysis of three aspects of corporate
performance: cash return on cash invested, industry positioning and management quality (the effectiveness of companies' management of the
environmental, social and governance issues facing their industry).
Disclosures
Coverage group(s) of stocks by primary analyst(s)
Judy E. Hong: America-Beverages US, America-Tobacco US.
America-Beverages US: Boston Beer Company, Brown-Forman Corp., Coca-Cola Enterprises, Inc., Constellation Brands, Cott Corporation, Dean
Foods Company, Dr Pepper Snapple Group, Keurig Green Mountain Inc, Molson Coors Brewing Co., Monster Beverage Corporation, PepsiCo, Inc.,
The Coca-Cola Company, The WhiteWave Foods Company.
America-Tobacco US: Altria Group, Inc., Lorillard, Inc., Philip Morris International Inc., Reynolds American Inc..
Option Specific Disclosures
Price target methodology: Please refer to the analyst’s previously published research for methodology and risks associated with equity price
targets.
Pricing Disclosure: Option prices and volatility levels in this note are indicative only, and are based on our estimates of recent mid-market
levels(unless otherwise noted). All prices and levels exclude transaction costs unless otherwise stated.
General Options Risks – The risks below and any other options risks mentioned in this research report pertain both to specific derivative trade
recommendations mentioned and to discussion of general opportunities and advantages of derivative strategies. Unless otherwise noted, options
strategies mentioned in this report may be a combination of the strategies below and therefore carry with them the risks of those strategies.
Buying Options - Investors who buy call (put) options risk loss of the entire premium paid if the underlying security finishes below (above) the
strike price at expiration. Investors who buy call or put spreads also risk a maximum loss of the premium paid. The maximum gain on a long call or
put spread is the difference between the strike prices, less the premium paid.
Selling Options - Investors who sell calls on securities they do not own risk unlimited loss of the security price less the strike price. Investors who
sell covered calls (sell calls while owning the underlying security) risk having to deliver the underlying security or pay the difference between the
security price and the strike price, depending on whether the option is settled by physical delivery or cash-settled. Investors who sell puts risk loss of
the strike price less the premium received for selling the put. Investors who sell put or call spreads risk a maximum loss of the difference between the
strikes less the premium received, while their maximum gain is the premium received.
For options settled by physical delivery, the above risks assume the options buyer or seller, buys or sells the resulting securities at the
settlement price on expiry.
Company-specific regulatory disclosures
Compendium report: please see disclosures at http://www.gs.com/research/hedge.html. Disclosures applicable to the companies included in this
compendium can be found in the latest relevant published research
Distribution of ratings/investment banking relationships
Goldman Sachs Investment Research global coverage universe
Rating Distribution Investment Banking Relationships
Buy Hold Sell Buy Hold Sell
Global 32% 54% 14% 42% 36% 30%

November 14, 2014 Americas: Beverages: Soft Drinks
Goldman Sachs Global Investment Research 20
As of October 1, 2014, Goldman Sachs Global Investment Research had investment ratings on 3,649 equity securities. Goldman Sachs assigns stocks
as Buys and Sells on various regional Investment Lists; stocks not so assigned are deemed Neutral. Such assignments equate to Buy, Hold and Sell
for the purposes of the above disclosure required by NASD/NYSE rules. See 'Ratings, Coverage groups and views and related definitions' below.
Price target and rating history chart(s)
Compendium report: please see disclosures at http://www.gs.com/research/hedge.html. Disclosures applicable to the companies included in this
compendium can be found in the latest relevant published research
Regulatory disclosures
Disclosures required by United States laws and regulations
See company-specific regulatory disclosures above for any of the following disclosures required as to companies referred to in this report: manager
or co-manager in a pending transaction; 1% or other ownership; compensation for certain services; types of client relationships; managed/co-
managed public offerings in prior periods; directorships; for equity securities, market making and/or specialist role. Goldman Sachs usually makes a
market in fixed income securities of issuers discussed in this report and usually deals as a principal in these securities.
The following are additional required disclosures: Ownership and material conflicts of interest: Goldman Sachs policy prohibits its analysts,
professionals reporting to analysts and members of their households from owning securities of any company in the analyst's area of
coverage. Analyst compensation: Analysts are paid in part based on the profitability of Goldman Sachs, which includes investment banking
revenues. Analyst as officer or director: Goldman Sachs policy prohibits its analysts, persons reporting to analysts or members of their
households from serving as an officer, director, advisory board member or employee of any company in the analyst's area of coverage. Non-U.S. Analysts: Non-U.S. analysts may not be associated persons of Goldman, Sachs & Co. and therefore may not be subject to NASD Rule 2711/NYSE
Rules 472 restrictions on communications with subject company, public appearances and trading securities held by the analysts.
Distribution of ratings: See the distribution of ratings disclosure above. Price chart: See the price chart, with changes of ratings and price targets in
prior periods, above, or, if electronic format or if with respect to multiple companies which are the subject of this report, on the Goldman Sachs
website at http://www.gs.com/research/hedge.html.
Additional disclosures required under the laws and regulations of jurisdictions other than the United States
The following disclosures are those required by the jurisdiction indicated, except to the extent already made above pursuant to United States laws
and regulations. Australia: Goldman Sachs Australia Pty Ltd and its affiliates are not authorised deposit-taking institutions (as that term is defined in
the Banking Act 1959 (Cth)) in Australia and do not provide banking services, nor carry on a banking business, in Australia. This research, and any
access to it, is intended only for "wholesale clients" within the meaning of the Australian Corporations Act, unless otherwise agreed by Goldman
Sachs. In producing research reports, members of the Global Investment Research Division of Goldman Sachs Australia may attend site visits and
other meetings hosted by the issuers the subject of its research reports. In some instances the costs of such site visits or meetings may be met in part
or in whole by the issuers concerned if Goldman Sachs Australia considers it is appropriate and reasonable in the specific circumstances relating to
the site visit or meeting. Brazil: Disclosure information in relation to CVM Instruction 483 is available at
http://www.gs.com/worldwide/brazil/area/gir/index.html. Where applicable, the Brazil-registered analyst primarily responsible for the content of this
research report, as defined in Article 16 of CVM Instruction 483, is the first author named at the beginning of this report, unless indicated otherwise at
the end of the text. Canada: Goldman Sachs Canada Inc. is an affiliate of The Goldman Sachs Group Inc. and therefore is included in the company
specific disclosures relating to Goldman Sachs (as defined above). Goldman Sachs Canada Inc. has approved of, and agreed to take responsibility for,
this research report in Canada if and to the extent that Goldman Sachs Canada Inc. disseminates this research report to its clients. Hong Kong: Further information on the securities of covered companies referred to in this research may be obtained on request from Goldman Sachs
(Asia) L.L.C. India: Further information on the subject company or companies referred to in this research may be obtained from Goldman Sachs
(India) Securities Private Limited. Japan: See below. Korea: Further information on the subject company or companies referred to in this research
may be obtained from Goldman Sachs (Asia) L.L.C., Seoul Branch. New Zealand: Goldman Sachs New Zealand Limited and its affiliates are neither
"registered banks" nor "deposit takers" (as defined in the Reserve Bank of New Zealand Act 1989) in New Zealand. This research, and any access to it,
is intended for "wholesale clients" (as defined in the Financial Advisers Act 2008) unless otherwise agreed by Goldman Sachs. Russia: Research
reports distributed in the Russian Federation are not advertising as defined in the Russian legislation, but are information and analysis not having
product promotion as their main purpose and do not provide appraisal within the meaning of the Russian legislation on appraisal
activity. Singapore: Further information on the covered companies referred to in this research may be obtained from Goldman Sachs (Singapore)
Pte. (Company Number: 198602165W). Taiwan: This material is for reference only and must not be reprinted without permission. Investors should
carefully consider their own investment risk. Investment results are the responsibility of the individual investor. United Kingdom: Persons who
would be categorized as retail clients in the United Kingdom, as such term is defined in the rules of the Financial Conduct Authority, should read this
research in conjunction with prior Goldman Sachs research on the covered companies referred to herein and should refer to the risk warnings that
have been sent to them by Goldman Sachs International. A copy of these risks warnings, and a glossary of certain financial terms used in this report,
are available from Goldman Sachs International on request.
European Union: Disclosure information in relation to Article 4 (1) (d) and Article 6 (2) of the European Commission Directive 2003/126/EC is available
at http://www.gs.com/disclosures/europeanpolicy.html which states the European Policy for Managing Conflicts of Interest in Connection with
Investment Research.
Japan: Goldman Sachs Japan Co., Ltd. is a Financial Instrument Dealer registered with the Kanto Financial Bureau under registration number Kinsho
69, and a member of Japan Securities Dealers Association, Financial Futures Association of Japan and Type II Financial Instruments Firms
Association. Sales and purchase of equities are subject to commission pre-determined with clients plus consumption tax. See company-specific
disclosures as to any applicable disclosures required by Japanese stock exchanges, the Japanese Securities Dealers Association or the Japanese
Securities Finance Company.
Ratings, coverage groups and views and related definitions
Buy (B), Neutral (N), Sell (S) -Analysts recommend stocks as Buys or Sells for inclusion on various regional Investment Lists. Being assigned a Buy
or Sell on an Investment List is determined by a stock's return potential relative to its coverage group as described below. Any stock not assigned as
a Buy or a Sell on an Investment List is deemed Neutral. Each regional Investment Review Committee manages various regional Investment Lists to a
global guideline of 25%-35% of stocks as Buy and 10%-15% of stocks as Sell; however, the distribution of Buys and Sells in any particular coverage
group may vary as determined by the regional Investment Review Committee. Regional Conviction Buy and Sell lists represent investment
recommendations focused on either the size of the potential return or the likelihood of the realization of the return.

November 14, 2014 Americas: Beverages: Soft Drinks
Goldman Sachs Global Investment Research 21
Return potential represents the price differential between the current share price and the price target expected during the time horizon associated
with the price target. Price targets are required for all covered stocks. The return potential, price target and associated time horizon are stated in each
report adding or reiterating an Investment List membership.
Coverage groups and views: A list of all stocks in each coverage group is available by primary analyst, stock and coverage group at
http://www.gs.com/research/hedge.html. The analyst assigns one of the following coverage views which represents the analyst's investment outlook
on the coverage group relative to the group's historical fundamentals and/or valuation. Attractive (A). The investment outlook over the following 12
months is favorable relative to the coverage group's historical fundamentals and/or valuation. Neutral (N). The investment outlook over the
following 12 months is neutral relative to the coverage group's historical fundamentals and/or valuation. Cautious (C). The investment outlook over
the following 12 months is unfavorable relative to the coverage group's historical fundamentals and/or valuation.
Not Rated (NR). The investment rating and target price have been removed pursuant to Goldman Sachs policy when Goldman Sachs is acting in an
advisory capacity in a merger or strategic transaction involving this company and in certain other circumstances. Rating Suspended (RS). Goldman
Sachs Research has suspended the investment rating and price target for this stock, because there is not a sufficient fundamental basis for
determining, or there are legal, regulatory or policy constraints around publishing, an investment rating or target. The previous investment rating and
price target, if any, are no longer in effect for this stock and should not be relied upon. Coverage Suspended (CS). Goldman Sachs has suspended
coverage of this company. Not Covered (NC). Goldman Sachs does not cover this company. Not Available or Not Applicable (NA). The
information is not available for display or is not applicable. Not Meaningful (NM). The information is not meaningful and is therefore excluded.
Global product; distributing entities
The Global Investment Research Division of Goldman Sachs produces and distributes research products for clients of Goldman Sachs on a global
basis. Analysts based in Goldman Sachs offices around the world produce equity research on industries and companies, and research on
macroeconomics, currencies, commodities and portfolio strategy. This research is disseminated in Australia by Goldman Sachs Australia Pty Ltd
(ABN 21 006 797 897); in Brazil by Goldman Sachs do Brasil Corretora de Títulos e Valores Mobiliários S.A.; in Canada by either Goldman Sachs
Canada Inc. or Goldman, Sachs & Co.; in Hong Kong by Goldman Sachs (Asia) L.L.C.; in India by Goldman Sachs (India) Securities Private Ltd.; in
Japan by Goldman Sachs Japan Co., Ltd.; in the Republic of Korea by Goldman Sachs (Asia) L.L.C., Seoul Branch; in New Zealand by Goldman Sachs
New Zealand Limited; in Russia by OOO Goldman Sachs; in Singapore by Goldman Sachs (Singapore) Pte. (Company Number: 198602165W); and in
the United States of America by Goldman, Sachs & Co. Goldman Sachs International has approved this research in connection with its distribution in
the United Kingdom and European Union.
European Union: Goldman Sachs International authorised by the Prudential Regulation Authority and regulated by the Financial Conduct Authority
and the Prudential Regulation Authority, has approved this research in connection with its distribution in the European Union and United Kingdom;
Goldman Sachs AG and Goldman Sachs International Zweigniederlassung Frankfurt, regulated by the Bundesanstalt für
Finanzdienstleistungsaufsicht, may also distribute research in Germany.
General disclosures
This research is for our clients only. Other than disclosures relating to Goldman Sachs, this research is based on current public information that we
consider reliable, but we do not represent it is accurate or complete, and it should not be relied on as such. We seek to update our research as
appropriate, but various regulations may prevent us from doing so. Other than certain industry reports published on a periodic basis, the large
majority of reports are published at irregular intervals as appropriate in the analyst's judgment.
Goldman Sachs conducts a global full-service, integrated investment banking, investment management, and brokerage business. We have
investment banking and other business relationships with a substantial percentage of the companies covered by our Global Investment Research
Division. Goldman, Sachs & Co., the United States broker dealer, is a member of SIPC (http://www.sipc.org).
Our salespeople, traders, and other professionals may provide oral or written market commentary or trading strategies to our clients and our
proprietary trading desks that reflect opinions that are contrary to the opinions expressed in this research. Our asset management area, our
proprietary trading desks and investing businesses may make investment decisions that are inconsistent with the recommendations or views
expressed in this research.
The analysts named in this report may have from time to time discussed with our clients, including Goldman Sachs salespersons and traders, or may
discuss in this report, trading strategies that reference catalysts or events that may have a near-term impact on the market price of the equity
securities discussed in this report, which impact may be directionally counter to the analyst's published price target expectations for such stocks. Any
such trading strategies are distinct from and do not affect the analyst's fundamental equity rating for such stocks, which rating reflects a stock's
return potential relative to its coverage group as described herein.
We and our affiliates, officers, directors, and employees, excluding equity and credit analysts, will from time to time have long or short positions in,
act as principal in, and buy or sell, the securities or derivatives, if any, referred to in this research.
The views attributed to third party presenters at Goldman Sachs arranged conferences, including individuals from other parts of Goldman Sachs, do
not necessarily reflect those of Global Investment Research and are not an official view of Goldman Sachs.
Any third party referenced herein, including any salespeople, traders and other professionals or members of their household, may have positions in
the products mentioned that are inconsistent with the views expressed by analysts named in this report.
This research is not an offer to sell or the solicitation of an offer to buy any security in any jurisdiction where such an offer or solicitation would be
illegal. It does not constitute a personal recommendation or take into account the particular investment objectives, financial situations, or needs of
individual clients. Clients should consider whether any advice or recommendation in this research is suitable for their particular circumstances and, if
appropriate, seek professional advice, including tax advice. The price and value of investments referred to in this research and the income from them
may fluctuate. Past performance is not a guide to future performance, future returns are not guaranteed, and a loss of original capital may occur.
Fluctuations in exchange rates could have adverse effects on the value or price of, or income derived from, certain investments.
Certain transactions, including those involving futures, options, and other derivatives, give rise to substantial risk and are not suitable for all investors.
Investors should review current options disclosure documents which are available from Goldman Sachs sales representatives or at
http://www.theocc.com/about/publications/character-risks.jsp. Transaction costs may be significant in option strategies calling for multiple purchase
and sales of options such as spreads. Supporting documentation will be supplied upon request.
All research reports are disseminated and available to all clients simultaneously through electronic publication to our internal client websites. Not all
research content is redistributed to our clients or available to third-party aggregators, nor is Goldman Sachs responsible for the redistribution of our
research by third party aggregators. For research, models or other data available on a particular security, please contact your sales representative or
go to http://360.gs.com.
Disclosure information is also available at http://www.gs.com/research/hedge.html or from Research Compliance, 200 West Street, New York, NY
10282.

November 14, 2014 Americas: Beverages: Soft Drinks
Goldman Sachs Global Investment Research 22
© 2014 Goldman Sachs.
No part of this material may be (i) copied, photocopied or duplicated in any form by any means or (ii) redistributed without the prior written consent of The Goldman Sachs Group, Inc.