americas trading overview - platts · · 2014-09-18source: ed&f man research. cuba’s...
TRANSCRIPT

Americas trading overview
1
0
5
10
15
20
25
30
35
0
5
10
15
20
25
30
35
40
80/81 85/86 90/91 95/96 00/01 05/06 10/11 13/14
Brazil Cuba NY#11 (RHS)
Production (mln MT) Average (c/lb)Production (mln MT) Average (c/lb)
0
5
10
15
20
25
30
35
0
1
2
3
4
5
6
80/81 85/86 90/91 95/96 00/01 05/06 10/11 13/14
Mexico Centrals Colombia ArgentinaPeru Venezuela NY#11 (RHS)
Production (mln MT) Average (c/lb)Production (mln MT) Average (c/lb)
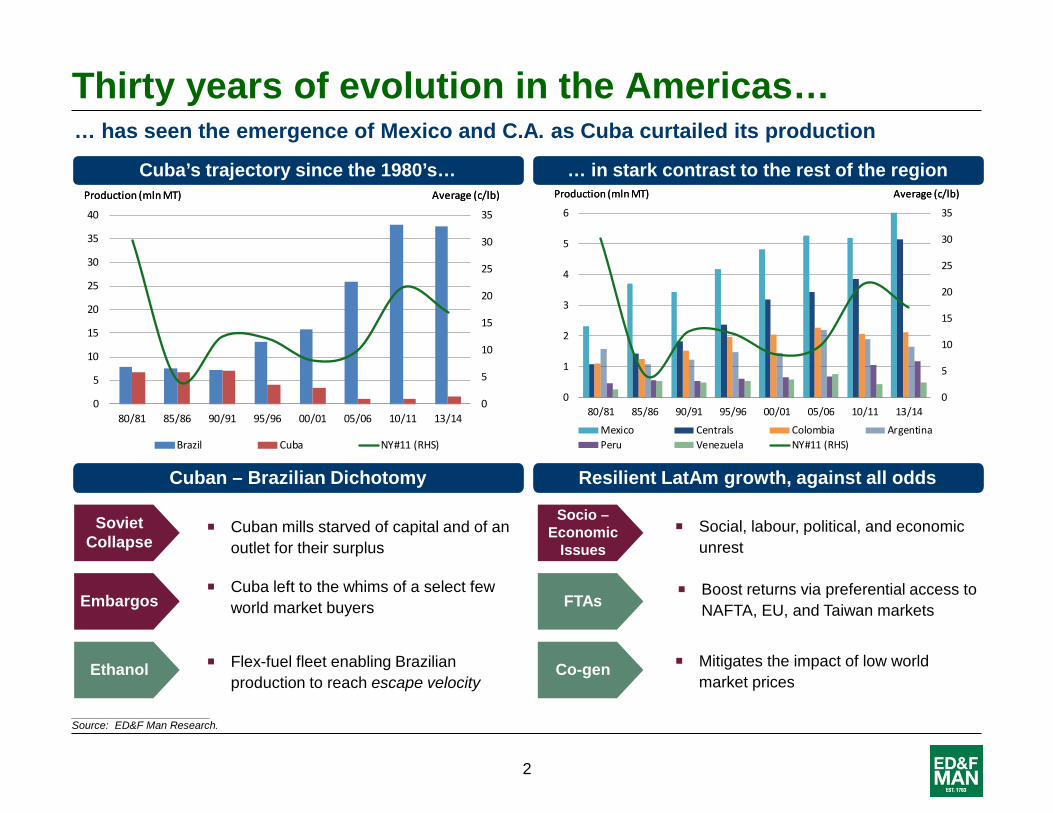
… has seen the emergence of Mexico and C.A. as Cuba curtailed its production
Thirty years of evolution in the Americas…
___________________________ Source: ED&F Man Research.
Cuba’s trajectory since the 1980’s… … in stark contrast to the rest of the region
Soviet Collapse
Embargos
Socio – Economic
Issues
Co-gen Ethanol Flex-fuel fleet enabling Brazilian production to reach escape velocity
Cuban mills starved of capital and of an outlet for their surplus
Cuba left to the whims of a select few world market buyers
Mitigates the impact of low world market prices
Social, labour, political, and economic unrest
FTAs Boost returns via preferential access to
NAFTA, EU, and Taiwan markets
Cuban – Brazilian Dichotomy Resilient LatAm growth, against all odds
2

… while capturing an increasing share of the global volume traded, from 11% to 15% in seven years
Americas’ (ex-BR) production growth has kept pace
___________________________ Source: ED&F Man Research.
Global exporters focus on Raws… … while Americas (ex-BR) shifts to Whites
27.0
40.2
17.020.661%
66%
58%
59%
60%
61%
62%
63%
64%
65%
66%
67%
0
5
10
15
20
25
30
35
40
45
2006/07 2007/08 2008/09 2009/10 2010/11 2011/12 2012/13 2013/14
Raws shareExports (mln MT)
Exp. (raws) Exp. (whites) Raws share (RHS)
3.8
5.6
1.4
3.1
73%
65%
0%
10%
20%
30%
40%
50%
60%
70%
80%
0
1
2
3
4
5
6
2006/07 2007/08 2008/09 2009/10 2010/11 2011/12 2012/13 2013/14
Raws shareExports (mln MT)
Exp. (raws) Exp. (whites) Raws share
Freight Advantage
VHP Edge
Logistics
Value-add
Logistics Focus on bulk loading facilities
Brazil, Thailand, Australia benefit from cheaper freight to the Gulf, India, APAC refiners
Brazil benefits from a first-mover advantage in meeting VHP requirements solicited by modern refineries
Keen to establish recognizable international brands, mills are willing to customize packaging for clients
C. A. mills located within 100 km of ports Dedicated sugar terminals reduced
competition with other export crops for bagged loading
Co-gen Additional energy costs from refining paid for with energy sales to transnational grids
“Big 3” catering to stand-alone refineries Americas (ex-BR) filling the void
3

Top three – 60% of production
NAFTA, Venezuela, and Chile dictate the regional flows
Overview of the region
___________________________ Source: ED&F Man Research.
Top two – 50% of exports Top four – 80% of imports
US26%
Mexico21%
Guatemala10%
Colombia7%
Argentina6%
Cuba6%
Others24%
2013/14 - Production (28.4m MT)
US40%
Mexico17%
Argentina7%
Colombia7%
Canada5%
Others24%
2013/14 - Consup. (25.8m MT)
Mexico26%
Guatemala22%
Cuba10%Colombia
8%
Nicaragua6%
El Salvador5%
Others23%
2013/14 - Exports (8.8m MT)
US43%
Canada19%
Venezuela12%
Chile6%
Colombia3%
Others17%
2013/14 - Imports (7.1m MT)
NAFTA leads consumption
4

Northern demand is met by Southern supply…
___________________________ Source: ED&F Man Research.
USA
Colombia
Canada
Mexico
Venezuela
Chile
Argentina
Peru
Caribbean
Canada and USA
Central America
South America - tight
… Venezuela, and Chile being the exceptions
5
Deficit markets
Surplus markets

Main drivers in the region
___________________________ Source: ED&F Man Research.
Sugar production (2000/01 – 2013/14)
Net surplus (2000/01 – 2013/14)
0.0
1.5
3.0
4.5
6.0
7.5
9.0
Peru
Nica
ragu
a
Guat
emal
a
Hond
uras
El S
alva
dor
Cost
a Ri
ca
Mex
ico
Arge
ntin
a
Colo
mbi
a US
Vene
zuel
a
Chile
Cuba
Strong increase Increase Unchanged Decrease
Production (mln MT)
79% 72% 62% 60% 46% 24% 22% 14% 4% -3% -17% -44% -49% Total Growth
5% 4% 4% 4% 3% 2% 2% 1% 0% 0% -1% -4% -5% CAGR
-3.0
-2.0
-1.0
0.0
1.0
2.0
3.0
4.0
Guat
emala
Mex
ico
Cuba
El Sa
lvado
r
Colom
bia
Nica
ragu
a
Costa
Rica
Hond
uras
Arge
ntina Peru
Chile
Vene
zuela US
Surplus/deficit (mln MT)
6

Raws to value-added whites
7

230
157
225
289
188
248200 189
6543
96 95
13 2
80 93
2010/11 2011/12 2012/13 2013/14*
Imports (k MT)
Centrals Colombia Argentina Brazil
792 783
579
873
77 63
210
382
2010/11 2011/12 2012/13 2013/14*
Imports (k MT)
Brazil Centrals
1,411
953
1,8901,734
463
793
331511
300475
167 16055 42 43 1587 76 60 8
2010/11 2011/12 2012/13 2013/14*
Imports (k MT)
Mexico Centrals Brazil Colombia Argentina
139
190
117
178
83
7 834
80
137
198
137
2010/11 2011/12 2012/13 2013/14*
Imports (k MT)
Colombia Brazil Centrals
Main importers in the region
___________________________ Source: ED&F Man Research. * Last available date. All numbers in 1,000 MT.
Chile Venezuela
USA Caribbean
8

Trade flows shifting out of the region
___________________________ Source: ED&F Man Research.
Central America – sugar exports by destination
0
250
500
750
1,000
1,250
1,500
1,750
2,000
Africa Asia Americas Others2009/10 2010/11 2011/12 2012/13 2013/14*
0% 16%
21% 35%
82% 66%
9

Export mix shifting from raws to value-added whites
___________________________ Source: ED&F Man Research.
Guatemala / Colombia exports (2009/10 – 2012/13) Brazilian Exports
0
200
400
600
800
1,000
1,200
Raw White Raw White
Guatemala Colombia
Exports (k MT)
0
5,000
10,000
15,000
20,000
25,000
2009/10 2010/11 2011/12 2012/13 2013/14
Exports (k MT)
Raw Whites
Brazil is focusing its sales to the raw markets, while Guatemala and Colombia are filling the void left in whites sugar exports
Value-added Central American sugars head to preferential markets
10

Protection from the World Market
11

Three key components to the Americas
World and
regional markets
Preferential markets
(USA, EU, Taiwan, Andean)
Domestic Market
12

Domestic markets play an important role in the region
World market exposure
___________________________ Source: ED&F Man Research.
Global vs. Regional prices Consumption / Production ratio (2013/14)
300
400
500
600
700
800
900
1,000
Price (USD/MT)
*weighted prices - (Guatemala, El Salvador, Colombia, Mexico and Peru)
Domestic market* LDN5 NY16 NY11
104%
80%
64%57%
42% 39%28% 27% 27% 31%
Domestic prices shield regional producers from NY #11 and LDN #407 volatility
Price stability is achieved via trade barriers, production seasonality, and market size
Regional producers are less exposed to the world market than the Big 3
13

100%
28%
8%
62%
Production Domestic Market TRQ and FTA Regional and Worldmarkets
100%80%
3%
27%
Production Domestic Market TRQ and FTA Regional and Worldmarkets
100%
36%
24%
37%
Production Domestic Market TRQ and FTA Regional and Worldmarkets
100%
42%
7%
34%
Production Domestic Market TRQ and FTA Regional and Worldmarkets
Market mix varies among the producers
___________________________ Source: ED&F Man Research.
Guatemala (2012/13)
Colombia (2012/13)
El Salvador (2012/13)
Nicaragua (2012/13)
14

0%10%20%30%40%50%60%70%80%90%
100%
2008 2009 2010 2011 2012 2013
Hydro Thermal Cogen Geo Wind Solar Biogás0
100
200
300
400
500
600
700
Guatemala Colombia Nicaragua El Salvador Honduras Costa Rica
MW
Further protects producers from the vagaries of the world market
co-generation
___________________________ Source: ED&F Man Research.
Centrals – Installed capacity by energy type Installed capacity (2008 – 2013)
co-generation represents nearly 7% of total electricity produced in Central America
In Guatemala co-generation provides ~25% of the country’s electricity
Central American installed capacity increased ~45% over the past 5 years(984 MW in 2013)
Colombian installed capacity increased ~60% (187 MW in 2013) over the same period
Electricity is therefore an important source of revenue for the mills, enabling sugar production growth in a period of low world market prices
15

Ethanol
___________________________ Source: ED&F Man Research.
Colombia – Sugar and ethanol exports
Ethanol is another important by-product for the region
The biofuel market allows countries to not only depend less on oil imports, but also export ethanol to the international market.
Colombia has increased ethanol production by ~50% in the past 5 years
Countries with low area available for cane expansion will tend to reduce sugar production in order to meet mandatory blend levels
0
100
200
300
400
500
600
700
800
900
1,000
2006 2007 2008 2009 2010 2011 2012 2013Sugar exports Ethanol production
Quantity (k MT and m3)
Current Mandates
E10
E5
E25
E7.8
E8
E10
Ethanol mandates in the region
16

Long term competitive advantage
17

Potential global growth by 2030
___________________________ Source: ED&F Man Research, IMF.
Global per capita consumption (2013) Population growth (2013 – 2030)
+ 1.2 billion more people on the planet than today
+ 25 million MT of additional consumption via population growth alone, centered on Africa and Asia-Pacific
+ 55 million MT of additional consumption via GDP growth alone, Africa and Asia-Pacific having the highest
GDP growth prospects
N/C America,
81South
America, 58
Europe/CIS, 22Africa, 486
Asia-Pacific, 471
Middle East, 75
23
35
49
34 33
16 17
29
38
World N/CAmerica
SouthAmerica
WesternEurope
EastenEurope
Africa Asia MiddleEast
Oceania
Asia-Pacific and Africa are poised to be the main drivers of future consumption growth
18

24
Potential global growth by region 2030/31 consumption is projected to far exceed current production levels
___________________________ Source: ED&F Man Research. All figures in millions of MT tel quel. 2030/31 figures equal to 2013/14 production less 2030/31 projected consumption.
3
7
4
3
26
1
5
NAFTA Europe
CIS
W. Africa
E. Africa
Southern Africa
Asia Pacific
MENA
Indian Subcontinent
Central America
South America
Brazil
19
1 0
3
5
10 18
4 10
2
7
1
21
0
26
3
4
26
2030/31 (P13/14 – C30/31)
32 2013/14
103 27
Regional Surplus’
Regional Deficits
5.5
75
Global Balance

Competitiveness in the region Sugar efficiency vs. potential acreage
>400
Low
Production Costs
___________________________ Source: ED&F Man Research.
Sugar (MT/ha)
20
High

Outlook
21

The Americas are well-positioned to continue weathering out the storm and benefit from an eventual transition to a deficit market
Regional outlook
Supply Demand
The region will continue to increase production, although area expansion opportunities are shrinking
22
Ethanol Ethanol mandates could eat into sugar
production, particularly in Colombia
Domestic markets will continue to play an important role as a result of strong domestic GDP and population growth
Emerging Markets
The Peruvian privatizations are bearing their fruits, Peru is set to become a net exporter in the medium term
LatAm producers stand to benefit from the NAFTA dispute, at Mexico’s expense
Increased exports of whites from the region, as Brazil focuses its exports on bulk raws
Peru NAFTA
Product Mix
The region will be a strong beneficiary of the consumption per capita increases in Asia and Africa
Yield + Acreage
Co-gen Co-generation growth will be the main
driver behind incremental cane acreage, and as a consequence, sugar tonnage

23
Developed by ED&F MAN Commodity Research
Thank you
Disclaimer: Any comments or opinions in this presentation are not intended to be an offer to buy or sell commodities or futures and options thereon as they merely state our views and carry no guarantee as to their accuracy. © 2014 ED&F Man Holdings