ammonia concentration monitoring using arduino …
TRANSCRIPT

Petric et al. Ammonia concentration monitoring using Arduino platform
EnvEng-IO (2019) / Vol.6 / No.1 21
AMMONIA CONCENTRATION MONITORING USING ARDUINO
PLATFORM
Marko Petric 1, 2*, Filip Dodigović 1*, Ivana Grčić 1, Petar Markužić 1, Lucija Radetić 1 Mateo Topić 1 1 University of Zagreb Faculty of Geotehnical Engineering Hallerova aleja 7, 42000 Varaždin, Croatia
2 Jožef Stefan Institute, Jamova cesta 39, SI-1000 Ljubljana, Slovenia *E-mail of corresponding authors: [email protected], [email protected]
Abstract: In order to evaluate the efficacy of ammonia photocatalysis, it is necessary to continuously monitor its concentration during the process. This paper presents ammonia concentration monitoring using a low cost (non-professional) electronic device. The device is based on an open source electronic platform, and it is composed of the MQ-137 ammonia detection sensor, connected to the Croduino Basic 2 board. Sensitive material of the sensor is a metal oxide (SnO2). The change in the ammonia concentration causes a change in the electrical resistance, which is measured and used for the ammonia concentration estimation. Four measurements, with ammonia concentration ranging from 0-500 ppm were performed in the controlled environment. With the purpose of the device calibration and repeatability test, along with a low-cost device, the monitoring was carried out also with a professional device, Geotech GA5000 gas analyser. Using the information provided in the sensor datasheet, together with the measured data, the measurement error of the low-cost device was assessed. After calibration, ammonia concentrations measured using a low-cost device, are consistent with those obtained from the professional device. Keywords: MQ-137 sensor, Arduino, ammonia concentration, photocatalyst
Received: 06.06.2019. / Accepted: 08.07.2019.
Published online: 16.07.2019.
Original scientific paper
1. INTRODUCTION
Over the past several years, open hardware concepts and portable sensors have undergone a period of rapid development. During the time, open hardware concepts, i.e. Arduino platform, are becoming gradually accepted within scientific and educational community. Availability, low price, steep learning curve and abundance of available examples makes this concept very convenient for a non-professional to enter the world of hardware and software development. The focus of this paper is put on ammonia concentration monitoring during the photocatalysis process, using a low-cost MQ-137 sensor. Different examples of MQ-137 sensor application in various scientific areas are available, such as, spoiled meat classification (Kartika et al. 2018), construction of electronic nose for characterization of saffron aroma (Kiani et al. 2017) or in detection of seasonal allergic rhinitis in exhaled breath (Saidi et al. 2015). The MQ-137 sensor is also used for monitoring organic abundance in soil to advocate food security and sustaining the farming system (Dorji et al. 2017).
Increasing awareness of harmful consequences of persistent organic pollutants in water and air makes development of photocatalysis for their degradation one of significant goals in environmental engineering. A specific problem of air pollution over agricultural land is ammonia (NH3) and other nitrogen gases. Increasing the use of pesticides and fertilizers increases the concentration of VOCs and NH3 in the air as agricultural areas are recognized as collective emission sources. In accordance with the applicable IPPC Directive (Brinkmann et al. 2016), photocatalytic oxidation is cited as an alternative best available technique (NRT), effective for the removal of gases from the air. With this type of technology, it is possible to remove the following pollutants: VOC, unpleasant smells, H2S, NH3, amines and mercaptans, NOX, SOX, CO and O3. (Gaya and Abdullah 2008). It is a process that uses the synergistic interaction of light radiation, catalysts - semiconductors and oxidative species to oxidize ammonia to N2 and to break down organic pollutants in fluids to H2O and CO2 other inert products depending on the chemical composition of the pollutant. The basic advantage of this method is the necessary conditions that are easy to satisfy, which are the presence of UV or VIS electromagnetic radiation, atmospheric oxygen and water. All of these conditions already exist in the environment, it is only necessary to provide photocatalytically active material and photocatalytic oxidation can begin. It is applied for the purification of water and air in the industry sector, i.e. in waste treatment plants, fermentation processes, coating applications and the food industry (Boyjoo et al. 2016).
The application of this indoor air purification technology has a much higher potential for commercialization, especially for the removal of VOCs. and several recents patents can be found to confirm the applicability (Wang et al. 2007; Pingjian 2019) For the purification of polluted air, photocatalytic reactors with the immobilized photocatalyst applied to the carrier (surface) must be properly designed and placed

Petric et al. Ammonia concentration monitoring using Arduino platform
22 EnvEng-IO (2019) / Vol.6 / No.1
directly on the source of emission. Due to variations in emissions, concentration of pollutants in air should be continuously monitored before and after the photocatalytic purification to control the process efficiency and to estimate the positive impact on the air quality; hence the necessity for the development of simple analytical platform based on portable sensors and open hardware concepts.
2. EXPERIMENTAL SECTION 2.1. Experimental setup for measurement concentration of the NH3 Low-cost sensor was calibrated in a controlled environment that is made of a plastic container connected to the
ammonia supply, Figure 1. Calibration was conducted using a professional device Geotech GA5000, with the declared ammonia concentration measurement accuracy of 10 % (Geotech manual). For this purpose, the MQ-137 sensor was placed inside the container, and professional device was connected to it. Along with concentration measurements, temperature and relative humidity inside container was monitored by DHT-22 sensor. The MQ-137 sensor, which was used in these experiments is fabricated by Zhengzhou Winsen Electronics Technology Co., Ltd. Measurable ammonia concentration is within a range between 5 and 500 ppm. The load resistance is adjustable, and heating resistor is approx. 29 3 Ω. Measurement read outs were conducted using Arduino based system, Croduino Basic 2 electronic board (https://e-radionica.com/). The output voltage from the sensor module MQ-137 is converted to digital signal using a 10-bit analog to digital converter (ADC) which is a part of the board.
Ammonia solution, 110 𝜇𝐿 of ammonia (25 %, Kemika) diluted in 250 mL distilled water, is inside of erlenmeyer flask that is directly connected to bottle. With help of air pump (Fluval Q2, HAGEN, 240 L/min) ammonia solution is pumped to the bottle. Some time is needed to achieve balanced atmosphere inside of a system. After achieving balance, readings are taken with both Geotech and Arduino system. Next, 110 𝜇𝐿 of ammonia is added to flask and same process repeats until desired number of data is taken. The measured data were fitted by means of least squares fitting program using Python 3.6 program language and limfit package (Newville et al 2014).
Figure 1. The photo of the setup and schematic picture of the calibration setup showing a) fan b) erlenmeyer
flask c) controlled environment made of plastic container with sensors d) Croduino board f) computer.
2.2. Working principles of the MQ-137
MQ-137 is a semiconductor gas sensor which use the sensitivity of the metal oxide SnO2 to the concentration of ammonia in the air. A detailed description principle of the work sensitive material of the sensor can be found in the paper (Barsan & Weimar 2003). In this work, focus was on the complete board with the sensor, which can be purchase on the market, the sensor module used in this work is presented in Figure 2. We found the examples of using MQ sensor board in determining ammonia (Aswinth 2018) and butane (https://jayconsystems.com)
a) b) c) d) f)

Petric et al. Ammonia concentration monitoring using Arduino platform
EnvEng-IO (2019) / Vol.6 / No.1 23
concentration in air. The starting point in understanding MQ sensors is the schematic circuit, Figure 2. The variable resistor that changes its value according to the concentration of gas, in this case ammonia, it is built between A and B pin and it is connected in serial with load resistor (RL). Between H and H pins it is built-in another resistor used for the heater of the sensitive material. This is necessary for proper work of the sensor.
Figure 2. (left) The picture of Croduino Basic 2 board and MQ-137 sensor module. (right) The schematic representation of the sensor circuit. Download from https://jayconsystems.com.
The voltage 𝑉 is measured on the 𝑅 resistor, but it was needed to derive a formula for variable resistor
(𝑅 ) between A and B pins. Using Ohm's Law, the current 𝐼 is written through 𝑅 and 𝑅 resistors as:
𝐼𝑉
𝑅 𝑅, (1)
where 𝑉 is the supply voltage. Again, using Ohm's Law the voltage on 𝑅 resistor is written as 𝑉 𝐼𝑅 and
by inclusion of an expression for the current from Equation 1, the formula for 𝑅 is gotten as:
𝑅𝑉
𝑉1 𝑅 . (2)
The sensitivity characteristic of the gas concentration in parts per million (ppm) according to the resistance of
the sensor is provided by the producer, Figure 3. The graph is on the log-log scale, where on the y-axis is shown
the ratio of the resistors 𝑅 𝑅 . The 𝑅 is the resistance of the variable resistor in the fresh air and according to
Equation 2 it can be rewritten as:
𝑅𝑉
𝑉 ℎ 1 𝑅 𝑘𝑜𝑛𝑠𝑡 𝑅 . (3)
Figure 3. The sensitivity characteristics of the MQ-137 sensor provided by producer.
Petric et al. Ammonia concentration monitoring using Arduino platform
24 EnvEng-IO (2019) / Vol.6 / No.1
In the Figure 3, the ratio and the concentration are linearly related in the log-log graph. Therefore, by using the equation for the line and changing variable 𝑥 and 𝑦 with log functions, the following equation is gotten:
log𝑅𝑅
𝑎 log 𝑝𝑝𝑚 𝑏, (4)
where constant 𝑎 and 𝑏 are slope of the line and y-axis intercept, respectively. The constant 𝑎 and 𝑏 can be
calculated from the Figure 3. In general, the idea is to measure voltage 𝑉 and calculate 𝑅 by using Equation 2, after Equation 4 is rewritten to get results in 𝑝𝑝𝑚. In this work, the concentration is independently measured with Geotech, therefore 𝑉 dependence on change of the concentration is studied. For this reason, 𝑉 can be derived from Equation 2 and 4 as follow
𝑉𝑘𝑜𝑛𝑠𝑡
𝑝𝑝𝑚 𝑘𝑜𝑛𝑠𝑡 (5)
where 𝑘𝑜𝑛𝑠𝑡 and 𝑘𝑜𝑛𝑠𝑡 are combination of the constant 𝑉 , 𝑘𝑜𝑛𝑠𝑡 , and 𝑏. 3. RESULTS AND DISCUSSION In order to estimate standard error of the read out voltage from the sensor module few measurements was taken
of the voltage on the fresh air and 𝑉 ℎ 0.4203 0.0006 𝑉 is gotten. In the next step, focus was on the estimation of the error in the calibration measurements.
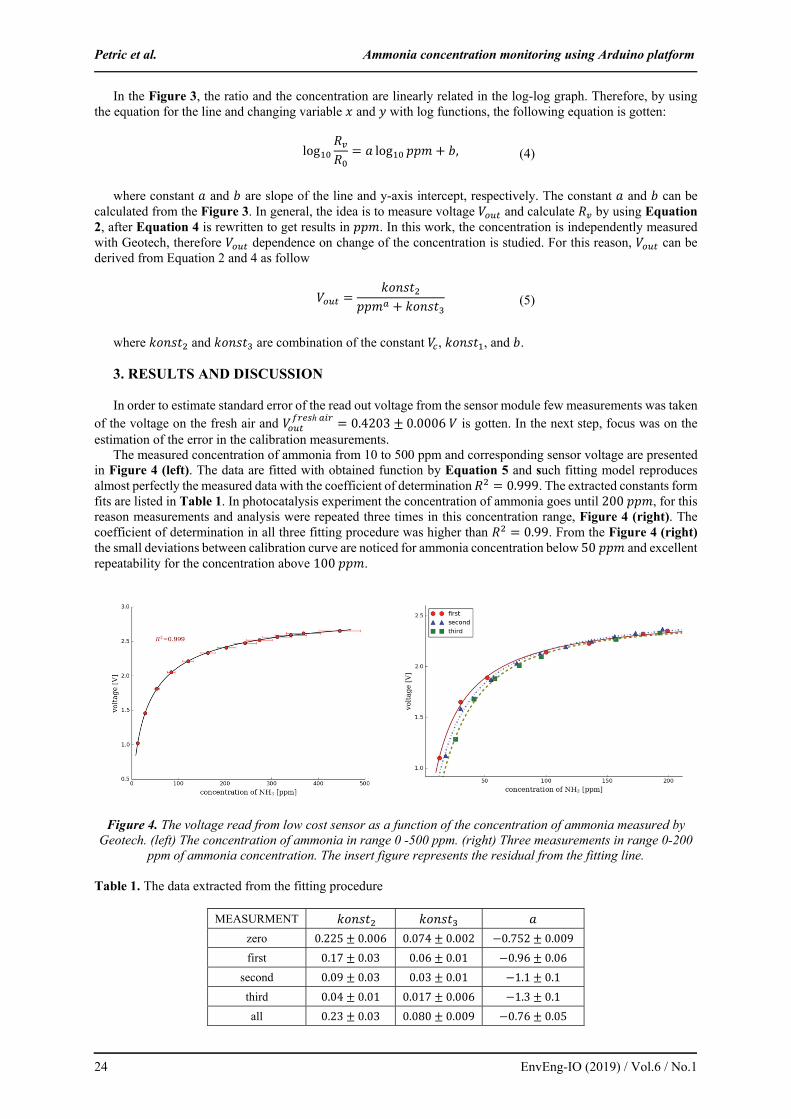
The measured concentration of ammonia from 10 to 500 ppm and corresponding sensor voltage are presented in Figure 4 (left). The data are fitted with obtained function by Equation 5 and such fitting model reproduces almost perfectly the measured data with the coefficient of determination 𝑅 0.999. The extracted constants form fits are listed in Table 1. In photocatalysis experiment the concentration of ammonia goes until 200 𝑝𝑝𝑚, for this reason measurements and analysis were repeated three times in this concentration range, Figure 4 (right). The coefficient of determination in all three fitting procedure was higher than 𝑅 0.99. From the Figure 4 (right) the small deviations between calibration curve are noticed for ammonia concentration below 50 𝑝𝑝𝑚 and excellent repeatability for the concentration above 100 𝑝𝑝𝑚.
Figure 4. The voltage read from low cost sensor as a function of the concentration of ammonia measured by Geotech. (left) The concentration of ammonia in range 0 -500 ppm. (right) Three measurements in range 0-200
ppm of ammonia concentration. The insert figure represents the residual from the fitting line. Table 1. The data extracted from the fitting procedure
MEASURMENT 𝑘𝑜𝑛𝑠𝑡 𝑘𝑜𝑛𝑠𝑡 𝑎
zero 0.225 0.006 0.074 0.002 0.752 0.009
first 0.17 0.03 0.06 0.01 0.96 0.06
second 0.09 0.03 0.03 0.01 1.1 0.1
third 0.04 0.01 0.017 0.006 1.3 0.1
all 0.23 0.03 0.080 0.009 0.76 0.05

Petric et al. Ammonia concentration monitoring using Arduino platform
EnvEng-IO (2019) / Vol.6 / No.1 25
If all measurements are treated together and analysis of the model function repeated, Equation 5 still reproduces very good measurement data, with the coefficient of determination 𝑅 0.987. The experimental data are represented in Figure 5. The error of the calibration measurements can be calculated using partial derivative of Equation 5 and multiplied by the error of the Geotech concentration measurements as:
𝛿𝑉 𝛿𝑝𝑝𝑚 ∙𝑘𝑜𝑛𝑠𝑡 ∙ 𝑎 ∙ 𝑝𝑝𝑚
𝑝𝑝𝑚 ∙ 𝑝𝑝𝑚 𝑘𝑜𝑛𝑠𝑡 (6)
The Equation 6 can be evaluated for certain concentration; for example, in case of 100 𝑝𝑝𝑚 the error is
𝛿𝑉 0.04 𝑉. This is two order of magnitude higher than the read-out error, but it is still relatively low.
Figure 5. The voltage read from low cost sensor as a function of the concentration of ammonia measured by Geotech. The error bars of the calibration procedure are added on the fitting model.
When experimental data are compared with the data given from producer (Figure 2), certain deviation is
noticeable as it is shown on Figure 6. The average absolute deviation is ∆ 0.04. The resistor values around
100 𝑝𝑝𝑚 is 0.12, which is 33 %. Therefore, without calibration procedure at ammonia concentration of
100 𝑝𝑝𝑚 the deviation can be estimated to the 33 𝑝𝑝𝑚, which can be the main error in experiments with MQ-137 sensors. The cause of the deviation is difficult to locate, but some explanation can be proposed. The producer reported data for the sensor not for the module which include few additional components (resistors, diode, potentiometer) and this components produced systematic deviation.
Figure 6. Comparison of the experimental data obtained in this work and calibration curve given by the producer

Petric et al. Ammonia concentration monitoring using Arduino platform
26 EnvEng-IO (2019) / Vol.6 / No.1
4. CONCLUSION As shown in this paper, results reproducibility in measuring ammonia concentration in air can be achieved
using a low-cost MQ-137 sensor. The sensor was calibrated by a professional device Geotech GA5000, with declared full scale accuracy of 10% for ammonia concentration measurement. Using measured values, along with professional device accuracy, a measurement error analysis was performed. Calculated error of 0.04 V at voltage corresponding to the concentration of 100 ppm was obtained. Considering requirements of ammonia photocatalysis process efficiency evaluation, calculated error is acceptable. It was also shown that sensor calibration parameters declared by the producer should be verified prior measurement and calibrated if necessary. Despite the low price, the MQ-137 sensor showed good overall performance during ammonia concentration measurements and with Arduino system can be used to monitor photocatalysis of ammonia.
5. ACKNOWLEDGMENTS This work has been fully supported by Croatian Science Foundation under the project IP-2018-01-5246 (dr.
Andreja Gajović, Institute Ruđer Bošković). 6. REFERENCES Aswinth Raj (2019) Measuring PPM from MQ gas sensor using Arduino (MQ-137 Amonia)
https://circuitdigest.com/microcontroller-projects/arduino-mq137-ammonia-sensor Barsan N and Weimar U (2003) Understanding the fundamental principles of metal oxide based gas sensors;
the example of CO sensing with SnO2 sensors in the presence of humidity. J. Phys.: Condens. Mat. 15 R813 Brinkmann T., Santonja G., Yükseler H., Roudier S., Sancho L. D. (2016) Best available techniques (BAT)
reference document for common waste water and waste gas treatment/management systems in the chemical sector
Boyjoo Y., Sun H., Liu J., Pareek V. K., Wang S. (2016) A Review on Photocatalysis for Air Treatment : From Catalyst Development to Reactor Design. Chem. Eng. J. 310(2), 537-559
Dorji U, Pobkrut T, Siyang S, Chaiyasit T, Choden P and Kerdcharoen T, (2017) Development of real time smart electronic nose system for monitoring organic abundance in soil, 14th International Conference on Electrical Engineering/Electronics, Computer, Telecommunications and Information Technology (ECTI-CON), Phuket, 2017, 163-166.
Gaya U I, Abdullah A H (2008), Heterogeneous photocatalytic degradation of organic contaminants over titanium dioxide: A review of fundamentals, progress and problems, J Photoch Photobio C: Reviews, 9(1), 1-12
Geotech manual (2019), Available via https://www.geotechuk.com/site/wp-content/uploads/2016/03/GA5000-datasheet-1-1.pdf Cited 1 May 2019
Jaycon Systems (2019), Available via https://jayconsystems.com/blog/understanding-a-gas-sensor Cited 1 May 2019
Kartika V S, Rivai M and Purwanto D (2018) Spoiled meat classification using semiconductor gas sensors, image processing and neural network, Intern. Conf. Inf. and Com. Tec. (ICOIACT), pp. 418-423.
Kiani S and Minaei S and Ghasemi-Varnamkhasti M and Ayyari M (2017) An original approach for the quantitative characterization of saffron aroma strength using electronic nose. Int J Food Prop, 20, S673-S683
Newville M, Stensitzki T, Allen D B, Ingargiola A (2014) LMFIT: Non-Linear Least-Square Minimization and Curve-Fitting for Python. DOI:10.5281/zenodo.11813
Pingjian Z (2019) CN208389639 (U) - A glass fiber filter equipment for photocatalysis exhaust -gas treatment equipment
Python Software Foundation. Python Language Reference, version 3.6. Available at http://www.python.org Saidi T, Tahri K, Bari N E, Ionescu R and Bouchikhi B (2015) Detection of seasonal allergic rhinitis from
exhaled breath VOCs using an electronic nose based on an array of chemical sensors, 2015 IEEE SENSORS, Busan, 1-4.
Wang S, Ang H M, Tade M O (2007) Volatile organic compounds in indoor environment and photocatalytic oxidation: State of the art. Environ. Int 33(5), 694–705