pollboy landfill facility annual environmental report … · pollboy landfill facility annual...
TRANSCRIPT
Ballinasloe Town Council Comhairle Bhaile Béal Atha na Slua
POLLBOY LANDFILL FACILITY
ANNUAL ENVIRONMENTAL REPORT FOR 2009
January 2010 Kevin Mulrennan Environment Section
Galway County Council

•

Pollboy Landfill - W0027-02 AER 2009
• • i
TABLE OF CONTENTS
1 REPORTING PERIOD ............................................................................................................. 1 2 SITE DEVELOPMENT WORKS .............................................................................................. 1
2.1 PROPOSED DEVELOPMENT WORKS........................................................................... 1 3 WASTE ACTIVITIES CARRIED OUT AT THE FACILITY ...................................................... 1 4 QUANTITY AND COMPOSITION OF WASTE ....................................................................... 2 5 SUMMARY OF EMISSIONS AND MONITORING .................................................................. 4
5.1 NOISE ............................................................................................................................... 4 5.2 DUST................................................................................................................................. 4 5.3 LANDFILL GAS................................................................................................................. 4 5.4 LEACHATE ....................................................................................................................... 5 5.5 SURFACE WATER ........................................................................................................... 5 5.6 GROUNDWATER ............................................................................................................. 7 5.7 METEOROLOGICAL DATA.............................................................................................. 9
6 RESOURCE AND ENERGY CONSUMPTION SUMMARY .................................................... 9 7 LEACHATE VOLUMES PRODUCED AND TRANSPORTED OFF SITE............................... 9 8 REPORT ON RESTORATION OF COMPLETED CELLS AND FINAL LEVELS .................. 9 9 SITE SURVEY........................................................................................................................ 10 10 QUANTITY OF LANDFILL GAS ........................................................................................ 10 11 WATER BALANCE CALCULATION................................................................................. 13 12 ENVIRONMENTAL MANAGEMENT ................................................................................. 14
12.1 REVIEW OF OBJECTIVES AND TARGETS set out FOR 2009................................. 14 12.2 SCHEDULE OF OBJECTIVES AND TARGETS FOR 2010 ....................................... 15
13 SUMMARIES OF REPORTED INCIDENTS & COMPLAINTS.......................................... 17 14 REVIEW OF NUISANCE CONTROLS............................................................................... 17
14.1 ODOUR ....................................................................................................................... 17 14.2 VERMIN....................................................................................................................... 17 14.3 FIRES .......................................................................................................................... 18
15 REPORT ON FINANCIAL PROVISIONS .......................................................................... 18 16 MANAGEMENT STRUCTURE .......................................................................................... 18 17 PROGRAMME FOR PUBLIC INFORMATION .................................................................. 18
LIST OF FIGURES
Figure 5.1 Ammonia Levels in Surface Water for the Reporting Period (SW1, SW3-SW8).............................................. …….Error! Bookmark not defined.
Figure 5.2 Ammonia Levels in Surface Water for the Reporting Period………….8
Figure 5.3: Total Bulk Landfill Gas 1998 to 2035 at the 50th Percentile ..................10
Figure 5.4: Estimation of Landfill Gas Potential using Rule of Thumb Method, 1998-2015 .......................................................................................................11
Figure 5.5: Estimated Rates of Landfill Gas Generation at Pollboy Landfill ...........12
Pollboy Landfill - W0027-02 AER 2009
• • ii
LIST OF TABLES
Table 4.1: Waste Categories and Quantities to be Accepted for Recovery...............2
Table 4.2: Waste Removed from Civic Waste Facility for Recovery for 2009 ...........2
Table 4.3: Quantity of Leachate Discharged via Rising Main to WWTP ....................9
LIST OF APPENDICES
Appendix 1: Drawing of Location of Gas Migration Boreholes and Landfill Gas
Emissions from Boreholes
Appendix 2: Drawing of Leachate Monitoring Points
Appendix 3: Drawing of Surface Water Monitoring Points
Appendix 4: Drawing of Groundwater Monitoring Boreholes
Appendix 5: Quarterly Monitoring Results for Leachate, Surface water and Groundwater
Appendix 6: Meteorological Data
Appendix 7: Water Balance Calculation
Appendix 8: Topographical Survey

Pollboy Landfill - W0027-02 AER 2009
•
• 1
1 REPORTING PERIOD
The reporting period is from the 1st January 2009 to the 31st December 2009
The Waste Licence for this site for the period 1st January 2009 to 31st December 2009
was Waste Licence Reg. No. W0027-02. This landfill facility closed for acceptance of
waste on 31st December 2005.
2 SITE DEVELOPMENT WORKS
2.1 PROPOSED DEVELOPMENT WORKS
The following works are proposed for 2010:
• Landfill and civic amenity facility landscaping works in accordance with
Landscaping Specification
• Leachate Storage: Address the recommendations of the “Review and upgrading
of Leachate Management Report (October 2008)” with regard to upgrading the
leachate telemetry system and the provision of additional leachate storage
capacity at the landfill.
3 WASTE ACTIVITIES CARRIED OUT AT THE FACILITY
Licensed Waste Disposal and Recovery Activities were carried out in accordance with
the Third and Fourth Schedules of the Waste Management Act 1996 as per Part 1
Licensed Activities of Waste Licence W0027-02. The facility accepts waste on Tuesdays,
Thursdays and Saturdays between 8.30am and 4.30pm.

Pollboy Landfill - W0027-02 AER 2009
•
• 2
4 QUANTITY AND COMPOSITION OF WASTE
Tables 4.1 below outlines the categories and quantities which may be accepted for
disposal and for recovery under Waste Licence W0027-02.
Table 4.1: Waste Categories and Quantities to be Accepted for Recovery Waste Type Maximum Quantity Waste to be accepted for composting
Waste to be accepted at Civic Waste
Facility (Metal, electrical and electronic
waste, glass, aluminium and tin cans,
waste oils, fabrics, batteries, household
hazardous, fluorescent tubes can all be
accepted)
Maximum Quantity of biodegradable waste
which can be processed = 1,000m3
Tonnage to be agreed with the Agency.
Table 4.2 provides details on the quantity and composition of waste that was accepted
for recovery in 2009 at Pollboy Landfill Civic Amenity Facility.
Table 4.2: Waste Accepted at Civic Waste Facility for Recovery in 2009 EWC Code Quantity
(tonnes) Description of waste Hazardous
waste. Y/N Waste
Treatment Operation
15 01 07 11.76 Glass Bottles and Jars N R13
20 01 02 6.82 Flat Glass N R13
15 01 04 1.12 Steel Cans N R13
20 01 40 69.94 Household Scrap Metal N R13
20 01 10 2.20 Clothes N R13
20 01 33 1.117 Small Batteries Y R6
16 06 01 8.674 Lead Acid Batteries Y R6
16 01 07 0.28 Oil Filters Y R12
20 01 27 8.747 Waste Paint Y D10
20 01 23 26.158 Fridges and Freezers Y R4
20 01 36 77.292
White Goods (Electrical and Electronic) N R4

Pollboy Landfill - W0027-02 AER 2009
•
• 3
EWC Code Quantity (tonnes)
Description of waste Hazardous waste. Y/N
Waste Treatment Operation
20 01 35 22.152 Televisions and PC Monitors Y R4
20 01 21 0.309 Fluorescent Tubes and Lighting Y D10
20 01 99 63.777
White Goods incl. washing machines, dryers, toasters, radios etc. N R4
13 07 03 0.414 Waste Oil Y R9
16 05 04 0.255
Waste aerosols/aerosol product Y D10

Pollboy Landfill - W0027-02 AER 2009
•
• 4
5 SUMMARY OF EMISSIONS AND MONITORING
Quarterly monitoring results for leachate, groundwater and surfacewater are contained in
Appendix 5. A summary of emissions and monitoring during 2009 in accordance with the
Waste licence is provided in the following sections.
5.1 NOISE
There were no noise surveys carried out during 2009, due to the closure of the landfill on
the 31st December 2005. Noise was generated in the most part by compaction and
placement machinery which are no longer operational.
5.2 DUST
There were no dust surveys carried out during the course of the year, due to the closure
of the landfill on the 31st December 2005.
5.3 LANDFILL GAS
5.3.1 Off Site Gas Migration
Migratory Boreholes
Appendix 1 (Drawing No. DG0001–04 F07) shows the locations of boreholes used to
monitor off-site gas migration as well as the results obtained for gas emissions from
these boreholes during 2009.
The emission limit values for off-site gas migration in Waste Licence W0027-02 Schedule
C are 20% LEL (1% v/v) for methane and 1.5% v/v for carbon dioxide. Appendix 1
shows that all the results obtained for monitoring of off-site gas migration were within
these emission limit values for methane and carbon dioxide.
5.3.2 Buildings
In November 2003 a gas monitor was placed in the main control office of the
administration building at the landfill which measures the concentration of methane and
carbon dioxide in the air. Neither of these parameters were detected during the reporting
period.

Pollboy Landfill - W0027-02 AER 2009
•
• 5
5.2.3 Flare Emissions
No flare emissions monitoring was carried out during 2009.
5.4 LEACHATE
In 2009 three leachate sampling points were used for monitoring purposes; L14, CH1
and the leachate lagoon. In the second quarter a full suite of parameters was tested for
at all three sampling points.
The samples taken at all leachate sample points were within the requirements as set out
in Schedule C.5. of the Waste Licence W0027-02, with the exception of COD levels
recorded at CH1 in Q3 of 2009 The level recorded here was 5,040 mg/l O2 which
exceeded the limit as set out under schedule C.5 of 3,000 mg/l O2 . However, the level
recorded in the lagoon was only 462 mg/l O2 . The level recorded in CH1 in Q4 of 2009
was 2125 mg/l O2 which were within the requirements as set out in Schedule C.5. of the
Waste Licence W0027-02.
Appendix 2 shows the location of these sampling locations on drawing DG0001-07 F08.
5.5 SURFACE WATER
Appendix 3 (Drawing No. DG0001–05 F02) shows the positions of the seven surface
water sampling locations (SW1, SW3 – SW7, SW8). These sampling points were
chemically analysed by the EPA in each quarter of 2009. It should be noted that SW8
was not sampled in Q4 and SW7 was not sampled in Q1, Q2, Q3 and Q4.
During 2009 surface water samples could not be taken at location SW7 as this location
had very little flow / was flooded due to a blocked drain as a result of the N6 roadworks.
This monitoring location is behind the civic amenity site. This drain is now unblocked and
flowing freely.
The highest results achieved for ammonia, during 2009, were at SW1 and SW6 which
are both located downstream of the landfill. The water quality at these locations is
comparable with A2 quality waters under the surface water regulations, 1989. The
remaining monitoring locations all showed very low concentrations of ammonia for all
sampling periods.

Pollboy Landfill - W0027-02 AER 2009
•
• 6
These samples were analysed for metals and volatile organic carbons (voc’s) on one
sampling occasion. SW1, SW4, SW5 and SW8 exceeded the limit set out for iron in S.I.
278 of 2007. SW1 and SW8 exceeded the limit set out for manganese in S.I. 278 of
2007. SW5 and SW8 exceeded the limit set out for copper in S.I. 278 of 2007. These
results can be explained because of the sample points close proximity to the waste
mass.
Ammonia (mg/l N) recorded for surface water samples
taken at Pollboy landfill during 2009 Monitoring Location Date
1st Quarter 2nd Quarter 3rd Quarter 4th Quarter
SW1 0.32 2.1 0.03 1.6
SW3 0.06 0.04 0.03 0.04
SW4 0.05 0.03 0.03 0.04
SW5 0.06 0.03 0.03 0.05
SW6 0.86 0.29 0.03 0.62
SW7
SW8 0.11 0.13 0.27
Figure 5.1 shows the ammonia levels in the surface water sampling points for 2009

Pollboy Landfill - W0027-02 AER 2009
•
• 7
Surface Water Ammonia 2009
0
0.5
1
1.5
2
2.5
1st Quarter 2nd Quarter 3rd Quarter 4th Quarter
Sampling Period
Co
nc N
H3-N
(m
g/l
)SW1
SW3
SW4
SW5
SW6
SW7
SW8
Figure 5.1
5.6 GROUNDWATER
Appendix 4 (Drawing No. DG0001-01 F08) shows the positions of groundwater sampling
locations. Sampling and analysis was carried out during the year by the EPA.
During 2009 groundwater samples could not be taken at location 8AP due to this
borehole being blocked and MW3 could not be found for Q3 and Q4.
The highest concentration of ammonia in all 4 quarters was achieved at borehole 2AP
which is located in the vicinity of the landfill. Elevated results for ammonia were also
reached at MW1, MW6 and RC3. MW6 and RC3 are also located in the vicinity of the
landfill. MW1 is located upstream of the landfill and the high result for ammonia may be
due to other sources than the closed landfill. The concentrations of ammonia at all
remaining boreholes are significantly reduced but are still above that expected of clean
drinking water.
These samples were analysed for metals and volatile organic carbons (voc’s) on one
sampling occasion. The results showed elevated concentrations of iron, zinc and copper
at all locations especially at MW6. The results showed elevated concentrations of
manganese at all locations except at RC2. The results showed elevated concentrations
of iron at all locations especially at MW6.

Pollboy Landfill - W0027-02 AER 2009
•
• 8
Overall the results show that there is still some level of localised pollution at this landfill.
Ammonia (mg/l N) recorded for groundwater samples
taken at Pollboy landfill during 2009 Monitoring Location Date
1st Quarter 2nd Quarter 3rd Quarter 4th Quarter
MW1 7.3 7.3 6.9 7.8
MW2 0.14 2 0.91 0.76
MW3 3.3 3.5
MW6 8.1 8 7.8 7.9
8A 1.4 1.3 4.1 14
8AP
RC2 1.3 1.4 0.97 1.8
RC3 7.9 9.2 8.2 8.4
2AP 24 19 18 13
Groundwater Ammonia Concentrations 2009
0
5
10
15
20
25
30
1st Quarter 2nd Quarter 3rd Quarter 4th Quarter
Sampling Period
Co
nc N
H3
-N (
mg
/l) MW1
MW2
MW3
MW6
8A
8AP
RC2
RC3
2AP
Figure 5.2
Pollboy Landfill - W0027-02 AER 2009
•
• 9
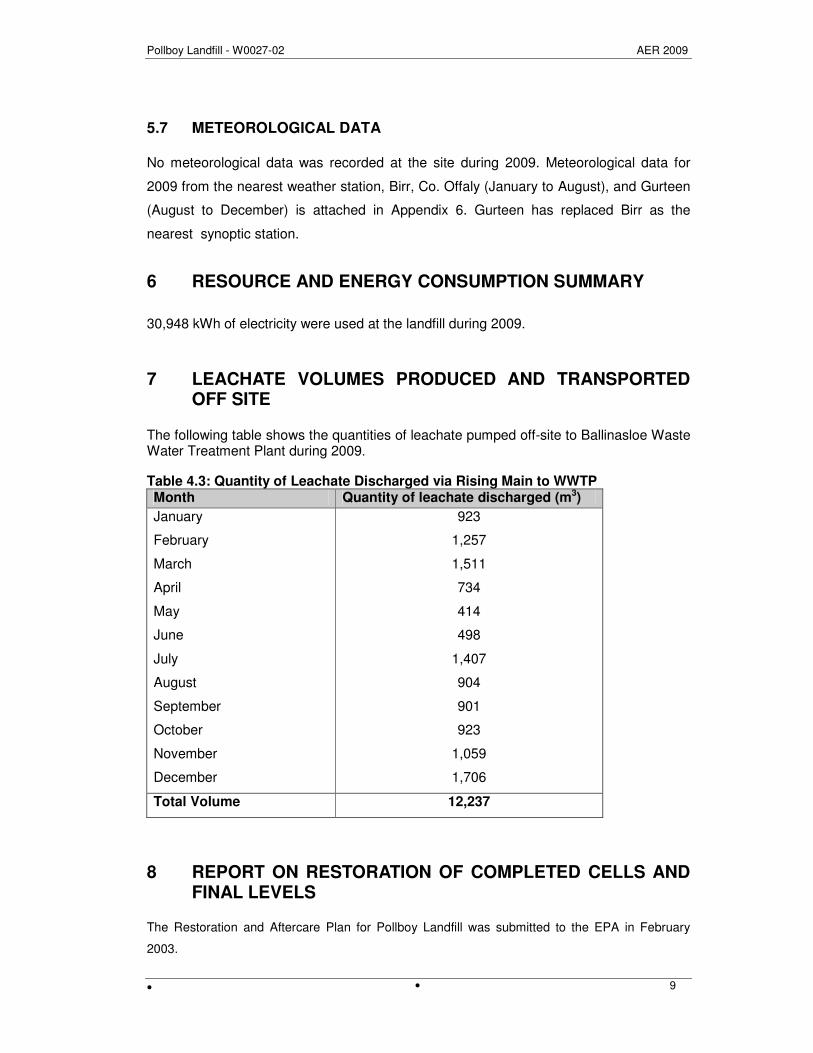
5.7 METEOROLOGICAL DATA
No meteorological data was recorded at the site during 2009. Meteorological data for
2009 from the nearest weather station, Birr, Co. Offaly (January to August), and Gurteen
(August to December) is attached in Appendix 6. Gurteen has replaced Birr as the
nearest synoptic station.
6 RESOURCE AND ENERGY CONSUMPTION SUMMARY
30,948 kWh of electricity were used at the landfill during 2009.
7 LEACHATE VOLUMES PRODUCED AND TRANSPORTED OFF SITE
The following table shows the quantities of leachate pumped off-site to Ballinasloe Waste Water Treatment Plant during 2009.
Table 4.3: Quantity of Leachate Discharged via Rising Main to WWTP Month Quantity of leachate discharged (m3)
January
February
March
April
May
June
July
August
September
October
November
December
923
1,257
1,511
734
414
498
1,407
904
901
923
1,059
1,706
Total Volume 12,237
8 REPORT ON RESTORATION OF COMPLETED CELLS AND FINAL LEVELS
The Restoration and Aftercare Plan for Pollboy Landfill was submitted to the EPA in February
2003.

Pollboy Landfill - W0027-02 AER 2009
•
• 10
9 SITE SURVEY
The most recent topographical survey, which is contained in Appendix 8, was carried out
in October 2009.
10 QUANTITY OF LANDFILL GAS
A Gas Utilisation Feasibility Study for Pollboy Landfill was prepared in August 2005. As
part of this study the total quantity of landfill gas generated was estimated using the
GasSim Model. For comparison purposes, an estimate was also made using the “Rule of
Thumb” method contained in the EPA Landfill Site Design Manual. This assumes that a
tonne of waste produces 6m3 of landfill gas per year from the time of emplacement.
Results are shown in Figures 10.1 and 10.2, for each modelling exercise.
Figure 5.3: Total Bulk Landfill Gas 1998 to 2035 at the 50th Percentile
To ta l L FG
Y ea r
2 0 3 420 3 220 3 02 02 82 0 262 0 2 420 2 220 2 02 01 82 0 162 0 1 42 0 1 220 1 02 00 82 0 062 0 0 42 0 0 220 0 01 99 8
Gas G
enera
ted (
m3/h
r)
8 0 0
7 5 0
7 0 0
6 5 0
6 0 0
5 5 0
5 0 0
4 5 0
4 0 0
3 5 0
3 0 0
2 5 0
2 0 0
1 5 0
1 0 0
5 0
0
Pollboy Landfill - W0027-02 AER 2009
•
• 11
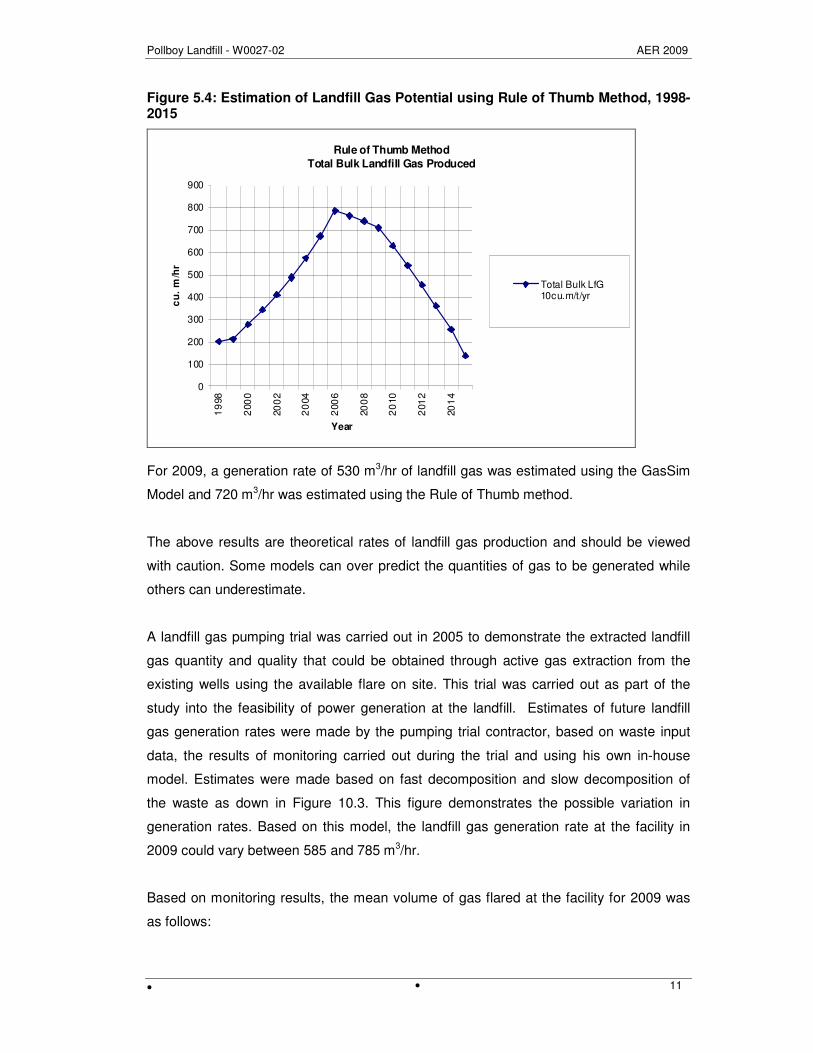
Figure 5.4: Estimation of Landfill Gas Potential using Rule of Thumb Method, 1998-2015
Rule of Thumb Method
Total Bulk Landfill Gas Produced
0
100
200
300
400
500
600
700
800
900
19
98
200
0
20
02
20
04
200
6
20
08
20
10
201
2
20
14
Year
cu
. m
/hr
Total Bulk LfG10cu.m/t/yr
For 2009, a generation rate of 530 m3/hr of landfill gas was estimated using the GasSim
Model and 720 m3/hr was estimated using the Rule of Thumb method.
The above results are theoretical rates of landfill gas production and should be viewed
with caution. Some models can over predict the quantities of gas to be generated while
others can underestimate.
A landfill gas pumping trial was carried out in 2005 to demonstrate the extracted landfill
gas quantity and quality that could be obtained through active gas extraction from the
existing wells using the available flare on site. This trial was carried out as part of the
study into the feasibility of power generation at the landfill. Estimates of future landfill
gas generation rates were made by the pumping trial contractor, based on waste input
data, the results of monitoring carried out during the trial and using his own in-house
model. Estimates were made based on fast decomposition and slow decomposition of
the waste as down in Figure 10.3. This figure demonstrates the possible variation in
generation rates. Based on this model, the landfill gas generation rate at the facility in
2009 could vary between 585 and 785 m3/hr.
Based on monitoring results, the mean volume of gas flared at the facility for 2009 was
as follows:

Pollboy Landfill - W0027-02 AER 2009
•
• 12
• 292m3/hr in the old landfill cell
• 301m3/hr in Cell 1
Figure 5.5: Estimated Rates of Landfill Gas Generation at Pollboy Landfill
Estimated Rates of Landfill Gas Generation at Pollboy
Landfill
0
200
400
600
800
1000
1200
1400
1600
2000
2002
2004
2006
2008
2010
2012
2014
2016
2018
2020
2022
2024
Year
Bu
lk L
FG
Ge
ne
rati
on
(m
3/h
r)
Fast decomposition
Slow decomposition
Actual 2006 Gas Average(1217m3/hr)
Actual 2009 Gas Flaring Rate = 593m
3/hr

Pollboy Landfill - W0027-02 AER 2009
•
• 13
11 WATER BALANCE CALCULATION
Factors which affect the rate of generation of leachate include precipitation, surface run-
off, evapotranspiration, moisture released and absorbed in waste, moisture used during
decomposition and vapour contained in gas. Of these, precipitation, surface run-off and
evapotranspiration are the major contributors.
The model of the water balance for leachate generation can be represented
mathematically as follows:
Lo =[(ER.A)+LIW+IR]-[aW+MCW]
where:
Lo = Free leachate produced
ER = Effective rainfall i.e. actual rainfall minus [potential evapotranspiration plus
soil moisture deficit]
A = Area of cell
LIW = Liquid Industrial Waste (e.g. sludge)
IR = Infiltration (from restored areas only)
aW = Absorption capacity of waste
MCW = Moisture Consumption of Waste
For the purposes of this estimation, the contributions due to Liquid Industrial Waste,
Absorption Capacity of Waste and the Moisture Consumption of Waste have been
ignored.
Capping of a landfill typically reduces rainwater infiltration into the waste by up to 90%.
For the purposes of this estimation, a reduction of 85% has been assumed. Based on an
annual precipitation of 923mm/year and an annual evapotranspiration of 454mm/year,
leachate generation from the landfill was estimated for the current landfill scenario of old
landfill (unlined) and Phase 1(lined) cells – both are capped.
The Water Balance Calculation is contained in Appendix 7.

Pollboy Landfill - W0027-02 AER 2009
•
• 14
12 ENVIRONMENTAL MANAGEMENT
12.1 REVIEW OF OBJECTIVES AND TARGETS SET OUT FOR 2009
Objective 1: Restoration and Aftercare of the Landfill (Landscaping)
Reason for Undertaking Project: To protect the surrounding environment and
integrate the site with the surrounding landscape.
Target: To complete landscaping works in accordance with Restoration Plan
Responsibility: Ballinasloe Town Council was responsible for the implementation of this
project.
Progress: A landscaping specification was prepared in October 2008.
Landscaping/planting is proposed to be carried out in Spring 2010.
Objective 2: Landfill Gas Management
Reason for undertaking project: To further improve landfill gas and odour control at the
facility.
Target: To install / replace redundant landfill gas boreholes where required
Summary: Wells providing low/no gas to the system will be disconnected and new wells
will be installed.
Responsibility: The Landfill Facility Manager is responsible for the implementation of
this project.
Progress: No new gas wells were installed during the year.

Pollboy Landfill - W0027-02 AER 2009
•
• 15
12.2 SCHEDULE OF OBJECTIVES AND TARGETS FOR 2010
Objective 1: Restoration and Aftercare of the Landfill
Reason for Undertaking Project: To protect the surrounding environment and integrate
the site with the surrounding landscape.
Target: To ensure completion of topsoiling and landscaping works
Responsibility: Ballinasloe Town Council is responsible for the implementation of this
project.
Timescale: The topsoiling and landscaping works will be carried out in Spring/early
Summer to coincide with the best season for planting
Objective 2: Landfill Gas Management
Reason for undertaking project: To further improve landfill gas and odour control at the
facility.
Target: To install / replace redundant landfill gas boreholes where required
Summary: Wells providing low/no gas to the system will be disconnected and new wells
will be installed.
Responsibility: The Landfill Facility Manager is responsible for the implementation of
this project.
Timescale: The installation of new gas wells will be carried out during the year as the
need for additional wells is identified.

Pollboy Landfill - W0027-02 AER 2009
•
• 16
Objective 3: Leachate Management Upgrade
Reason for undertaking project: To improve the efficiency of leachate management
Target: Carry out extensive leachate sampling, explore additional storage capacity
options and upgrade telemetry system to reduce pumping, operational and staff overtime
costs
Summary:
1) Leachate Sampling
Extensive sampling of leachate from CH1, CH2, CH6 and the leachate lagoon
was undertaken throughout the Summer of 2009. WWTP influent and effluent
was to be carried out in November 2009 in order to provide an accurate
picture of leachate loadings to the plant and their impact on the WWTP’s
treatment process. This sampling was delayed before Christmas due to
severe flooding but was begun in January 2010. This sampling is required for
the treatment process modelling at the WWTP. This process is necessary to
determine the optimum treatment regime and to allow recommendations to be
made with regard to additional storage and pre-treatment options.
2) Additional Leachate Storage
Additional leachate storage is required for the contaminated groundwater
currently being collected and pumped from the leachate interceptor drain
around the perimeter of the old landfill cell.
Options for providing additional leachate storage capacity at the landfill to be
explored.
3) Telemetry
Existing telemetry system to be upgraded to reduce pumping, operational and
staff overtime costs.

Pollboy Landfill - W0027-02 AER 2009
•
• 17
Responsibility: The Landfill Facility Manager is responsible for the implementation of
this project.
Timescale: Leachate sampling at the lagoon was carried out during April – September
2009. Additional sampling at the WWTP was delayed before Christmas due to flooding
but was begun in January 2010. Treatment Process modelling at the WWTP will begin in
February 2010 and will take approximately three weeks to complete. Proposals for
telemetry upgrade and additional storage to be based on these sampling results and
treatment process modelling.
13 SUMMARIES OF REPORTED INCIDENTS & COMPLAINTS
There were no complaints registered with the landfill in 2009. All incidents at the landfill
concerned emission limit exceedences which are summarised in Section 5.
14 REVIEW OF NUISANCE CONTROLS
14.1 ODOUR
Odour management at the facility has significantly improved since 2005, as a result of
the following works being carried out:
• Installation of temporary clay capping immediately following cessation of filling.
• Installation of permanent capping system incorporating, inter alia, an LLDPE
membrane and landfill gas drainage geocomposite layer.
• Installation of additional landfill gas collection wells in Cell 1.
• Use of two flares for gas management and control.
• Reinstatement of gas management system on old landfill.
14.2 VERMIN
ISS (Pest Control), Letterkenny are contracted to control the vermin on the site. ISS carry
out a program of monitoring and control at the facility. External bait boxes are located
around the facility and internal bait boxes are located in the office buildings. The bait
boxes are checked on a six weekly basis and more frequently when required.
Pollboy Landfill - W0027-02 AER 2009
•
• 18
14.3 FIRES
An Emergency Response Procedure has been prepared in consultation with the
Assistant Chief Fire Officer and approved by the EPA. A risk assessment of
environmental pollution caused by contaminated firewater has been carried out. Fire
safety and awareness, fire fighting and first aid training is provided for staff on site. Any
fires will be treated as an incident and will be reported to the fire station immediately.
15 REPORT ON FINANCIAL PROVISIONS
A total of €18 million (ex. VAT) has been set aside for the 30 year restoration and
aftercare of Pollboy Landfill from 2005 onwards.
Landfill Expenditure in 2009 was €448,159. Operating Costs for the Civic Amenity Facility
in 2009 were €88,864.
16 MANAGEMENT STRUCTURE
The management structure at Pollboy Landfill is as follows:
Ms. Máire Ní Chionna: Senior Engineer, Environment Section, Galway County Council,
with overall responsibility for management of the Pollboy Landfill Facility.
Mr. Kevin Mulrennan:. Kevin Mulrennan, Environment Section, Galway County Council
commenced managing operations at Pollboy landfill in July 2009. Mr. Barry Cormican
was Acting landfill Manager during the first half of the reporting period (Jan-June 2009).
17 PROGRAMME FOR PUBLIC INFORMATION
The Communication Procedure outlines the programme for public information.
All details of the Community Liaison Committee will be provided and kept on file and will
include details of meetings (dates of meetings, actions arising etc.) between the licensee
and representatives of local residents.

Pollboy Landfill - W0027-02 AER 2009
•
• 19
The Council will also ensure that access to environmental information on the landfill
facility will be readily available in accordance with Council Directive 90/313/EEC on
Freedom of Access to Information on the Environment, which came into effect in Ireland
in May 1993.

Pollboy Landfill - W0027-02 AER 2009
•
• 20
Appendix 1 Drawing of Location of Gas Migration Boreholes and Landfill
Gas Emissions from Boreholes

Pollboy Landfill - W0027-02 AER 2009
•
• 21
Appendix 2 Drawing of Leachate Monitoring Points
Pollboy Landfill - W0027-02 AER 2009
•
• 22
Appendix 3 Drawing of Surface Water Monitoring Points

Pollboy Landfill - W0027-02 AER 2009
•
• 23
Appendix 4 Drawing of Groundwater Monitoring Points
Pollboy Landfill - W0027-02 AER 2009
•
• 24
Appendix 5 Quarterly Monitoring Results for Leachate, Surface water and
Groundwater
Pollboy Landfill - W0027-02 AER 2009
•
• 25
First Quarter Results (Q1)

Pollboy Landfill - W0027-02 AER 2009
•
• 26
Second Quarter Results (Q2)
Pollboy Landfill - W0027-02 AER 2009
•
• 27
Third Quarter Results (Q3)

Pollboy Landfill - W0027-02 AER 2009
•
• 28
Fourth Quarter Results (Q4)

Pollboy Landfill - W0027-02 AER 2009
•
• 29
Appendix 6 2009 Meteorological Data from Birr and Gurteen
Weather Station
Pollboy Landfill - W0027-02 AER 2009
•
• 30
Appendix 7 Water Balance Calculation

Pollboy Landfill - W0027-02 AER 2009
•
• 31
Appendix 8 Topographical Survey