amplitude envelope correlations measure synchronous ...amplitude envelope correlations measure...
TRANSCRIPT
Ann. N.Y. Acad. Sci. ISSN 0077-8923
ANNALS OF THE NEW YORK ACADEMY OF SCIENCESSpecial Issue: The Neurosciences and Music VIORIGINAL ARTICLE
Amplitude envelope correlations measure synchronouscortical oscillations in performing musicians
Anna Zamm,1 Stefan Debener,2,3 Anna-Katharina R. Bauer,2 Martin G. Bleichner,2,3
Alexander P. Demos,1 and Caroline Palmer1
1Sequence Production Laboratory, Department of Psychology, McGill University, Montreal, Canada. 2NeuropsychologyLaboratory, European Medical School, Institute for Psychology, University of Oldenburg, Oldenburg, Germany. 3Cluster ofExcellence Hearing4all Oldenburg, University of Oldenburg, Oldenburg, Germany
Address for correspondence: Anna Zamm and Caroline Palmer, Sequence Production Laboratory, Department of Psychology,McGill University, 1205 Docteur Penfield Avenue Montreal, QC, H3A 1B1, Canada. [email protected];[email protected]
A major question facing cognitive neuroscience is measurement of interbrain synchrony between individuals per-forming joint actions. We describe the application of a novel method for measuring musicians’ interbrain synchrony:amplitude envelope correlations (AECs). Amplitude envelopes (AEs) reflect energy fluctuations in cortical oscilla-tions over time; AE correlations measure the degree to which two envelope fluctuations are temporally correlated,such as cortical oscillations arising from two individuals performing a joint action. Wireless electroencephalographywas recorded from two pianists performing a musical duet; an analysis pipeline is described for computing AEs ofcortical oscillations at the duet performance frequency (number of tones produced per second) to test whether theseoscillations reflect the temporal dynamics of partners’ performances. The pianists’ AE correlations were comparedwith correlations based on a distribution of AEs simulated from white noise signals using the same methods. The AEmethod was also applied to the temporal characteristics of the pianists’ performances, to show that the observed pair’sAEs reflect the temporal dynamics of their performance. AE correlations offer a promising approach for assessinginterbrain correspondences in cortical activity associated with performing joint tasks.
Keywords: amplitude envelope; interbrain synchrony; music performance; joint action; temporal coordination
Introduction
Many joint actions, from ensemble music per-formance to team sports, require that multipleindividuals coordinate the timing of actions withone another. Successful joint action coordinationaffords numerous social benefits, such as enhancedaffiliation,1 cooperativity,2 and prosocial behavior3
between group members. Deficits in the ability toachieve successful temporal coordination of jointactions have been observed in individuals withsocial and developmental disorders,4 suggesting aneurobiological link between social behavior and
Alexander P. Demos has changed affiliation since his ini-tial contributions to the current manuscript: Departmentof Psychology, University of Illinois at Chicago, Chicago,Illinois
action coordination. The neurophysiological basesof joint actions are not yet well understood, in partdue to the numerous technical challenges involvedin the simultaneous measurement of brain activityand behavior from multiple individuals.
Recently, a small body of electroencephalogra-phy (EEG) research has emerged that investigatesthe neural correlates of joint action in ensemblemusic performance.5–10 This work focuses on iden-tifying corresponding patterns of cortical activitybetween performing musicians while they synchro-nize their tone onsets. A general finding is thatensemble musicians show interbrain phase coher-ence of cortical oscillations in various frequencybands, such as delta (1–4 Hz) and theta (4–8 Hz).5–7
This work provides evidence that interbrain syn-chronization of cortical oscillations occurs betweenperforming ensemble musicians. Phase coherence
doi: 10.1111/nyas.13738
1Ann. N.Y. Acad. Sci. xxxx (2018) 1–13 C© 2018 New York Academy of Sciences.
Amplitude envelopes measure inter-brain synchrony Zamm et al.
is not the only form of neural synchrony: Corticaloscillations also show synchronous fluctuations ofamplitude, which can occur independent of phasecoherence measures.11 Given that cortical amplitudedynamics are known to be modulated by the tempo-ral dynamics of behavior,12 it is likely that partners injoint tasks such as ensemble music performance alsodisplay interbrain synchrony of amplitude dynam-ics, a prediction that has not been explored.
One approach that measures synchrony of corti-cal oscillations within individuals is amplitude enve-lope correlation (AEC).11,13,14 Amplitude envelopes(AEs)—defined as the absolute value of the Hilberttransform of a given cortical oscillation—reflectenergy fluctuations in an oscillation over time;amplitude is high when energy is high. AECs arecomputed by correlating the amplitude (energy)envelopes of two oscillatory brain signals. HighAEC values indicate synchronous AE fluctuationsbetween oscillations or networks. AECs can detectsynchrony between functional brain networks, bothwithin and across frequency bands, independentof phase coherence.11,13,14 Thus, AECs present apromising metric for assessing interbrain corre-spondences of amplitude dynamics between part-ners in joint action.
We provide the first application of AECs to inter-brain neural dynamics between members of a jointtask: duet piano performance. We measure ampli-tude dynamics of cortical oscillations at pianists’performed musical beat frequency, defined as theduet performance tempo measured in tones per sec-ond. The beat frequency is selected because corticaloscillations typically entrain to the produced beatfrequency during musical rhythm production tasks,such as solo piano performance and rhythmic fin-ger tapping.15–17 AEs of cortical oscillations at thebeat frequency are expected to reflect entrainmentto the temporal structure of duet performances (i.e.,exhibit higher amplitude when pianists producetones at the beat frequency and lower amplitudewhen partners produce tones faster or slower thanthat beat frequency), and that these fluctuations willbe synchronous (correlated) between duet partners.
The implementation of the AE method isdescribed in detail for a case study of two pianistsperforming duets while EEG was recorded wire-lessly. First, each pianist’s multichannel EEG datawas reduced to a single dimension representing cor-tical oscillations at the performed beat frequency.
This was accomplished through application of spa-tial filters created by spatiospectral decomposition(SSD),18,19 a technique for extracting cortical oscil-lations in a given frequency band. Second, AEs ofeach pianist’s dimensionally reduced cortical oscil-lations were computed, and correlations were com-puted between the partner’s AEs. Third, we assessedwhether the AEs of cortical oscillations reflect thetemporal structure of the duet performances by gen-erating a continuous signal from each pianist’s toneonset timing that can be directly correlated withtheir EEG AEs. Fourth, we demonstrate how thetemporal structure captured by AEs is unique tospecific performances of the same melody. Finally,chance estimates of the interbrain AECs and brain–behavior correlations are estimated from compar-isons with simulated pairs. In sum, this methodprovides a new approach for assessing interbraincorrespondences in joint tasks, and for assessinghow intrabrain cortical amplitude dynamics are lin-ked to the temporal structure of duet performance.
Methods
ParticipantsThe methods are applied to music performances bya representative pair of experienced adult pianists,drawn from a larger sample of 40 pianists (seeRef. 15 for further details). The University of Old-enburg and McGill University ethics committeesreviewed the study in which the pianists partici-pated, and participants provided written informedconsent according to the Declaration of Helsinki.Criteria for inclusion in the study were self-reportednormal or corrected to normal vision, no currentpsychiatric or neurological conditions or use ofmedication affecting the central nervous system,right-hand dominance (confirmed using the Edin-burgh handedness inventory20), and normal hear-ing (<20 dB binaurally) for the range of frequenciesused in the stimulus melody (confirmed through apure-tone audiometric screening test).
Stimulus materialsParticipants performed the popular melody FrereJacques (“Brother John”) in duet with a partner; themelody, often performed as a round, was performedin unison (same pitches produced at the same time)as a synchrony task. Participants were instructedto perform with the right hand and suggested fin-gerings were indicated (based on recommendations
2 Ann. N.Y. Acad. Sci. xxxx (2018) 1–13 C© 2018 New York Academy of Sciences.
Zamm et al. Amplitude envelopes measure inter-brain synchrony
of three skilled pianists not in the study) on nota-tion provided to control for possible differences inmotor movements across participants. Participantswere sent the notation prior to the study, so thatthey could learn the melody with the fingerings inadvance of arrival at the laboratory.
EquipmentPerformance recordings. Duet partners per-formed the melody on two Yamaha P35B electronicDC-powered keyboards (Yamaha Corporation,Japan) that stood facing one another in the sameroom. Audio from each keyboard was delivered toparticipants through onboard speakers. Speakervolume was calibrated to equal sound level acrosskeyboards. Musical instrument digital interface(MIDI) timing information associated withkeystrokes was merged from the two keyboardsvia a MIDI–USB merger (Prodipe Corporation,France), and sent as two separate channels (one foreach keyboard) to FTAP software21 running on aLinux (Fedora) operating system computer. TheLinux computer was connected to a network switchbox (TP-Link GmbH, Germany) via Ethernet cable,allowing for data recorded in FTAP to be present onthe local area network (LAN). FTAP was modified toincorporate the Lab Streaming Layer32 (LSL; Kothe,2012, https://github.com/sccn/labstreaminglayer/)library, so that keystroke triggers could be sent as alocal network stream to LSL LabRecorder software(version 1.10), which also recorded EEG data (seebelow). Validation of this method of synchronizingMIDI and EEG data acquisition is described inRef. 15.
EEG recording. EEG data from each partici-pant were recorded with a 24-channel mobileEEG system (SMARTING mBrain Train LLC;http://www.mbraintrain.com/smarting/) attachedto an elastic electrodes cap (www.easycap.de).Electrodes were positioned according to the inter-national 10–20 system, with the reference elec-trode placed at the FCz site and ground electrodeat the AFz site. Electrode impedance was keptbelow 20 kOhms before the recording started. Adigital amplifier (weight = 60 g; size = 82 × 51× 12 mm; resolution = 24 bits; sampling rate =500 Hz) was attached to the back of each partic-ipants’ cap (between electrodes O1 and O2). ABluetooth dongle (BlueSoleil Inc., China) placedon the wall directly behind each participants’ piano
bench received digitized EEG data wirelessly fromthe amplifier. Bluetooth dongles were connectedvia USB extension to Windows 7 computers run-ning SmartingLSL, which collected the data usingthe LSL library. SmartingLSL sent the data to LSLLabRecorder over the LAN, where MIDI data frompiano keyboards was also recorded.
Task and procedureUpon arrival at the lab, each pianist separately com-pleted a melody memory test to ensure that theycould perform the melody without pitch or rhythmerrors in the absence of music notation; each mem-ber of the duet pair waited outside the testing roomwhile their partner completed the memory test. Thememory test comprised a single performance ofthe melody: Participants were allowed two attemptsat the test. If participants failed after the secondattempt, they and their partner were excluded fromthe study. After the melody memory test, pianistssubsequently completed a solo piano performancetask15 in which they performed the melody at a nat-ural and consistent rate in three trials, where eachtrial comprised four continuous repetitions of themelody (3 trials × 4 continuous repetitions = 12total melody performances). Partners completed thesolo task separately and did not hear one another’sperformances. The goal of the solo task was tocapture the beat frequency at which each partnerperformed the melody for comparison with beat fre-quencies chosen by partners in the subsequent duettask. Furthermore, the solo task provided an inde-pendent EEG data set for generating spatial filtersrepresenting each pianist’s topography of corticaloscillations at the beat frequency of music perfor-mance (see below).
Next, the partners completed the duet perfor-mance task together in which they performed themelody at a pace cued by one of the partners. Therewere two conditions: in the first condition, one part-ner cued the performance pace (Player A condi-tion), and in the second condition, the other partnercued the pace (Player B condition). In each con-dition, the pianist who established the pace wasinstructed to choose a natural and consistent rate, asthey had during the solo performances. Their part-ner was instructed to follow this pace and to syn-chronize their performance with the cueing pianist.The pianist responsible for cueing the pace per-formed the first eight tones of each trial alone to
3Ann. N.Y. Acad. Sci. xxxx (2018) 1–13 C© 2018 New York Academy of Sciences.
Amplitude envelopes measure inter-brain synchrony Zamm et al.
establish the pace, and was joined by their partner inunison on the ninth tone. Each duet condition com-prised six trials: On each trial, partners performedthe melody four times continuously, without stop-ping between repetitions, aiming for a consistentpace across trials. Thus, partners performed the duetmelody 24 times total per condition (6 trials × 4repetitions per trial). Pianists heard full auditoryfeedback from one another during the duet task.EEG was recorded during all piano performances.
Results
Data preprocessingBehavioral data. Because performances withpitch errors often include timing errors,22 analy-ses included only pitch-error-free performances ofthe melody. Of all duet melody repetitions, 97.9%were identified as error free (24 melody repetitionsin the Player A condition, and 23 melody repetitionsin the Player B condition).
EEG artifact correction. Preprocessing of EEGdata was implemented in EEGLAB.23 Independentcomponent analysis (ICA) was used to correct EEGdata for eye movement artifacts. To prepare datafor ICA, data were concatenated across all trials andconditions, filtered between 1 and 40 Hz (Hanningwindowed sinc FIR filter24), epoched into 1 s seg-ments, and pruned for nonstereotypical artifacts.Data were subsequently submitted to ICA, and inde-pendent components representing typical artifactsassociated with lateral movements, eye blinks, andnon-cerebral artefacts were identified and removed.Corrected EEG data were subsequently commonaverage re-referenced.
Calculation of beat frequencies for pianoperformancesThe mean beat frequency (frequency at whichpianists produced each quarter note duration) ofsolo and duet performances was determined byexpressing the mean interonset interval (IOI inmilliseconds) of each melody repetition at thequarter-note level (the most common IOI) in Hertz(1000/IOI, equivalent to number of quarter-notebeats/second). To ensure that this estimate reflectedthe beat frequency, off-beat eighth notes wereremoved prior to IOI calculation, and half-noteswere linearly interpolated. Beat frequency was com-puted over the first 9 s of each melody repetition(based on the duration of one melody repetition in
the fastest performance of the melody in the largersample of pianists from which the current pair wasdrawn) to ensure equivalent trial durations acrossperformances.15 The mean beat frequency, com-puted for the first 9 s and for the entire trial dura-tion, differed by less than 1 ms (mean = 0.023 ms)across the two methods of calculation (maximumdifference = 0.45 ms).
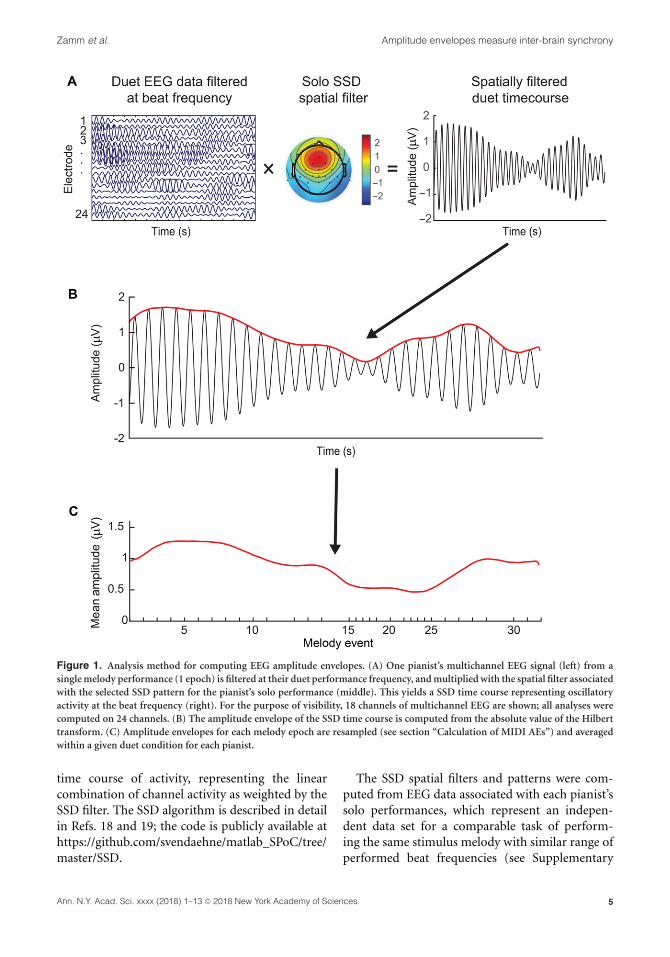
Calculation of EEG AEsThe multistep procedure used to compute AEs ofEEG oscillations is illustrated in Figure 1 for a sam-ple performance and described in detail below.
Dimensionality reduction through spatial filter-ing. First, each pianist’s multichannel EEG datawere reduced to a single dimension using a spatialfilter that represented the unique topographicaldistribution of cortical oscillations at their beatfrequency of performance. Spatial filtering wasimplemented for several reasons: first, spatialfilters generated separately for each pianist takeinto account individual differences in topographyassociated with a given feature of interest—this case,cortical oscillations at each pianist’s performancefrequency; second, adequate spatial filters increasethe signal-to-noise ratio; third, the problem of mul-tiple comparisons is reduced by condensing infor-mation across electrodes into a single dimension.
Dimensionality reduction was achieved usingspatial filters generated by the SSD algorithm.18,19
SSD is a linear decomposition method that extractsa given frequency band of cortical oscillations froman EEG signal by optimizing the signal-to-noiseratio between the frequency band of interest,called the signal band, and neighboring frequencybands, denoted as noise bands.18,19 Other tradi-tional decomposition methods often fail to detectoscillatory source activity because they identifycomponents based on nonnormality (e.g., kurtosis),whereas oscillatory EEG activity is generally closeto Gaussian.25 SSD produces a set of orthogonalcomponents representing oscillatory activity withina frequency band of interest, defined as inputparameters to the algorithm. Each component isassociated with a spatial filter and correspondingspatial pattern that is the inverse of the spatial filter,representing the physiological distribution of agiven component across channels. Spatial filtersobtained from SSD can be multiplied with anyEEG data set to produce a dimensionally reduced
4 Ann. N.Y. Acad. Sci. xxxx (2018) 1–13 C© 2018 New York Academy of Sciences.
Zamm et al. Amplitude envelopes measure inter-brain synchrony
Figure 1. Analysis method for computing EEG amplitude envelopes. (A) One pianist’s multichannel EEG signal (left) from asingle melody performance (1 epoch) is filtered at their duet performance frequency, and multiplied with the spatial filter associatedwith the selected SSD pattern for the pianist’s solo performance (middle). This yields a SSD time course representing oscillatoryactivity at the beat frequency (right). For the purpose of visibility, 18 channels of multichannel EEG are shown; all analyses werecomputed on 24 channels. (B) The amplitude envelope of the SSD time course is computed from the absolute value of the Hilberttransform. (C) Amplitude envelopes for each melody epoch are resampled (see section “Calculation of MIDI AEs”) and averagedwithin a given duet condition for each pianist.
time course of activity, representing the linearcombination of channel activity as weighted by theSSD filter. The SSD algorithm is described in detailin Refs. 18 and 19; the code is publicly available athttps://github.com/svendaehne/matlab_SPoC/tree/master/SSD.
The SSD spatial filters and patterns were com-puted from EEG data associated with each pianist’ssolo performances, which represent an indepen-dent data set for a comparable task of perform-ing the same stimulus melody with similar range ofperformed beat frequencies (see Supplementary
5Ann. N.Y. Acad. Sci. xxxx (2018) 1–13 C© 2018 New York Academy of Sciences.

Amplitude envelopes measure inter-brain synchrony Zamm et al.
Material 1, online only, for validation tests thatshow comparable topography of solo and duet beat-related SSD patterns.)
Each pianist’s solo EEG data, pruned fornon-stereotypical artefacts, were submitted to theSSD algorithm using a signal band of 1.5–3 Hz,corresponding to the range of both solo and duetbeat frequencies, spanning the delta frequencyband (lower noise band = 0.5–1.49 Hz, upper noiseband = 3.51–4.5 Hz). For each participant, the SSDcomponent representing the most stereotypicalsensorimotor delta topography was selected and thecomponents were confirmed by the first and secondauthors. SSD eigenvalues for selected componentswere consistently first or second in the rank orderof components. The grand average selected SSDspatial pattern across participants is shown inFigure 1 (top panel). SSD spatial filters weresubsequently used to dimensionally reduce duetEEG data filtered at the performance frequency.
Frequency filtering and Hilbert envelope cal-culation. Each pianist’s artifact-correctedmultichannel duet EEG data were filtered narrowlyaround the frequency range of their perfor-mance (mean beat frequency ±0.183 Hz, signalbandwidth = 0.366 Hz) using the same frequencyfilter implemented by the SSD algorithm (secondorder Butterworth filter, butterworth.m in MAT-LAB), and multiplied with SSD spatial weightsobtained from solo performances. This multipli-cation procedure yielded a single time course ofcortical oscillations for each pair at their uniqueduet performance frequency, representing a linearcombination of channel activity as weighted by theSSD filter. This time course was subsequently seg-mented into epochs corresponding to the durationof each melody repetition ±2.5 s and downsampledto 100 Hz (antialiasing FIR filter, pop_resample.min EEGLAB) for the efficiency of subsequent calcu-lations, which preserved the temporal resolution.The AE of the EEG signal within each epoch wasthen computed from the absolute value of theHilbert transform of the SSD component timecourse; 2.5-second tails of each epoch were trimmedto avoid ringing artifacts of the Hilbert transform.
Event-based envelope resampling. Musicians donot perform melodies with identical timing acrosstones,26 and the number of EEG samples betweencorresponding melody tones performed by the
pianists therefore differed across the performances;furthermore, the total duration of performances dif-fered. To allow for comparison across performanceswithin each duet condition, each pianist’s AEs wereresampled such that the number of samples betweencorresponding tone events was constant across dif-ferent performances of the stimulus melody in eachcondition. Figure 2 illustrates the timing profile fortwo of the duet performances in terms of IOI devi-ations relative to the notated durations in a musicalscore, measured as performed IOI/categorical IOI(defined as the mean quarter-note duration for thatperformance). As shown in Figure 2, the temporalfluctuations of performances by each pianist dif-fer across the Player A performance example (top)and the Player B performance (bottom), typical ofhuman performances. Values greater than 1 indicateIOIs longer than average, and values less than 1 indi-cate IOIs shorter than average. To address the differ-ent number of EEG samples across performances,first the number of samples between tone onsets wasdetermined by identifying the minimum number ofsamples between tone onsets across melody repe-titions within the given pair/condition: IOIs werethen resampled proportionally to this number ofsamples, such that eighth notes were equal to thisnumber, quarter notes were twice this number, andhalf notes were four times this number. Resamplingbetween each pair of tone onsets was implementedusing shape-preserving piece-wise cubic interpo-lation (interp1.m in MATLAB, using “pchip” and“extrap” arguments), which fits a cubic polynomialbetween each set of interpolation points with thegoal of preserving the original shape of the resam-pled signal. This procedure allowed AEs to be aver-aged across melody repetitions while ensuring thatthe data segments being averaged corresponded tothe same tone onsets.
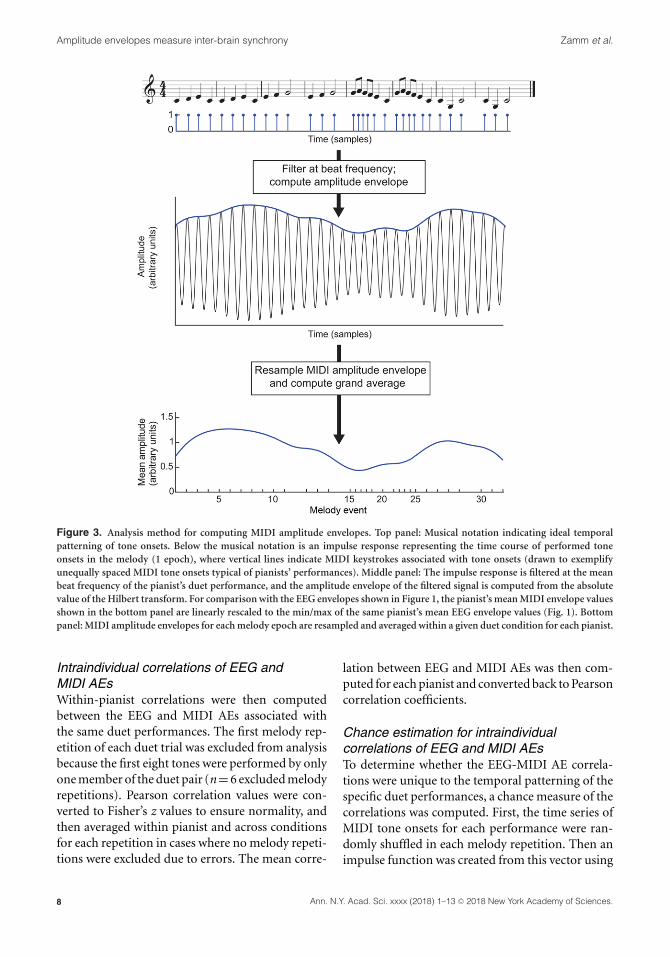
Calculation of MIDI AEsNext, the same method for computing AEs wasapplied to the MIDI piano tone onset data. Thismethod creates a continuous signal that capturesthe temporal patterning of tone onsets that canbe directly compared with EEG AEs, to determinewhether EEG oscillations track the temporal struc-ture of pianists’ performances. First, we computedthe AEs from a series of impulse responses thatrepresented the time course of pianists’ MIDI toneonsets. As illustrated in Figure 3, MIDI tone onset
6 Ann. N.Y. Acad. Sci. xxxx (2018) 1–13 C© 2018 New York Academy of Sciences.

Zamm et al. Amplitude envelopes measure inter-brain synchrony
Figure 2. Temporal variability profiles of IOIs. Temporal variability profile (observed IOI/predicted IOI) for two sample per-formances of the melody; Partner A (solid red), Partner B (dashed blue). Top panel: Player A condition. Bottom panel: Player Bcondition.
times (recorded in milliseconds) were first con-verted to events at the same sampling rate as theEEG data. An impulse function was then createdin which EEG samples within which a tone onsetoccurred were assigned a value of 1 and all othersamples were assigned a value of 0. These MIDIimpulse functions were subsequently concatenatedwith 5 s of zero padding between each melodyrepetition, and were submitted to the same But-terworth filter used on the duet EEG data, witha signal band corresponding to the mean beatfrequency for the given pair/condition ±0.183 Hz(bandwidth = 0.366 Hz). This filter output was acontinuous signal representing the temporal pat-terning of MIDI tone onsets. The AE of this con-tinuous signal, referred to here as a MIDI AE,was then computed using the same procedure asfor the EEG data: The signal was downsampled to
100 Hz (antialiasing FIR filter, pop_resample.m inEEGLAB), and the absolute value of the Hilberttransform was computed for each epoch ±2.5 s;2.5-s tails were subsequently trimmed to removeedge artifacts. The same resampling proceduredescribed in section above was then implemented, topermit averaging of MIDI AEs across melody rep-etitions, while ensuring that data segments beingaveraged were associated with the same tone onsets.As shown in Figure 3 (bottom panel), the MIDI AEsfiltered at the beat frequency reflect how pianistsproduced the musical rhythm: highest amplitudeis observed at the beginning of the melody, whenpianists performed a series of quarter-note events atthe beat frequency, and amplitude decreases in thesecond phrase, containing a series of eighth-noteevents (some of which are associated with the beatfrequency).
7Ann. N.Y. Acad. Sci. xxxx (2018) 1–13 C© 2018 New York Academy of Sciences.
Amplitude envelopes measure inter-brain synchrony Zamm et al.
Figure 3. Analysis method for computing MIDI amplitude envelopes. Top panel: Musical notation indicating ideal temporalpatterning of tone onsets. Below the musical notation is an impulse response representing the time course of performed toneonsets in the melody (1 epoch), where vertical lines indicate MIDI keystrokes associated with tone onsets (drawn to exemplifyunequally spaced MIDI tone onsets typical of pianists’ performances). Middle panel: The impulse response is filtered at the meanbeat frequency of the pianist’s duet performance, and the amplitude envelope of the filtered signal is computed from the absolutevalue of the Hilbert transform. For comparison with the EEG envelopes shown in Figure 1, the pianist’s mean MIDI envelope valuesshown in the bottom panel are linearly rescaled to the min/max of the same pianist’s mean EEG envelope values (Fig. 1). Bottompanel: MIDI amplitude envelopes for each melody epoch are resampled and averaged within a given duet condition for each pianist.
Intraindividual correlations of EEG andMIDI AEsWithin-pianist correlations were then computedbetween the EEG and MIDI AEs associated withthe same duet performances. The first melody rep-etition of each duet trial was excluded from analysisbecause the first eight tones were performed by onlyone member of the duet pair (n = 6 excluded melodyrepetitions). Pearson correlation values were con-verted to Fisher’s z values to ensure normality, andthen averaged within pianist and across conditionsfor each repetition in cases where no melody repeti-tions were excluded due to errors. The mean corre-
lation between EEG and MIDI AEs was then com-puted for each pianist and converted back to Pearsoncorrelation coefficients.
Chance estimation for intraindividualcorrelations of EEG and MIDI AEsTo determine whether the EEG-MIDI AE correla-tions were unique to the temporal patterning of thespecific duet performances, a chance measure of thecorrelations was computed. First, the time series ofMIDI tone onsets for each performance were ran-domly shuffled in each melody repetition. Then animpulse function was created from this vector using
8 Ann. N.Y. Acad. Sci. xxxx (2018) 1–13 C© 2018 New York Academy of Sciences.
Zamm et al. Amplitude envelopes measure inter-brain synchrony
the same method as for the original MIDI perfor-mances, in which samples corresponding to toneonsets were assigned a value of 1 and all other sam-ples assigned a value of 0. This impulse functionwas then submitted to the same procedure used tocompute the Hilbert transform and AE of observedMIDI time series (see above). The resulting AEs ofthe shuffled MIDI performances were then corre-lated with the observed EEG AEs for each melodyrepetition, yielding a chance distribution of 18 val-ues per condition (number of melody repetitionsincluded in the analysis, because first repetition ineach trial was excluded, per section above) for eachpianist. These values were converted to Fisher’s r to zscores to ensure normality, and then converted backto Pearson correlation values. Critically, this chanceestimate method preserves the mean beat durationof the original performance.
Interindividual correlations of EEG AEsInterbrain correlations of partners’ EEG AEs werecomputed to test whether amplitude fluctuations ofoscillations at the beat frequency are time-lockedbetween partners during performance. Specifically,correlations were computed for each melody repeti-tion within each duet condition. For the first melodyrepetition in each trial, correlations were computedover data occurring after the 8th tone (during whichboth partners were performing). Interbrain AECswere subsequently converted using Fisher’s r to zvalues to ensure normality, and averaged across rep-etitions within duet condition. A single correlationvalue representing mean interbrain synchrony ofEEG AEs for the pair, computed across duet condi-tions, was converted back to a Pearson r value.
AEC chance estimates based on white noiseenvelopesTo assess whether observed EEG AE correlation val-ues were higher than would be expected betweentwo stochastic signals of equivalent duration to theobserved data, the observed EEG AECs were com-pared with a chance distribution of correlationsbased on white noise AEs. AEs of white noise signalswere generated with signal duration values and filterfrequency bands that matched the signal durationsand filter frequency bands applied to the obtainedpianists’ data in each duet condition. The whitenoise envelopes were then correlated to create adistribution of chance correlations, for compari-
son with the obtained values (see SupplementaryMaterials, online only, for further details).
Results
MIDI measures of performance tempo andsynchronyMean IOIs, representing the tempo (beat fre-quency), for each pianist during solo performancewere 557.19 ms (the leader in Player A conditioncondition) and 473.64 ms (the leader in Player Bcondition); these values are equivalent to 1.79 Hz(tones per second) and 2.11 Hz, respectively. MeanIOIs during the pair’s duet performances were533.10 ms (leader in Player A condition) and498.74 ms (leader in Player B condition), equiva-lent to 1.88 Hz (Player A condition) and 2.01 Hz(Player B). To confirm that the duet pair success-fully coordinated the timing of tone onsets intendedto be simultaneous, we computed tone onset asyn-chronies over the same 9-s window used to computeIOIs. The mean tone onset asynchrony for the duetpair was=17.80 ms (Player A condition=18.92 ms,Player B condition = 16.60 ms), consistent with therange of tone onset asynchronies reported in previ-ous studies of duet piano performance.27,28
Intraindividual correlation of EEG and MIDIenvelopesFigure 4 shows pianists’ mean EEG and MIDIenvelopes from the Player A condition. As can beobserved, these envelopes showed a similar patternof amplitude fluctuations (see Supporting infor-mation, online only). Correlations between EEGand MIDI envelopes within each pianist’s perfor-mances were compared with chance estimate corre-lations between observed EEG and shuffled MIDIenvelopes. The observed correlation for Pianist Awas higher than 17 of 18 correlations betweenobserved EEG and shuffled MIDI envelopes (bino-mial tests, P < 0.001, observed Pianist A meanr = 0.59; mean chance estimate r = 0.05), andthe observed correlation for Pianist B was higherthan 18 of 18 chance correlations (binomial tests,P < 0.001, observed Pianist B mean r = 0.56, meanchance estimate r = – 0.09). Thus, the binomialtests indicated that the observed brain–behaviorcorrelations for both pianists were significantlyhigher than the chance estimates (see supportinginformation, online only).
9Ann. N.Y. Acad. Sci. xxxx (2018) 1–13 C© 2018 New York Academy of Sciences.

Amplitude envelopes measure inter-brain synchrony Zamm et al.
Figure 4. Comparison of EEG and MIDI amplitude envelopes. Mean EEG (solid red) and MIDI (dashed blue) amplitude envelopes(AEs) for Pianist A (top panel) and Pianist B (bottom panel) in the sample pair across all melody repetitions within the PlayerA duet condition. Each pianist’s MIDI envelope values are linearly scaled to the minimum–maximum of that pianist’s mean EEGenvelope in this figure, for comparison.
Interindividual correlation of EEG envelopesNext, the interbrain AECs were computed by corre-lating the EEG AEs of the two partners within eachmelody repetition and then averaging Fisher’s z val-ues first within duet conditions and then across con-ditions. Finally, the Fisher’s z values were convertedto a Pearson r value; the mean observed correlationwas r = 0.3102 (Fisher’s z = 0.3208). The meanobserved correlation for each duet condition was r= 0.30 for the Player A condition (Fisher’s z = 0.304)and r = 0.325 for the Player B condition (Fisher’s z =0.337). These observed interindividual correlationswere compared with a chance distribution of cor-relations based on white noise AEs, to assesswhether observed correlations were higher thanwould be expected between simulated stochas-tic signals with the equivalent sample durationand sampling rate (see Supplementary Material 3,online only, for full details). The 95th percentile
correlation value from 100 simulations of 24 corre-lations among the white noise AEs (matching the 24observed melody repetitions) were compared withthe observed EEG AECs. Observed mean EEG AECsfor both duet conditions (converted to r values) werehigher than the 95% chance estimates (Player A con-dition: observed r = 0.30, chance r = 0.106; PlayerB: observed r = 0.325, chance r = 0.100). Thus,observed correlations of partners’ beat-related EEGAE fluctuations were higher than would be expectedbetween stochastic signals of equivalent durationprocessed using the same analysis pipeline, indicat-ing that the correlations were not simply a functionof the sampling rate.
Discussion
We described a novel application of AEs for assess-ing temporal fluctuations of beat-related cortical(EEG) oscillations between musicians during duet
10 Ann. N.Y. Acad. Sci. xxxx (2018) 1–13 C© 2018 New York Academy of Sciences.

Zamm et al. Amplitude envelopes measure inter-brain synchrony
performance. To extract cortical oscillations at thebeat frequency of each duet performance, a spa-tial filter procedure (SSD) was first applied,18,19
which allows for identification of spatial weightsrepresenting the topographical distribution of agiven cortical oscillation. EEG data from pianists’solo performances—which represent well-matchedindependent measures to the same pianists’ duetperformances—were used to identify SSD spatialfilters associated with cortical oscillations at thepianists’ beat frequencies, corresponding to tempo.Each pianist’s spatial filters were then applied to theEEG data from their duet performances to extract asingle time course on which the AEs could be com-puted. The mean correlation between partners’ EEGAEs was significantly higher than chance estimatescomputed from simulations of white noise envelopecorrelations. Thus, the current method of AEC pro-vides a promising new measure for assessing syn-chronous cortical oscillations between individualsengaged in joint action.
Correlations among interbrain AEs also allowcomparisons of oscillatory dynamics across peoplewho perform tasks at a range of rates. The samemethodology of aligning data performed at differentrates could be extended across numerous contexts.For example, the AEC method outlined here couldbe used to investigate the neural correlates of gait,in tasks that measure walking at one’s natural fre-quency. Participants’ EEG measures could be sam-pled relative to walking “events” (such as the timingof heel strikes) that permit direct comparison ofinterpersonal synchronization among side-by-sidewalkers.29
This method was also applied to identify brain–behavior correspondences for each pianist by usingAEs to compare EEG oscillations with MIDI-basedtone onset patterns. To generate a continuous mea-sure of each pianist’s tone onset timing, we createdan impulse function representing the time course ofMIDI keystrokes and submitted this impulse func-tion to the same filter methods used for the EEGdata. The AE derived from each pianist’s MIDIkeystroke data was then directly correlated with theAE of each pianist’s cortical oscillations; these val-ues were highly correlated. To confirm that thosecorrelations were a function of the unique temporalpatterning of each pianist’s performed tone onsets,the MIDI keystroke timing in the original perfor-mances were randomly shuffled and then converted
to a continuous signal and re-correlated with thepianist’s original EEG AEs. This chance estimatemethod preserves the mean beat duration of theoriginal performance but alters the temporal pat-terning. The shuffled MIDI signals did not correlatesignificantly with observed EEG AEs for either duetpartner, confirming that the observed EEG–MIDIamplitude envelope correlations for each pianistindeed reflect the unique temporal patterning ofeach pianists’ produced tone onsets.
The proposed method of using AEs to assessboth the temporal structure of music performanceand the temporal structure of neural oscillationsoffers a promising approach to investigating theneural correlates of interpersonal coordination dur-ing joint action. Most measures of interbrain corre-spondences associated with joint action focus onphase synchrony of partners’ cortical oscillations;the proposed methods address amplitude alignment,which can occur independent of phase alignmentand may be particularly useful in cases where mea-surement noise can introduce phase jitter betweenpartners’ EEG measurements in joint action tasks.The methods described here can be extended tomeasure correlations between oscillations at differ-ent frequencies,30 and possibly to assess brain-to-brain cross-frequency coupling.
An important future direction is to establishwhether interbrain correspondences in AE fluctu-ations are correlated with behavioral synchrony ofjoint actions. The duet pair under study was highlysynchronized, with tone onsets occurring within18 ms of each other on average. Future empiricalstudies may recruit duet partners with a wider rangeof synchronization abilities to address the relation-ship between behavioral synchrony and interbraincorrespondences of AE fluctuations. Another criti-cal question is how amplitude fluctuations of cor-tical oscillations are related to other measures ofinterpersonal coordination, such as fluctuations inthe power of beta and alpha oscillations that are typ-ically time-locked to motor initiation.31 The currentstudy provides a set of methods that should facili-tate answers to these fundamental questions on theneural organization of joint action.
Acknowledgments
This research was supported by Erasmus MundusAuditory Cognitive Neuroscience Exchange Fel-lowship and Programme de Bourses d’Excellence
11Ann. N.Y. Acad. Sci. xxxx (2018) 1–13 C© 2018 New York Academy of Sciences.
Amplitude envelopes measure inter-brain synchrony Zamm et al.
pour Etudiants Etrangers (FQRNT) Ph.D. Fellow-ship to A.Z., by NSERC Grant 298173 and a CanadaResearch Chair to C.P., and by Task Group 7 of theOldenburg University Cluster of Excellence Hear-ing4All to S.D. The authors thank Reiner Emkesfor technical assistance, Katharina Grote and FelixFeuerhake for assistance with EEG cap prepara-tion, and Frances Spidle for assistance with figurepreparation.
Supporting information
Additional supporting information may be foundonline in the Supporting Information section at theend of the article.
Figure S1. SSD spatial patterns computed from eachpianist’s Solo (left) and Duet (right) EEG data forPianist A (top) and Pianist B (bottom).
Figure S2. Grand mean amplitude envelope across500 simulated white noise signals.
Competing interests
The authors declare no competing interests.
References
1. Cacioppo, S. & J.T. Cacioppo. 2012. Decoding the invisibleforces of social connections. Front. Integr. Neurosci. 6: 51.
2. Valdesolo, P. & D. DeSteno. 2011. Synchrony and the socialtuning of compassion. Emotion 11: 262–266.
3. Cirelli, L.K., D. Bosnyak, F.C. Manning, et al. 2014. Beat-induced fluctuations in auditory cortical beta-band activity:using EEG to measure age-related changes. Front. Psychol. 5:742.
4. Wimpory, D. 2015. A social timing model of autism,informed by typical development. In Time Distortions inMind: Temporal Processing in Clinical Populations. M. All-man & A. Vatakis, Eds.: 57–92. Leiden: Brill.
5. Lindenberger, U., S.-C. Li, W. Gruber & V. Muller. 2009.Brains swinging in concert: cortical phase synchronizationwhile playing guitar. BMC Neurosci. 10: 22.
6. Sanger, J., V. Muller & U. Lindenberger. 2012. Intra- andinterbrain synchronization and network properties whenplaying guitar in duets. Front. Hum. Neurosci. 6: 312.
7. Sanger, J., V. Muller & U. Lindenberger. 2013. Direction-ality in hyperbrain networks discriminates between lead-ers and followers in guitar duets. Front. Hum. Neurosci. 7:234.
8. Babiloni, F. & L. Astolfi. 2014. Social neuroscience andhyperscanning techniques: past, present and future. Neu-rosci. Biobehav. R. 44: 76–93.
9. Loehr, J.D., D. Kourtis & I.A. Brazil. 2015. It’s not just myfault: neural correlates of feedback processing in solo andjoint action. Biol. Psychol. 111: 1–7.
10. Novembre, G., D. Sammler & P.E. Keller. 2016. Neural alphaoscillations index the balance between self-other integrationand segregation in real-time joint action. Neuropsychologia89: 414–425.
11. Bruns, A., R. Eckhorn, H. Jokeit & A. Ebner. 2000. Ampli-tude envelope correlation detects coupling among incoher-ent brain signals. Neuroreport 11: 1509–1514.
12. Clochon, P., J.M. Fontbonne, N. Lebrun, & P. Etevenon1996. A new method for quantifying 12. EEG event-relateddesynchronization: amplitude envelope analysis. Electroen-cephalogr. Clin. Neurophysiol. 98: 126–129.
13. Doron, K.W., D.S. Bassett & M.S. Gazzaniga. 2012. Dynamicnetwork structure of interhemispheric coordination. Proc.Natl. Acad. Sci. USA 109: 18661–18668.
14. Hipp, J.F., D.J. Hawellek, M. Corbetta, et al. 2012. Large-scale cortical correlation structure of spontaneous oscilla-tory activity. Nat. Neurosci. 15: 884–890.
15. Zamm, A., C. Palmer, A.K.R. Bauer, et al. 2017. Syn-chronizing MIDI and wireless EEG measurements dur-ing natural piano performance. Brain Res. https://doi.org/10.1016/j.brainres.2017.07.001.
16. Nozaradan, S., Y. Zerouali, I. Peretz & A. Mouraux. 2013.Capturing with EEG the neural entrainment and couplingunderlying sensorimotor synchronization to the beat. Cereb.Cortex 25: 736–747.
17. Nozaradan, S., I. Peretz & P.E. Keller. 2016. Individual differ-ences in rhythmic cortical entrainment correlate with pre-dictive behavior in sensorimotor synchronization. Sci. Rep.6. https://doi.org/10.1038/srep20612.
18. Dahne, S., V.V. Nikulin, D. Ramirez, et al. 2014. Finding brainoscillations with power dependencies in neuroimaging data.NeuroImage 96: 334–348.
19. Nikulin, V.V., G. Nolte & G. Curio. 2011. A novel methodfor reliable and fast extraction of neuronal EEG/MEGoscillations on the basis of spatio-spectral decomposition.NeuroImage 55: 1528–1535.
20. Oldfield, R.C. 1971. The assessment and analysis of hand-edness: the Edinburgh inventory. Neuropsychologia 9: 97–113.
21. Finney, S.A. 2001. FTAP: a linux-based program for tappingand music experiments. Behav. Res. Methods 33: 65–72.
22. Drake, C., & C. Palmer. 2000. Skill acquisition in music per-formance: relations between planning and temporal control.Cognition 74: 1–32.
23. Delorme, A. & S. Makeig. 2004. EEGLAB: an open sourcetoolbox for analysis of single-trial EEG dynamics includingindependent component analysis. J. Neurosci. Methods 134:9–21.
24. Widmann, A., & E. Schroger. 2012. Filter effects and filterartifacts in the analysis of electrophysiological data. Front.Psychol. 3: 233.
25. Hyvarinen, A., P. Ramkumar, L. Parkkonen, & R. Hari. 2010.Independent component analysis of short-time Fouriertransforms for spontaneous EEG/MEG analysis. NeuroIm-age 49: 257–271.
26. Palmer, C. 1997. Music performance. Ann. Rev. Psychol. 48:115–138.
27. Loehr, J.D. & C. Palmer. 2011. Temporal coordinationbetween performing musicians. Q. J. Exp. Psychol. 64: 2153–2167.
12 Ann. N.Y. Acad. Sci. xxxx (2018) 1–13 C© 2018 New York Academy of Sciences.

Zamm et al. Amplitude envelopes measure inter-brain synchrony
28. Zamm, A., P.Q. Pfordresher & C. Palmer. 2015. Temporalcoordination in joint music performance: effects of endoge-nous rhythms and auditory feedback. Exp. Brain Res. 233:607–615.
29. Nessler, J.A., & S.J. Gillibrand. 2009. Interpersonal synchro-nization during side by side treadmill walking is influencedby leg length differential and altered sensory feedback. Hum.Mov. Sci. 6: 772–785.
30. Canolty, R.T., & R.T. Knight. 2010. The functional roleof cross-frequency coupling. Trends Cogn. Sci. 14: 506–515.
31. Cheyne, D.O. 2013. MEG studies of sensorimotor rhythms:a review. Exp. Neurol. 245: 27–39.
32. Kothe, C. 2012. Lab Streaming Layer (lsl). Last accessed:April 26, 2018. https://github.com/sccn/labstreaminglayer/.
13Ann. N.Y. Acad. Sci. xxxx (2018) 1–13 C© 2018 New York Academy of Sciences.