amputation level determination in the dysvascular...
TRANSCRIPT
Amputation Level Determination in the Dysvascular Patient
Clinical Approach and Current Research
Joseph M. Czerniecki, MDProfessor of RehabilitationUniversity of Washington
Associate DirectorRehabilitation Research Center of Excellence
Limb Loss Prevention and Prosthetic Engineering
Amputation Level Determination in the Dysvascular Patient
• How are decisions currently being made about choosing amputation level in the dysvascularpatient.
• What are the limitations.
• What is the role of the physiatrist in decision making.
• How we might do a better job.
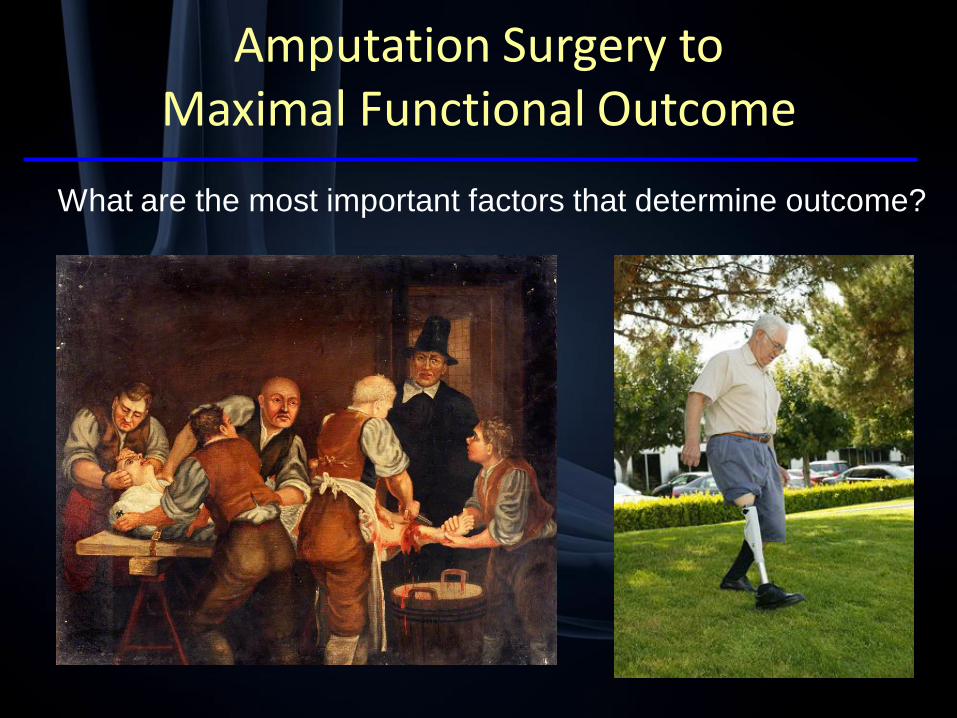
Amputation Surgery to Maximal Functional Outcome
What are the most important factors that determine outcome?

General Model of Functional Recovery after Illness or Injury
Time
Onset of Injury
Onset of Recovery
Maximal Functional
Restoration
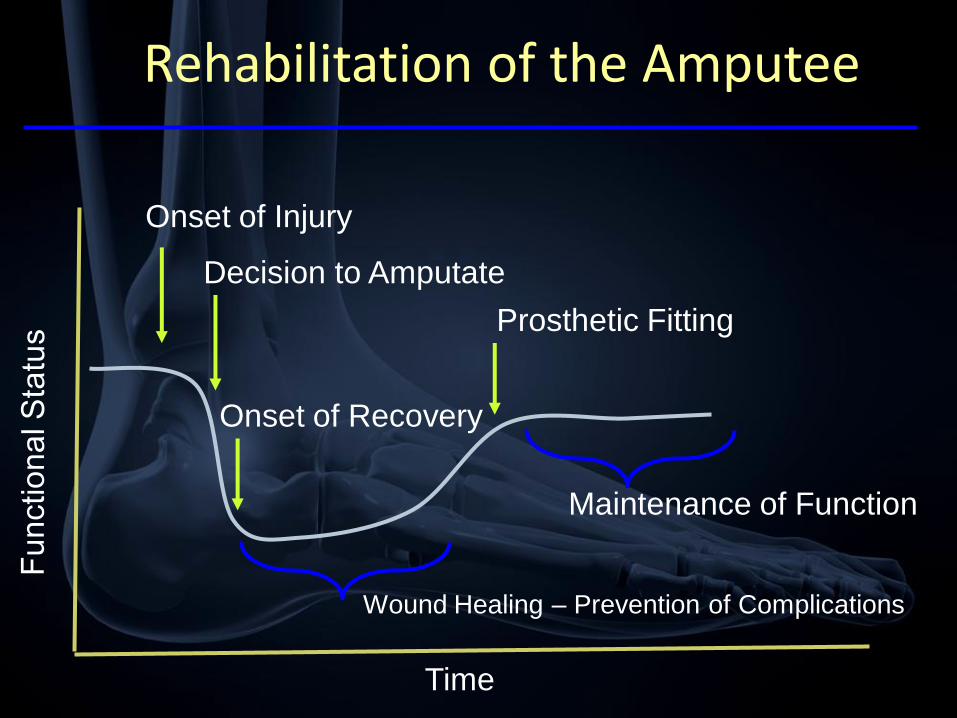
Rehabilitation of the Amputee
Time
Onset of Injury
Decision to Amputate
Prosthetic Fitting
Maintenance of Function
Onset of Recovery
Wound Healing – Prevention of Complications


When to Amputate? Where to Amputate?
Time
- Ulceration
- Revascularization surgery
- Frequent Clinic visits
- Hospital admission
- Muscle atrophy / joint contracture
- Reduced cardiopulmonary reserve
- Reduction in mobility
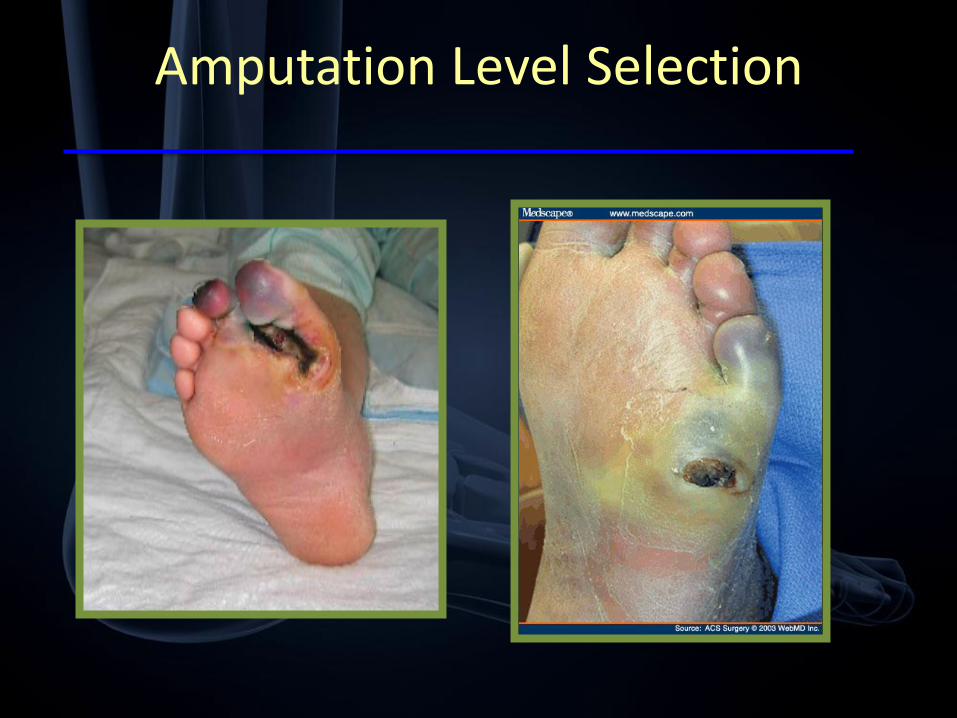
Amputation Level Selection

Mortality Healing
Mobility
Outcome
A Team Decision
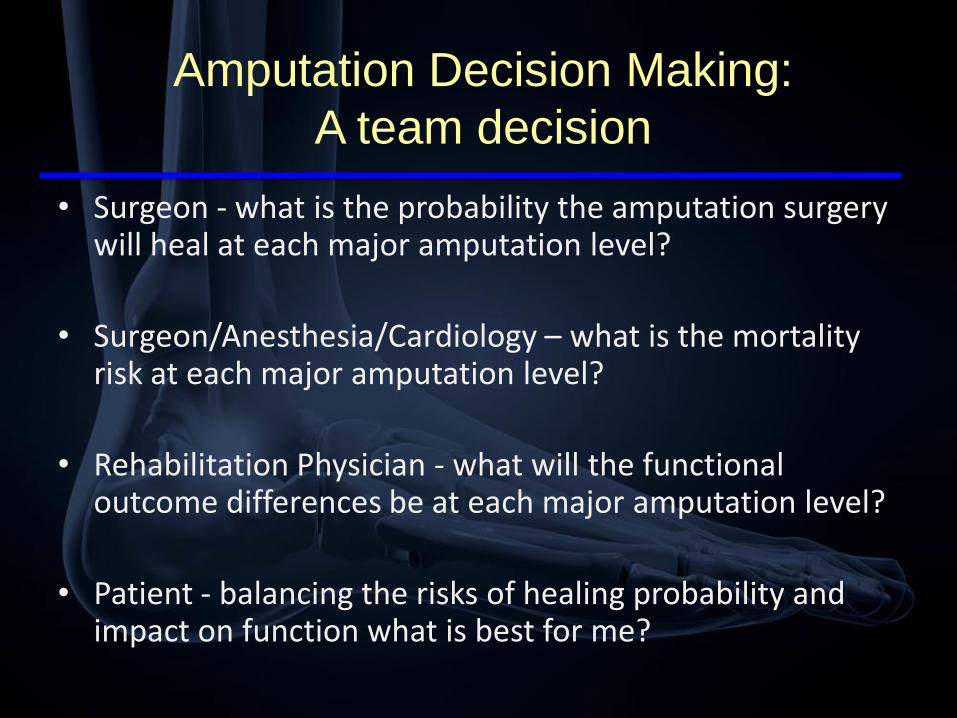
Amputation Decision Making:
A team decision
• Surgeon - what is the probability the amputation surgery will heal at each major amputation level?
• Surgeon/Anesthesia/Cardiology – what is the mortality risk at each major amputation level?
• Rehabilitation Physician - what will the functional outcome differences be at each major amputation level?
• Patient - balancing the risks of healing probability and impact on function what is best for me?
Informed Consent
“Reasonable people need to know their
treatment options, the general risks, benefits,
and probable outcomes of each option, and the
reasons that the physician has recommended a
specific treatment.”
Informed Consent: James Bernat,
Muscle and Nerve, 2001

Mortality
• Mortality Rates / What time period is important?
– Peri-operative (30 d)
– 24 month
– Overall Trajectory
• Effect of amputation level
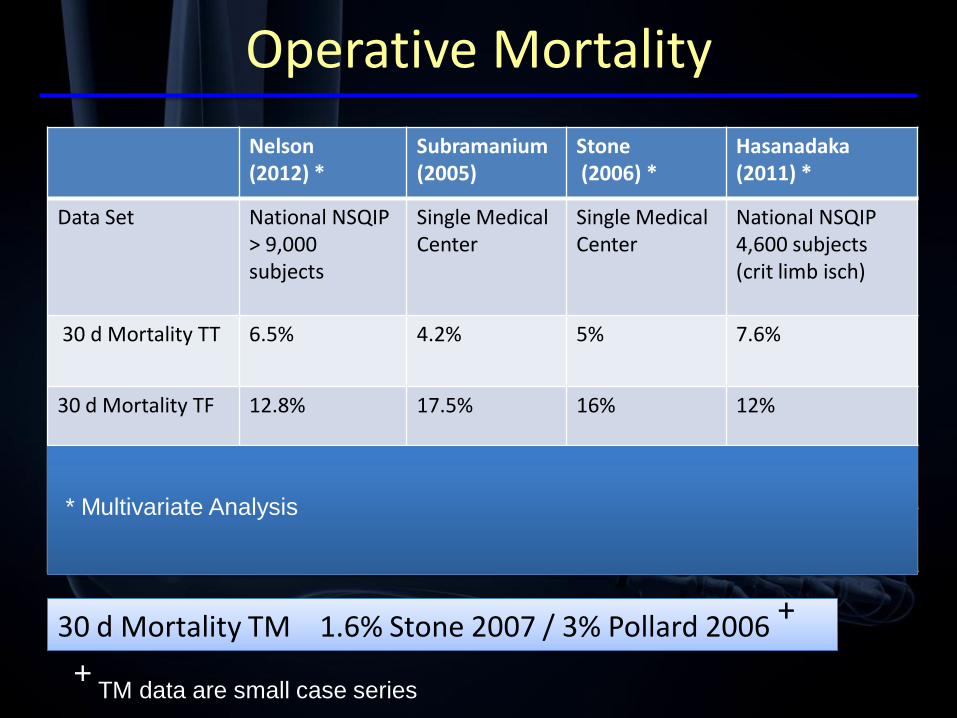
Operative Mortality
Nelson (2012) *
Subramanium(2005)
Stone(2006) *
Hasanadaka(2011) *
Data Set National NSQIP> 9,000 subjects
Single Medical Center
Single Medical Center
National NSQIP4,600 subjects (crit limb isch)
30 d Mortality TT 6.5% 4.2% 5% 7.6%
30 d Mortality TF 12.8% 17.5% 16% 12%
Wound Complications TT
22.7% + _______ 17% # 11.3% #
Wound Complications TF
11.7% + ___ 7% # 7.8% #
30 d Mortality TM 1.6% Stone 2007 / 3% Pollard 2006 +
* Multivariate Analysis
+TM data are small case series
Copyright restrictions may apply.
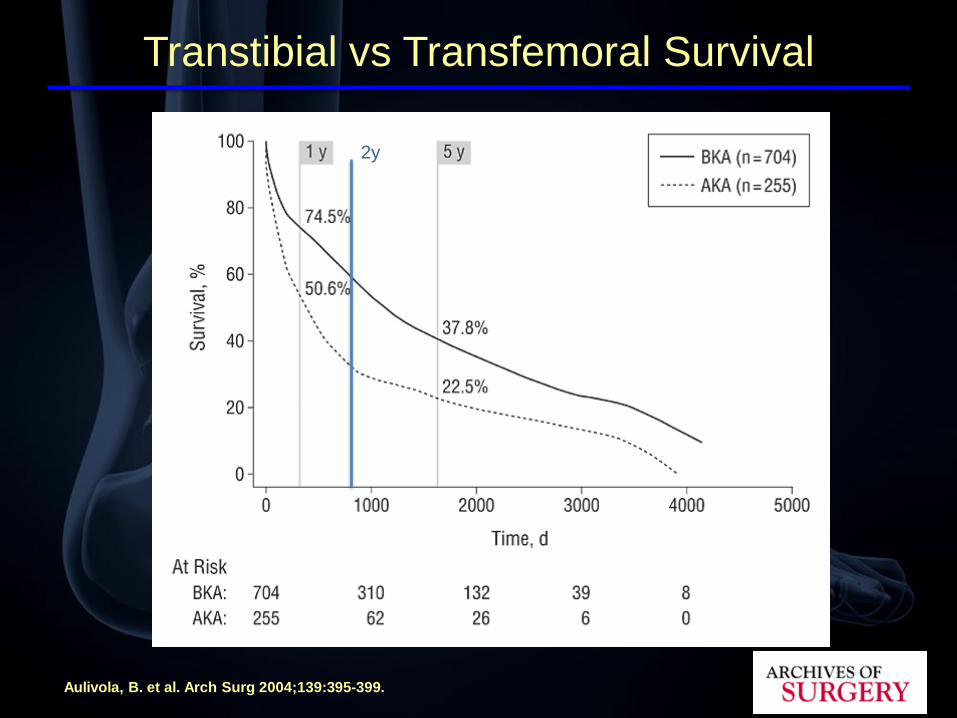
Aulivola, B. et al. Arch Surg 2004;139:395-399.
Transtibial vs Transfemoral Survival
2y

From: Predictors of Healing and Functional Outcome Following Transmetatarsal Amputations
Arch Surg. 2011;146(9):1005-1009. doi:10.1001/archsurg.2011.206
Figure Legend:
Mean survival 16 months
Transmetatarsal Survival
2y
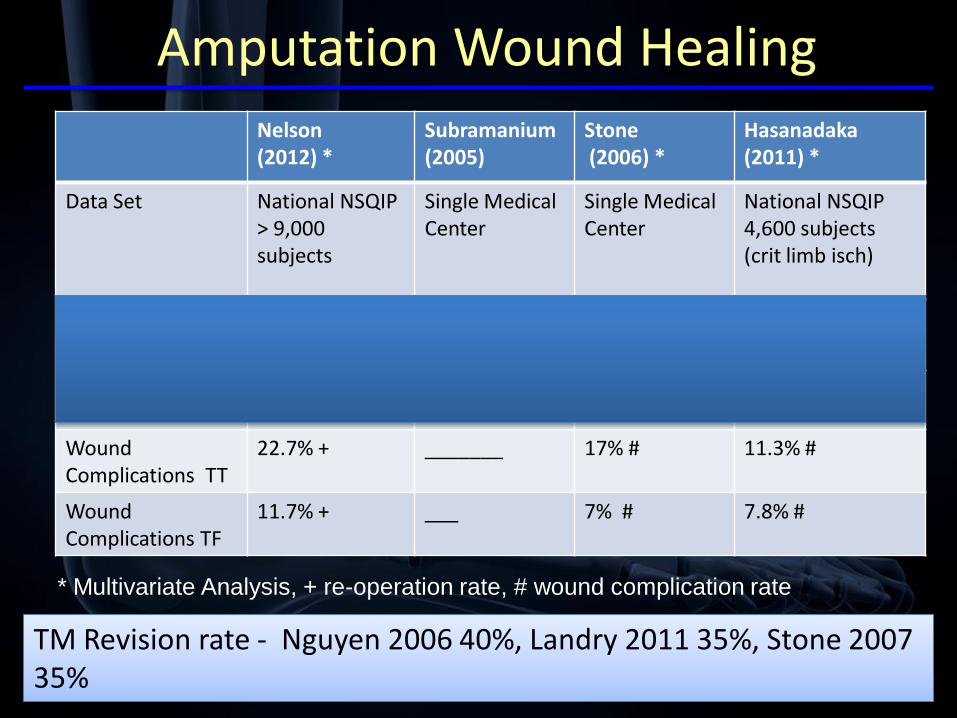
Amputation Wound Healing Nelson (2012) *
Subramanium(2005)
Stone(2006) *
Hasanadaka(2011) *
Data Set National NSQIP> 9,000 subjects
Single Medical Center
Single Medical Center
National NSQIP4,600 subjects (crit limb isch)
30 d Mortality TT 6.5% 4.2% 5% 7.6%
30 d Mortality TF 12.8% 17.5% 16% 12%
Wound Complications TT
22.7% + _______ 17% # 11.3% #
Wound Complications TF
11.7% + ___ 7% # 7.8% #
* Multivariate Analysis, + re-operation rate, # wound complication rate
TM Revision rate - Nguyen 2006 40%, Landry 2011 35%, Stone 2007 35%

Mortality / Wound Healing and Amputation (Summary)
• Mortality rate is extremely high
• Mortality risk increases proximal amputation
• Predictive Models of mortality are being
developed
• Nelson 2012 Surgery.
https://www.surgery.wisc.edu/research/clinical-research-
program/amputation_mortality_predictor.uta
• Wound complications and revisions distal
amputation

The Rehabilitation Assessment and its Contribution to Amputation
Level Recommendations

• Clinical Prediction of Functional Outcome at each major amputation level.
• Rehabilitation treatment recommendations to increase function and prevent deterioration in function.
• Recommendations about best environment of care after discharge from surgery.
Rehabilitation Assessment

Conceptual Approach to Functional Outcome Determination
Amputation Surgery
DeathDelayed Healing
Capacity
Rehabilitation
Outcome
Amputation
Level
Demands

Complications of Diabetes
Define comorbidities
and identify the functional impact
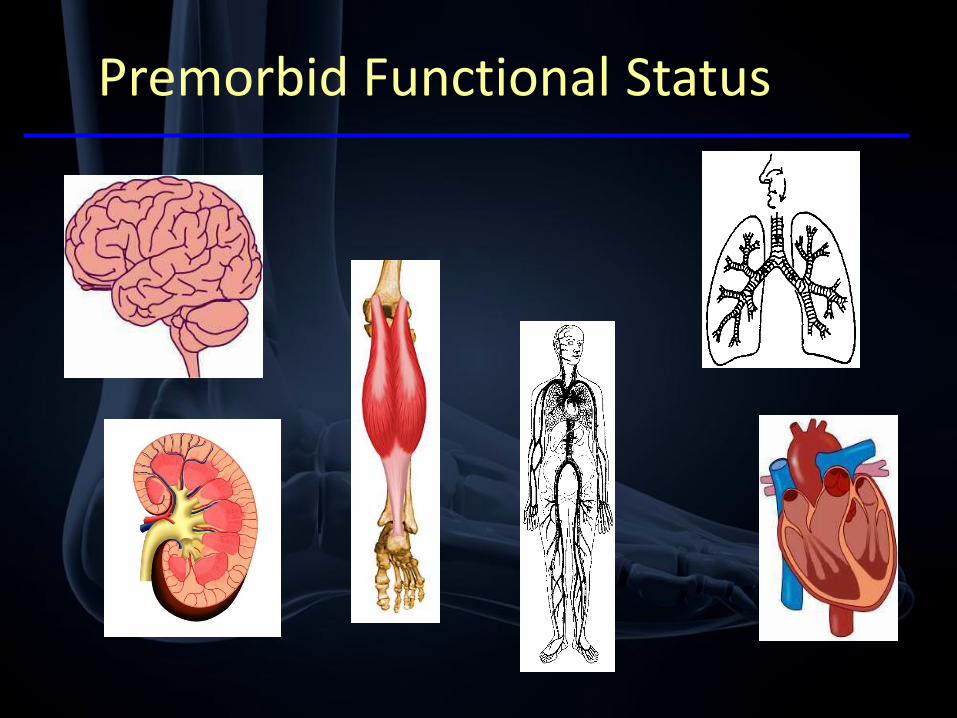
Premorbid Functional Status

ICF – International Classification of Function

Functional demands and benefits of Prosthetic Limb types
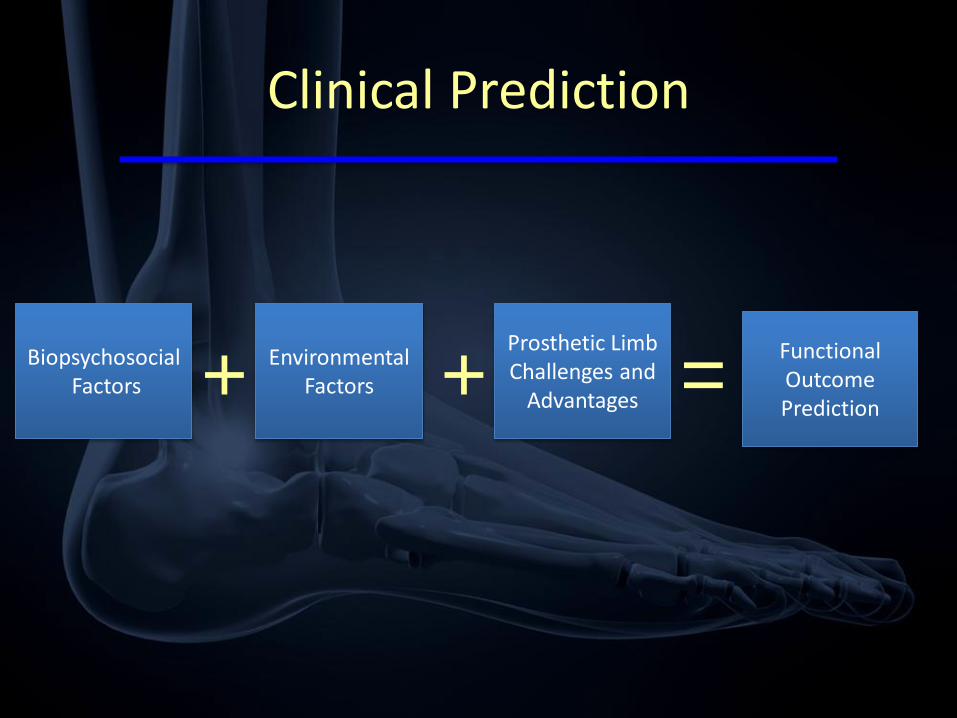
Clinical Prediction
BiopsychosocialFactors
Prosthetic Limb Challenges and
Advantages
Environmental Factors+ + =
Functional Outcome Prediction

Mortality Healing
Mobility
Outcome
A Team Decision

Research into Mobility Outcome Prediction
Co-investigatorsDan Norvell, PhD, Rhonda Williams, PhD, Aaron Turner,
PhD, Kevin Hakimi, MD

Primary Research Aim
• Develop and validate a Patient Specific Prediction Model in dysvascular amputees that would allow the prediction of mobility outcome at 1 year based upon peri-operative factors.
Personalized Medicine
• personalized medicine
• noun
• an approach to the practice of medicine that uses information about a patient‟s unique genetic makeup and environment to customize the patient's medical care to fit his or her individual requirements.

What is the lowest healing probability you would accept to choose a below knee
amputation?
• Healing Probability
– 90%
– 80%
– 70%
– 50%
– 40%
– 30%
– 20%
– 10%
• Operative Mortality
– 0% (1)
– 1%
– 2%
– 3%
– 4%
– 5%
– 10% (2)
Is there a need for a mobility prediction model?

The TT / TF Ratio as an Index of Quality Decision Making
AverageRatio
Min Max Ref
VA 1.5 -1.6 Bates 2006 Cruz 2003
England NHS
.73 1.2 Moxey 2010
US Medicare
.81 Dillingham2005

Variation in Clinical Practice
• 2009 VHA Amputation Surgery Data (Diabetes PVD)
• AK /BK ratio in different VISNs (AK/BK – 1)
• Increase neg more BK, Increase pos more AK
• Obvious differences in how decisions are made
AMPREDICT I
• Prospective Multicenter Trial
• VAPSHCS, Denver VA, Colorado Health Science Center, Harborview Medical Center

Subjects
• L/E amputation secondary to diabetes, PVD
– Incident Major Amputation (TM, TT, TF)
– Cognitive status adequate to participate
– Some ambulatory mobility

Methodology
• Baseline in the peri-operative period
– (immediate preoperative – 6wks postoperative)
• F/U at 6 wks, 4 months, 1 year
Demographic Co-variates
• Age
• Gender
• BMI
• Marital status
• Race
• Employment status
• Education level
• Living status
• Socioeconomic status

Co-Morbidities

Other Health Co-Variates
• Lower extremity arterial reconstruction
• Traumatic brain injury
• Joint replacement
• Hypertension
• Post traumatic stress disorder
• Alcohol consumption / Smoking history
• History of treated anxiety or depression
• Premorbid LCI score
• Self Perceived Health Status

Outcome Measures
• Self Care Status (Groningen Activity Restriction Scale)
• Prosthetic Use
• Satisfaction with Life
• Satisfaction with Mobility
• Mobility (LCI-5)
– Mobility Success
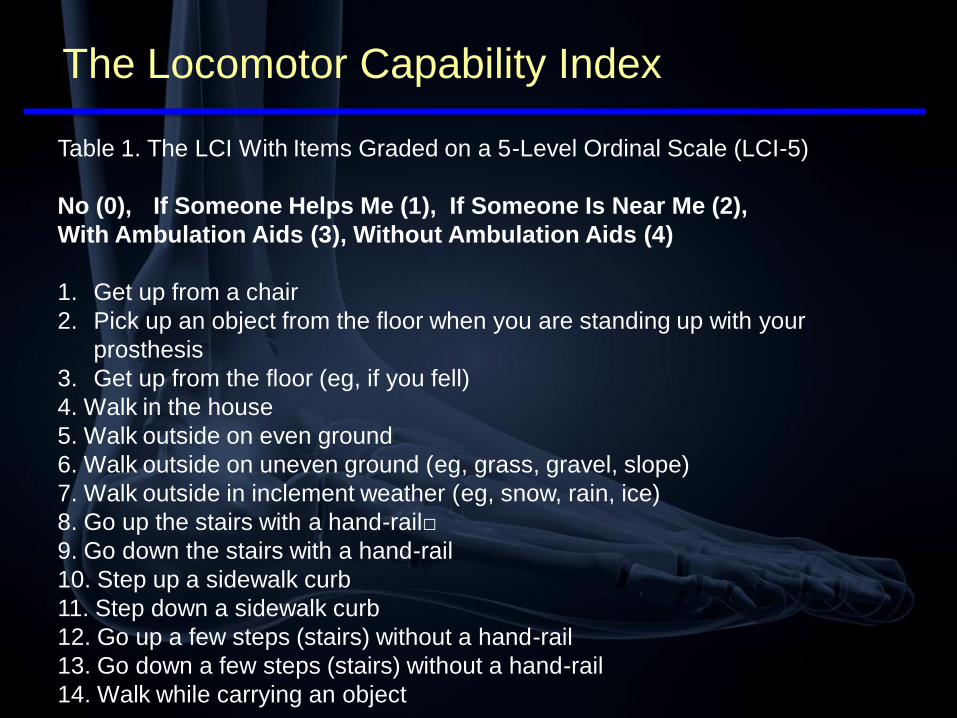
Table 1. The LCI With Items Graded on a 5-Level Ordinal Scale (LCI-5)
No (0), If Someone Helps Me (1), If Someone Is Near Me (2),
With Ambulation Aids (3), Without Ambulation Aids (4)
1. Get up from a chair
2. Pick up an object from the floor when you are standing up with your
prosthesis
3. Get up from the floor (eg, if you fell)
4. Walk in the house
5. Walk outside on even ground
6. Walk outside on uneven ground (eg, grass, gravel, slope)
7. Walk outside in inclement weather (eg, snow, rain, ice)
8. Go up the stairs with a hand-rail□
9. Go down the stairs with a hand-rail
10. Step up a sidewalk curb
11. Step down a sidewalk curb
12. Go up a few steps (stairs) without a hand-rail
13. Go down a few steps (stairs) without a hand-rail
14. Walk while carrying an object
The Locomotor Capability Index

Results
• Screened 239
• Eligible 136 (57%) (prev amp, cog, mob)
• Enrolled 87 (64%)
• Retained 75 (86% of those enrolled)
• Lost
– 8 deaths
– 4 withdrawls
– 1 lost to f/u

Consort Diagram

“Mobility Success” as the Key Outcome Variable
Time
Onset of Injury
Onset of Recovery
Maximal Functional
Restoration

Mobility Successand Satisfaction with Mobility
Risk Factor RD* (95% CI) P-value
Amputation level**
TT .11 (.02, .20) .02
TF -.11 (-.28, .06) .21
Age†
55-64 years
65+ years
-.05 (-.32, .21)
-.47 (-.71, -.24)
.68
<.0001
Anxiety/depression -.24 (-.42, -.06) .01
Self perceived health .16 (-.02, .35) .08
Satisfied with mobility .20 (.03, .37) .02
AMPREDICT I: 12-month mobility success and its association with satisfaction with mobility*Risk differences generated from a negative binomial regression model represent an increase (or decrease if negative) in the success rate relative to reference category
**TM = Reference category
*Risk differences generated from a negative binomial regression model
represent an increase (or decrease if negative) in the success rate relative to
reference category **TM = Reference category
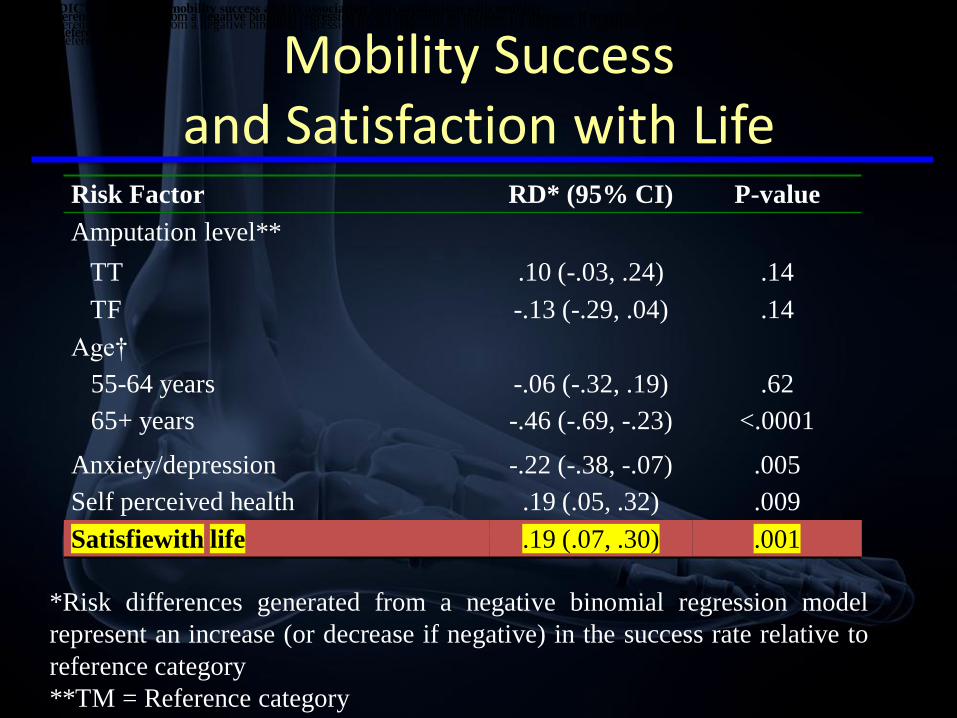
Mobility Success and Satisfaction with Life
Risk Factor RD* (95% CI) P-value
Amputation level**
TT .10 (-.03, .24) .14
TF -.13 (-.29, .04) .14
Age†
55-64 years
65+ years
-.06 (-.32, .19)
-.46 (-.69, -.23)
.62
<.0001
Anxiety/depression -.22 (-.38, -.07) .005
Self perceived health .19 (.05, .32) .009
Satisfiewith life .19 (.07, .30) .001
AMPREDICT I: 12-month mobility success and its association with satisfaction with mobility
*Risk differences generated from a negative binomial regression model represent an increase (or decrease if negative) in the success rate relative to reference category
**TM = Reference category
*Risk differences generated from a negative binomial regression model represent an increase (or decrease if negative) in the success rate relative to reference category
**TM = Reference category
*Risk differences generated from a negative binomial regression model represent an increase (or decrease if negative) in the success rate relative to reference category
**TM = Reference category
*Risk differences generated from a negative binomial regression model
represent an increase (or decrease if negative) in the success rate relative to
reference category
**TM = Reference category
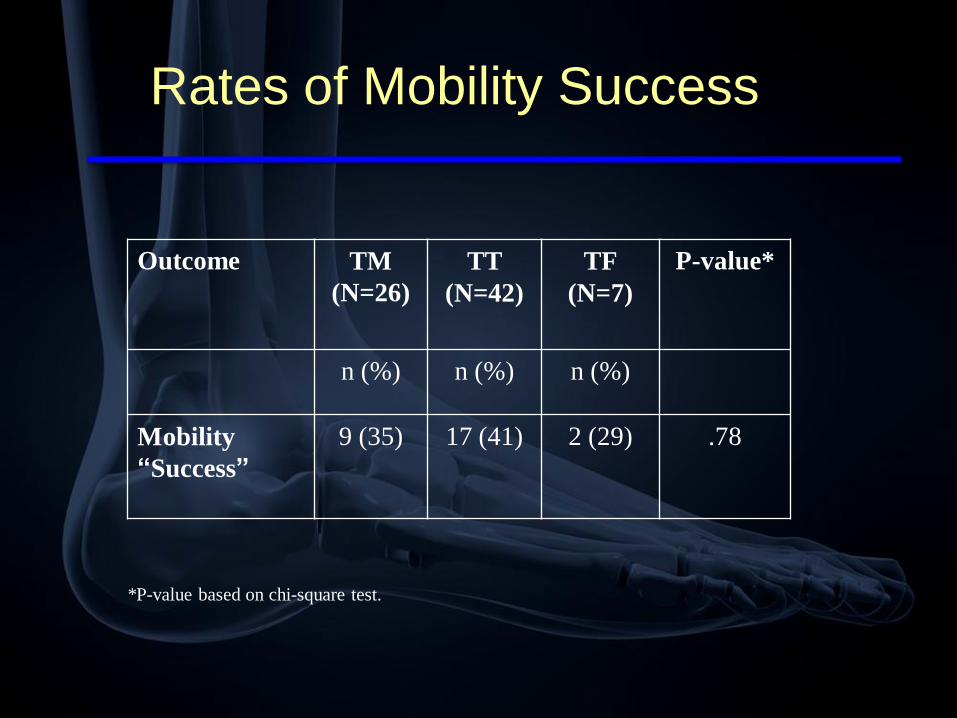
Rates of Mobility Success
Outcome TM
(N=26)
TT
(N=42)
TF
(N=7)
P-value*
n (%) n (%) n (%)
Mobility
“Success”
9 (35) 17 (41) 2 (29) .78
*P-value based on chi-square test.
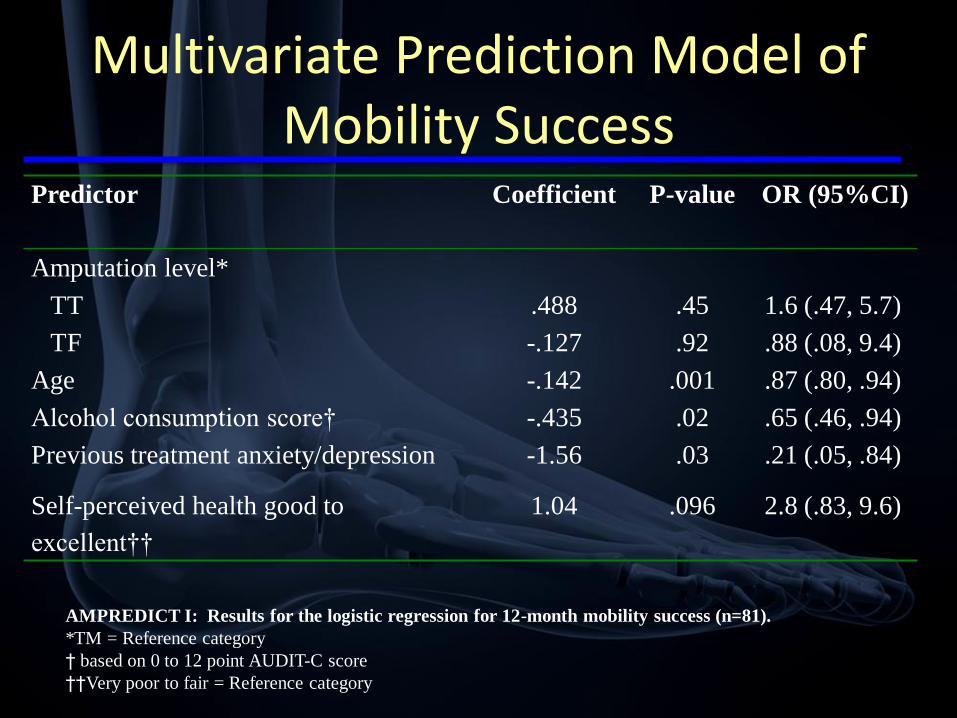
Multivariate Prediction Model of Mobility Success
Predictor Coefficient P-value OR (95%CI)
Amputation level*
TT .488 .45 1.6 (.47, 5.7)
TF -.127 .92 .88 (.08, 9.4)
Age -.142 .001 .87 (.80, .94)
Alcohol consumption score† -.435 .02 .65 (.46, .94)
Previous treatment anxiety/depression -1.56 .03 .21 (.05, .84)
Self-perceived health good to
excellent††
1.04 .096 2.8 (.83, 9.6)
AMPREDICT I: Results for the logistic regression for 12-month mobility success (n=81).
*TM = Reference category
† based on 0 to 12 point AUDIT-C score
††Very poor to fair = Reference category

Predictor Case #1 Case #2 Case #3
Transmetatarsal YES NO NOTranstibial NO YES YES
Transfemoral NO NO NOAge 65 65 65
Alcohol Score 4 2 0Previous treatment
for anxiety or depression NO NO NO
Self-perceived health good to
excellent YES YES YESPredicted
Probability of Mobility Success:
15.5% 59.2% 80.1%
*Predicted probabilities are based on regression coefficients from the logistic regression model.
AMPREDICT as a Clinical Tool
Area Under Receiver Operating Curve = .86
This demonstrates Good to Excellent discriminative ability for the mobility outcome.
AMPREDICT
• Conclusions
– Predictive Model has very good characteristics
– Important potential clinical utility
– Mobility success is associated with satisfaction with
mobility AND satisfaction with life.

AMPREDICT the next Steps
• Newly Funded 4 year Prospective Multicenter Grant
• Validate Model
– Geographical and Temporal Validation
– Prospective Multicenter trial
• Dallas
• Houston
• Portland
• VAPSHCS

Challenges of Mobility Outcome Assessment
• LCI – 5
• Mobility Success
• Single item mobility Outcome

A Single Item Mobility Measure with Improved Utility
How would you rate your current level of mobility? (pick one of the following that most
closely describes you).
6 I am able to walk in the community, with no ambulation aids, unlimited distances .
5 I am able to walk in the community, with no ambulation aids, limited distances .
4 I am able to walk in the community with ambulation aids .
3I am able to walk inside my house with ambulation aids and use a wheelchair for
community ambulation.
2I am not able to walk but could get around my house and the community with a
wheelchair.
1I am not able to walk but could get around my house with a wheelchair but not get
out into the community.
0I am housebound and mostly bedridden and required help for all household
transfers and mobility.
Summary
• Physiatrists have an important role to play in the team decision about amputation level selection
• Prediction of mobility outcome is our primary contribution at each major amputation level
• Currently the prediction is based upon clinical evaluation– Knowledge of the advantages and limitations of prosthetic
componentry
– Knowledge of the requirements necessary to utilize prostheses at each major amputation level
– A biopsychosocial assessment of the patient noting limitations and strengths
– From the ICF model - a knowledge of “environmental factors”
What does the future hold?

The Future
• The provision of personalized health care
• Valid, sensitive,specific prediction models on your smart phone.
– Predict mortality
– Predict wound healing
– Predict functional mobility
• “informed consent” that assists the patient and provider in making the best decision that incorporates the patients needs and priorities
Thank-you


Figure 1. The „Physical Activity for People with a Disability‟ model based on the
ICF (Adapted from Van der Ploeg et al. [18]).

Change in LCI mobility scores from pre-morbid function to 12
months post amputation.